25
Irish TIMES Built Environment Sector Overview Document DD1.5
| Date post: | 19-Apr-2018 |
| Category: |
Documents |
| Upload: | nguyenhanh |
| View: | 216 times |
| Download: | 2 times |

Irish TIMES
Built Environment Sector Overview
Document DD1.5

Contents
1 TIMES .......................................................................................................................................................................3
1.1 Tool overview ............................................................................................................................................3
1.1.1 Model structure ....................................................................................................................................4
1.1.2 Inputs .......................................................................................................................................................5
1.1.3 Functionality .........................................................................................................................................7
1.1.4 Outputs ....................................................................................................................................................8
1.1.5 Strengths ................................................................................................................................................9
1.1.6 Limitations .............................................................................................................................................9
2 Built Environment as currently is in Irish TIMES .................................................................................. 11
2.1 Overview................................................................................................................................................... 11
2.2 Residential Sector .................................................................................................................................. 11
2.2.1 Residential Energy Demands........................................................................................................ 11
2.2.2 Residential Demand Drivers ......................................................................................................... 12
2.2.3 Residential Technologies ............................................................................................................... 14
2.3 Services Sector ........................................................................................................................................ 16
2.3.1 Commercial Energy Demands ...................................................................................................... 16
2.3.2 Commercial Demand Drivers ....................................................................................................... 16
2.3.3 Commercial Technologies ............................................................................................................. 17

1 TIMES
The TIMES model is a linear optimisation model with an objective function to minimise total
system cost (maximizes the total discounted surplus) subject to imposed constraints.
Mathematical equations describe the relationships and interaction between the many
technologies, drivers and commodities in TIMES. While it is tempting to think of the TIMES model
as a simple ‘merit type’ model that chooses technologies simply from the least expensive to the
most expensive to meet certain demands this is an oversimplification that leads to an incorrect
understanding of the model value and dynamics. The richness of the TIMES model is that it
optimises across all sectors of the energy system for the full horizon and thus captures the
interaction between sectors. The model simultaneously solves for the least cost solution subject
to emission constraints, resource potentials, technology costs, technology activity and capability
to meet individual energy service demands. In this way the TIMES model allows technologies to
compete both horizontally across different energy sectors and vertically through the time
horizon of the model.
1.1 Overview of TIMES Modelling Tool
The TIMES (The Integrated MARKAL-EFOM System) model generator was developed as part of
the IEA-ETSAP (Energy Technology Systems Analysis Program), an international community
which uses long term energy scenarios to conduct in-depth energy and environmental analyses
(Loulou et al., 2004). The TIMES software combines two different, but complementary,
systematic approaches to modelling energy: a technical engineering approach and an economic
approach (Gargiulo and Gallachoir, 2013). TIMES is a technology rich, bottom-up model, which
uses linear-programming to produce a least-cost energy system, optimized according to a
number of user constraints, over medium to long-term time horizons. In a nutshell, TIMES is used
for, “the exploration of possible energy futures based on contrasted scenarios” (Loulou et al.,
2005).
The Irish TIMES model was originally extracted from the Pan European TIMES (PET) model and
then updated with improved data based on much extensive local knowledge (Ó Gallachóir et al.,
2012). The Pan European Times (PET) Model is a multi-regional TIMES model of Europe built
comprised of 36 European regions (EU27, Iceland, Norway, Switzerland, and six Balkan
countries) (Gargiulo and Gallachoir, 2013). The PET model from which the Ireland sub-model
was taken was calibrated with 2005 Eurostat as a base year. The Irish TIMES project has focused
on the Irish energy system and the potential for Ireland to make large cuts in CO2 emissions
within the modelled time horizon of 2005-2050 (Ó Gallachóir et al., 2012).

1.1.1 Model structure
The TIMES model encompasses all the steps from primary resources through the chain of
processes that transform, transport, distribute and convert energy into the supply of energy
services demanded by energy consumers (Loulou et al., 2005). On the energy supply-side, it
comprises fuel mining, primary and secondary production, and exogenous import and export.
The “agents” of the energy supply-side are the “producers”. Through various energy carriers,
energy is delivered to the demand-side, which is structured sectorally into residential,
commercial, agricultural, transport and industrial sectors. The “agents” of the energy demand-
side are the “consumers”. The mathematical, economic and engineering relationships between
these energy “producers” and “consumers” is the basis for the TIMES model.
All TIMES models are constructed from three basic entities (Loulou et al., 2005):
Technologies
Technologies (also called processes) are representations of physical devices that transform
commodities into other commodities. Processes may be primary sources of commodities (e.g.
mining processes, import processes), or transformation activities such as conversion plants that
produce electricity, energy-processing plants such as refineries, end-use demand devices such as
cars and heating systems, etc.
Commodities
Commodities are energy carriers, energy services, materials, monetary flows, and emissions; a
commodity is either produced or consumed by some technology.
Commodity flows
Commodity flows are the links between processes and commodities. A flow is of the same nature
as a commodity but is attached to a particular process, and represents one input or one output of
that process.
These three entities are used to build an energy system that characterizes the country or region
in question. All TIMES models have a reference energy system, which is a basic model of the
energy system before it is substantially changed either for a particular region or for a particular
scenario. The Irish TIMES reference energy system, which represents the Irish energy system in
2005 and its possible long-term evolution (Ó Gallachóir et al., 2012) is shown in Figure 1. The
blocks are the technologies, the writing outside the blocks (e.g. OIL, GAS, COA, ELC) are the
commodities and the lines connecting the blocks are the commodity flows.

Figure 1: Schematic of processes and commodities in TIMES; source: (Ó Gallachóir et al., 2012)
1.1.2 Inputs
There are a large number of exogenous inputs to the TIMES model. Many of these are
characterizations of technology or commodity entities. There are also a number of endogenous
inputs that are calculated by the TIMES and which are used in the final calculations for the model
outputs. These inputs are described below.
Technologies
In the Irish TIMES model, there are approximately 1600 technologies for the supply-side and
demand-side sectors of the economy (Ó Gallachóir et al., 2012). Each of these technologies has
detailed technical parameters that can be changed and set by the user; some of these parameters
include technology efficiency (e.g. heat rates, learning curves), technology lifetime, emission
factors (CO2 and non-CO2) and availability. The data sources for most of these technologies are
the IEA databases that were used to build the reference energy system. For Irish TIMES, the
technologies parameters were all reviewed and revised, as appropriate, for Irish conditions. Each
of these technologies also has associated costs (e.g. capital costs, O&M costs, discount rates). In
most instances, these costs are input in the form of curves, i.e. as elasticities and as such, they are
described as demand curves in that they can meet varying levels of energy demand at varying
levels of cost (Loulou et al., 2005).

Resource potential and Prices
The resource potential applies mostly to commodities and supply curves, i.e. what is the cost of
each commodity at various levels of supply. The resource potential also applies to technologies,
particular renewable energy technologies and their resource. For example, there is a limit to the
amount of onshore wind power that can be constructed in Ireland. The commodity supply curves
and renewable resource for Irish TIMES have been carefully scrutinized and updated based on
most recently available data, local knowledge, policies (e.g. subsidies, targets) or known technical
limits (Ó Gallachóir et al., 2012).
Projections for future fuel prices for key fuel commodities (e.g. coal, oil and gas) are taken from
IEA world energy outlook (IEA, 2012).
Given the importance of renewable energy for the achievement of mitigation targets, Ireland’s
energy potentials and costs are based on the most recently available data. The total resource
capacity limit for domestic bioenergy has been set at 1,964 ktoe for the year 2020 and at 3,747 ktoe
by 2050, based on the estimates from SEAI, Smyth et al., 2010 and Coford. The upper capacity limit
for other renewable resources such onshore and offshore wind energy, ocean and hydro energy are
summarized in Ó Gallachóir et al., 2013 and Chiodi et al., 2013. The use of geothermal energy in
Ireland is limited only to small installations in the residential and services sector mostly for space
and water heating purposes. Because solar and geothermal energy contribute marginally to
scenarios outputs, no maximum potentials have been provided in the model.
The cost assumptions for domestic bioenergy commodities are based on McEniry et al., 2011 for
biogas from grass, Kent et al. 2011 for forestry, Clancy D. et al. 2008 for willow and miscanthus crops
and Clancy M. et al. 2013 for wheat crops. Cost estimates on bioenergy imports are based on an SEAI
report by Clancy M. et al., 2013. Cost assumptions for bulk renewable energy technologies were
recently updated based on studies by DECC (Parsons Brinckerhoff 2011 and Radov D et al., 2012)
(for wind energy) and Parsons Brinckerhoff 2012 (for solar). Other model reviews focused on
conventional generation technologies of heating technologies are based on the values from (Parsons
Brinckerhoff 2009).
Electricity prices are calculated endogenously in the model.
Macro-economic drivers
Key data behind the Irish TIMES model projections are the macro-economic projections of GDP,
GNP, private income, population and number of households that is generated as the output of the
Economic and Social Research Institute (ESRI) long-term macro-economic model. These
parameters are used to generate energy service demand parameters, which are the key
quantities that the Irish TIMES model must produce an energy system to satisfy. In total, there
are 60 different types of energy services for the transport, residential, agricultural, commercial,
industry and non-energy sectors. Some examples include residential space heating (PJ),
commercial refrigeration (PJ), industry iron & steel (Mtonnes), transport car distance
(Mpassenger km) and transport road freight (Mtonne km). For each modelling period out to
2050, energy service demand parameters are input and the Irish TIMES model must meet these
parameters at least cost.
Scenarios
The reference energy system includes a reference energy scenario, which is the scenario against
which the results from other scenarios are checked. The reference scenario is generated by
running the model in the absence of any policy constraints. It will not normally be completely
aligned with national energy forecasts that are generated by simulating what the future energy
use is anticipated to be, mainly because TIMES optimizes the energy systems providing a least
cost solution. When a (single of many) policy constraint is imposed on the model (e.g. minimum
share of renewable energy, maximum amount of GHG emissions or minimum level of energy
security), the model generates a different least cost energy system. When the results are
compared with those from the reference scenario, the different technology choices can be
identified that deliver the policy constraint at least cost (Ó Gallachóir et al., 2012).
In the Irish TIMES model, there are two key modelling time-horizons: 2005-2020 and 2005-
2050.
1.1.3 Functionality
Once all the inputs, constraints and scenarios have been put in place, the model will attempt to
solve and determine the energy system that meets the energy service demands over the entire
time horizon at least cost. It does this by simultaneously making equipment investment decisions
and operating, primary energy supply, and energy trade decisions, by region. TIMES assumes
perfect foresight, which is to say that all investment decisions are made in each period with full
knowledge of future events. It optimizes horizontally (across all sectors) and vertically (across all
time periods for which the limit is imposed).
The results will be the optimal mix of technologies and fuels at each period, together with the
associated emissions to meet the demand. The model configures the production and
consumption of commodities (i.e. fuels, materials, and energy services) and their prices; when
the model matches supply with demand, i.e. energy producers with energy consumers, it is said
to be in equilibrium. Mathematically, this means that model maximizes the producer and
consumer surplus. The model is set up such that the price of producing a commodity affects the
demand for that commodity, while at the same time the demand affects the commodity’s price. A
market is said to have reached an equilibrium at prices p and quantities q when no consumer
wishes to purchase less than q and no producer wishes to produce more than q at price p. When

all markets are in equilibrium the total economic surplus is maximized (i.e. the sum of producers’
and consumers’ surpluses)(Loulou et al., 2005). This is represented graphically in Figure 2.
Figure 2: Achieving market equilibrium in TIMES; source: (Loulou et al., 2005)
1.1.4 Outputs
The main TIMES model output is an energy system, which services the end-use energy service
demands at lowest cost while adhering to the various constraints (e.g 80% emissions reduction,
40% renewable electricity penetration). In the first instance, the TIMES model provides an
answer to the question: is the target feasible? If an energy system is possible, it can then be
examined, at what cost? The model outputs are energy flows, energy commodity prices, GHG
emissions, capacities of technologies, energy costs and marginal emissions abatement costs.
Figure 3 has a schematic of the TIMES model along with outgoing white block arrows that show
the model outputs.

Figure 3: Schematic of TIMES inputs and outputs; source: (Remne, 2007)
1.1.5 Strengths
Something of the usefulness (and strength) of TIMES can be gleaned from its popularity: it is
currently in use in over 70 countries. This is also strength of the model since it has a world-wide
community engaged in maintaining and updating the modelling tool. The main “selling point” of
TIMES is that it combines a detailed technology rich database with an economically optimizing
solver. It is able to generate robust energy policy scenarios over long time horizons and it is able
to offer strategic insight into long-term policy formation. This is especially important for the
energy sector, which has such large capital investments with long project lifetimes.
The challenge of decarbonizing the energy system is an enormous and expensive one so the
insight that TIMES gives is unique.
It produces energy pathways over multiple time slices for a long-term time horizon and the
solution in the model is in terms of technology choice; it also provides indicative results for the
carbon price required to achieve certain reductions which can in turn be useful to inform policy
design.
1.1.6 Limitations
Like all energy models, TIMES has a number of limitations. In some instances these are simply
limitations born of the structure of the model; they are inevitable based on the way the model is
built. In other instances, they could be considered weaknesses and in these cases, work is on
going to make improvements:

Macro-economic assumptions: This is a limitation of the model. The results of the scenarios are
tied to the assumption and results of the macro-economic model, which by themselves are
inherently uncertain. While scenario analysis, by its nature, tries to counteract this uncertainty
by producing a range of results, this uncertainty is nevertheless present.
Limited macro-economic feedback: This is a current weakness in the Irish TIMES model: there is
currently no demand response between the macro-economic drivers and the output energy
system. However, work is ongoing in UCC to improve this feedback response.
Time resolution: For the electricity sector, there are 12 time slices (seasonal, day, night and peak);
these are inadequate to capture daily supply and demand curves. For the rest of the TIMES
system, there are only seasonal time slices. This is a limitation of the model. It would become
computationally unwieldy if the model had to make decade long decision as well as hourly
decisions. A working solution to this shortcoming is model soft-linking to more specialized
energy models which has been pioneered by UCC.
Behaviour: A further limitation of the TIMES model is the low capacity to simulate behavioural
aspects. This is a limitation of most energy models, in that consumer behaviours such as the
rebound effect, which are known to be significant in reality, are ignored in energy system
modelling.

2 Built Environment as currently is in Irish Times
2.1 Overview
The Built Environment is split into two subsectors in the TIMES model: residential buildings and
the services sector. Of the two the residential sector is considered in more detail. Note that for all
sectors of the economy in TIMES, including residential and services sector which make up the
built environment, all electrical loads, including plug loads (e.g electric kitchen appliances and
electric office equipment) and also electric heating and cooling loads are accounted for in the
electricity sector.
The commercial and public services sector1 (hereafter referred to as the services sector) is the
most heterogeneous of all sectors of the economy and includes both commercial service activities
(including banking, cinemas, hotels, retail outlets, swimming pools, etc.) and public services
(universities, hospitals, local authorities, Government departments, etc.) A summary of all sectors
of the economy (categorised according to the international NACE code) is contained in Appendix
1, where the service sector comprises sections G – U (NACE codes 45 – 99). The predominant
point of energy consumption within this sector is energy use in buildings (for space heating,
lighting and water heating), the balance being mainly represented by certain municipal and civic
facilities.
2.2 Residential Sector
2.2.1 Residential Energy Demands
A list of the residential energy demands contained within the TIMES model is given in Table 1
below. There are two main divisions of residential energy demands in TIMES based on the
drivers for energy consumption. Firstly there are space and water heating and cooling which are
driven by the numbers of dwellings and an exogenously calculated value of PJ/dwelling/annum
for each energy service demand. Secondly there are household appliances and other electric
demands, which are driven by GNP along with individual demand elasticities.
1The services sector is also sometimes referred to as the tertiary sector with the primary sectors being agriculture and
resource extraction and secondary referring to manufacturing.

Description Code Drivers
Space Heat.Multi.All.Existing. RHME
Number of Dwellings & Energy Requirement per Dwelling
Space Heat.Multi.All.New RHMN
Space Heat.Single.Rural.Ex RHRE
Space Heat.Single.Rural.New RHRN
Space Heat.Single.Urban.Ex RHUE
Space Heat.Single.Urban.New RHUN
Water Heat.Multi.All.Existing. RWME
Water Heat.Multi.All.New RWMN
Water Heat.Single.Rural.Ex RWRE
Water Heat.Single.Rural.New RWRN
Water Heat.Single.Urban.Ex RWUE
Water Heat.Single.Urban.New RWUN
Clothes Drying RCDR
GNP
Cooking RCOK
Clothes Washing RCWA
Dish Washing RDWA
Lighting RLIG
Other Electric ROEL
Refrigeration RREF Table 1: Residential Energy Demands
2.2.2 Residential Demand Drivers
Household Numbers
In Irish TIMES household projection numbers come from ESRI projections. These figures are then
broken down into either Rural, Urban, or Multi (Apartments) and again into Existing and New
dwellings. The current model values for each type are shown in Table 2.2
Existing Rural Existing Urban Existing Multi New Rural New Urban New Multi
2005 521 749 147 0 0 0
2006 515 746 146 26 26 35
2010 487 732 142 83 83 110
2015 451 714 136 113 113 150
2020 414 696 129 161 161 214
2 This will be updated based on the revised ESRI macro-economic forecasts.

2025 374 676 123 210 210 280
2030 332 655 116 301 301 402
2035 307 630 82 425 425 567
2040 253 602 73 486 486 648
2045 196 574 64 542 542 723
2050 196 574 64 592 592 789
Table 2: Number of household projections
Energy Per Dwelling
Each dwelling type has a space heat demand, water heat demand and a typical floor area as
shown in Table 3. For ease these values are shown in PJ and kWh/Dwelling.
Rural Urban Multiple
Floor Area M2 131 121 48
Energy Required for Heating
GJ/m2 0.3600 0.3600 0.3600
kWh/m2 100 100 100
Heating Demand (PJ/1000 Dwelling) 0.0471 0.0435 0.0172
(kWh/Dwelling) 13,077
12,072
4,769
Hot Water Demand
(PJ/1000 Dwelling/yr) 0.0144 0.0135 0.0053
(kWh/Dwelling/yr) 3,992
3,763
1,479
Table 3: Energy Demand per dwelling for space heating and cooling and water heating.
GNP
Projections of GNP are taken from the ESRI Medium term review 2013, recovery scenario.
Elasticities
Irish TIMES can be operated with or without elastic demands to incorporate consumer response
to price signals (Gargiulo et al., 2012).

2.2.3 Residential Technologies
Overview
There are currently 484 technology options available in the Irish TIMES residential sector alone.
A full list of these technologies is provided in Appendix A and also in the accompanying Excel
sheet.
Inputs
Each technology has an associated investment cost as well as fixed and variable operational and
maintenance costs. Fuel costs are also accounted for but these are endogenous to the model and
are not classed as inputs. The technology costs can be arranged in order to give a cost curve of
various technology options which can help identify which technologies will be chosen before
others in the times model. A sample of such a cost curve for select technologies is given in Figure
4 below. Other typical inputs for each technology include fuel type and efficiency.

0
200
400
600
800
1000
1200
1400
1600
Nat
ura
l ga
s st
ove
n
ew
LPG
sto
ve n
ew
Bio
mas
s st
ove
-n
ew
Oil
bo
iler
ne
w
Nat
ura
l ga
s b
oile
r n
ew
LPG
bo
iler
-n
ew
Wo
od
Fir
ep
lace
ne
w
LPG
bo
iler.
He
atH
otw
ate
r n
ew
Nat
ura
l ga
s b
oile
r.H
eat
Ho
twat
er
ne
w
Bio
die
sel B
oile
r.H
eat
Ho
twat
er
-n
ew
Ele
ctri
c ra
dia
tors
ne
w
Nat
ura
l ga
s b
oile
r co
nd
en
sin
g n
ew
Nat
ura
l ga
s b
oile
r co
nd
en
sin
g.H
eat
Ho
twat
er
ne
w
Wo
od
-pe
llets
bo
iler.
He
atH
otw
ate
r n
ew
Air
he
at p
um
p w
ith
nat
ura
l ga
s b
oile
r.H
eat
Co
ol n
ew
Air
he
at p
um
p w
ith
LP
G b
oile
r.H
eat
Co
ol n
ew
Air
he
at p
um
p w
ith
ele
ctri
c b
oile
r n
ew
Air
he
at p
um
p w
ith
ele
ctri
c b
oile
r.H
eat
Co
ol n
ew
Gro
un
d h
eat
pu
mp
wit
h e
lect
ric
bo
iler.
He
atC
oo
l n
ew
Ad
v A
ir h
eat
pu
mp
wit
h e
lect
ric
bo
iler.
He
atC
oo
l n
ew
Ad
v A
ir h
eat
pu
mp
wit
h e
lect
ric
bo
iler
ne
w
€/k
W
Investment Cost FixO&M Cost
Figure 4: Cost curve for select residential technologies
Outputs
The outputs from the residential model include the list of selected technology options in each
time period for the given constraints; the associated cost of investment in this suite of
technologies; the resulting fuel costs, which are calculated endogenously within the model and
are an outputs rather than inputs; The results can distinguish between new and existing
dwellings as well as ETS (i.e. electric) and non-ETS (i.e. non electric) energy demands

2.3 Services Sector
2.3.1 Services Sector Energy Demands
The commercial and public services sector3 (hereafter referred to as the services sector) is the
most heterogeneous of all sectors of the economy and includes both commercial service activities
(banking, cinemas, hotels, retail outlets, swimming pools, etc.) and public services (universities,
hospitals, local authorities, Government departments, etc. Buildings are the predominant point of
energy consumption (for space heating, lighting and water heating) within this sector, the
balance being mainly represented by certain municipal and civic facilities. Within the Irish TIMES
model the sector is currently modelled at a high, aggregate level, and has not been disaggregated
to the level of individual NACE categories. For space heating and cooling and water heating the
model considers two building categories, large and small. The remaining energy demands are
aggregated for the sector as a whole. The full list of energy demands is shown in Table 4.
Description Code Driver
Commercial Space Heat Small Existing CHSE
GVA in Commercial Sector
Commercial Space Heat Large Existing CHLE
Commercial Space Cool Small Existing CCSE
Commercial Space Cool Large Existing CCLE
Commercial Water Heat Small Existing CWSE
Commercial Water Heat Large Existing CWLE
Commercial Lighting Existing CLIG
Commercial Cooking Existing CCOK
Commercial Refrigeration Existing CREF
Commercial Public Lighting Existing CPLI
Commercial Other Electric Existing COEL
Commercial Other Energy Existing COEN Table 4: Energy Demands in the Commercial Sector
2.3.2 Services Sector Demand Drivers
All energy demands in the commercial sector in Irish TIMES are driven by growth, positive or
negative, in the Gross Value Added for the commercial sector, as per the latest ESRI projections.
For each energy demand the driver is multiplied by a demand elasticity, as for the elasticities in
the residential sector
3The services sector is also sometimes referred to as the tertiary sector with the primary sectors being agriculture and
resource extraction and secondary referring to manufacturing.

2.3.3 Services Sector Technologies
Overview
There are currently 186 technology options available in the Irish TIMES to satisfy the commercial
sector energy demands. A full list of these technologies is provided the accompanying excel
spreadsheet..[ Built Environment Overview.xls]
Outputs
As for the Residential sector, results in the Services sector can be disaggregated by individual
energy demands (commercial space heat small existing etc) and also by energy demand which
falls in the ETS and Non-ETS sectors.
References
Gargiulo M., Chiodi A., Deane P., Ó Gallachóir B. Impact of economic recession on the costs of
climate mitigation. In proceedings of: 12th IAEE European Energy Conference, Energy Challenge
and Environmental Sustainability, 9-12 September, Venice, Italy.
Gargiulo, M., Gallachoir, B.O., 2013. Long-term energy models: Principles, characteristics, focus,
and limitations. Wiley Interdisciplinary Reviews: Energy and Environment 2, 158–177.
IEA, 2009. World Energy Outlook 2009 1–698.
Loulou, R., Goldstein, G., Noble, K., 2004. Documentation for the MARKAL Family of Models.
ETSAP.
Loulou, R., Remne, U., Kanudia, A., Lehtila, A., Goldstein, G., 2005. Documentation for the TIMES
Model - PART I 1–78.
Ó Gallachóir, B.P., Chiodi, A., Gargiulo, M., Lavigne, D., Rout, U.K., 2012. Irish TIMES Energy
Systems Model (No. 24). EPA.
Remne, U., 2007. Overview of TIMES: Parameters, primal variables and equations . Presented at
the IEA ETSAP Workshop, Brasilia.
Chiodi A., Gargiulo M., Rogan F., Deane J.P., Lavigne D., Rout U.K. and Ó Gallachóir B.P. 2013
Modelling the impacts of challenging 2050 European climate mitigation targets on Ireland's energy
system Energy Policy Vol 53 pages 169 – 189
Clancy D, Breen J, Butler AM, Thorne F. The economic viability of biomass crops versus conventional
agricultural systems and its potential impact on farm incomes in Ireland. 107th EAAE Seminar
"Modelling of Agricultural and Rural Development Policies". January 29th-February 1st, Sevilla,
Spain 2008.
Clancy M, Bates J, Barker N, Edberg O, Fitzgerald J, Narkeviciute R, et al. Bioenergy Supply Curves for
Ireland 2010 – 2030. . Version 1.0 ed: SEAI & AEA; 2012.
Kent T, Kofman PD, Coates E. Harvesting wood for energy Cost-effective woodfuel supply chains in
Irish forestry. Available at:
<http://www.coford.ie/media/coford/content/publications/projectreports/Harvesting_Wood_low_
res_for_web.pdf>. Dublin, Ireland: Coford; 2011.
Howes P, Bates J, Landy M, O’Brien S, Herbert R, Matthews R, et al. UK and Global bioenergy resource.
Report to DECC. AEA; 2011.

McEniry J, O'Kiely P, Crosson P, Groom E, Murphy JD. The effect of feedstock cost on biofuel cost as
exemplified by biomethane production from grass silage. Biofuels, Bioproducts and Biorefining.
2011;5(6):670-82.
Ó Gallachóir B.P., Chiodi A., Gargiulo M., Deane J.P., Lavigne D. and Rout U.K. 2013 Irish TIMES
Energy Systems Model (CCRP 2008 3.1). Report published by EPA.
Phillips H. All Ireland Roundwood Production Forecast 2011-2028. Dublin, Ireland: COFORD,
Department of Agriculture, Fisheries and Food; 2011.
Smyth BM, Ó Gallachóir BP, Korres NE, Murphy JD. Can we meet targets for biofuels and renewable
energy in transport given the constraints imposed by policy in agriculture and energy? Journal of
Cleaner Production. 2010;18(16-17):1671-85.
Parsons Brinckerhoff. Electricity Generation Cost Model - 2011 Update. Revision 1. London, UK:
Prepared for Department of Energy and Climate Change; 2011.
Parsons Brinckerhoff. Solar PV cost update. London, UK: Prepared for Department of Energy and
Climate Change; 2012.
Radov D, Klevnäs P, Hanif A, Abu-Ebid M, Barker N, Stambaugh J. The UK Supply Curve for
Renewable Heat. London, UK: Study prepared from NERA Economic Consulting and AEA for the
Department of Energy and Climate Change (DECC); 2009.
Radov D, Klevnäs P, Hanif A, Abu-Ebid M, Barker N, Stambaugh J. The UK Supply Curve for
Renewable Heat. London, UK: Study prepared from NERA Economic Consulting and AEA for the
Department of Energy and Climate Change (DECC); 2009.
VGB Powertech. Investment and Operation Cost Figures – Generation Portfolio. Survey 2011. Essen,
Germany2011.
.

Appendix A
Full list of residential technologies is included in the accompanying Excel Spreadsheet [Built
Environment Overview.xls]
NACE Classification –All Sectors
Section A Agriculture, forestry and fishing
01 Crop and animal production, hunting and related service activities
02 Forestry and logging Forestry and logging
03 Fishing and aquaculture
Section B Mining and quarrying
05 Mining of coal and lignite;
06 Extraction of crude petroleum and natural gas
07 Mining of mineral ores
08 Other mining and quarrying; extraction of peat
09 Mining support services
Section C Manufacturing
10 Manufacture of food products
11 Manufacture of beverages
12 Manufacture of tobacco
13 Manufacture of textiles
14 Manufacture of wearing apparel;
15 Manufacture of leather and related products
16 Manufacture of wood and of products of wood and cork, except furniture; manufacture of articles of straw and plaiting materials

17 Manufacture of paper and paper products
18 Printing and reproduction of recorded media
19 Manufacture of coke and refined petroleum products
20 Manufacture of chemicals and chemical products
21 Manufacture of basic pharmaceutical products and pharmaceutical preparations
22 Manufacture of rubber and plastic products
23 Manufacture of other non-metallic mineral products
24 Manufacture of basic metals
25 Manufacture of fabricated metal products, except machinery and equipment
26 Manufacture of computer, electronic and optical products
27 Manufacture of electrical equipment
28 Manufacture of machinery and equipment n.e.c.
29 Manufacture of motor vehicles, trailers and semi-trailers
30 Manufacture of other transport equipment
31 Manufacture of furniture
32 Other manufacturing
33 Repair and installation of machinery and equipment
Section D Electricity, gas, steam and air conditioning
35 Electricity, gas, steam and air conditioning supply
Section E Water Supply, sewerage and waste management
36 Water collection, treatment and supply
37 Sewerage

38 Waste collection, treatment and disposal activities; materials recovery
39 Remediation activities and other waste management services
Section F Construction
41 Construction of buildings
42 Civil Engineering
43 Specialised construction activities
Section G Wholesale and retail trade; repair of motor vehicles and motorcycles
45 Wholesale and retail trade and repair of motor vehicles and motorcycles
46 Wholesale trade, except of motor vehicles and motorcycles
47 Retail trade, except of motor vehicles and motorcycles
Section H Transport and storage
49 Land transport; transport via pipelines
50 Water transport
51 Air transport
52 Warehousing and support activities for transportation
53 Postal and courier activities
Section I Accommodation and food service activities
55 Accommodation
56 Food and beverage service activities
Section J Information and Communication
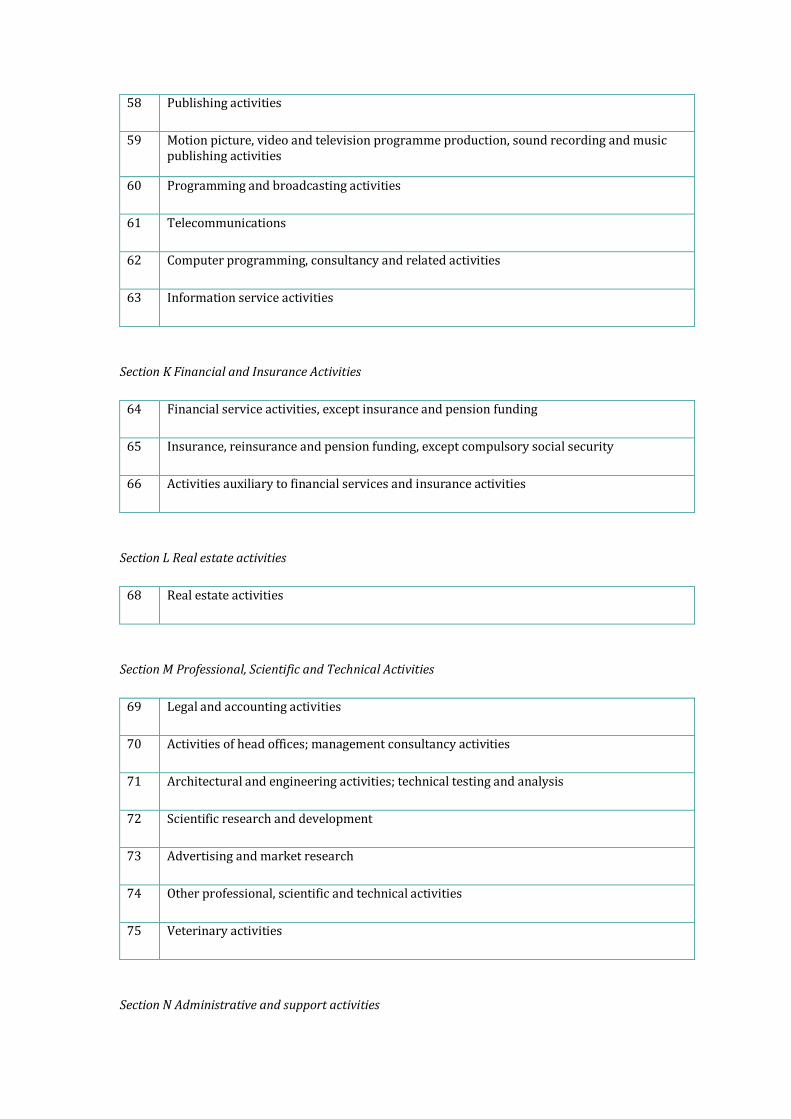
58 Publishing activities
59 Motion picture, video and television programme production, sound recording and music publishing activities
60 Programming and broadcasting activities
61 Telecommunications
62 Computer programming, consultancy and related activities
63 Information service activities
Section K Financial and Insurance Activities
64 Financial service activities, except insurance and pension funding
65 Insurance, reinsurance and pension funding, except compulsory social security
66 Activities auxiliary to financial services and insurance activities
Section L Real estate activities
68 Real estate activities
Section M Professional, Scientific and Technical Activities
69 Legal and accounting activities
70 Activities of head offices; management consultancy activities
71 Architectural and engineering activities; technical testing and analysis
72 Scientific research and development
73 Advertising and market research
74 Other professional, scientific and technical activities
75 Veterinary activities
Section N Administrative and support activities

77 Rental and leasing activities
78 Employment activities
79 Travel agency, tour operator and other reservation service and related activities
80 Security and investigation activities
81 Services to buildings and landscape activities
82 Office administrative, office support and other business support activities
Section O Public administration and defence; compulsory social security
84 Public administration and defence; compulsory social security
Section P Education
85 Education
Section Q Human health and social work activities
86 Human health activities
87 Residential care activities
88 Social work activities without accommodation
Section R Arts, Entertainment and Recreation
90 Creative, arts and entertainment activities
91 Libraries, archives, museums and other cultural activities
92 Gambling and betting activities
93 Sports activities and amusement and recreation activities

Section S Other services activities
94 Activities of membership organisations
95 Repair of computers and personal and household goods
96 Other personal service activities
Section T Activities of households as employers of domestic personnel; Undifferentiated goods-
and services-producing activities of private households for own use
97 Activities of households as employers of domestic personnel
98 Undifferentiated goods- and services-producing activities of private households for own
use
Section U Activities of extra-territorial organisations and bodies
99 Activities of extra-territorial organisations and bodies


