RNA QC 623 IRMA TRUpoint® CC, BG, and H3 Cartridges ITC Quality Control For Use with the RNA Medical, Inc. QC 623 Blood Gas and Electrolyte Control Note: REVISED ranges effective 10.27.08 For Software 3.0.1x and higher. Please refer to the package insert for specific information about this control material. Introduction & Intended Use With the IRMA TRUpoint Blood Analysis System, Quality Control can be performed through two methods: electronic and liquid controls. It is important to follow RNA’s recommended procedures for storage and equilibration of the control material prior to analysis on the IRMA TRUpoint Analyzer. Instructions for Use Equilibrate ampules at room temperature (18-25°C) for at least 8 hours before use. 1. Hold the ampule by its tip and shake it vigorously for 10 seconds. Tap the liquid back into the base of the ampule. 2. Enter User ID (optional) at the display prompt on the IRMA TRUpoint Analyzer. 3. Initiate the Quality Control Test Sequence. 4. Open the foil pouch and remove the cartridge. 5. Remove the protective tape from the cartridge. 6. Insert the cartridge into the analyzer. 7. Verify cartridge type inserted (if necessary) 8. Verify or enter the cartridge information at the display prompt. 9. Select the control from the list of established controls. 10. After calibration is complete, carefully snap open the control ampule To avoid cuts, protect your fingers with tissue or gloves, or use an ampule breaker. 11. Slowly draw the control sample into a 1 mL or 3 mL syringe using an 18-20 gauge needle. 12. Do not attempt to invert the syringe or expel bubbles from the syringe after drawing up the control solution. 13. Remove the needle, inject the control into the cartridge using a minimum of 0.8 mL of the control sample in a 1.0 mL syringe or a minimum of 1.5 mL of the control sample in a 3.0 mL syringe and press “test” to initiate the analysis. Expected Analyzer Performance The values on the Expected Values Chart are based on the results of multiple sample analysis. Samples were introduced with a 1 cc syringe, 18 gauge needle, after equilibration at 22°C (72°F) for a minimum of 8 hours. Use the expected values for each parameter as a guide in evaluating performance. Since performance is subject to sample temperature and environmental barometric pressure, ITC recommends that each institution establish its own expected values and acceptable limits. 1 The mean values established at your institution should fall within the expected ranges. Notes and Limitations In establishing the values shown on the Expected Values Chart, samples were analyzed after equilibration at 22°C (72°F) for a minimum of 8 hours. The pCO 2 and pO 2 values vary inversely with temperature by approximately one percent per degree Celsius. Refer to Temperature Correction for information to adjust pCO 2 and pO 2 ranges for operating outside of the 21-23°C temperature range. In establishing the values shown in Expected Values, samples are analyzed at approximately 760 mmHg. The pO 2 values decrease by approximately 2.3% per 100 mmHg and the pCO 2 values decrease by 1% at the same atmospheric conditions. 4 Temperature Correction It has been reported the pCO 2 and pO 2 results were inversely affected by temperature. 2,3 If your laboratory routinely operates in the 18-20°C (64-68°F) or 24- 25°C (75-77°F) range or experiences seasonal variations in temperature, you can adjust the ranges to account for these temperature effects, as shown below. For example, if your laboratory typically runs 24-25°C and the range in the Expected Values Chart is 142.0-162.0, you can adjust the range as follows: Adjusted range = (142.0-162.0 mmHg) - 3.8 mmHg = 138.2- 158.2 mmHg Temperature Correction for pCO2 and pO2 Level 18-20°C 21-23°C 24- 25°C pCO 2 1 + 2.2 no change - 1.8 pO2 1 + 2.5 no change - 2.1 pO 2 2 + 3.5 no change - 3.0 pO 2 3 + 4.6 no change - 3.8 References 1. Moran RF. Assessment of quality control of blood gas/pH analyzer performance. Respiratory Care 1981 (June). 2. Maas AHV. Evaluation of ampouled tonometered buffer solutions as a quality-control system for pH, pCO2 and pO2 measurement. Clin Chem 1977; 23(9): 1718-25. 3. Battino R, Rettich TR, Tominaga T. The solubility of oxygen and ozone in liquids. J of Phys Chem Ref Data 1983; 12(2): 163-178. 4. Burnett RW and Itano M. An interlaboratory study of blood-gas analysis: Dependence of pO2 and pCO2 results on atmospheric pressure. Clin Chem 1989; 35(8): 1779-1781. Expected Values Chart Level 1: pH 7.123 - 7.183 pCO 2 (mmHg) 63.8 – 79.8 pO 2 (mmHg) 67.0 – 87.0 Na+ (mmol/L) 109.8 – 119.8 K+ (mmol/L) 1.48 - 2.48 iCa (mmol/L) 1.38 - 1.58 Level 2: pH 7.390 - 7.450 pCO2 (mmHg) 38.0 – 48.0 pO2 (mmHg) 104.1 – 124.1 Na+ (mmol/L) 129.6 – 139.6 K+ (mmol/L) 3.82 - 4.82 iCa (mmol/L) 1.08 - 1.28 Level 3: pH 7.625 - 7.685 pCO2 (mmHg) 14.5 – 24.5 pO2 (mmHg) 138.6– 158.6 Na+ (mmol/L) 157.6 – 167.6 K+ (mmol/L) 5.72 - 6.72 iCa (mmol/L) 0.51 - 0.71 RNA MEDICAL QC 623 Kit Lot# 702777 LEVEL 1 LOT 70217 LEVEL 2 LOT 70317 LEVEL 3 LOT 70417 EXP. 07/11
Transcript
RNA QC 623
IRMA TRUpoint® CC, BG, and H3 Cartridges ITC
Quality Control F o r U s e w i t h t h e R N A M e d i c a l , I n c .
Q C 6 2 3 B l o o d G a s a n d E l e c t r o l y t e C o n t r o l
N o t e : R E V I S E D r a n g e s e f f e c t i v e 1 0 . 2 7 . 0 8
For Software 3.0.1x and higher.
Please refer to the package insert for specific information about this control material.
Introduction & Intended Use
With the IRMA TRUpoint Blood Analysis System, Quality Control can be performed through two methods: electronic and liquid controls.
It is important to follow RNA’s recommended procedures for storage and equilibration of the control material prior to analysis on the IRMA TRUpoint Analyzer.
Instructions for Use
Equilibrate ampules at room temperature (18-25°C) for at least 8 hours before use.
1. Hold the ampule by its tip and shake it vigorously for 10 seconds. Tap the liquid back into the base of the ampule.
2. Enter User ID (optional) at the display prompt on the IRMA TRUpoint Analyzer.
3. Initiate the Quality Control Test Sequence.
4. Open the foil pouch and remove the cartridge.
5. Remove the protective tape from the cartridge.
6. Insert the cartridge into the analyzer.
7. Verify cartridge type inserted (if necessary)
8. Verify or enter the cartridge information at the display prompt.
9. Select the control from the list of established controls.
10. After calibration is complete, carefully snap open the control ampule
To avoid cuts, protect your fingers with tissue or gloves, or use an ampule breaker.
11. Slowly draw the control sample into a 1 mL or 3 mL syringe using an 18-20 gauge needle.
12. Do not attempt to invert the syringe or expel bubbles from the syringe after drawing up the control solution.
13. Remove the needle, inject the control into the cartridge using a minimum of 0.8 mL of the control sample in a 1.0 mL syringe or a minimum of 1.5 mL of the control sample in a 3.0 mL syringe and press “test” to initiate the analysis.
Expected Analyzer Performance
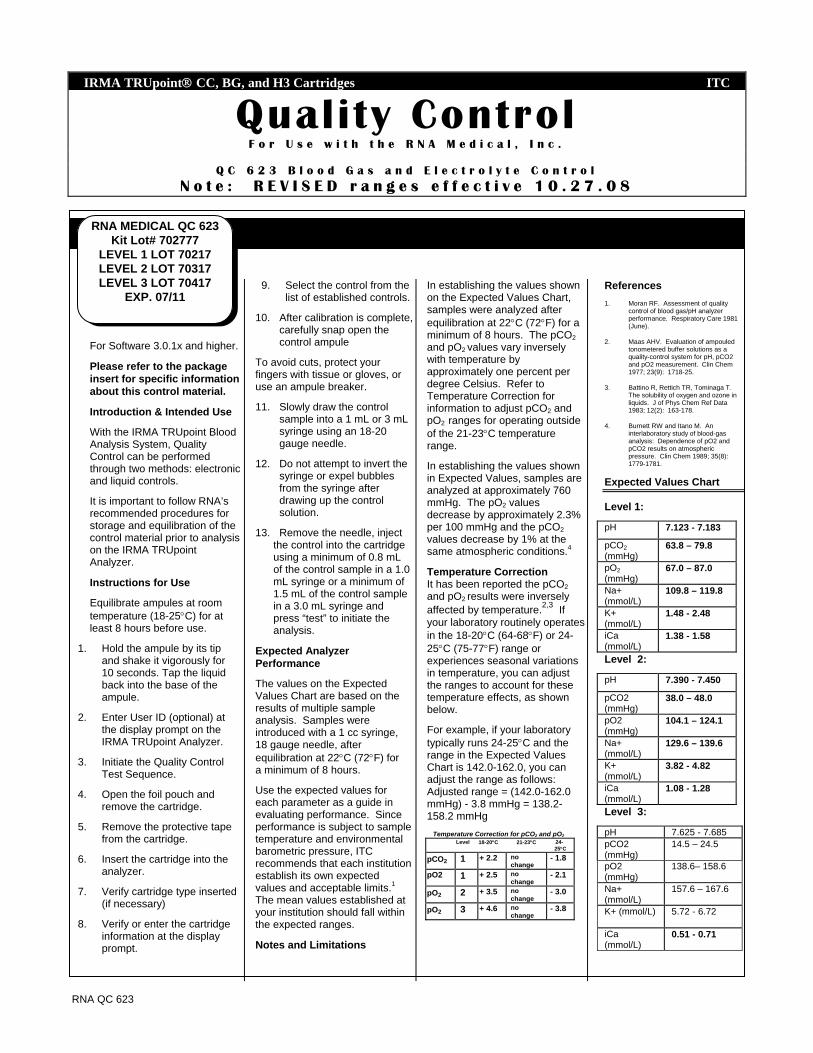
The values on the Expected Values Chart are based on the results of multiple sample analysis. Samples were introduced with a 1 cc syringe, 18 gauge needle, after equilibration at 22°C (72°F) for a minimum of 8 hours.
Use the expected values for each parameter as a guide in evaluating performance. Since performance is subject to sample temperature and environmental barometric pressure, ITC recommends that each institution establish its own expected values and acceptable limits.1 The mean values established at your institution should fall within the expected ranges.
Notes and Limitations
In establishing the values shown on the Expected Values Chart, samples were analyzed after equilibration at 22°C (72°F) for a minimum of 8 hours. The pCO2 and pO2 values vary inversely with temperature by approximately one percent per degree Celsius. Refer to Temperature Correction for information to adjust pCO2 and pO2 ranges for operating outside of the 21-23°C temperature range.
In establishing the values shown in Expected Values, samples are analyzed at approximately 760 mmHg. The pO2 values decrease by approximately 2.3% per 100 mmHg and the pCO2 values decrease by 1% at the same atmospheric conditions.4
Temperature Correction It has been reported the pCO2 and pO2 results were inversely affected by temperature.2,3 If your laboratory routinely operates in the 18-20°C (64-68°F) or 24-25°C (75-77°F) range or experiences seasonal variations in temperature, you can adjust the ranges to account for these temperature effects, as shown below.
For example, if your laboratory typically runs 24-25°C and the range in the Expected Values Chart is 142.0-162.0, you can adjust the range as follows: Adjusted range = (142.0-162.0 mmHg) - 3.8 mmHg = 138.2-158.2 mmHg
Temperature Correction for pCO2 and pO2 Level 18-20°C 21-23°C 24-
25°C
pCO2 1 + 2.2 no change
- 1.8
pO2 1 + 2.5 no change
- 2.1
pO2 2 + 3.5 no change
- 3.0
pO2 3 + 4.6 no change
- 3.8
References 1. Moran RF. Assessment of quality
control of blood gas/pH analyzer performance. Respiratory Care 1981 (June).
2. Maas AHV. Evaluation of ampouled tonometered buffer solutions as a quality-control system for pH, pCO2 and pO2 measurement. Clin Chem 1977; 23(9): 1718-25.
3. Battino R, Rettich TR, Tominaga T. The solubility of oxygen and ozone in liquids. J of Phys Chem Ref Data 1983; 12(2): 163-178.
4. Burnett RW and Itano M. An interlaboratory study of blood-gas analysis: Dependence of pO2 and pCO2 results on atmospheric pressure. Clin Chem 1989; 35(8): 1779-1781.
Expected Values Chart
Level 1:
pH 7.123 - 7.183
pCO2 (mmHg)
63.8 – 79.8
pO2 (mmHg)
67.0 – 87.0
Na+ (mmol/L)
109.8 – 119.8
K+ (mmol/L)
1.48 - 2.48
iCa (mmol/L)
1.38 - 1.58
Level 2:
pH 7.390 - 7.450
pCO2 (mmHg)
38.0 – 48.0
pO2 (mmHg)
104.1 – 124.1
Na+ (mmol/L)
129.6 – 139.6
K+ (mmol/L)
3.82 - 4.82
iCa (mmol/L)
1.08 - 1.28
Level 3:
pH 7.625 - 7.685 pCO2 (mmHg)
14.5 – 24.5
pO2 (mmHg)
138.6– 158.6
Na+ (mmol/L)
157.6 – 167.6
K+ (mmol/L)
5.72 - 6.72
iCa (mmol/L)
0.51 - 0.71
RNA MEDICAL QC 623 Kit Lot# 702777
LEVEL 1 LOT 70217 LEVEL 2 LOT 70317 LEVEL 3 LOT 70417
EXP. 07/11
RNA QC 623 kpa_70x_REVISED
IRMA TRUpoint ® used with CC, BG, and H3 Cartridges ITC
Quality Control F o r U s e w i t h t h e R N A M e d i c a l , I N C Q C 6 2 3 B l o o d G a s a n d E l e c t r o l y t e
C o n t r o l N o t e : R e v i s e d r a n g e s e f f e c t i v e 1 0 / 2 7 / 0 8
For Software 3.0.11 and higher.
Please refer to the package insert for specific information about this control material.
Introduction & Intended Use The IRMA TRUpoint is intended for the measurement of various critical care analytes. Liquid quality control is one of two control methods that may be performed on the system.
Instructions for Use
Follow RNA’s control storage recommendation. Equilibrate ampules at room temperature (18-25°C) for at least 8 hours before use.
1. Hold the ampule by its tip and shake it vigorously for 10 seconds.
Tap the liquid back into the base of the ampule and set the ampule down until ready to open.
2. Initiate the Quality Control Test Sequence.
3. Open the foil pouch and remove the cartridge.
4. Remove the protective tape from the cartridge.
5. Insert the cartridge into the analyzer.
6. Verify or enter the cartridge information.
7. Select the control from the list of established controls. After calibration is complete, carefully snap open the control ampule. To avoid cuts, protect your fingers with tissue or gloves, or use an ampule breaker.
8. Slowly draw ~1 mL of control into a plain 1 mL
syringe, or nearly the entire ampule contents into a plain 2 or 3 mL syringe using an 18-20 gauge needle. Place the needle opening below the liquid surface when drawing to minimize air contamination. When done, remove the needle from the syringe. Do not attempt to invert the syringe or expel air bubbles from the syringe.
9. Remove the luer cap from the cartridge and firmly attach the syringe to the luer port. Inject all but the last syringe contents into the cartridge, taking care not to inject air bubbles into the sample path.
10. Ensure that no air bubbles or calibrant are present in the sample path, then immediately press “test” to continue the analysis.
Expected Analyzer Performance
The values on the Expected Values Chart are based on the results of multiple sample analysis. Control samples were drawn with a 3 cc syringe/15 gauge plastic needle tip after equilibration at 22°C (72°F) for a minimum of 8 hours. Use the expected values for each parameter as a guide in evaluating performance.
Since performance is subject to sample temperature and environmental barometric pressure, ITC recommends that each institution establish its own expected values and acceptable limits.1 The mean values established at your institution should fall within the expected ranges.
Notes and Limitations Control pCO2 and pO2 values vary inversely with control
storage temperature by approximately one percent per degree Celsius. Refer to the Temperature Correction chart below to adjust pCO2 and pO2 ranges for storage temperatures outside of the 21-23°C range.
In establishing the values shown in Expected Values, samples are analyzed at approximately 760 mmHg. The pO2 values decrease by approximately 2.3% per 100 mmHg and the pCO2 values decrease by 1% at the same atmospheric conditions.4
Temperature Correction It has been reported the pCO2 and pO2 results were inversely affected by temperature.2,3 If your room temperature is routinely or seasonally in the 18-20°C (64-68°F) or 24-25°C (75-77°F) range, you can adjust the ranges to account for these temperature effects using the following chart: Temperature Correction for pCO2 and pO2
Level 18-20°C 21-23°C 24-25°C
pCO2 1 + .29 no change - .24
pO2 1 + .33 no change - .28
pO2 2 + .47 no change - .40
pO2 3 + .61 no change - .51
For example, if your room temperature is typically 24-25°C and the range in the Expected Values Chart is 19.0-22.00, you can adjust the range as follows:
References 1. Moran RF. Assessment of quality control
of blood gas/pH analyzer performance. Respiratory Care 1981 (June).
2. Maas AHV. Evaluation of ampouled tonometered buffer solutions as a quality-control system for pH, pCO2 and pO2 measurement. Clin Chem 1977; 23(9): 1718-25.
3. Battino R, Rettich TR, Tominaga T. The solubility of oxygen and ozone in liquids. J of Phys Chem Ref Data 1983; 12(2): 163-178.
4. Burnett RW and Itano M. An interlaboratory study of blood-gas analysis: Dependence of pO2 and pCO2 results on atmospheric pressure. Clin Chem 1989; 35(8): 1779-1781.
*NOTE: These values are for use with the IRMA TRUpoint only.
RNA Medical CC 623 Kit Lot #702777
Level 1 Lot 70217 Level 2 Lot 70317 Level 3 Lot 70417
Exp. 07/11
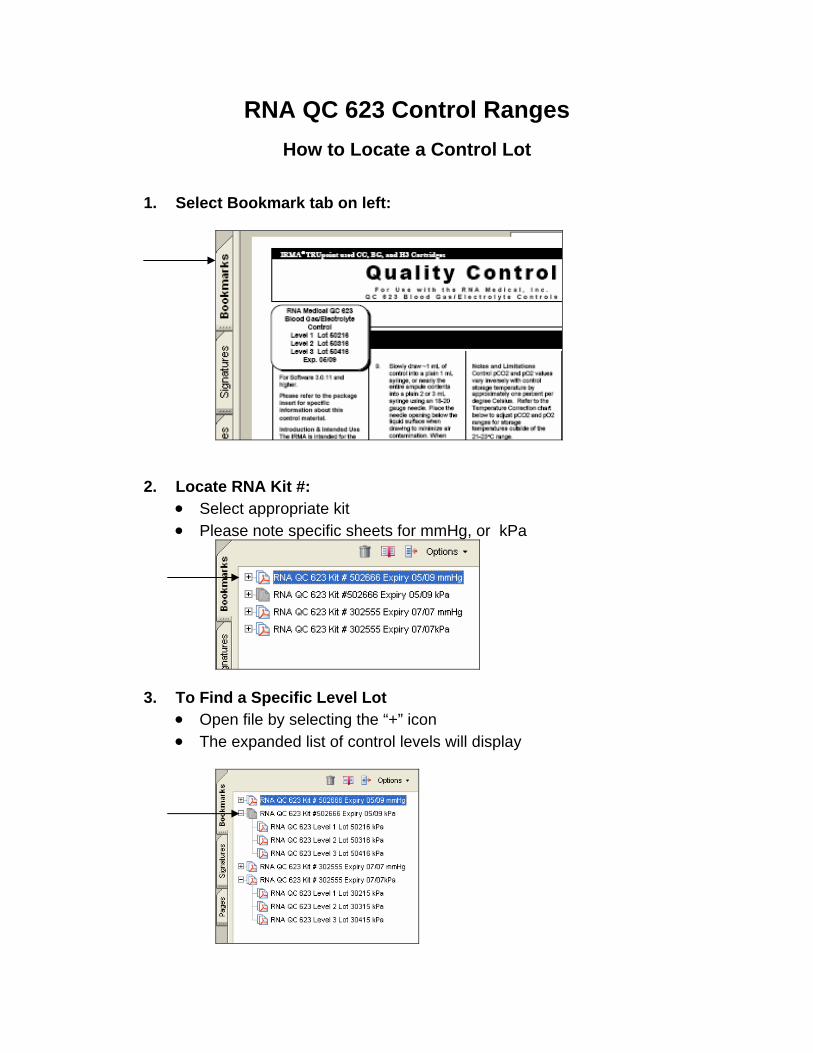
RNA QC 623 Control Ranges
How to Locate a Control Lot
1. Select Bookmark tab on left:
2. Locate RNA Kit #: • Select appropriate kit • Please note specific sheets for mmHg, or kPa
3. To Find a Specific Level Lot • Open file by selecting the “+” icon • The expanded list of control levels will display
RNA QC 623
IRMA TRUpoint® CC, BG, and H3 Cartridges ITC
Quality Control F o r U s e w i t h t h e R N A M e d i c a l , I n c .
Q C 6 2 3 B l o o d G a s a n d E l e c t r o l y t e C o n t r o l
For Software 3.0.1x and higher.
Please refer to the package insert for specific information about this control material.
Introduction & Intended Use
With the IRMA TRUpoint Blood Analysis System, Quality Control can be performed through two methods: electronic and liquid controls.
It is important to follow RNA’s recommended procedures for storage and equilibration of the control material prior to analysis on the IRMA TRUpoint Analyzer.
Instructions for Use
Equilibrate ampules at room temperature (18-25°C) for at least 8 hours before use.
1. Hold the ampule by its tip and shake it vigorously for 10 seconds. Tap the liquid back into the base of the ampule.
2. Enter User ID (optional) at the display prompt on the IRMA TRUpoint Analyzer.
3. Initiate the Quality Control Test Sequence.
4. Open the foil pouch and remove the cartridge.
5. Remove the protective tape from the cartridge.
6. Insert the cartridge into the analyzer.
7. Verify cartridge type inserted (if necessary)
8. Verify or enter the cartridge information at the display prompt.
9. Select the control from the list of established controls.
10. After calibration is complete, carefully snap open the control ampule
To avoid cuts, protect your fingers with tissue or gloves, or use an ampule breaker.
11. Slowly draw the control sample into a 1 mL or 3 mL syringe using an 18-20 gauge needle.
12. Do not attempt to invert the syringe or expel bubbles from the syringe after drawing up the control solution.
13. Remove the needle, inject the control into the cartridge using a minimum of 0.8 mL of the control sample in a 1.0 mL syringe or a minimum of 1.5 mL of the control sample in a 3.0 mL syringe and press “test” to initiate the analysis.
Expected Analyzer Performance
The values on the Expected Values Chart are based on the results of multiple sample analysis. Samples were introduced with a 1 cc syringe, 18 gauge needle, after equilibration at 22°C (72°F) for a minimum of 8 hours.
Use the expected values for each parameter as a guide in evaluating performance. Since performance is subject to sample temperature and environmental barometric pressure, ITC recommends that each institution establish its own expected values and acceptable limits.1 The mean values established at your institution should fall within the expected ranges.
Notes and Limitations
In establishing the values shown on the Expected Values Chart, samples were analyzed after equilibration at 22°C (72°F) for a minimum of 8 hours. The pCO2 and pO2 values vary inversely with temperature by approximately one percent per degree Celsius. Refer to Temperature Correction for information to adjust pCO2 and pO2 ranges for operating outside of the 21-23°C temperature range.
In establishing the values shown in Expected Values, samples are analyzed at approximately 760 mmHg. The pO2 values decrease by approximately 2.3% per 100 mmHg and the pCO2 values decrease by 1% at the same atmospheric conditions.4
Temperature Correction It has been reported the pCO2 and pO2 results were inversely affected by temperature.2,3 If your laboratory routinely operates in the 18-20°C (64-68°F) or 24-25°C (75-77°F) range or experiences seasonal variations in temperature, you can adjust the ranges to account for these temperature effects, as shown below.
For example, if your laboratory typically runs 24-25°C and the range in the Expected Values Chart is 142.0-162.0, you can adjust the range as follows: Adjusted range = (142.0-162.0 mmHg) - 3.8 mmHg = 138.2-158.2 mmHg
Temperature Correction for pCO2 and pO2 Level 18-20°C 21-23°C 24-25°C
pCO2 1 + 2.2 no change
- 1.8
pO2 1 + 2.5 no change
- 2.1
pO2 2 + 3.5 no change
- 3.0
pO2 3 + 4.6 no change
- 3.8
References 1. Moran RF. Assessment of quality
control of blood gas/pH analyzer performance. Respiratory Care 1981 (June).
2. Maas AHV. Evaluation of ampouled tonometered buffer solutions as a quality-control system for pH, pCO2 and pO2 measurement. Clin Chem 1977; 23(9): 1718-25.
3. Battino R, Rettich TR, Tominaga T. The solubility of oxygen and ozone in liquids. J of Phys Chem Ref Data 1983; 12(2): 163-178.
4. Burnett RW and Itano M. An interlaboratory study of blood-gas analysis: Dependence of pO2 and pCO2 results on atmospheric pressure. Clin Chem 1989; 35(8): 1779-1781.
Expected Values Chart
Level 1:
pH 7.150 - 7.210
pCO2 (mmHg)
61.5 – 77.5
pO2 (mmHg)
68.9 – 88.9
Na+ (mmol/L)
109.2 – 119.2
K+ (mmol/L)
1.47 - 2.47
iCa (mmol/L)
1.35 - 1.55
Level 2:
pH 7.417 - 7.477
pCO2 (mmHg)
36.4 – 46.4
pO2 (mmHg)
109.5 – 129.5
Na+ (mmol/L)
128.8 – 138.8
K+ (mmol/L)
3.78 - 4.78
iCa (mmol/L)
1.05 - 1.25
Level 3:
pH 7.651 - 7.711 pCO2 (mmHg)
14.0 – 24.0
pO2 (mmHg)
145.1 – 165.1
Na+ (mmol/L)
157.5 – 167.5
K+ (mmol/L) 5.68 - 6.68 iCa (mmol/L)
0.50 - 0.70
RNA MEDICAL QC 623 Kit Lot# 702777
LEVEL 1 LOT 70217 LEVEL 2 LOT 70317 LEVEL 3 LOT 70417
EXP. 07/11
RNA QC 623 kpa_70x
IRMA TRUpoint ® used with CC, BG, and H3 Cartridges ITC
Quality Control F o r U s e w i t h t h e R N A M e d i c a l , I n c .
Q C 6 2 3 B l o o d G a s a n d E l e c t r o l y t e C o n t r o l
For Software 3.0.11 and higher.
Please refer to the package insert for specific information about this control material.
Introduction & Intended Use The IRMA TRUpoint is intended for the measurement of various critical care analytes. Liquid quality control is one of two control methods that may be performed on the system.
Instructions for Use
Follow RNA’s control storage recommendation. Equilibrate ampules at room temperature (18-25°C) for at least 8 hours before use.
1. Hold the ampule by its tip and shake it vigorously for 10 seconds.
Tap the liquid back into the base of the ampule and set the ampule down until ready to open.
2. Initiate the Quality Control Test Sequence.
3. Open the foil pouch and remove the cartridge.
4. Remove the protective tape from the cartridge.
5. Insert the cartridge into the analyzer.
6. Verify or enter the cartridge information.
7. Select the control from the list of established controls. After calibration is complete, carefully snap open the control ampule. To avoid cuts, protect your fingers with tissue or gloves, or use an ampule breaker.
8. Slowly draw ~1 mL of control into a plain 1 mL syringe, or nearly the entire ampule contents into a plain 2 or 3 mL syringe using an 18-20 gauge needle. Place the needle opening below the liquid surface when drawing to minimize air contamination. When done, remove the needle from the syringe. Do not attempt to invert the syringe or expel air bubbles from the syringe.
9. Remove the luer cap from the cartridge and firmly attach the syringe to the luer port. Inject all but the last syringe contents into the cartridge, taking care not to inject air bubbles into the sample path.
10. Ensure that no air bubbles or calibrant are present in the sample path, then immediately press “test” to continue the analysis.
Expected Analyzer Performance
The values on the Expected Values Chart are based on the results of multiple sample analysis. Control samples were drawn with a 3 cc syringe/15 gauge plastic needle tip after equilibration at 22°C (72°F) for a minimum of 8 hours. Use the expected values for each parameter as a guide in evaluating performance.
Since performance is subject to sample temperature and environmental barometric pressure, ITC recommends that each institution establish its own expected values and acceptable limits.1 The mean values established at your institution should fall within the expected ranges.
Notes and Limitations Control pCO2 and pO2 values vary inversely with control storage temperature by approximately one percent per degree Celsius. Refer to the Temperature Correction chart below to adjust pCO2 and pO2 ranges for storage temperatures outside of the 21-23°C range.
In establishing the values shown in Expected Values, samples are analyzed at approximately 760 mmHg. The pO2 values decrease by approximately 2.3% per 100 mmHg and the pCO2 values decrease by 1% at the same atmospheric conditions.4
Temperature Correction It has been reported the pCO2 and pO2 results were inversely affected by temperature.2,3 If your room temperature is routinely or seasonally in the 18-20°C (64-68°F) or 24-25°C (75-77°F) range, you can adjust the ranges to account for these temperature effects using the following chart: Temperature Correction for pCO2 and pO2
Level 18-20°C 21-23°C 24-25°C
pCO2 1 + .29 no change - .24
pO2 1 + .33 no change - .28
pO2 2 + .47 no change - .40
pO2 3 + .61 no change - .51
For example, if your room temperature is typically 24-25°C and the range in the Expected Values Chart is 19.0-22.00, you can adjust the range as follows:
References 1. Moran RF. Assessment of quality control
of blood gas/pH analyzer performance. Respiratory Care 1981 (June).
2. Maas AHV. Evaluation of ampouled tonometered buffer solutions as a quality-control system for pH, pCO2 and pO2 measurement. Clin Chem 1977; 23(9): 1718-25.
3. Battino R, Rettich TR, Tominaga T. The solubility of oxygen and ozone in liquids. J of Phys Chem Ref Data 1983; 12(2): 163-178.
4. Burnett RW and Itano M. An interlaboratory study of blood-gas analysis: Dependence of pO2 and pCO2 results on atmospheric pressure. Clin Chem 1989; 35(8): 1779-1781.
*NOTE: These values are for use with the IRMA TRUpoint only.
RNA Medical CC 623 Kit Lot #702777
Level 1 Lot 70217 Level 2 Lot 70317 Level 3 Lot 70417
Exp. 07/11
I R M A T R U p o i n t ® Q U A L I T Y C O N T R O L
F o r u s e w i t h t h e R N A M e d i c a l , I n c . QC 623 Blood Gas/Electrolyte Controls
The IRMA TRUpoint quality control sheets with bar codes are designed to be used with the IRMA TRUpoint scanner. If you are unable to scan the bar codes after printing please manually input the ranges accordingly. For questions please contact ITC technical support services at 800-631-5945 or 732-548-5700. Quality Control 623 CC_kPa
For use with CC, BG, and H3 Cartridges The attached bar codes are to be used with your IRMA TRUpoint scanner*
For Software 3.0.11 and higher.
Please refer to the package insert for specific information about this control material.
Introduction & Intended Use
With the IRMA TRUpoint Blood Analysis System, Quality Control can be performed through two methods: electronic and liquid controls.
It is important to follow RNA’s recommended procedures for storage and equilibration of the control material prior to analysis on the IRMA TRUpoint Analyzer.
Instructions for Use
Equilibrate ampules at room temperature (18-25°C) for at least 8 hours before use.
1. Hold the ampule by its tip and shake it vigorously for 10 seconds. Tap the liquid back into the base of the ampule and set down until ready to use.
2. Enter User ID (optional) at the display prompt on the IRMA TRUpoint Analyzer.
3. Initiate the Quality Control Test Sequence.
4. Open the foil pouch and remove the cartridge.
5. Remove the protective tape from the cartridge.
6. Insert the cartridge into the analyzer.
7. Verify or enter the cartridge information at the display prompt.
8. Select the control from the list of established controls.
9. After calibration is complete, carefully snap open the control ampule.
To avoid cuts, protect your fingers with tissue or gloves, or use an ampule breaker.
10. Slowly draw the control sample into a 1 mL or 3 mL syringe using an 18-20 gauge needle.
11. Do not attempt to invert the syringe or expel bubbles from the syringe after drawing up the control solution.
12. Remove the needle, inject the control into the cartridge using a minimum of 0.8 mL of the control sample in a 1.0 mL syringe or a minimum of 1.5 mL of the control sample in a 3.0 mL syringe and press “test” to initiate the analysis.
Expected Analyzer Performance
The values on the Expected Values Chart are based on the results of multiple sample analysis. Samples were introduced using a 1 cc syringe, with an 18 gauge needle, after cartridge equilibration at 22°C (72°F) for a minimum of 8 hours.
Use the expected values for each parameter as a guide in evaluating performance. Since performance is subject to sample temperature and environmental barometric pressure, ITC recommends that each institution establish its own expected values and acceptable limits. The mean values established at your institution should fall within the expected ranges.
Notes and Limitations
In establishing the values shown on the Expected Values Chart, samples were analyzed after equilibration at 22°C (72°F) for a minimum of 8 hours. The pCO2 and pO2 values vary inversely with temperature by approximately one percent per degree Celsius. Refer to Temperature Correction for information to adjust pCO2 and pO2 ranges for operating outside of the 21-23°C temperature range.
In establishing the values shown in Expected Values, samples are analyzed at approximately 760 mmHg. The pO2 values decrease by approximately 2.3% per 100 mmHg and the pCO2 values decrease by 1% at the same atmospheric conditions.4
Temperature Correction
It has been reported the pCO2 and pO2 results were inversely affected by temperature.2,3 If your laboratory routinely operates in the 18-20°C (64-68°F) or 24-25°C (75-77°F) range or experiences seasonal variations in temperature, you can adjust the ranges to account for these temperature effects, as shown below.
For example, if your room temperature is typically 24-25°C and the range in the Expected Values Chart is 19.0-22.00, you can adjust the range as follows:
Lower limit: 20.3 - 0.51 = 19.79 Upper limit: 23.0 - 0.51 = 22.49 Adjusted range = 19.79 - 22.49 Temperature Correction for pCO2 and pO2 Level 18-20°C 21-23°C 24-25°C
pCO2 1 + .29 no change - .24
pO2 1 + .33 no change - .28
pO2 2 + .47 no change - .40
pO2 3 + .61 no change - .51
References 1. Moran RF. Assessment of quality control
of blood gas/pH analyzer performance. Respiratory Care 1981 (June).
2. Maas AHV. Evaluation of ampouled tonometered buffer solutions as a quality-control system for pH, pCO2 and pO2 measurement. Clin Chem 1977; 23(9): 1718-25.
3. Battino R, Rettich TR, Tominaga T. The solubility of oxygen and ozone in liquids. J of Phys Chem Ref Data 1983; 12(2): 163-178.
4. Burnett RW and Itano M. An interlaboratory study of blood-gas analysis: Dependence of pO2 and pCO2 results on atmospheric pressure. Clin Chem 1989; 35(8): 1779-1781.
KIT LOT# 902888 LEVEL 1 LOT 90218 LEVEL 2 LOT 90318 LEVEL 3 LOT 90418
EXP. 08/13
I R M A T R U p o i n t ® Q U A L I T Y C O N T R O L
F o r u s e w i t h t h e R N A M e d i c a l , I n c . QC 623 Blood Gas/Electrolyte Controls
The IRMA TRUpoint quality control sheets with bar codes are designed to be used with the IRMA TRUpoint scanner. If you are unable to scan the bar codes after printing please manually input the ranges accordingly. For questions please contact ITC technical support services at 800-631-5945 or 732-548-5700. Quality Control 623 CC_kPa
Level 1 – Lot 90218
A *46990218071B8DCC*1*90218*
B *441902181*08/13*PH*7.123*
C *463902182*7.183*PCO2*66.*
D *4609021837*82.7*PO2*69.7*
E *439902184*89.7*NA+*110.3*
F *411902185*120.3*K+*1.52**
G *4439021862.52*ICA*1.34*1*
H *1FC902187.54**
I R M A T R U p o i n t ® Q U A L I T Y C O N T R O L
F o r u s e w i t h t h e R N A M e d i c a l , I n c . QC 623 Blood Gas/Electrolyte Controls
The IRMA TRUpoint quality control sheets with bar codes are designed to be used with the IRMA TRUpoint scanner. If you are unable to scan the bar codes after printing please manually input the ranges accordingly. For questions please contact ITC technical support services at 800-631-5945 or 732-548-5700. Quality Control 623 CC_kPa
Level 2 – Lot 90318
A *46290318071C0ACC*2*90318*
B *44E903181*08/13*PH*7.396*
C *466903182*7.456*PCO2*38.*
D *44E9031835*48.5*PO2*104.*
E *4339031841*124.1*NA+*128*
F *431903185.9*138.9*K+*3.8*
G *44F9031866*4.86*ICA*1.04*
H *255903187*1.24**
I R M A T R U p o i n t ® Q U A L I T Y C O N T R O L
F o r u s e w i t h t h e R N A M e d i c a l , I n c . QC 623 Blood Gas/Electrolyte Controls
The IRMA TRUpoint quality control sheets with bar codes are designed to be used with the IRMA TRUpoint scanner. If you are unable to scan the bar codes after printing please manually input the ranges accordingly. For questions please contact ITC technical support services at 800-631-5945 or 732-548-5700. Quality Control 623 CC_kPa
Level 3 – Lot 90418
A *46890418071C0DCC*3*90418*
B *449904181*08/13*PH*7.642*
C *45A904182*7.702*PCO2*13.*
D *44D9041834*23.4*PO2*138.*
E *4429041843*158.3*NA+*158*
F *437904185.9*168.9*K+*5.8*
G *44C9041862*6.82*ICA*0.52*
H *258904187*0.72**
I R M A T R U p o i n t ® Q U A L I T Y C O N T R O L
F o r u s e w i t h t h e R N A M e d i c a l , I n c . QC 623 Blood Gas/Electrolyte Controls
The IRMA TRUpoint quality control sheets with bar codes are designed to be used with the IRMA TRUpoint scanner. If you are unable to scan the bar codes after printing please manually input the ranges accordingly. For questions please contact ITC technical support services at 800-631-5945 or 732-548-5700. Quality Control 623 CC_mmHg
For use with CC, BG, and H3 Cartridges The attached bar codes are to be used with your IRMA TRUpoint scanner*
For Software 3.0.11 and higher.
Please refer to the package insert for specific information about this control material.
Introduction & Intended Use
With the IRMA TRUpoint Blood Analysis System, Quality Control can be performed through two methods: electronic and liquid controls.
It is important to follow RNA’s recommended procedures for storage and equilibration of the control material prior to analysis on the IRMA TRUpoint Analyzer.
Instructions for Use
Equilibrate ampules at room temperature (18-25°C) for at least 8 hours before use.
1. Hold the ampule by its tip and shake it vigorously for 10 seconds. Tap the liquid back into the base of the ampule and set down until ready to use.
2. Enter User ID (optional) at the display prompt on the IRMA TRUpoint Analyzer.
3. Initiate the Quality Control Test Sequence.
4. Open the foil pouch and remove the cartridge.
5. Remove the protective tape from the cartridge.
6. Insert the cartridge into the analyzer.
7. Verify or enter the cartridge information at the display prompt.
8. Select the control from the list of established controls.
9. After calibration is complete, carefully snap open the control ampule.
To avoid cuts, protect your fingers with tissue or gloves, or use an ampule breaker.
10. Slowly draw the control sample into a 1 mL or 3 mL syringe using an 18-20 gauge needle.
11. Do not attempt to invert the syringe or expel bubbles from the syringe after drawing up the control solution.
12. Remove the needle, inject the control into the cartridge using a minimum of 0.8 mL of the control sample in a 1.0 mL syringe or a minimum of 1.5 mL of the control sample in a 3.0 mL syringe and press “test” to initiate the analysis.
Expected Analyzer Performance
The values on the Expected Values Chart are based on the results of multiple sample analysis. Samples were introduced using a 1 cc syringe, with an 18 gauge needle, after cartridge equilibration at 22°C (72°F) for a minimum of 8 hours.
Use the expected values for each parameter as a guide in evaluating performance. Since performance is subject to sample temperature and environmental barometric pressure, ITC recommends that each institution establish its own expected values and acceptable limits. The mean values established at your institution should fall within the expected ranges.
Notes and Limitations
In establishing the values shown on the Expected Values Chart, samples were analyzed after equilibration at 22°C (72°F) for a minimum of 8 hours. The pCO2 and pO2 values vary inversely with temperature by approximately one percent per degree Celsius. Refer to Temperature Correction for information to adjust pCO2 and pO2 ranges for operating outside of the 21-23°C temperature range.
In establishing the values shown in Expected Values, samples are analyzed at approximately 760 mmHg. The pO2 values decrease by approximately 2.3% per 100 mmHg and the pCO2 values decrease by 1% at the same atmospheric conditions.4
Temperature Correction
It has been reported the pCO2 and pO2 results were inversely affected by temperature.2,3 If your laboratory routinely operates in the 18-20°C (64-68°F) or 24-25°C (75-77°F) range or experiences seasonal variations in temperature, you can adjust the ranges to account for these temperature effects, as shown below.
For example, if your room temperature is typically 24-25°C and the range in the Expected Values Chart is 19.0-22.00, you can adjust the range as follows:
Lower limit: 20.3 - 0.51 = 19.79 Upper limit: 23.0 - 0.51 = 22.49 Adjusted range = 19.79 - 22.49 Temperature Correction for pCO2 and pO2 Level 18-20°C 21-23°C 24-25°C
pCO2 1 + 2.2 no change - 1.8
pO2 1 + 2.5 no change - 2.1
pO2 2 + 3.5 no change - 3.0
pO2 3 + 4.6 no change - 3.8
References 1. Moran RF. Assessment of quality control
of blood gas/pH analyzer performance. Respiratory Care 1981 (June).
2. Maas AHV. Evaluation of ampouled tonometered buffer solutions as a quality-control system for pH, pCO2 and pO2 measurement. Clin Chem 1977; 23(9): 1718-25.
3. Battino R, Rettich TR, Tominaga T. The solubility of oxygen and ozone in liquids. J of Phys Chem Ref Data 1983; 12(2): 163-178.
4. Burnett RW and Itano M. An interlaboratory study of blood-gas analysis: Dependence of pO2 and pCO2 results on atmospheric pressure. Clin Chem 1989; 35(8): 1779-1781.
KIT LOT# 902888 LEVEL 1 LOT 90218 LEVEL 2 LOT 90318 LEVEL 3 LOT 90418
EXP. 08/13
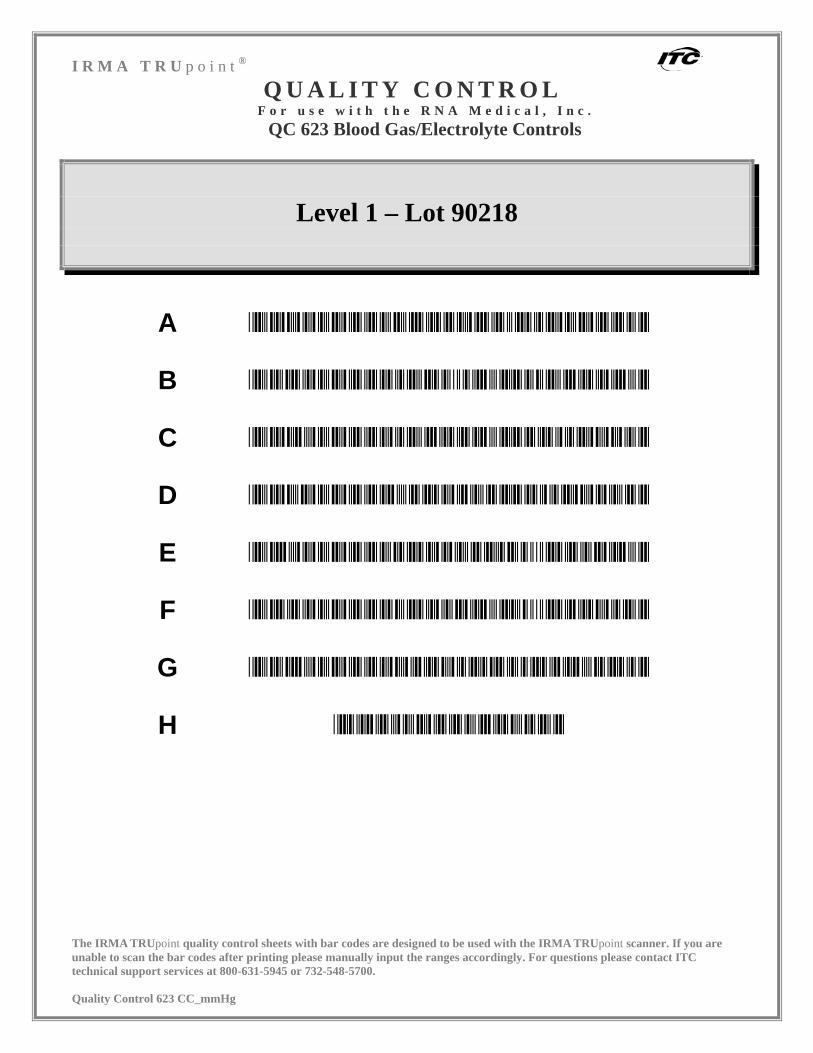
I R M A T R U p o i n t ® Q U A L I T Y C O N T R O L
F o r u s e w i t h t h e R N A M e d i c a l , I n c . QC 623 Blood Gas/Electrolyte Controls
The IRMA TRUpoint quality control sheets with bar codes are designed to be used with the IRMA TRUpoint scanner. If you are unable to scan the bar codes after printing please manually input the ranges accordingly. For questions please contact ITC technical support services at 800-631-5945 or 732-548-5700. Quality Control 623 CC_mmHg
Level 1 – Lot 90218
A *46990218071B8DCC*1*90218*
B *441902181*08/13*PH*7.123*
C *463902182*7.183*PCO2*66.*
D *4609021837*82.7*PO2*69.7*
E *439902184*89.7*NA+*110.3*
F *411902185*120.3*K+*1.52**
G *4439021862.52*ICA*1.34*1*
H *1FC902187.54**
I R M A T R U p o i n t ® Q U A L I T Y C O N T R O L
F o r u s e w i t h t h e R N A M e d i c a l , I n c . QC 623 Blood Gas/Electrolyte Controls
The IRMA TRUpoint quality control sheets with bar codes are designed to be used with the IRMA TRUpoint scanner. If you are unable to scan the bar codes after printing please manually input the ranges accordingly. For questions please contact ITC technical support services at 800-631-5945 or 732-548-5700. Quality Control 623 CC_mmHg
Level 2 – Lot 90318
A *46290318071C0ACC*2*90318*
B *44E903181*08/13*PH*7.396*
C *466903182*7.456*PCO2*38.*
D *44E9031835*48.5*PO2*104.*
E *4339031841*124.1*NA+*128*
F *431903185.9*138.9*K+*3.8*
G *44F9031866*4.86*ICA*1.04*
H *255903187*1.24**
I R M A T R U p o i n t ® Q U A L I T Y C O N T R O L
F o r u s e w i t h t h e R N A M e d i c a l , I n c . QC 623 Blood Gas/Electrolyte Controls
The IRMA TRUpoint quality control sheets with bar codes are designed to be used with the IRMA TRUpoint scanner. If you are unable to scan the bar codes after printing please manually input the ranges accordingly. For questions please contact ITC technical support services at 800-631-5945 or 732-548-5700. Quality Control 623 CC_mmHg
Level 3 – Lot 90418
A *46890418071C0DCC*3*90418*
B *449904181*08/13*PH*7.642*
C *45A904182*7.702*PCO2*13.*
D *44D9041834*23.4*PO2*138.*
E *4429041843*158.3*NA+*158*
F *437904185.9*168.9*K+*5.8*
G *44C9041862*6.82*ICA*0.52*
H *258904187*0.72**
I R M A T R U p o i n t ® Q U A L I T Y C O N T R O L
F o r u s e w i t h t h e R N A M e d i c a l , I n c . QC 623 Blood Gas/Electrolyte Controls
The IRMA TRUpoint quality control sheets with bar codes are designed to be used with the IRMA TRUpoint scanner. If you are unable to scan the bar codes after printing please manually input the ranges accordingly. For questions please contact ITC technical support services at 800-631-5945 or 732-548-5700. Quality Control 623 CC_mmHg
For use with CC, BG, and H3 Cartridges The attached bar codes are to be used with your IRMA TRUpoint scanner*
For Software 3.0.11 and higher.
Please refer to the package insert for specific information about this control material.
Introduction & Intended Use
With the IRMA TRUpoint Blood Analysis System, Quality Control can be performed through two methods: electronic and liquid controls.
It is important to follow RNA’s recommended procedures for storage and equilibration of the control material prior to analysis on the IRMA TRUpoint Analyzer.
Instructions for Use
Equilibrate ampules at room temperature (18-25°C) for at least 8 hours before use.
1. Hold the ampule by its tip and shake it vigorously for 10 seconds. Tap the liquid back into the base of the ampule and set down until ready to use.
2. Enter User ID (optional) at the display prompt on the IRMA TRUpoint Analyzer.
3. Initiate the Quality Control Test Sequence.
4. Open the foil pouch and remove the cartridge.
5. Remove the protective tape from the cartridge.
6. Insert the cartridge into the analyzer.
7. Verify or enter the cartridge information at the display prompt.
8. Select the control from the list of established controls.
9. After calibration is complete, carefully snap open the control ampule.
To avoid cuts, protect your fingers with tissue or gloves, or use an ampule breaker.
10. Slowly draw the control sample into a 1 mL or 3 mL syringe using an 18-20 gauge needle.
11. Do not attempt to invert the syringe or expel bubbles from the syringe after drawing up the control solution.
12. Remove the needle, inject the control into the cartridge using a minimum of 0.8 mL of the control sample in a 1.0 mL syringe or a minimum of 1.5 mL of the control sample in a 3.0 mL syringe and press “test” to initiate the analysis.
Expected Analyzer Performance
The values on the Expected Values Chart are based on the results of multiple sample analysis. Samples were introduced using a 1 cc syringe, with an 18 gauge needle, after cartridge equilibration at 22°C (72°F) for a minimum of 8 hours.
Use the expected values for each parameter as a guide in evaluating performance. Since performance is subject to sample temperature and environmental barometric pressure, ITC recommends that each institution establish its own expected values and acceptable limits. The mean values established at your institution should fall within the expected ranges.
Notes and Limitations
In establishing the values shown on the Expected Values Chart, samples were analyzed after equilibration at 22°C (72°F) for a minimum of 8 hours. The pCO2 and pO2 values vary inversely with temperature by approximately one percent per degree Celsius. Refer to Temperature Correction for information to adjust pCO2 and pO2 ranges for operating outside of the 21-23°C temperature range.
In establishing the values shown in Expected Values, samples are analyzed at approximately 760 mmHg. The pO2 values decrease by approximately 2.3% per 100 mmHg and the pCO2 values decrease by 1% at the same atmospheric conditions.4
Temperature Correction
It has been reported the pCO2 and pO2 results were inversely affected by temperature.2,3 If your laboratory routinely operates in the 18-20°C (64-68°F) or 24-25°C (75-77°F) range or experiences seasonal variations in temperature, you can adjust the ranges to account for these temperature effects, as shown below.
For example, if your room temperature is typically 24-25°C and the range in the Expected Values Chart for pO2, Level 3 is 135.0 – 155.0 , you can adjust the range as follows:
Adjusted range = 131.2 – 151.2 Temperature Correction for pCO2 and pO2 Level 18-20°C 21-23°C 24-25°C
pCO2 1 + 2.2 no change - 1.8
pO2 1 + 2.5 no change - 2.1
pO2 2 + 3.5 no change - 3.0
pO2 3 + 4.6 no change - 3.8
References 1. Moran RF. Assessment of quality control
of blood gas/pH analyzer performance. Respiratory Care 1981 (June).
2. Maas AHV. Evaluation of ampouled tonometered buffer solutions as a quality-control system for pH, pCO2 and pO2 measurement. Clin Chem 1977; 23(9): 1718-25.
3. Battino R, Rettich TR, Tominaga T. The solubility of oxygen and ozone in liquids. J of Phys Chem Ref Data 1983; 12(2): 163-178.
4. Burnett RW and Itano M. An interlaboratory study of blood-gas analysis: Dependence of pO2 and pCO2 results on atmospheric pressure. Clin Chem 1989; 35(8): 1779-1781.
KIT LOT#002999 LEVEL 1 LOT 00219 LEVEL 2 LOT 00319 LEVEL 3 LOT 00419
EXP. 03/14
I R M A T R U p o i n t ® Q U A L I T Y C O N T R O L
F o r u s e w i t h t h e R N A M e d i c a l , I n c . QC 623 Blood Gas/Electrolyte Controls
The IRMA TRUpoint quality control sheets with bar codes are designed to be used with the IRMA TRUpoint scanner. If you are unable to scan the bar codes after printing please manually input the ranges accordingly. For questions please contact ITC technical support services at 800-631-5945 or 732-548-5700. Quality Control 623 CC_mmHg
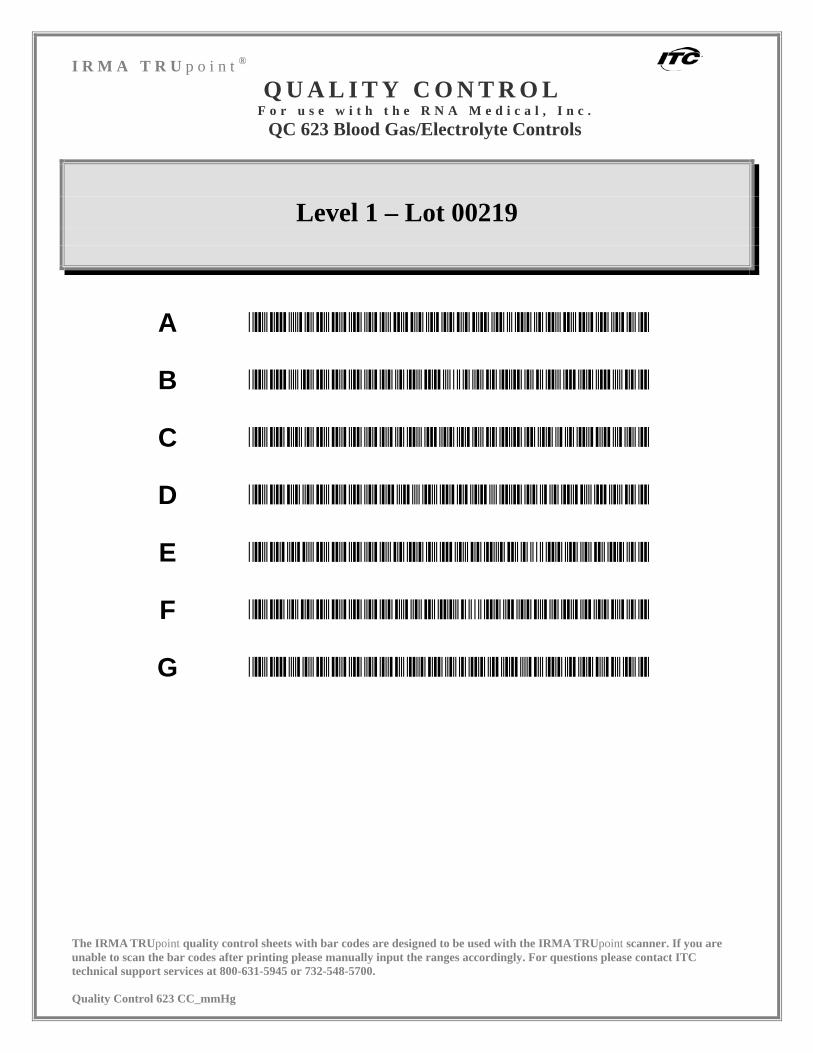
Level 1 – Lot 00219
A *43D00219061955CC*1*00219*
B *437002191*03/14*PH*7.134*
C *45A002192*7.194*PCO2*63.*
D *4510021933*79.3*PO2*67.4*
E *426002194*87.4*NA+*110*1*
F *41400219520*K+*1.52*2.52*
G *439002196*ICA*1.36*1.56**
I R M A T R U p o i n t ® Q U A L I T Y C O N T R O L
F o r u s e w i t h t h e R N A M e d i c a l , I n c . QC 623 Blood Gas/Electrolyte Controls
The IRMA TRUpoint quality control sheets with bar codes are designed to be used with the IRMA TRUpoint scanner. If you are unable to scan the bar codes after printing please manually input the ranges accordingly. For questions please contact ITC technical support services at 800-631-5945 or 732-548-5700. Quality Control 623 CC_mmHg
Level 2 – Lot 00319
A *45300319071BB1CC*2*00319*
B *43E003191*03/14*PH*7.392*
C *45A003192*7.452*PCO2*38.*
D *4580031936*48.6*PO2*99.3*
E *42F003194*119.3*NA+*129.*
F *4310031958*139.8*K+*3.87*
G *43D003196*4.87*ICA*1.05**
H *2240031971.25**
I R M A T R U p o i n t ® Q U A L I T Y C O N T R O L
F o r u s e w i t h t h e R N A M e d i c a l , I n c . QC 623 Blood Gas/Electrolyte Controls
The IRMA TRUpoint quality control sheets with bar codes are designed to be used with the IRMA TRUpoint scanner. If you are unable to scan the bar codes after printing please manually input the ranges accordingly. For questions please contact ITC technical support services at 800-631-5945 or 732-548-5700. Quality Control 623 CC_mmHg
Level 3 – Lot 00419
A *46A00419071BCDCC*3*00419*
B *446004191*03/14*PH*7.669*
C *45A004192*7.729*PCO2*12.*
D *43E0041933*22.3*PO2*134.*
E *42B0041941*154.1*NA+*160*
F *41D004195.4*170.4*K+*5.7*
G *4540041969*6.79*ICA*0.46*
H *253004197*0.66**
I R M A T R U p o i n t ® Q U A L I T Y C O N T R O L
F o r u s e w i t h t h e R N A M e d i c a l , I n c . QC 623 Blood Gas/Electrolyte Controls
The IRMA TRUpoint quality control sheets with bar codes are designed to be used with the IRMA TRUpoint scanner. If you are unable to scan the bar codes after printing please manually input the ranges accordingly. For questions please contact ITC technical support services at 800-631-5945 or 732-548-5700. Quality Control 623 CC_kPa
For use with CC, BG, and H3 Cartridges The attached bar codes are to be used with your IRMA TRUpoint scanner*
For Software 3.0.11 and higher.
Please refer to the package insert for specific information about this control material.
Introduction & Intended Use
With the IRMA TRUpoint Blood Analysis System, Quality Control can be performed through two methods: electronic and liquid controls.
It is important to follow RNA’s recommended procedures for storage and equilibration of the control material prior to analysis on the IRMA TRUpoint Analyzer.
Instructions for Use
Equilibrate ampules at room temperature (18-25°C) for at least 8 hours before use.
1. Hold the ampule by its tip and shake it vigorously for 10 seconds. Tap the liquid back into the base of the ampule and set down until ready to use.
2. Enter User ID (optional) at the display prompt on the IRMA TRUpoint Analyzer.
3. Initiate the Quality Control Test Sequence.
4. Open the foil pouch and remove the cartridge.
5. Remove the protective tape from the cartridge.
6. Insert the cartridge into the analyzer.
7. Verify or enter the cartridge information at the display prompt.
8. Select the control from the list of established controls.
9. After calibration is complete, carefully snap open the control ampule.
To avoid cuts, protect your fingers with tissue or gloves, or use an ampule breaker.
10. Slowly draw the control sample into a 1 mL or 3 mL syringe using an 18-20 gauge needle.
11. Do not attempt to invert the syringe or expel bubbles from the syringe after drawing up the control solution.
12. Remove the needle, inject the control into the cartridge using a minimum of 0.8 mL of the control sample in a 1.0 mL syringe or a minimum of 1.5 mL of the control sample in a 3.0 mL syringe and press “test” to initiate the analysis.
Expected Analyzer Performance
The values on the Expected Values Chart are based on the results of multiple sample analysis. Samples were introduced using a 1 cc syringe, with an 18 gauge needle, after cartridge equilibration at 22°C (72°F) for a minimum of 8 hours.
Use the expected values for each parameter as a guide in evaluating performance. Since performance is subject to sample temperature and environmental barometric pressure, ITC recommends that each institution establish its own expected values and acceptable limits. The mean values established at your institution should fall within the expected ranges.
Notes and Limitations
In establishing the values shown on the Expected Values Chart, samples were analyzed after equilibration at 22°C (72°F) for a minimum of 8 hours. The pCO2 and pO2 values vary inversely with temperature by approximately one percent per degree Celsius. Refer to Temperature Correction for information to adjust pCO2 and pO2 ranges for operating outside of the 21-23°C temperature range.
In establishing the values shown in Expected Values, samples are analyzed at approximately 760 mmHg. The pO2 values decrease by approximately 2.3% per 100 mmHg and the pCO2 values decrease by 1% at the same atmospheric conditions.4
Temperature Correction
It has been reported the pCO2 and pO2 results were inversely affected by temperature.2,3 If your laboratory routinely operates in the 18-20°C (64-68°F) or 24-25°C (75-77°F) range or experiences seasonal variations in temperature, you can adjust the ranges to account for these temperature effects, as shown below.
For example, if your room temperature is typically 24-25°C and the range in the Expected Values Chart for pO2, Level 3 is 20.3-23.0, you can adjust the range as follows:
Lower limit: 20.3 - 0.51 = 19.79 Upper limit: 23.0 - 0.51 = 22.49 Adjusted range = 19.79 - 22.49 Temperature Correction for pCO2 and pO2 Level 18-20°C 21-23°C 24-25°C
pCO2 1 + .29 no change - .24
pO2 1 + .33 no change - .28
pO2 2 + .47 no change - .40
pO2 3 + .61 no change - .51
References 1. Moran RF. Assessment of quality control
of blood gas/pH analyzer performance. Respiratory Care 1981 (June).
2. Maas AHV. Evaluation of ampouled tonometered buffer solutions as a quality-control system for pH, pCO2 and pO2 measurement. Clin Chem 1977; 23(9): 1718-25.
3. Battino R, Rettich TR, Tominaga T. The solubility of oxygen and ozone in liquids. J of Phys Chem Ref Data 1983; 12(2): 163-178.
4. Burnett RW and Itano M. An interlaboratory study of blood-gas analysis: Dependence of pO2 and pCO2 results on atmospheric pressure. Clin Chem 1989; 35(8): 1779-1781.
KIT LOT# 002999 LEVEL 1 LOT 00219 LEVEL 2 LOT 00319 LEVEL 3 LOT 00419
EXP. 03/14
I R M A T R U p o i n t ® Q U A L I T Y C O N T R O L
F o r u s e w i t h t h e R N A M e d i c a l , I n c . QC 623 Blood Gas/Electrolyte Controls
The IRMA TRUpoint quality control sheets with bar codes are designed to be used with the IRMA TRUpoint scanner. If you are unable to scan the bar codes after printing please manually input the ranges accordingly. For questions please contact ITC technical support services at 800-631-5945 or 732-548-5700. Quality Control 623 CC_kPa
Level 1 – Lot 00219
A *43D00219061955CC*1*00219*
B *437002191*03/14*PH*7.134*
C *45A002192*7.194*PCO2*63.*
D *4510021933*79.3*PO2*67.4*
E *426002194*87.4*NA+*110*1*
F *41400219520*K+*1.52*2.52*
G *439002196*ICA*1.36*1.56**
I R M A T R U p o i n t ® Q U A L I T Y C O N T R O L
F o r u s e w i t h t h e R N A M e d i c a l , I n c . QC 623 Blood Gas/Electrolyte Controls
The IRMA TRUpoint quality control sheets with bar codes are designed to be used with the IRMA TRUpoint scanner. If you are unable to scan the bar codes after printing please manually input the ranges accordingly. For questions please contact ITC technical support services at 800-631-5945 or 732-548-5700. Quality Control 623 CC_kPa
Level 2 – Lot 00319
A *45300319071BB1CC*2*00319*
B *43E003191*03/14*PH*7.392*
C *45A003192*7.452*PCO2*38.*
D *4580031936*48.6*PO2*99.3*
E *42F003194*119.3*NA+*129.*
F *4310031958*139.8*K+*3.87*
G *43D003196*4.87*ICA*1.05**
H *2240031971.25**
I R M A T R U p o i n t ® Q U A L I T Y C O N T R O L
F o r u s e w i t h t h e R N A M e d i c a l , I n c . QC 623 Blood Gas/Electrolyte Controls
The IRMA TRUpoint quality control sheets with bar codes are designed to be used with the IRMA TRUpoint scanner. If you are unable to scan the bar codes after printing please manually input the ranges accordingly. For questions please contact ITC technical support services at 800-631-5945 or 732-548-5700. Quality Control 623 CC_kPa
Level 3 – Lot 00419
A *46A00419071BCDCC*3*00419*
B *446004191*03/14*PH*7.669*
C *45A004192*7.729*PCO2*12.*
D *43E0041933*22.3*PO2*134.*
E *42B0041941*154.1*NA+*160*
F *41D004195.4*170.4*K+*5.7*
G *4540041969*6.79*ICA*0.46*
H *253004197*0.66**
I R M A T R U p o i n t ® Q U A L I T Y C O N T R O L
F o r u s e w i t h t h e R N A M e d i c a l , I n c . QC 623 Blood Gas/Electrolyte Controls
The IRMA TRUpoint quality control sheets with bar codes are designed to be used with the IRMA TRUpoint scanner. If you are unable to scan the bar codes after printing please manually input the ranges accordingly. For questions please contact ITC technical support services at 800-631-5945 or 732-548-5700. Quality Control 623 CC_mmHg_002000
For use with CC, BG, and H3 Cartridges The attached bar codes are to be used with your IRMA TRUpoint scanner*
For Software 3.0.11 and higher.
Please refer to the package insert for specific information about this control material.
Introduction & Intended Use
With the IRMA TRUpoint Blood Analysis System, Quality Control can be performed through two methods: electronic and liquid controls.
It is important to follow RNA’s recommended procedures for storage and equilibration of the control material prior to analysis on the IRMA TRUpoint Analyzer.
Instructions for Use
Equilibrate ampules at room temperature (18-25°C) for at least 8 hours before use.
1. Hold the ampule by its tip and shake it vigorously for 10 seconds. Tap the liquid back into the base of the ampule and set down until ready to use.
2. Enter User ID (optional) at the display prompt on the IRMA TRUpoint Analyzer.
3. Initiate the Quality Control Test Sequence.
4. Open the foil pouch and remove the cartridge.
5. Remove the protective tape from the cartridge.
6. Insert the cartridge into the analyzer.
7. Verify or enter the cartridge information at the display prompt.
8. Select the control from the list of established controls.
9. After calibration is complete, carefully snap open the control ampule.
To avoid cuts, protect your fingers with tissue or gloves, or use an ampule breaker.
10. Slowly draw the control sample into a 1 mL or 3 mL syringe using an 18-20 gauge needle.
11. Do not attempt to invert the syringe or expel bubbles from the syringe after drawing up the control solution.
12. Remove the needle, inject the control into the cartridge using a minimum of 0.8 mL of the control sample in a 1.0 mL syringe or a minimum of 1.5 mL of the control sample in a 3.0 mL syringe and press “test” to initiate the analysis.
Expected Analyzer Performance
The values on the Expected Values Chart are based on the results of multiple sample analysis. Samples were introduced using a 1 cc syringe, with an 18 gauge needle, after cartridge equilibration at 22°C (72°F) for a minimum of 8 hours.
Use the expected values for each parameter as a guide in evaluating performance. Since performance is subject to sample temperature and environmental barometric pressure, ITC recommends that each institution establish its own expected values and acceptable limits. The mean values established at your institution should fall within the expected ranges.
Notes and Limitations
In establishing the values shown on the Expected Values Chart, samples were analyzed after equilibration at 22°C (72°F) for a minimum of 8 hours. The pCO2 and pO2 values vary inversely with temperature by approximately one percent per degree Celsius. Refer to Temperature Correction for information to adjust pCO2 and pO2 ranges for operating outside of the 21-23°C temperature range.
In establishing the values shown in Expected Values, samples are analyzed at approximately 760 mmHg. The pO2 values decrease by approximately 2.3% per 100 mmHg and the pCO2 values decrease by 1% at the same atmospheric conditions.4
Temperature Correction
It has been reported the pCO2 and pO2 results were inversely affected by temperature.2,3 If your laboratory routinely operates in the 18-20°C (64-68°F) or 24-25°C (75-77°F) range or experiences seasonal variations in temperature, you can adjust the ranges to account for these temperature effects, as shown below.
For example, if your room temperature is typically 24-25°C and the range in the Expected Values Chart for pO2, Level 3 is 135.0 – 155.0 , you can adjust the range as follows:
Adjusted range = 131.2 – 151.2 Temperature Correction for pCO2 and pO2 Level 18-20°C 21-23°C 24-25°C
pCO2 1 + 2.2 no change - 1.8
pO2 1 + 2.5 no change - 2.1
pO2 2 + 3.5 no change - 3.0
pO2 3 + 4.6 no change - 3.8
References 1. Moran RF. Assessment of quality control
of blood gas/pH analyzer performance. Respiratory Care 1981 (June).
2. Maas AHV. Evaluation of ampouled tonometered buffer solutions as a quality-control system for pH, pCO2 and pO2 measurement. Clin Chem 1977; 23(9): 1718-25.
3. Battino R, Rettich TR, Tominaga T. The solubility of oxygen and ozone in liquids. J of Phys Chem Ref Data 1983; 12(2): 163-178.
4. Burnett RW and Itano M. An interlaboratory study of blood-gas analysis: Dependence of pO2 and pCO2 results on atmospheric pressure. Clin Chem 1989; 35(8): 1779-1781.
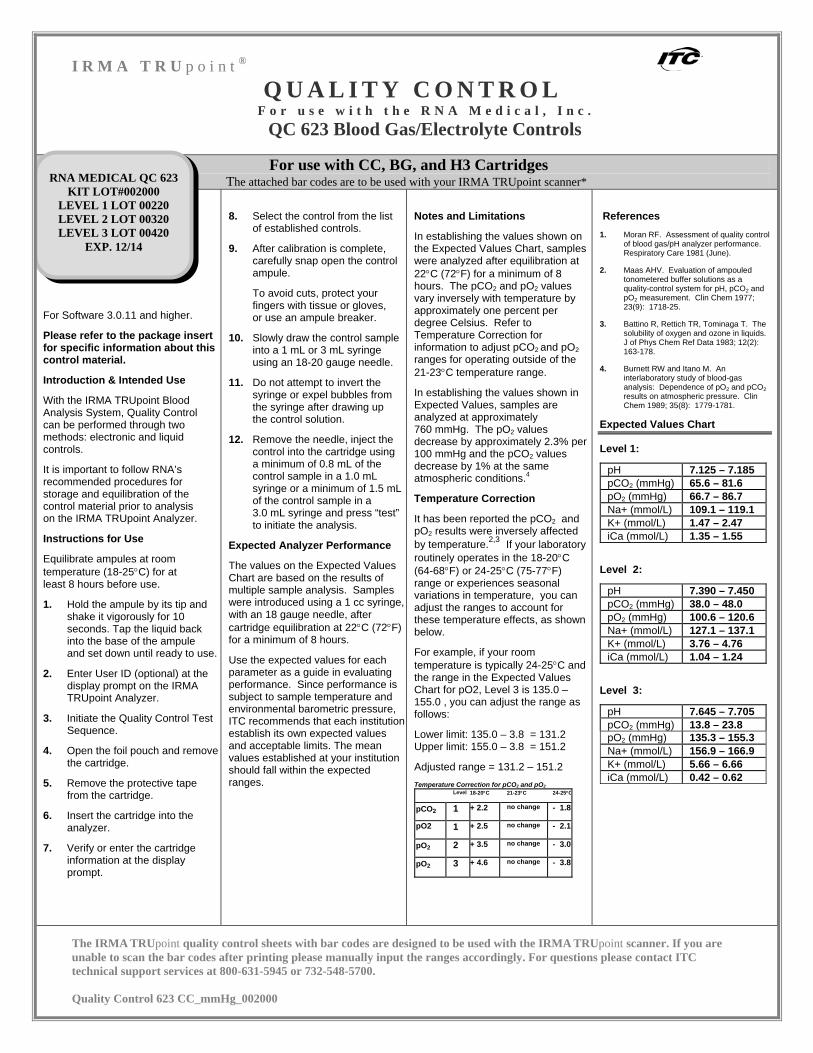
KIT LOT#002000 LEVEL 1 LOT 00220 LEVEL 2 LOT 00320 LEVEL 3 LOT 00420
EXP. 12/14
I R M A T R U p o i n t ® Q U A L I T Y C O N T R O L
F o r u s e w i t h t h e R N A M e d i c a l , I n c . QC 623 Blood Gas/Electrolyte Controls
The IRMA TRUpoint quality control sheets with bar codes are designed to be used with the IRMA TRUpoint scanner. If you are unable to scan the bar codes after printing please manually input the ranges accordingly. For questions please contact ITC technical support services at 800-631-5945 or 732-548-5700. Quality Control 623 CC_mmHg_002000
Level 1 – Lot 00220
A *43800220071B29CC*1*00220*
B *42F002201*12/14*PH*7.125*
C *454002202*7.185*PCO2*65.*
D *44A0022036*81.6*PO2*66.7*
E *42C002204*86.7*NA+*109.1*
F *40B002205*119.1*K+*1.47**
G *4380022062.47*ICA*1.35*1*
H *1ED002207.55**
I R M A T R U p o i n t ® Q U A L I T Y C O N T R O L
F o r u s e w i t h t h e R N A M e d i c a l , I n c . QC 623 Blood Gas/Electrolyte Controls
The IRMA TRUpoint quality control sheets with bar codes are designed to be used with the IRMA TRUpoint scanner. If you are unable to scan the bar codes after printing please manually input the ranges accordingly. For questions please contact ITC technical support services at 800-631-5945 or 732-548-5700. Quality Control 623 CC_mmHg_002000
Level 2 – Lot 00320
A *42E00320061926CC*2*00320*
B *42E003201*12/14*PH*7.39**
C *45E0032027.45*PCO2*38*48*
D *42D003203*PO2*100.6*120.*
E *42B0032046*NA+*127.1*137*
F *41A003205.1*K+*3.76*4.76*
G *428003206*ICA*1.04*1.24**
I R M A T R U p o i n t ® Q U A L I T Y C O N T R O L
F o r u s e w i t h t h e R N A M e d i c a l , I n c . QC 623 Blood Gas/Electrolyte Controls
The IRMA TRUpoint quality control sheets with bar codes are designed to be used with the IRMA TRUpoint scanner. If you are unable to scan the bar codes after printing please manually input the ranges accordingly. For questions please contact ITC technical support services at 800-631-5945 or 732-548-5700. Quality Control 623 CC_mmHg_002000
Level 3 – Lot 00420
A *45200420071B9FCC*3*00420*
B *438004201*12/14*PH*7.645*
C *44D004202*7.705*PCO2*13.*
D *4420042038*23.8*PO2*135.*
E *42D0042043*155.3*NA+*156*
F *423004205.9*166.9*K+*5.6*
G *4410042066*6.66*ICA*0.42*
H *247004207*0.62**
I R M A T R U p o i n t ® Q U A L I T Y C O N T R O L
F o r u s e w i t h t h e R N A M e d i c a l , I n c . QC 623 Blood Gas/Electrolyte Controls
The IRMA TRUpoint quality control sheets with bar codes are designed to be used with the IRMA TRUpoint scanner. If you are unable to scan the bar codes after printing please manually input the ranges accordingly. For questions please contact ITC technical support services at 800-631-5945 or 732-548-5700. Quality Control 623_CC_kPa_00200
For use with CC, BG, and H3 Cartridges The attached bar codes are to be used with your IRMA TRUpoint scanner*
For Software 3.0.11 and higher.
Please refer to the package insert for specific information about this control material.
Introduction & Intended Use
With the IRMA TRUpoint Blood Analysis System, Quality Control can be performed through two methods: electronic and liquid controls.
It is important to follow RNA’s recommended procedures for storage and equilibration of the control material prior to analysis on the IRMA TRUpoint Analyzer.
Instructions for Use
Equilibrate ampules at room temperature (18-25°C) for at least 8 hours before use.
1. Hold the ampule by its tip and shake it vigorously for 10 seconds. Tap the liquid back into the base of the ampule and set down until ready to use.
2. Enter User ID (optional) at the display prompt on the IRMA TRUpoint Analyzer.
3. Initiate the Quality Control Test Sequence.
4. Open the foil pouch and remove the cartridge.
5. Remove the protective tape from the cartridge.
6. Insert the cartridge into the analyzer.
7. Verify or enter the cartridge information at the display prompt.
8. Select the control from the list of established controls.
9. After calibration is complete, carefully snap open the control ampule.
To avoid cuts, protect your fingers with tissue or gloves, or use an ampule breaker.
10. Slowly draw the control sample into a 1 mL or 3 mL syringe using an 18-20 gauge needle.
11. Do not attempt to invert the syringe or expel bubbles from the syringe after drawing up the control solution.
12. Remove the needle, inject the control into the cartridge using a minimum of 0.8 mL of the control sample in a 1.0 mL syringe or a minimum of 1.5 mL of the control sample in a 3.0 mL syringe and press “test” to initiate the analysis.
Expected Analyzer Performance
The values on the Expected Values Chart are based on the results of multiple sample analysis. Samples were introduced using a 1 cc syringe, with an 18 gauge needle, after cartridge equilibration at 22°C (72°F) for a minimum of 8 hours.
Use the expected values for each parameter as a guide in evaluating performance. Since performance is subject to sample temperature and environmental barometric pressure, ITC recommends that each institution establish its own expected values and acceptable limits. The mean values established at your institution should fall within the expected ranges.
Notes and Limitations
In establishing the values shown on the Expected Values Chart, samples were analyzed after equilibration at 22°C (72°F) for a minimum of 8 hours. The pCO2 and pO2 values vary inversely with temperature by approximately one percent per degree Celsius. Refer to Temperature Correction for information to adjust pCO2 and pO2 ranges for operating outside of the 21-23°C temperature range.
In establishing the values shown in Expected Values, samples are analyzed at approximately 760 mmHg. The pO2 values decrease by approximately 2.3% per 100 mmHg and the pCO2 values decrease by 1% at the same atmospheric conditions.4
Temperature Correction
It has been reported the pCO2 and pO2 results were inversely affected by temperature.2,3 If your laboratory routinely operates in the 18-20°C (64-68°F) or 24-25°C (75-77°F) range or experiences seasonal variations in temperature, you can adjust the ranges to account for these temperature effects, as shown below.
For example, if your room temperature is typically 24-25°C and the range in the Expected Values Chart for pO2, Level 3 is 20.3-23.0, you can adjust the range as follows:
Lower limit: 20.3 - 0.51 = 19.79 Upper limit: 23.0 - 0.51 = 22.49 Adjusted range = 19.79 - 22.49 Temperature Correction for pCO2 and pO2 Level 18-20°C 21-23°C 24-25°C
pCO2 1 + .29 no change - .24
pO2 1 + .33 no change - .28
pO2 2 + .47 no change - .40
pO2 3 + .61 no change - .51
References 1. Moran RF. Assessment of quality control
of blood gas/pH analyzer performance. Respiratory Care 1981 (June).
2. Maas AHV. Evaluation of ampouled tonometered buffer solutions as a quality-control system for pH, pCO2 and pO2 measurement. Clin Chem 1977; 23(9): 1718-25.
3. Battino R, Rettich TR, Tominaga T. The solubility of oxygen and ozone in liquids. J of Phys Chem Ref Data 1983; 12(2): 163-178.
4. Burnett RW and Itano M. An interlaboratory study of blood-gas analysis: Dependence of pO2 and pCO2 results on atmospheric pressure. Clin Chem 1989; 35(8): 1779-1781.
KIT LOT# 002000 LEVEL 1 LOT 00220 LEVEL 2 LOT 00320 LEVEL 3 LOT 00420
EXP. 12/14
I R M A T R U p o i n t ® Q U A L I T Y C O N T R O L
F o r u s e w i t h t h e R N A M e d i c a l , I n c . QC 623 Blood Gas/Electrolyte Controls
The IRMA TRUpoint quality control sheets with bar codes are designed to be used with the IRMA TRUpoint scanner. If you are unable to scan the bar codes after printing please manually input the ranges accordingly. For questions please contact ITC technical support services at 800-631-5945 or 732-548-5700. Quality Control 623_CC_kPa_00200
Level 1 – Lot 00220
A *43800220071B29CC*1*00220*
B *42F002201*12/14*PH*7.125*
C *454002202*7.185*PCO2*65.*
D *44A0022036*81.6*PO2*66.7*
E *42C002204*86.7*NA+*109.1*
F *40B002205*119.1*K+*1.47**
G *4380022062.47*ICA*1.35*1*
H *1ED002207.55**
I R M A T R U p o i n t ® Q U A L I T Y C O N T R O L
F o r u s e w i t h t h e R N A M e d i c a l , I n c . QC 623 Blood Gas/Electrolyte Controls
The IRMA TRUpoint quality control sheets with bar codes are designed to be used with the IRMA TRUpoint scanner. If you are unable to scan the bar codes after printing please manually input the ranges accordingly. For questions please contact ITC technical support services at 800-631-5945 or 732-548-5700. Quality Control 623_CC_kPa_00200
Level 2 – Lot 00320
A *42E00320061926CC*2*00320*
B *42E003201*12/14*PH*7.39**
C *45E0032027.45*PCO2*38*48*
D *42D003203*PO2*100.6*120.*
E *42B0032046*NA+*127.1*137*
F *41A003205.1*K+*3.76*4.76*
G *428003206*ICA*1.04*1.24**
I R M A T R U p o i n t ® Q U A L I T Y C O N T R O L
F o r u s e w i t h t h e R N A M e d i c a l , I n c . QC 623 Blood Gas/Electrolyte Controls
The IRMA TRUpoint quality control sheets with bar codes are designed to be used with the IRMA TRUpoint scanner. If you are unable to scan the bar codes after printing please manually input the ranges accordingly. For questions please contact ITC technical support services at 800-631-5945 or 732-548-5700. Quality Control 623_CC_kPa_00200
Level 3 – Lot 00420
A *45200420071B9FCC*3*00420*
B *438004201*12/14*PH*7.645*
C *44D004202*7.705*PCO2*13.*
D *4420042038*23.8*PO2*135.*
E *42D0042043*155.3*NA+*156*
F *423004205.9*166.9*K+*5.6*
G *4410042066*6.66*ICA*0.42*
H *247004207*0.62**
I R M A T R U p o i n t®
Q U A L I T Y C O N T R O L F o r u s e w i t h t h e R N A M e d i c a l , I n c .
QC 623 Blood Gas/Electrolyte Controls
The IRMA TRUpoint quality control sheets with bar codes are designed to be used with the IRMA TRUpoint scanner. If you are
unable to scan the bar codes after printing please manually input the ranges accordingly. For questions please contact ITC
technical support services at 800-631-5945 or 732-548-5700.
Quality Control 623 CC_kPa
For use with CC, BG, and H3 Cartridges The attached bar codes are to be used with your IRMA TRUpoint scanner*
For Software 3.0.11 and higher.
Please refer to the package insert for specific information about this control material.
Introduction & Intended Use
With the IRMA TRUpoint Blood Analysis System, Quality Control can be performed through two methods: electronic and liquid controls.
It is important to follow RNA’s recommended procedures for storage and equilibration of the control material prior to analysis on the IRMA TRUpoint Analyzer.
Instructions for Use
Equilibrate ampules at room
temperature (18-25°C) for at least 8 hours before use.
1. Hold the ampule by its tip and shake it vigorously for 10 seconds. Tap the liquid back into the base of the ampule and set down until ready to use.
2. Enter User ID (optional) at the display prompt on the IRMA TRUpoint Analyzer.
3. Initiate the Quality Control Test Sequence.
4. Open the foil pouch and remove the cartridge.
5. Remove the protective tape from the cartridge.
6. Insert the cartridge into the analyzer.
7. Verify or enter the cartridge information at the display prompt.
8. Select the control from the list of established controls.
9. After calibration is complete, carefully snap open the control ampule.
To avoid cuts, protect your fingers with tissue or gloves, or use an ampule breaker.
10. Slowly draw the control sample into a 1 mL or 3 mL syringe using an 18-20 gauge needle.
11. Do not attempt to invert the syringe or expel bubbles from the syringe after drawing up the control solution.
12. Remove the needle, inject the control into the cartridge using a minimum of 0.8 mL of the control sample in a 1.0 mL syringe or a minimum of 1.5 mL of the control sample in a 3.0 mL syringe and press “test” to initiate the analysis.
Expected Analyzer Performance
The values on the Expected Values Chart are based on the results of multiple sample analysis. Samples were introduced using a 1 cc syringe, with an 18 gauge needle, after
cartridge equilibration at 22°C (72°F) for a minimum of 8 hours.
Use the expected values for each parameter as a guide in evaluating performance. Since performance is subject to sample temperature and environmental barometric pressure, ITC recommends that each institution establish its own expected values and acceptable limits. The mean values established at your institution should fall within the expected ranges.
Notes and Limitations
In establishing the values shown on the Expected Values Chart, samples were analyzed after equilibration at
22°C (72°F) for a minimum of 8 hours. The pCO2 and pO2 values vary inversely with temperature by approximately one percent per degree Celsius. Refer to Temperature Correction for information to adjust pCO2 and pO2 ranges for operating outside of the
21-23°C temperature range.
In establishing the values shown in Expected Values, samples are analyzed at approximately 760 mmHg. The pO2 values decrease by approximately 2.3% per 100 mmHg and the pCO2 values decrease by 1% at the same atmospheric conditions.
4
Temperature Correction
It has been reported the pCO2 and pO2 results were inversely affected
by temperature.2,3
If your laboratory
routinely operates in the 18-20°C
(64-68°F) or 24-25°C (75-77°F) range or experiences seasonal variations in temperature, you can adjust the ranges to account for these temperature effects, as shown below.
For example, if your room
temperature is typically 24-25°C and the range in the Expected Values Chart for pO2, Level 3 is 20.3-23.0, you can adjust the range as follows:
1. Moran RF. Assessment of quality control of blood gas/pH analyzer performance. Respiratory Care 1981 (June).
2. Maas AHV. Evaluation of ampouled tonometered buffer solutions as a quality-control system for pH, pCO2 and pO2 measurement. Clin Chem 1977; 23(9): 1718-25.
3. Battino R, Rettich TR, Tominaga T. The solubility of oxygen and ozone in liquids. J of Phys Chem Ref Data 1983; 12(2): 163-178.
4. Burnett RW and Itano M. An interlaboratory study of blood-gas analysis: Dependence of pO2 and pCO2 results on atmospheric pressure. Clin Chem 1989; 35(8): 1779-1781.
Expected Values Chart
Level 1:
pH 7.127 – 7.187
pCO2 (kPa) 8.72 – 10.85
pO2 (kPa) 8.16 – 10.83
Na+ (mmol/L) 109.6 – 119.6
K+ (mmol/L) 1.49 – 2.49
iCa (mmol/L) 1.35 – 1.55
Level 2:
pH 7.403 – 7.463
pCO2 (kPa) 5.12 – 6.45
pO2 (kPa) 13.60 – 16.27
Na+ (mmol/L) 129.4 – 139.4
K+ (mmol/L) 3.82 – 4.82
iCa (mmol/L) 1.00 – 1.20
Level 3:
pH 7.654 – 7.714
pCO2 (kPa) 1.80 – 3.13
pO2 (kPa) 18.12 – 20.78
Na+ (mmol/L) 157.6 – 167.6
K+ (mmol/L) 5.68 – 6.68
iCa (mmol/L) 0.43 – 0.63
RNA MEDICAL QC 623
LEVEL 1 LOT 10221
LEVEL 2 LOT 10321
LEVEL 3 LOT 10421
EXP. 05/15
I R M A T R U p o i n t®
Q U A L I T Y C O N T R O L F o r u s e w i t h t h e R N A M e d i c a l , I n c .
QC 623 Blood Gas/Electrolyte Controls
The IRMA TRUpoint quality control sheets with bar codes are designed to be used with the IRMA TRUpoint scanner. If you are
unable to scan the bar codes after printing please manually input the ranges accordingly. For questions please contact ITC
technical support services at 800-631-5945 or 732-548-5700.
Quality Control 623 CC_kPa
Level 1 – Lot 10221
A *43810221071B34CC*1*10221*
B *436102211*05/15*PH*7.127*
C *458102212*7.187*PCO2*65.*
D *43E1022134*81.4*PO2*61.2*
E *429102214*81.2*NA+*109.6*
F *414102215*119.6*K+*1.49**
G *43C1022162.49*ICA*1.35*1*
H *1EF102217.55**
I R M A T R U p o i n t®
Q U A L I T Y C O N T R O L F o r u s e w i t h t h e R N A M e d i c a l , I n c .
QC 623 Blood Gas/Electrolyte Controls
The IRMA TRUpoint quality control sheets with bar codes are designed to be used with the IRMA TRUpoint scanner. If you are
unable to scan the bar codes after printing please manually input the ranges accordingly. For questions please contact ITC
technical support services at 800-631-5945 or 732-548-5700.
Quality Control 623 CC_kPa
Level 2 – Lot 10321
A *43F103210618D2CC*2*10321*
B *434103211*05/15*PH*7.403*
C *456103212*7.463*PCO2*38.*
D *4381032134*48.4*PO2*102**
E *427103214122*NA+*129.4*1*
F *41B10321539.4*K+*3.82*4.*
G *3CE10321682*ICA*1*1.2**
I R M A T R U p o i n t®
Q U A L I T Y C O N T R O L F o r u s e w i t h t h e R N A M e d i c a l , I n c .
QC 623 Blood Gas/Electrolyte Controls
The IRMA TRUpoint quality control sheets with bar codes are designed to be used with the IRMA TRUpoint scanner. If you are
unable to scan the bar codes after printing please manually input the ranges accordingly. For questions please contact ITC
technical support services at 800-631-5945 or 732-548-5700.
Quality Control 623 CC_kPa
Level 3 – Lot 10421
A *45110421071BB8CC*3*10421*
B *43D104211*05/15*PH*7.654*
C *44F104212*7.714*PCO2*13.*
D *43E1042135*23.5*PO2*135.*
E *43C1042149*155.9*NA+*157*
F *420104215.6*167.6*K+*5.6*
G *4481042168*6.68*ICA*0.43*
H *24A104217*0.63**
I R M A T R U p o i n t®
Q U A L I T Y C O N T R O L F o r u s e w i t h t h e R N A M e d i c a l , I n c .
QC 623 Blood Gas/Electrolyte Controls
The IRMA TRUpoint quality control sheets with bar codes are designed to be used with the IRMA TRUpoint scanner. If you are
unable to scan the bar codes after printing please manually input the ranges accordingly. For questions please contact ITC
technical support services at 800-631-5945 or 732-548-5700.
Quality Control 623 CC_mmHg
For use with CC, BG, and H3 Cartridges The attached bar codes are to be used with your IRMA TRUpoint scanner*
For Software 3.0.11 and higher.
Please refer to the package insert for specific information about this control material.
Introduction & Intended Use
With the IRMA TRUpoint Blood Analysis System, Quality Control can be performed through two methods: electronic and liquid controls.
It is important to follow RNA’s recommended procedures for storage and equilibration of the control material prior to analysis on the IRMA TRUpoint Analyzer.
Instructions for Use
Equilibrate ampules at room
temperature (18-25°C) for at least 8 hours before use.
1. Hold the ampule by its tip and shake it vigorously for 10 seconds. Tap the liquid back into the base of the ampule and set down until ready to use.
2. Enter User ID (optional) at the display prompt on the IRMA TRUpoint Analyzer.
3. Initiate the Quality Control Test Sequence.
4. Open the foil pouch and remove the cartridge.
5. Remove the protective tape from the cartridge.
6. Insert the cartridge into the analyzer.
7. Verify or enter the cartridge information at the display prompt.
8. Select the control from the list of established controls.
9. After calibration is complete, carefully snap open the control ampule.
To avoid cuts, protect your fingers with tissue or gloves, or use an ampule breaker.
10. Slowly draw the control sample into a 1 mL or 3 mL syringe using an 18-20 gauge needle.
11. Do not attempt to invert the syringe or expel bubbles from the syringe after drawing up the control solution.
12. Remove the needle, inject the control into the cartridge using a minimum of 0.8 mL of the control sample in a 1.0 mL syringe or a minimum of 1.5 mL of the control sample in a 3.0 mL syringe and press “test” to initiate the analysis.
Expected Analyzer Performance
The values on the Expected Values Chart are based on the results of multiple sample analysis. Samples were introduced using a 1 cc syringe, with an 18 gauge needle, after
cartridge equilibration at 22°C (72°F) for a minimum of 8 hours.
Use the expected values for each parameter as a guide in evaluating performance. Since performance is subject to sample temperature and environmental barometric pressure, ITC recommends that each institution establish its own expected values and acceptable limits. The mean values established at your institution should fall within the expected ranges.
Notes and Limitations
In establishing the values shown on the Expected Values Chart, samples were analyzed after equilibration at
22°C (72°F) for a minimum of 8 hours. The pCO2 and pO2 values vary inversely with temperature by approximately one percent per degree Celsius. Refer to Temperature Correction for information to adjust pCO2 and pO2 ranges for operating outside of the
21-23°C temperature range.
In establishing the values shown in Expected Values, samples are analyzed at approximately 760 mmHg. The pO2 values decrease by approximately 2.3% per 100 mmHg and the pCO2 values decrease by 1% at the same atmospheric conditions.
4
Temperature Correction
It has been reported the pCO2 and pO2 results were inversely affected
by temperature.2,3
If your laboratory
routinely operates in the 18-20°C
(64-68°F) or 24-25°C (75-77°F) range or experiences seasonal variations in temperature, you can adjust the ranges to account for these temperature effects, as shown below.
For example, if your room
temperature is typically 24-25°C and the range in the Expected Values Chart for pO2, Level 3 is 135.0 – 155.0 , you can adjust the range as follows:
1. Moran RF. Assessment of quality control of blood gas/pH analyzer performance. Respiratory Care 1981 (June).
2. Maas AHV. Evaluation of ampouled tonometered buffer solutions as a quality-control system for pH, pCO2 and pO2 measurement. Clin Chem 1977; 23(9): 1718-25.
3. Battino R, Rettich TR, Tominaga T. The solubility of oxygen and ozone in liquids. J of Phys Chem Ref Data 1983; 12(2): 163-178.
4. Burnett RW and Itano M. An interlaboratory study of blood-gas analysis: Dependence of pO2 and pCO2 results on atmospheric pressure. Clin Chem 1989; 35(8): 1779-1781.
Expected Values Chart
Level 1:
pH 7.127 – 7.187
pCO2 (mmHg) 65.4 – 81.4
pO2 (mmHg) 61.2 – 81.2
Na+ (mmol/L) 109.6 – 119.6
K+ (mmol/L) 1.49 – 2.49
iCa (mmol/L) 1.35 – 1.55
Level 2:
pH 7.403 – 7.463
pCO2 (mmHg) 38.4 – 48.4
pO2 (mmHg) 102.0 – 122.0
Na+ (mmol/L) 129.4 – 139.4
K+ (mmol/L) 3.82 – 4.82
iCa (mmol/L) 1.00 – 1.20
Level 3:
pH 7.654 – 7.714
pCO2 (mmHg) 13.5 – 23.5
pO2 (mmHg) 135.9 – 155.9
Na+ (mmol/L) 157.6 – 167.6
K+ (mmol/L) 5.68 – 6.68
iCa (mmol/L) 0.43 – 0.63
RNA MEDICAL QC 623
LEVEL 1 LOT 10221
LEVEL 2 LOT 10321
LEVEL 3 LOT 10421
EXP. 05/15
I R M A T R U p o i n t®
Q U A L I T Y C O N T R O L F o r u s e w i t h t h e R N A M e d i c a l , I n c .
QC 623 Blood Gas/Electrolyte Controls
The IRMA TRUpoint quality control sheets with bar codes are designed to be used with the IRMA TRUpoint scanner. If you are
unable to scan the bar codes after printing please manually input the ranges accordingly. For questions please contact ITC
technical support services at 800-631-5945 or 732-548-5700.
Quality Control 623 CC_mmHg
Level 1 – Lot 10221
A *43810221071B34CC*1*10221*
B *436102211*05/15*PH*7.127*
C *458102212*7.187*PCO2*65.*
D *43E1022134*81.4*PO2*61.2*
E *429102214*81.2*NA+*109.6*
F *414102215*119.6*K+*1.49**
G *43C1022162.49*ICA*1.35*1*
H *1EF102217.55**
I R M A T R U p o i n t®
Q U A L I T Y C O N T R O L F o r u s e w i t h t h e R N A M e d i c a l , I n c .
QC 623 Blood Gas/Electrolyte Controls
The IRMA TRUpoint quality control sheets with bar codes are designed to be used with the IRMA TRUpoint scanner. If you are
unable to scan the bar codes after printing please manually input the ranges accordingly. For questions please contact ITC
technical support services at 800-631-5945 or 732-548-5700.
Quality Control 623 CC_mmHg
Level 2 – Lot 10321
A *43F103210618D2CC*2*10321*
B *434103211*05/15*PH*7.403*
C *456103212*7.463*PCO2*38.*
D *4381032134*48.4*PO2*102**
E *427103214122*NA+*129.4*1*
F *41B10321539.4*K+*3.82*4.*
G *3CE10321682*ICA*1*1.2**
I R M A T R U p o i n t®
Q U A L I T Y C O N T R O L F o r u s e w i t h t h e R N A M e d i c a l , I n c .
QC 623 Blood Gas/Electrolyte Controls
The IRMA TRUpoint quality control sheets with bar codes are designed to be used with the IRMA TRUpoint scanner. If you are
unable to scan the bar codes after printing please manually input the ranges accordingly. For questions please contact ITC
technical support services at 800-631-5945 or 732-548-5700.