Iron and callose homeostatic regulation inrice roots under low phosphorusYan Ding1,3 , Zegang Wang2, Menglian Ren2, Ping Zhang2, Zhongnan Li2, Sheng Chen2, Cailin Ge2*
and Yulong Wang1*
Abstract
Background: Phosphorus (Pi) deficiency induces root morphological remodeling in plants. The primary root lengthof rice increased under Pi deficiency stress; however, the underlying mechanism is not well understood. In thisstudy, transcriptome analysis (RNA-seq) and Real-time quantitative PCR (qRT-PCR) techniques were combinedwith the determination of physiological and biochemical indexes to research the regulation mechanisms of iron(Fe) accumulation and callose deposition in rice roots, to illuminate the relationship between Fe accumulationand primary root growth under Pi deficient conditions.
Results: Induced expression of LPR1 genes was observed under low Pi, which also caused Fe accumulation, resultingin iron plaque formation on the root surface in rice; however, in contrast to Arabidopsis, low Pi promoted primary rootlengthening in rice. This might be due to Fe accumulation and callose deposition being still appropriately regulatedunder low Pi. The down-regulated expression of Fe-uptake-related key genes (including IRT, NAS, NAAT, YSLs,OsNRAMP1, ZIPs, ARF, and Rabs) inhibited iron uptake pathways I, II, and III in rice roots under low Pi conditions. Incontrast, due to the up-regulated expression of the VITs gene, Fe was increasingly stored in both root vacuoles and cellwalls. Furthermore, due to induced expression and increased activity of β-1-3 glucanase, callose deposition was morecontrolled in low Pi treated rice roots. In addition, low Pi and low Fe treatment still caused primary root lengthening.
Conclusions: The obtained results indicate that Low phosphorus induces iron and callose homeostatic regulation in riceroots. Because of the Fe homeostatic regulation, Fe plays a small role in rice root morphological remodeling under low Pi.
Keywords: Rice (Oryza sativa), Low phosphorus, Iron homeostasis, Root morphology
BackgroundPlant root morphology is regulated by numerous factors,such as water and nutrient availability. Phosphorus (Pi)and iron (Fe) have been reported to influence the plantroot length. In Arabidopsis, it has been proposed that Pideficiency inhibits the root apical meristem (RAM) activitydue to increased Fe bioavailability and its associated cellulartoxicity [1].The remodeling mechanism has been reported for
Arabidopsis on root morphology in low Pi. Multicopper
oxidase, Low Phosphate Root 1 (LPR1) is necessary forroot growth inhibition caused by Pi limitation in Arabi-dopsis. A common pathway combining with LPR2 andPHOSPHATE DEFICIENCY RESPONSE 2 (PDR2) ad-justs root meristem activity and phosphate availability[2–4]. In Arabidopsis under low Pi, the sites of iron (Fe)accumulation and callose deposition are determined bythe LPR1-PDR2 modules in both the meristem andelongation zone of the primary root, via apoplasticallylocated LPR1 activity. Callose deposition, which causesimpaired movement of SHORT ROOT (SHR) and inter-feres with the symplastic communication, is responsible forroot meristem differentiation [5]. Low Pi stress induces ironmobilization in RAM through the action of LPR1/LPR2,causing the expression of CLAVATA3/ENDOSPERMSURROUNDING REGION (CLE14) in the proximalmeristem region. CLAVATA2 (CLV2) and PEP1 RECEPTOR2 (PEPR2) receptors perceive CLE14 and trigger RAM
* Correspondence: [email protected]; [email protected] of Bioscience and Biotechnology, Yangzhou University, 88 DaxueSouth Road, Yangzhou 225009, People’s Republic of China1Jiangsu Key Laboratory of Crop Genetics and Physiology/ Jiangsu KeyLaboratory of Crop Cultivation and Physiology, Jiangsu Co-Innovation Centerfor Modern Production Technology of Grain Crops, Agricultural College ofYangzhou University, Yangzhou University, 88 Daxue South Road, Yangzhou225009, People’s Republic of ChinaFull list of author information is available at the end of the article
differentiation in Arabidopsis, with concomitantdown-regulation of both SHORT ROOT (SHR)/SCARE-CROW (SCR) and PIN/AUXIN pathways [6].Recently, researchers increasingly focused on the mech-
anism underlying the rice response to low Pi. Pi deficiencycauses a significant reduction in the net photosyntheticrate of rice plants [7]. Photosynthetic CO2 assimilation isdecreased by Pi deficiency as a result of the decreasedRuBP pool size in rice [8]. Pi deficiency affects diversemetabolic pathways most of which are related to glucose,pyruvate, sucrose, starch, and chlorophyll a in rice leaves[9]. The genes involved in Pi transport, phosphatases, andgenes pertaining to both primary and secondary metabol-ism were affected differently by Pi deficiency in rice roots[10]. Phosphate over accumulator 2 (OsPHO2) knockoutmutants indicates that OsPHO2, which functions down-stream of the phosphate transporter traffic facilitator 1(OsPHF1), modulates Pi utilization by regulating the ex-pression of Pht1 transporters in rice [11]. The PhosphateStarvation Response Regulator 1 (PHR1) is a MYB tran-scription factor that plays a key role in Pi starvation sig-naling. OsPHR1 and OsPHR2 are homologous proteins ofPHR1 in rice [12]. Overexpression of OsPHR2 in ricemimicked the Pi starvation signal. It induces Pi StarvationInduced (PSI), OsIPS1/2 (the gene encoding the signalmolecules), miRNAs, SPX domain-containing protein(SPXs), phosphate transporter (PTs), and purple acidphosphatases (PAPs) gene expression, and results in en-hanced Pi acquisition [12–17].Root elongation induced by Pi deficiency has been
reported as one of the adaptive mechanisms in plants.Enhanced external root efficiency or root growth mayresult in high phosphorus uptake from Pi-deficient soils.About 90% of Pi uptake was found as the result of en-hanced root growth per unit root size in rice [18]. Stud-ies have illustrated the inhibition of plant height, totaldry weight, shoot dry weight, and root number under Pideficiency, but the maximum yields of root length androot-shoot ratio were achieved by Pi-deficiency stress inrice [19]. A significant root elongation was indeed in-duced in rice under Pi-deficient conditions [20]. Rootelongation clearly varied among different rice varietiesscreened under two different Pi levels [20, 21]. Geneticdifferences were found in rice root elongation under Pideficiency, and a distinct quantitative trait locus (QTL)was reported on the long arm of chromosome 6 [22]. Inaddition, this QTL itself, or a tightly linked region, partlyexplains the decreased ability of excess iron accumula-tion in the shoots. The identified QTL would be usefulin the improvement of rice varieties overcoming complexnutritional disorder caused by both Pi deficiency andiron-excess toxicity [20]. In the rice reference genome, aswell as other phosphorus-starvation-intolerant modernvarieties, phosphorus-starvation tolerance 1 (PSTOL1)
was absent [23]. PSTOL1 also played a role as an enhancerin early root-growth, thus enabling plants to acquire morephosphorus and other nutrients. In such varieties, overex-pression of PSTOL1 significantly enhanced grain produc-tion in phosphorus-deficient soil [24]. Overexpression ofOsPHR2 led to Pi accumulation in rice leaves, as well asincreases in root length, root-shoot ratio, and the numberof root hairs [12]. Currently, OsWRKY74 is the uniqueconfirmed WRKY gene which involved in the regulationof phosphate starvation response in rice. Transgenic seed-lings overexpressing OsWRKY74 improved Pi uptake,length of roots, biomass, and iron accumulation levels, in-dicating that OsWRKY74 may be involved in the coordin-ate regulation of iron and Pi uptake [25].Interestingly, Pi starvation induces the formation of
reddish brown iron plaques on the surface of rice roots[26, 27], further promoting Fe accumulation in rootsand shoots of rice plants [28]. However, the primary rootand lateral root lengths both increase noticeably in toler-ant rice cultivars under low Pi conditions [29]. This resultsuggests a different mechanism for the rice root morpho-logical remodeling response to Pi deficiency compared toArabidopsis. To date, the root morphological remodelingmechanism under low Pi in rice still remains unclear.To illuminate whether Fe plays an important role in the
regulation of rice root lengths under low Pi, the primaryroot length, Fe accumulation, and callose deposition in (oron) rice roots were investigated. Furthermore, Fe uptake,Fe distribution, and callose degradation-related gene ex-pression were analyzed under low Pi conditions.
ResultsLow pi led to root lengthening in riceThe effect of low Pi treatment (1/25 of a normal Pi supplylevel) on primary rice root length is shown in Table 1.Compared to the control (normal Pi supply level), the pri-mary root length of rice cultivars Tongjing981 (TJ981)and ZhenDao 99 (ZD99) increased significantly (P < 0.05and P < 0.01, respectively) after seedlings were treated inlow Pi for 7, 15, and 30 d. However, primary root length
Table 1 Root length affected by low Pi treatment for 7, 15, 30 days
Samples Treatment time(d)
7 15 30
TJ981 Normal P 8.40 ± 0.60 11.65 ± 0.37 24.77 ± 1.09
Low P 9.73 ± 0.63** 13.98 ± 0.61** 42.15 ± 2.73**
ZH6 Normal p 6.83 ± 0.24 10.43 ± 0.46 22.23 ± 1.24
Low P 7.09 ± 0.28 9.54 ± 0.56 31.93 ± 2.25**
ZD99 Normal P 7.14 ± 0.31 9.45 ± 0.47 25.46 ± 1.20
Low P 7.67 ± 0.38** 11.18 ± 0.99** 39.38 ± 2.53**
“*” and “**” represent significant (P ≤ 0.05) and very significant difference(P ≤ 0.01) compared to control (the same applies hereinafter)
Ding et al. BMC Plant Biology (2018) 18:326 Page 2 of 14
change in ZhengHan 6 (ZH6) was either not significant(at 7 d) or significantly reduced (at 15 d); primary rootlength increased significantly when treated at low Pi for30 d. These results indicate that low Pi stress promotedrice primary root lengthening, which is one of the mainstrategies of most rice cultivars to achieve acclimation toPi deficiency. Apparently, the response pattern in rootlengthening varied among different cultivars.
Low pi promoted iron plaque formation on the rice rootsurfaceDCB-Fe is the adsorption or precipitation of iron on theroot surface. Consequently, a reddish-brown iron plaqueon the rice root surface began to form after treatment bylow Pi for 1d (Fig. 1a), and the thickness of iron plaquecontinuously increased with the prolonging of low Pitreatment time (Fig. 1b and c). The DCB-Fe contents in-creased either significantly or very significantly (Fig. 2)under the low Pi treatment for 15 d. Fe deposition on therice root surface under low Pi treatment was confirmed byour results.
Low pi induced LPR1 genes expressionIn Arabidopsis, the LPR1-PDR2 module mediates cell-specific Fe deposition in the cell walls of the RAM andelongation zone during Pi limitation. This providesevidence for apoplastic LPR1 ferroxidase activity andsuggests that antagonistic interactions of Pi and Feavailability adjust the primary root growth rate via RAM-specific callose deposition, which is likely triggered byLPR1-dependent redox signaling [5]. In this experiment,the results of transcriptome sequencing showed that the ex-pression of multicopper oxidase LPR1 homolog 1–5 genesin the roots of three tested varieties was induced by low Pitreatment for 15 d (Table 2). Furthermore, the results ofproteomic detection showed that the content of the LPR1protein in low Pi treated rice roots was higher than that inthe roots of control (data not shown). This suggests that
the formation of Fe plaques on rice root surface was pro-moted by the induction of LPR1 gene expression.
Low pi increased Fe content in the rice root symplastDue to Fe deposition on the root surface, the Fe contentincreased very significantly in the root symplast of thethree tested rice cultivars compared to the control(Fig. 3). It is interesting that the increased degree of Fecontent in the root symplast was substantially lowerthan that deposited on the root surface. For example, inZH6 cultivar Fe content on low Pi treated root surfaceincreased by 7.77 mg compared to control (Fig. 2); how-ever, it only increased by 0.19 mg in the ZH6 root sym-plast (Fig. 3). This result suggests that Fe uptake by therice root symplasm might be limited under low Pi stress.
Regulation of Fe accumulation in rice root symplastsunder low pi stressGene expression regulation
Differential expression of Fe uptake related genesdetected via transcriptome sequencing The resultsbasically clarified the existence of two distinct high affin-ity iron transport mechanisms in plants [30]. Non-gram-inaceous monocots and all dicots use the mechanism I Feuptake strategy, while grasses use the mechanism II strat-egy. As a special case, rice may utilize both mechanism Iand II Fe uptake strategies [31].These experimental results indicate that the Fe uptake
of mechanisms I and II was entirely inhibited by downregulating the expression of key enzyme encoding genes,associated with Fe uptake in rice roots under low Pi(Table 3).Although the expression of a ferric reductase trans-
membrane protein (FR) gene (OS09G0500900) in the ZH6root was induced by low Pi, the expression of the Fe2+
transport protein 2 gene (IRT, OS03G0667300) was inhib-ited by low Pi in all three tested cultivars (Table 3),
A B C
ZD99 ZH6 TJ981
CK LP CK LP CK LP
ZD99 ZH6 TJ981
CK LP CK LP CK LP
ZD99 ZH6 TJ981
CK LP CK LP CK LP
Fig. 1 Formation of brown iron plaque on rice root surface in low Pi (LP) in comparison to control (CK). (a: low Pi treatment for 1d; b: low Pitreatment for 3 d; c: low Pi treatment for 15 d)
Ding et al. BMC Plant Biology (2018) 18:326 Page 3 of 14
suggesting that low Pi reduced Fe2+ uptake by rice roots.Furthermore, the expression of nicotianaminesynthase(NA2, OS03G0307200; NA1, OS03G0307300) and nico-tianamine aminotransferase A (NAAT, OS02G0306401)was down-regulated under low Pi (Table 3), showingthat low Pi inhibited PS biosynthesis. Moreover, theexpression of an ADP-ribosylation factor (such asARF1, OS03G0811900; ARF2, OS01G0265100) and RabGTPases (such as RABA1f, OS01G0667600; RABA5c,OS08G0525000; RABA2a, OS03G0843100) was down-regulated under low Pi (Table 3), suggesting that low Piinhibited PS secretion. Furthermore, the expression ofthe Fe or metal-phytosiderophore transporter (YSL15,OS02G0650300; YSL2, OS02G0649900; YSL9,OS04G0542200) was all down-regulated due to low Pi (Table 3),indicating that low Pi also inhibited Fe3+-PS complextransportation.Additionally, plants might also utilize a mechanism III
iron absorption strategy. Moil (1999) reported that themetal transporter Nramp played an important role inthe absorption of iron and other metal ions and suggestedthat plants may use a novel mechanism for phagocyticiron absorption. In this mechanism, Nramp can releaseFe2+ from the endosome, then transferring it to the
cytoplasm. Table 3 shows that low Pi down-regulated theexpression of metal transporter Nramp1 (NRAMP1,OS07G0258400), indicating that the phagocytic mechan-ism of Fe2+ uptake is also inhibited by low Pi.It is worth noting that the expression of the vacuolar iron
transporter 2 gene (VIT2, OS04G0538400) and vacuolariron transporter 1.2 (VIT1.2, OS09G0396900) was stronglyinduced by low Pi stress (Table 3), which suggests that thedistribution of Fe in root cells was probably regulated bythe expression of low-Pi-responsive genes.
The transcriptional level of differentially expressed genesverified via qRT-PCRTo verify the transcriptome sequencing results, ninedifferentially expressed genes were selected and theirtranscriptional levels were tested via real-time fluores-cent quantitative PCR (qRT-PCR) after rice seedlingswere treated by low Pi for 15 d. The results (Fig. 4)show that the transcription of NA2, NAAT, YSL15,YSL2, YSL9, NRAMP1, ZIP, and RABA2a weredown-regulated; however, the transcription of VIT2 wasup-regulated, which fully agrees with the results oftranscriptome sequencing.
0
2
4
6
8
10
12
14
16
18
20
CK LP CK LP CK LP
Con
tent
of D
CB
-Fe
(mg·
g-1)
TJ981 ZH6 ZD99
Fig. 2 DCB-Fe content on root surface under low Pi treatment for 15 d. Notes: * indicates significant difference (P ≤ 0.05), ** indicates extremelysignificant difference (P ≤ 0.01)
Table 2 The expression induction of LPR1 genes in rice roots treated by low Pi for 15 d
Notes: * indicating the difference significant (P ≤ 0.05), ** indicating the difference extremely significant (P ≤ 0.01). The expression fold change (LP/ck) FC = 2Log2FC
Ding et al. BMC Plant Biology (2018) 18:326 Page 4 of 14
Effect of low pi and treatment time on the transcriptionallevel of key differentially expressed genesFour key genes associated with Fe3+ uptake (NA2, NAAT,and YSL15) and intracellular distribution (VIT2) wereselected to determine the effect of low Pi treatment timeon the resulting transcriptional level. The results showedthat the transcriptional levels of NA2, NAAT, and YSL15were inhibited by low Pi, and that inhibition of their
transcription began after low Pi treatment for only 1 d.The transcriptionally inhibited degree of NA2 increasedwith the prolonging of low Pi treatment time. However,the inhibited degree of NAAT and YSL15 decreasedslightly due to low Pi treatment for 5 d or 9 d; therefore,the first five days after low Pi treatment may form anemergency response stage; then, the inhibited degreeincreased again with low Pi treatment time further
0.00
0.05
0.10
0.15
0.20
0.25
0.30
0.35
0.40
0.45
CK LP CK LP CK LP
Fe
Con
tent
in R
oot(
mg·
g-1
DW
)
TJ981 ZH6 ZD99
Fig. 3 Effect of low Pi treatment on iron content in rice roots. Notes: ** indicates extremely significant difference (P ≤ 0.01)
Table 3 Effect of low Pi on transcriptional level of the iron absorption related genes detected via illumina expression profile sequencing
Ensemble_id Description TJ981 ZH6 ZD99
Log2FC P-Value Log2FC P-Value Log2FC P-Value
OS03G0667300 Fe2+ transport protein 2 (IRT) −2.683 5.00E-05 −3.766 5.00E-05 − 2.082 0.0003
Notes: The expression fold change (LP/ck) FC = 2Log2FC, e.g., the expression fold change (LP/ck) of IRT in TJ981 roots FC = 2–2.683 = 0.156. “-------” represents that dueto FC ≤ 2 or ≥ 0.5, the P-Value was not given. P-Value ≤0.05 (or ≤ 0.01) represent that the difference reached significant (or very significant) levels, respectively
Ding et al. BMC Plant Biology (2018) 18:326 Page 5 of 14
prolonging, which may be called an adaptive responsestage. Nevertheless, low Pi induced the transcription ofVIT2 and the transcriptional induced degree of VIT2first increased, then slightly decreased with extendedlow Pi treatment time.
Intracellular distribution regulation of FeAlthough low Pi promoted Fe accumulation in rice roots(Fig. 2), the intracellular distribution of Fe still remainedregulated. The Fe content in the vacuole of low Pitreated root cells was significantly higher than that in ck(Fig. 6), which was consistent with the expression induc-tion of the VITs gene under low Pi (Table 3, Fig. 5d).Furthermore, the Fe content in the cell wall was alsohigher than that in ck (Fig. 6). These results suggest thatFe was mainly stored in root vacuoles and cell wallsunder low Pi treatment, to alleviate the toxic effect ofexcessive Fe in the cytoplasm.In summary, Fe homeostasis in rice roots was regu-
lated by coordinated Fe uptake, transport, and intracellu-lar distribution under low Pi. In contrast to Arabidopsis,Fe accumulation in rice roots did not inhibit the primaryroot growth under low-Pi stress.
Low-pi and low-Fe treatment leads to rice root lengtheningAs shown in Fig. 7, the low-Pi and low-Fe joint treat-ment (LP + LFe) did not cause the formation of Fe pla-ques on the rice root surface; however, the primary rootlengths of TJ981 and ZD99 were significantly enhancedby either LP or LP + LFe treatments for 15 d comparedto the control. This result indicates that the low Fe con-tent in both medium and rice roots still resulted in thelengthening of the primary root, which was different inArabidopsis.
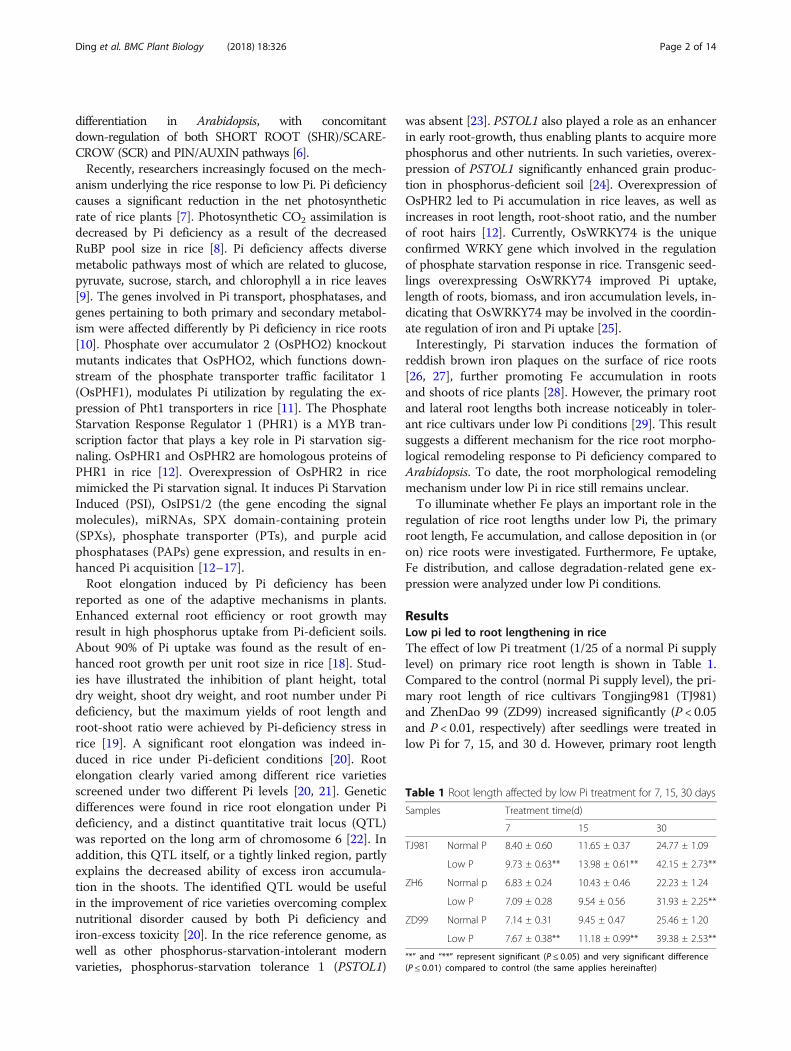
Low-pi promoted callose deposition in rootsIn Arabidopsis, Pi limitation triggered cell-specific apo-plastic Fe and callose depositions in both meristem and
elongation zone of primary roots. Here, we showed thatLow-Pi promoted a small callose deposition in theelongation zone of primary roots in rice (Fig. 8). How-ever, the relative amount of callose deposition wassmaller compared to Arabidopsis.Callose hydrolysis is catalyzed by β-1-3 glucanase. The
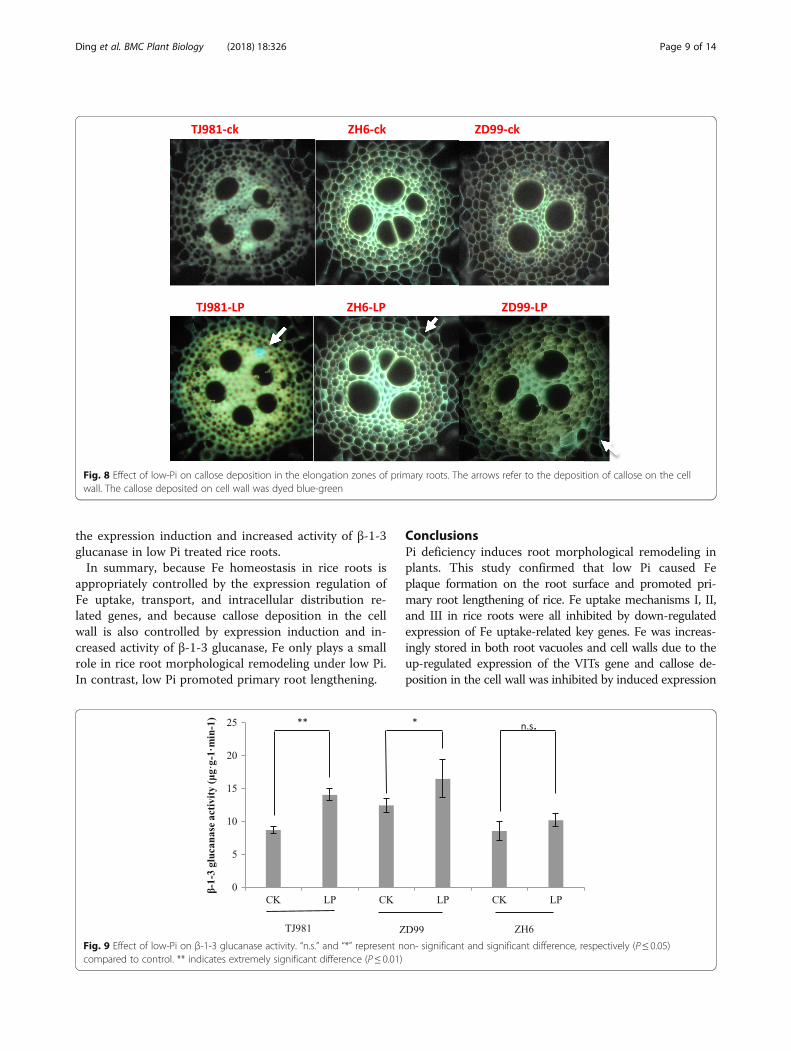
transcriptome sequencing results of this experimentshowed that the expression of the β-1-3 glucanase gene wasinduced by low-Pi in TJ981 (OS03G0221500, Log2FC= 1.02,P-value = 5.00E-05) and ZH6 (OS01G0631500, Log2FC =1.10, P-value = 0.00165) of roots. Furthermore, the β-1-3glucanase activity in low-Pi treated rice roots was signifi-cantly higher than in control (Fig. 9). This result suggeststhat the callose deposition in low-Pi treated rice roots couldbe reversed by high expression of specific β-1,3 glucanase.
DiscussionThis study confirmed that Pi deficiency induced rootmorphological remodeling in rice, which is a major de-velopmental plant response to Pi deficiency and hasbeen suggested to enhance the plant’s adaptability to Pideficiency. When cultured under Pi deficiency, someplants (such as Arabidopsis) decrease their primary rootgrowth, while increasing the production of lateral roots[32]. However, unlike Arabidopsis, primary root length-ening happened during Pi deficiency treatment of rice[33, 34]. The results of this experiment confirmed thatlow Pi stress promoted rice root expansion (especiallyprimary root lengthening).Phosphorus deficiency induced reddish brown Fe plaque
formation on the surface of rice roots [26, 27]. The Fe pla-ques that formed on the root surface of rice seedlings canbe regarded as a nutrient pool, contributing to the uptakeof P and Fe. Our results confirmed that the reddish-brownFe plaques formed after low Pi treatment for 1 d (Fig. 1a),and the thickness of the Fe plaque continuously increasedwith prolonged low Pi treatment time (Fig. 1b and c). The
-8
-6
-4
-2
0
2
4
6
8
Log
2F
old
chan
ge (
LP
/ck) TJ981 ZD99 ZH6
Fig. 4 Transcriptional level of the differentially expressed genes verified via qRT-PCR. Expression fold change (LP/ck) FC = 2 Log2FC
Ding et al. BMC Plant Biology (2018) 18:326 Page 6 of 14
formation of Fe plaques might be the result of the expres-sion induction of LPR1 genes.When rice seedlings were treated with low Pi, the Fe
content in root surface (apoplast) and root symplast in-creased significantly due to formation of the Fe plaque(Figs. 2 and 3). It has been reported that, in Arabidopsis,Pi limitation triggered apoplastic Fe and callose depos-ition in the root meristem, and callose deposition inhib-ited symplastic communication in the root stem cellniche, which subsequently inhibited primary root growth[5]. Therefore, the antagonistic interactions of Pi and Feavailability controlled the primary root growth of Arabi-dopsis via meristem-specific callose deposition. To date,the role of Fe in the rice root morphological remodelingresponse to low Pi remains unclear. Although low Pi in-creased the Fe contents both on root surface (apoplast)and in root symplast in rice, primary root lengtheningwas observed in this study, implying that rice used dif-ferent regulatory mechanisms for root morphological re-modeling under low Pi. Fe accumulation in rice rootsdid not inhibit primary root growth; in contrast, low Pipromoted primary root lengthening.However, evidence for Fe-related toxicity during low
Pi conditions is still missing. It has been proposed thatthe inhibited primary root growth under low Pi condi-tion, might be caused by the toxic effect of excessive Fe[1]. Therefore, it is important to investigate how to regu-late Fe homeostasis and alleviate the toxic effects of ex-cessive accumulated Fe in low Pi treated rice roots. Thisexperiment showed that, due to the down-regulated ex-pression of Fe uptake-related key genes (including IRT,NAS, NAAT, YSLs, NRAMP1, ZIP, ARFs, and RABs)(Table 3, Fig. 10), the Fe uptake by mechanisms I, II, andIII were all inhibited under low Pi stress. Furthermore,due to the up-regulated expression of the VIT2 andVIT1.2 genes (Fig. 10), Fe was stored more in the rootvacuole and cell wall under low Pi stress. Therefore, Fehomeostasis in the rice root was appropriately controlledby Fe uptake, transport, and intracellular distribution.Consequently, Fe accumulation in the rice root symplastwas insufficient to inhibit primary root growth underlow-Pi stress. Moreover, LP + LFe treatment still inducedprimary root lengthening compared to control treat-ment. Consequently, Fe does not play an important rolein rice root morphological remodeling under low Pi.One of the toxic effects of Fe accumulation in low Pi
treated rice roots was the triggering of callose depositionin the root meristem. Our experiment showed that asmall amount of callose was deposited in the elongationzone of rice primary roots. However, the relative amountof callose deposition was small compared to that in Ara-bidopsis, which may consequently not be sufficient tointerfere with intercellular communication. The reasonfor callose deposition under control conditions might be
A
B
C
D
Fig. 5 Effect of low Pi treatment time on the transcriptional level ofFe uptake-related Key genes. a: OS03G0307200/NA2, b: OS02G0306401/NAAT, c: OS02G0650300/YSL15, d: OS04G0538400/VIT2. Expression foldchange (LP/ck) FC = 2 Log2FC
Ding et al. BMC Plant Biology (2018) 18:326 Page 7 of 14
*
**
0
10
20
30
40
50
60
CK LP CK LP CK LPCon
tent
of F
e in
roo
t sub
cellu
lar
orga
niza
tion
g·g-
1 F
W) Vacuole organization
Cell wall organization
ZH6 TJ981 ZD99
Fig. 6 Effect of low Pi on the Fe content in subcellular organelles of rice root cells. Notes: * indicates significant difference (P ≤ 0.05), ** indicatesextremely significant difference (P ≤ 0.01)
ZD99 ZH6 TJ981
CK LP LP+LFe CK LP LP+LFe CK LP LP+LFe
Fig. 7 Effect of low-Pi and low-Fe on rice root length. Notes: ** indicates extremely significant difference (P≤ 0.01)
Ding et al. BMC Plant Biology (2018) 18:326 Page 8 of 14
the expression induction and increased activity of β-1-3glucanase in low Pi treated rice roots.In summary, because Fe homeostasis in rice roots is
appropriately controlled by the expression regulation ofFe uptake, transport, and intracellular distribution re-lated genes, and because callose deposition in the cellwall is also controlled by expression induction and in-creased activity of β-1-3 glucanase, Fe only plays a smallrole in rice root morphological remodeling under low Pi.In contrast, low Pi promoted primary root lengthening.
ConclusionsPi deficiency induces root morphological remodeling inplants. This study confirmed that low Pi caused Feplaque formation on the root surface and promoted pri-mary root lengthening of rice. Fe uptake mechanisms I, II,and III in rice roots were all inhibited by down-regulatedexpression of Fe uptake-related key genes. Fe was increas-ingly stored in both root vacuoles and cell walls due to theup-regulated expression of the VITs gene and callose de-position in the cell wall was inhibited by induced expression
Fig. 8 Effect of low-Pi on callose deposition in the elongation zones of primary roots. The arrows refer to the deposition of callose on the cellwall. The callose deposited on cell wall was dyed blue-green
Fig. 9 Effect of low-Pi on β-1-3 glucanase activity. “n.s.” and “*” represent non- significant and significant difference, respectively (P ≤ 0.05)compared to control. ** indicates extremely significant difference (P ≤ 0.01)
Ding et al. BMC Plant Biology (2018) 18:326 Page 9 of 14
and increased activity of β-1-3 glucanase. We also foundthat low Pi and low Fe treatment still caused primary rootlengthening. All these results suggest that caused by thehomeostasis of Fe and callose in rice roots treated tolow Pi, Fe does not play an important role in rice rootmorphological remodeling under low Pi. In contrast,low Pi enhances primary root lengthening. However,the mechanism of low Pi promoting root length still re-mains unknown and it is significant to further elucidatethe underlying mechanism.
MethodsPlant materialsInformed by our previous research results, three followingrice cultivars were selected as test materials: TongJing 981(TJ981), ZhengHan 6 (ZH6), and ZhenDao 99 (ZD99)corresponding to the primary root lengthening type,phosphorus efficient uptake and utilization type, andintermediate type rice cultivar response to low Pi,respectively.
Rice seedling culture and treatmentPlump rice seeds were selected and sterilized via 10%H2O2 for 30 min. After washing with deionized water,the seeds were placed in a Petri dish (17 cm), filled withdeionized water to accelerate germination at 32 °C. Thegerminating seeds were selected and placed into 96-wellplastic plates. Then, the plates were placed in plastic boxesand complete nutrient solution of the International Rice
Research Institute [containing: 1.45 mMNH4NO3,0.323 mMNaH2PO4•2H2O, 0.512 mM K2SO4, 0.998 mM CaCl2,1.643 mM MgSO4 •7H2O, 9.1μΜ MnCl2•4H2O, 0.075 μM(NH4)6Mo7O24•4H2O, 18.882 μM H3BO3, 0.152 μM ZnSO4
•7H2O, 0.155 μM CuSO4•5H2O, 0.036 mM FeCl3•6H2O,and 0.031 mM Na2EDTA•2H2O, 0.071 mM Citric acidmonohydrate, and 500 ml of concentrated sulfuric acid wereadded every 10 L; (pH = 5.4)] was added. When the seed-lings had grown to the 3-leaf stage, healthy seedlings werechosen and cultured with either normal nutrient solution(CK), low Pi (LP), or low Fe (LFe) nutrient solution. The Piconcentration of LP/CK was 1/25, while the Fe concentra-tion of LFe/CK was 1/20. Each treatment contained six bio-logical replicates. The seedlings were further cultured in anartificial climate chamber under controlled conditions (14-hphotoperiod, 75% relative humidity, and 32/27 °C day/nightregime). The solution was changed daily and the pH was ad-justed to about 5.1. Rice seedlings were sampled after treat-ment durations of 1 to 30 days.
Extraction of DCB-Fe from the rice root surfaceDCB-Fe is a general term for both adsorption and pre-cipitation of Fe on the root surface. DCB-Fe was mea-sured via DCB (dithionite-citrate-bicarbonate) extractionmethod [35]. Briefly, after low Pi treatment for 15 d, therice roots were sampled and soaked overnight using tapwater. After repeated washing with deionized water, theroot surface moisture was absorbed by absorbent paperand the roots were placed in 150 ml triangular flasks.
Fig. 10 Fe uptake strategy for plants and effects of low Pi on the expression of key genes involved in Fe uptake and distribution in rice roots.The green arrows indicate the down-regulated expression of corresponding genes, while the red arrow indicates up-regulated expression ofcorresponding genes; V represents the vacuole
Ding et al. BMC Plant Biology (2018) 18:326 Page 10 of 14
The DCB extraction solution (consisting of: 40 ml of0.3 mol/L Na3C6H5O7·2H2O, 5.0 ml of 1.0 mol/LNaHCO3, and 3.0 g Na2S2O4) was added to triangularflasks, and then oscillated on a 280x g shaking table for3 h at 25 °C. The solution was filtered into 100 ml volu-metric flasks at constant volumes. DCB-Fe content (oriron plaque thickness) was verified via the iron contentof the per unit dry weight of roots.
Digestion of rice rootsAfter iron plaque removal via the DCB extractionmethod, the roots were repeatedly rinsed with deionizedwater, dried in the oven at 70–80 °C, and ground to afine powder in a ceramic mortar. Then, 0.5 g root pow-der was weighed, and both 5 ml concentrated nitric acidand 3 ml deionized water were added. After H2O2
addition (two drops), the root powder was digested in ahigh-pressure closed microwave digestion instrument(MARS 6, CEM, USA). The digestion solution was trans-ferred to a 50 ml volumetric flask at constant volume.
Subcellular structure separationAfter iron plaque removal, 1.0 g roots were weighed andplaced in a pre-cooling mortar. 10 mL homogenate (con-sisting of: 0.25 mol/L sucrose, 50 mmol/L Tris-maleatebuffer (pH = 7.8), 1 mmol/L MgCl2 and 10 mmol/L cyst-eine) were added to the mortar. The roots were ground toa fine homogenate, which was then transferred into a50 mL centrifuge tube, and centrifuged using a high-speedrefrigerated centrifuge at 1000 x g for 2 min at 4 °C. Theprecipitation at the bottom was collected for the cell wallcomponent. The supernatant was further centrifuged at12000 x g for 30 min at 4 °C. The fragments on the bottomwere collected for evaluation of the organelle composition.The supernatant formed the vacuolar component (consist-ing of vacuole and cytoplasm Fe).
Determination of iron contentThe contents of DCB-Fe, Fe in roots, and subcellular Fe(consisting of cell wall, organelle, and vacuolar compo-nents) were determined via plasma-atomic emissionspectrometry (iCAP-6300, Thermo Fisher SCIENTIFIC,USA).
Observation of callose depositionTo measure callose deposition, the method of frozensection with aniline blue fluorescent staining was used[36]. Briefly, 10 mm rice root tips were sampled and a5 mm subparagraph was cut out. The root tips wereimmersed in 10% glycerin. After pumping gas for15 min, the root tips were embedded, fixed, and cut into15 μm slices using a Leica CM 1900 frozen microtome.The sections were placed on a slide and soaked in 95%ethanol solution overnight; then, soaked in phosphate
buffer (l/15 mol/L, pH = 7.0) for 30 min. The sectionswere dyed in 0.05% aniline blue for 60 min. The depos-ited callose was observed with an OlympusBX51 fluores-cence microscope, excited by ultraviolet light.
Determination of β-1-3 glucanase activityDetermination of β-1-3 glucanase activity was conductedin accordance with Zhang et al. [37]; however, a slightchange was implemented: 0.5 g roots were weighed andplaced in a pre-cooled mortar. 5.5 mL sodium acetatebuffer (0.05 mol/L, pH = 5.0) were added to the mortar.The roots were ground to a homogenate, which was thentransferred into a 10 mL centrifuge tube and centrifuged at15000 r/min for 15 min at 4 °C. The supernatant was usedas enzyme extraction. The enzyme extraction was heated ina water bath at 100 °C for 10 min, which was used as con-trol. 100 μl Okam solution (1 mg/mL) and 100 μl enzymeextraction was added to a 5 ml centrifuge tube, and heatedin a water bath at 37 °C for 30 min. Then, 1 ml DNS solu-tion was added to terminate the reaction. The reaction so-lution was placed in a boiling water bath for 5 min ofcoloration. After cooling to room temperature, the amountof glucose was measured via colorimetry at 540 nm.
Transcriptome sequencingRNA library construction and sequencingFor mRNA library construction and deep sequencing,RNA samples were prepared via the TruSeq RNA SamplePreparation Kit according to the manufacture’s protocol[38]. Briefly, the poly-A containing mRNA molecules werepurified with 3 μg of total RNA via poly-T oligo-attachedmagnetic beads. Cleaved RNA fragments were reverselytranscribed into first strand cDNA using random hexamers,followed by second-strand cDNA synthesis using DNApolymerase I and RNase H. cDNA fragments were purified,end blunted, ‘A’ tailed, and adaptor ligated. PCR was used toselectively enrich DNA fragments with adapter moleculeson both ends and to amplify the amount of DNA in the li-brary. The number of PCR cycles was minimized to avoidskewing representation of the library [39]. The resulting li-brary was qualified via the Agilent 2100 bioanalyzer andquantified via both Qubit and qPCR. The produced librar-ies were sequenced on the HiSeq 2500 platform.
Data analysis workflow of transcriptional profilingInformation on the reference gene set and corresponding an-notations: Oryza indica gene set referred to ENSEMBL(ftp://ftp.ensemblgenomes.org/pub/-release-23/plants/fasta/oryza_indica/cdna/Oryza_indica.ASM465v1.23.cdna.all.fa.gz).Analysis of the gene expression profile: sequencing
reads were mapped onto the reference gene set via Bowtie1software (Bowtie parameter: –v 3 –all –best –strata). A Perlscript program was utilized to process the mapping resultsand to generate a gene expression profile.
Ding et al. BMC Plant Biology (2018) 18:326 Page 11 of 14
Analysis of differentially expressed genesAccording to credibility interval approaches that hadbeen reported for the analysis of SAGE data5 [40], theedgeR6 program was used to identify differentially expressedmRNAs based on their relative quantities, which werereflected by individual gene reads [41]. The method usedempirical Bayes estimation and exact tests based on negativebinomial distribution. Genes with a P value ≤0.01 and an ex-pression ratio ≥ 2 (up-regulation) or expression ratio ≤ 0.5(down-regulation) were recognized as significantly differen-tially expressed genes between both samples.
Real time fluorescent quantitative PCR (qRT-PCR) verificationPrimer design and synthesisNine differentially expressed Fe uptake and distribution-re-lated genes detected via RNA-seq were selected. cDNA se-quences of these genes were searched in a NCBIdatabase. Primers (see Table 4) were designed withPrimer 5.0 software according to CDS and then syn-thesized by Invitrogen Co. Ltd., USA.
Total RNA isolationAfter the rice seedlings had been treated by low Pi for 1,5, 9, 13 days, roots were harvested to extract total RNAusing the RNAprep pureplant kit (Tiangen, Beijing,China), according to the manufacturer’s protocol.
First-strand cDNA synthesisFirst-strand cDNA was synthesized by reverse transcribing5 μL of total RNA in a final reaction volume of 20 μL usingTIANScriptRT kit (Tiangen, Beijing, China) according tothe manufacturer’s instructions. The cDNA concentrationwas determined using an Eppendorf Biophotometer. Ac-cording to the cDNA concentration, the volumes of theproducts of reverse transcription were regulated to ensureidentical cDNA concentration in each treatment.
Real-time quantitative PCR detectionReal-time quantitative PCR analysis was conducted usingthe Real-Time PCR System (CFX96 Touch, Bio-Rad,
USA). The SYBR Premix Ex Taq (TaKaRa) kit was used,using ubiquitin 5 (UBQ 5) gene as reference gene [42].Amplification was done in parallel with the target geneallowing normalization of gene expression, while provid-ing quantification. The reaction procedure was as follows:Pre-denaturation at 95 °C for 30 s, followed by 40 cyclesof: denaturation at 95 °C for 5 s, annealing at 55 °C for30 s, and extension at 70 °C for 30 s. The relativeexpressed quantitation (RQ) was calculated via the 2−ΔΔCT
method [43].
Data statistical analysisAll data were analyzed with Excel 2003 and SPSS 12.0using AVOV at a significance level of P ≤ 0.05.
AcknowledgmentsA Project Funded by the Priority Academic Program Development of JiangsuHigher Education Institutions (PAPD).
FundingThis research was supported by the Special Fund for Agro-Scientific Researchin the Public Interest (No. 201103007) and the Priority Academic ProgramDevelopment of Jiangsu Higher Education Institutions, China.
Availability of data and materialsThe datasets generated and analysed during the current study are availablefrom the corresponding author on reasonable request.
Authors’ contributionsGCL conceived the study, edited the manuscript, and supervised the work.WYL participated in conceiving the project, provided financial support forthe study, and supervised the work. DY carried out most experimentation,contributed to the design of the study, and drafted the manuscript. WZGcarried out most transcriptome data analysis. RML and ZP prepared the riceseeds, grew rice plants, and performed low pi treatment. LZN and CSperformed the qRT-PCR analysis. All authors reviewed and contributed todraft the manuscript. All authors read and approved the final manuscript.
Table 4 Primers for real-time quantitative PCR
Gene Symbol Sense primer (5′-3′) Reverse primer (5′-3′) Product length Tm
Ding et al. BMC Plant Biology (2018) 18:326 Page 12 of 14
Ethics approval and consent to participateNot applicable.
Consent for publicationNot applicable.
Competing interestsThe authors declare that they have no competing interests.
Publisher’s NoteSpringer Nature remains neutral with regard to jurisdictional claims inpublished maps and institutional affiliations.
Author details1Jiangsu Key Laboratory of Crop Genetics and Physiology/ Jiangsu KeyLaboratory of Crop Cultivation and Physiology, Jiangsu Co-Innovation Centerfor Modern Production Technology of Grain Crops, Agricultural College ofYangzhou University, Yangzhou University, 88 Daxue South Road, Yangzhou225009, People’s Republic of China. 2College of Bioscience andBiotechnology, Yangzhou University, 88 Daxue South Road, Yangzhou225009, People’s Republic of China. 3College of Materials and chemicalengineering, Bengbu University, 1866 Caoshan Road, Bengbu 233000,People’s Republic of China.
Received: 13 March 2018 Accepted: 16 October 2018
References1. Ward JT, Lahner B, Yakubova E, Salt DE, Raghothama KG. The effect of iron
on the primary root elongation of Arabidopsis during phosphate deficiency.Plant Physiol. 2008;147:1181–91.
2. Reymond M, Svistoonoff S, Loudet O, Nussaume L, Denos T. Identification ofQTL controlling root growth response to phosphate starvation inArabidopsis thaliana. Plant Cell Environ. 2006;29:115–25.
3. Svistoonoff S, Creff A, Reymond M, Sigoillot-Claude C, Ricaud L, Blanchet A,Nussaume L, Desnos T. Root tip contact with low-phosphate mediareprograms plant root architecture. Nat Genet. 2007;39:792–6.
4. Ticconi CA, Lucero RD, Sakhonwasee S, Adamson AW, Creff A, Nussaume L,Desnos T, Abel S. ER-resident proteins PDR2 and LPR1 mediate thedevelopmental response of root meristems to phosphate availability. ProcNatl Acad Sci U S A. 2009;106(33):14174–9.
5. Müller J, Toev T, Heisters M, Teller J, Moore KL, Hause G, Dinesh DC,BüRstenbinder K, Abel S. Iron-dependent Callose deposition adjusts rootmeristem maintenance to phosphate availability. Dev Cell. 2015;33:216–30.
6. Gutiérrez-Alanĺs D, Yong-Villalobos L, Jiménez-Sandoval P, Alatorre-Cobos F,Oropeza-Aburto A, Mora-Macĺas J, Sάnchez-Rodrĺguez F, Cruz-Ramĺrez A,Herrera-Estrella L. Phosphate starvation-dependent Iron mobilizationinduces CLE14 expression to trigger root meristem differentiation throughCLV2/PEPR2 signaling. Dev Cell. 2017;41:555–70.
7. Xu HX, Weng XY, Yang Y. Effect of phosphorus deficiency on thephotosynthetic characteristics of rice plants. Russ J Plant Physiol. 2007;54(6):741–8.
8. Li YF, Luo AC, Hassan MJ, Wei XH. Effect of phosphorus deficiency on leafphotosynthesis and carbohydrates partitioning in two rice genotypes withcontrasting low phosphorus susceptibility. Rice Sci. 2006;13(4):283–90.
9. Park MR, Baek S-H, de los Reyes BG, Yun SJ, Hasenstein KH. Transcriptomeprofiling characterizes phosphate deficiency effects on carbohydratemetabolism in rice leaves. J Plant Physiol. 2012;169(2):193–205.
10. Li LH, Liu C, Lian XM. Gene expression profiles in rice roots under lowphosphorus stress. Plant Mol Biol. 2010;72(4–5):423–32.
11. Cao Y, Yan Y, Zhang F, Wang HD, Gu M, Wu XN, Sun SB, Xu GH. Finecharacterization of OsPHO2 knockout mutants reveals its key role in piutilization in rice. J Plant Physiol. 2014;171(3–4):340–8.
12. Zhou J, Jiao FC, Wu ZC, Li YY, Wang XM, He XW, Zhong WQ, Wu P. OsPHR2is involved in phosphate-starvation signaling and excessive phosphateaccumulation in shoots of plants. Plant Physiol. 2008;146:1673–86.
13. Liu F, Wang ZY, Ren HY, Shen CJ, Li Y, Ling HQ, Wu CY, Lian XM, Wu P.OsSPX1 suppresses the function of OsPHR2 in the regulation of expressionof OsPT2 and phosphate homeostasis in shoots of rice. Plant J. 2010;62(3):508–17.
14. Wang C, Wei H, Ying YH, Li S, Secco D, Tyerman S, Whelan J, Shou HX.Functional characterization of the rice SPX-MFS family reveals a key role ofOsSPX-MFS1 in controlling phosphate homeostasis in leaves. New Phytol.2012;196:139–48.
15. Hou XL, Wu P, Jiao FC, Jia QJ, Chen HM, Yu J, Song XW, Yi KK. Regulation ofthe expression of OsIPS1 and OsIPS2 in rice via systemic and local pisignalling and hormones. Plant Cell Environ. 2005;28(3):353–64.
16. Zhang Q, Wang C, Tian J, Li K, Shou H. Identification of rice purple acidphosphatases related to phosphate starvation signalling. Plant Biol.2011;13(1):7–15.
17. Wang ZY, Hu H, Huang HJ, Duan K, Wu ZC, Wu P. Regulation of OsSPX1and OsSPX3 on expression of OsSPX domain genes and pi-starvationsignaling in rice. J Integr Plant Biol. 2009;51(7):663–74.
18. Wasaki J, Yamamura T, Shinano T, Osaki M. Secreted acid phosphatase isexpressed in cluster roots of lupin in response to phosphorus deficiency.Plant Soil. 2003;248(1–2):129–36.
19. Li JZ, Xie Y, Dai AY, Liu LF, Li ZC. Root and shoot traits responses tophosphorus deficiency and qtl analysis at seedling stage using introgressionlines of rice. J Genet Genomics. 2009;36(3):173–83.
20. Shimizu A, Yanagihara S, Kawasaki S, Ikehashi H. Phosphorus deficiency-induced root elongation and its qtl in rice (oryza sativa l.). Theor ApplGenet. 2004;109(7):1361–8.
21. Li HB, Xia M. Wu P. effect of phosphorus deficiency stress on rice lateralroot growth and nutrient absorption. Acta Bot Sin. 2001;43(11):1154–60.
22. Shimizu A, Kato K, Komatsu A, Motomura K, Ikehashi H. Genetic analysis ofroot elongation induced by phosphorus deficiency in rice (oryza sativa l.):fine QTL mapping and multivariate analysis of related traits. Theor ApplGenet. 2008;117(6):987–96.
23. Chin JH, Gamuyao R, Dalid C, Bustamam M, Prasetiyono J, Moeljopawiro S,Wissuwa M, Heuer S. Developing rice with high yield under phosphorusdeficiency: Pup1 sequence to application. Plant Physiol. 2011;156:1202–16.
24. Gamuyao R, Chin JH, Pariasca-Tanaka J, Pesaresi P, Catausan S, Dalid C,Slamet-Loedin I, Tecson-Mendoza EM, Wissuwa M, Heuer S. The proteinkinase pstol1 from traditional rice confers tolerance of phosphorusdeficiency. Nature. 2012;488(7412):535–9.
25. Dai X, Wang Y, Zhang WH. OsWRKY74, a WRKY transcription factor, modulatestolerance to phosphate starvation in rice. J Exp Bot. 2016;67(3):947–60.
26. Liu WJ, Hu Y, Zhu YG, Gao RT, Zhao QL. The mechanisms of iron plaqueformation on the surface of rice roots induced by phosphorus starvation.Plant Nutr Fertilizer Sci. 2008;14:22–7.
27. Fu YQ, Yang XJ, Wu DM, Shen H. Effect of phosphorus on reddish browniron plaque on root surface of rice seedlings and their nutritional effects. SciAgric Sin. 2014;47(6):1072–85.
28. Zheng LQ, Huang FL, Narsai R, Wu JJ, Giraud E, He F, Cheng LJ, Wang F, WuP, Whelan J, Shou HX. Physiological and transcriptome analysis of iron andphosphorus interaction in rice seedlings. Plant Physiol. 2009;151:262–74.
29. Li F, Pan XH, Liu SY, Li MY, Yang FS. Effect of phosphorus deficiency stresson root morphology and nutrient absorption of Rice cultivars. Acta AgronSin. 2004;30:438–42.
30. Marschner HV, Romheld V, Horst WJ, Martin P. Root-induced changes in therhizosphere: importance for the mineral nutrition of plants. ZPflanzenemaehr Bodenk. 1986;149:441–56.
31. Ishimaru Y, Suzuki M, Tsukamoto T, Sukuki K, Nakazono M, Kobayashi T,Wada Y, Watanabe S, Matsuhashi S, Takahashi M. Rice plantstake up iron asan Fe3+-phytosiderophore and as Fe2+. Plant J. 2006;45(3):335–46.
32. Desnos T. Root branching responses to phosphate and nitrate. Curr OpinPlant Biol. 2008;11(1):82–7.
33. Wissuwa M, Gamat G, Ismail AM. Is root growth under phosphorusdeficiency affected by source or sink limitations? J Exp Bot. 2005;56(417):1943–50.
34. Panigrahy M, Nageswara Rao D, Sarla N. Molecular mechanisms in responseto phosphate starvation in rice. Biotechnol Adv. 2009;27(4):389–97.
35. Taylor GJ, Crowder AA. Use of the DCB technique for extraction of hydrousiron oxides from roots of wetland plant. Am J Bot. 1983;70(8):1254–7.
36. Yang L, Chen JM, Zhang HQ, Zhang JF, He YP.Effects of Brown planthopper,Nilaparvata lugens(Stal) (Homoptera:Delphacidae). Feeding on CalloseDeposition in Rice with Different Tolerance. Chin J Rice Sci,2013,27(6):624-32
37. Zhang DD, Yun XF, Bao YY, Qian C, Gao XM. Effects of extracts celery freshroot and rhizosphere area on the chitinase and bata 1,3-glucan engymesactivity of cucumber leaf. J Inner Mongolia Agricultural University. 2013;34:21–7.
Ding et al. BMC Plant Biology (2018) 18:326 Page 13 of 14
38. Tao T, Zhao L, Lv YD, Chen JD, Hu Y, Zhang TZ, Zhou BL. Transcriptomesequencing and differential gene expression analysis of delayed glandmorphogenesis in Gossypium australe during seed germination. PLoS One.2013;8(9):e75323. https://doi.org/10.1371/journal.pone.0075323.
39. Gao J, Luo M, Zhu Y, He Y, Wang Q, Zhang C. Transcriptome sequencingand differential gene expression analysis in Viola yedoensis Makino (fam.Violaceae) responsive to cadmium (cd) pollution. Biochem Biophys ResCommun. 2015;459(1):60–5.
40. Robinson MD, Smyth GK. Small sample estimation of negative binomialdispersion with applications to SAGE data. Biostatistics. 2008;9(2):321–32.
41. Robinson MD, Oshlack A. A scaling normalization method for dierentialexpression analysis of RNA-seq data. Genome Biol. 2010;11:R25.
42. Jain M, Nijhawan A, Tyagi AK, Khurana JP. Validation of housekeeping genesas internal control for studying gene expression in rice by quantitative real-time PCR. Biochem Biophys Res Commun. 2006;345(2):646–51.
43. Livark KJ, Schmittgen TD. Analysis of relative gene expression data using real-time quantitative PCR and the 2-△△Ct method. Methods. 2001;25(4):402–8.
Ding et al. BMC Plant Biology (2018) 18:326 Page 14 of 14