29
ASSMANG LIMITED FUTURE EXPANSION FUTURE EXPANSION AT KHUMANI IRON ORE AT KHUMANI IRON ORE MINE MINE
ASSMANG LIMITED
FUTURE EXPANSION FUTURE EXPANSION AT KHUMANI IRON ORE AT KHUMANI IRON ORE
MINE MINE

SOUTH AFRICA Locality Map
Saldanha 861 km
PE 1104 km
Saldanha
Cato Ridge
Dwarsrivier Machadadorp
BLACK ROCK BLACK ROCK KUMBA KUMBA KHUMANI KHUMANI BEESHOEK BEESHOEK

IRON ORE Locality Map

Distribution of Ore deposits Northern Area

v Mine is physically divided into Bruce and King mining areas by rail lines and roads
v Mining areas connected with road
v Conveyor from crushers to plant stockpiles

MANDATE
v KHUMANI IRON ORE MINE must replace part/all of Beeshoek’s tonnage
v Design & engineer a mine in two phases: v Phase 1 = 8.4 Mt pa export (BASE CASE) v Phase 2 = 16.8 Mt pa export (Anticipated)
v Product grades: v Lumpy @ 66.0% Fe v Fines @ 65.0% Fe v MSIO @ 65.5% Fe
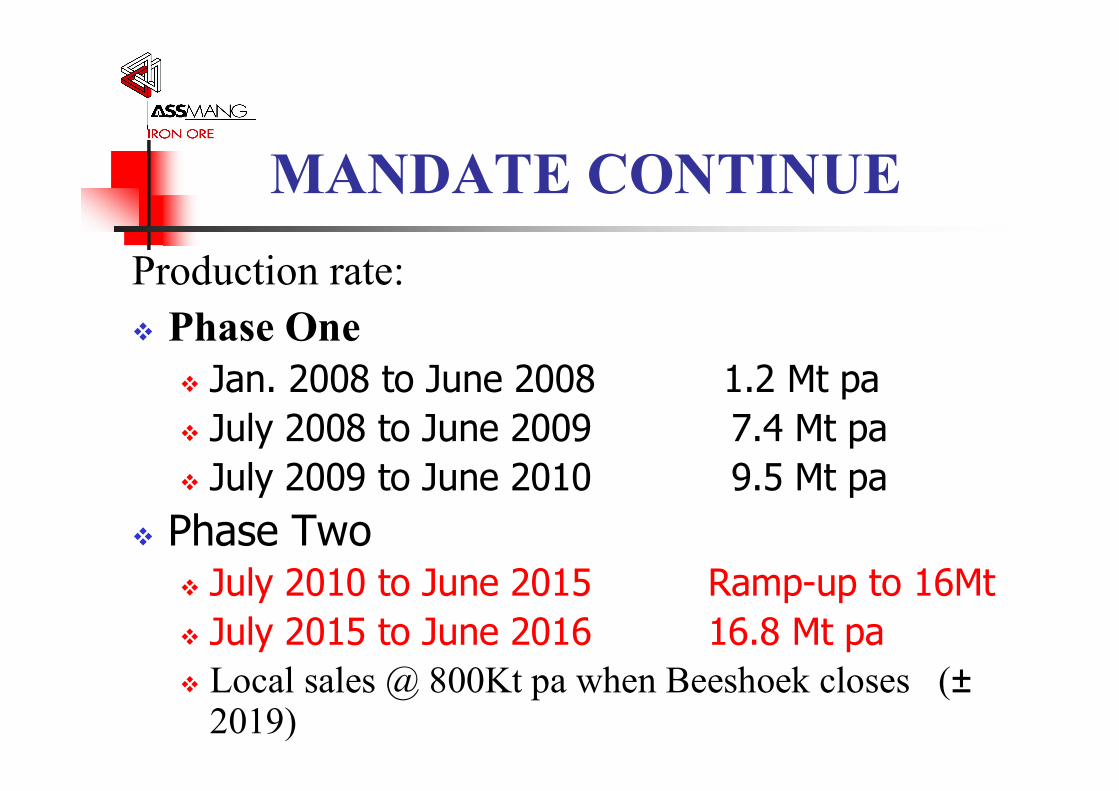
MANDATE CONTINUE Production rate: v Phase One
v Jan. 2008 to June 2008 1.2 Mt pa v July 2008 to June 2009 7.4 Mt pa v July 2009 to June 2010 9.5 Mt pa
v Phase Two v July 2010 to June 2015 Rampup to 16Mt v July 2015 to June 2016 16.8 Mt pa v Local sales @ 800Kt pa when Beeshoek closes (± 2019)

CASE STUDY
1. Base Case – excluding secondary crushing of MSIO and recovery of Super Fines.
2. Larger & less individual units through redesign
3. More compact plant 4. “Dropin” equipment when needed

DESIGN OBJECTIVES
1. Optimize exploitation of available resources 2. Maximize water recirculation/conservation 3. State of art technology (Fitforpurpose) 4. Maximize productivity 5. Social and Environmental responsible
mining activities Responsible corporate citizenship

METALLURGY 1. Ore mined as “ongrade” or “offgrade”
dependent on Fe grades and impurities 2. On/offgrade ROM stockpiled and blended
separately 3. On/offgrades processed separately 4. Ongrade is only washed and screened 5. Offgrade is washed, screened and
beneficiated by jigging

KHUMANI IRON ORE MINE DESIGN
Mine design v Require selective mining to minimise dilution and ore loss
v Blending to optimally exploit resources @ required rate v Plan bench height = 10m v Overall Pit Slopes = 45° v Safety berms = 15m Dump design v 10m lifts & 1 in 3 overall slope v Backfill of mined out pits 172 Mt v Stockpiles In pit /multiple face/pits blending + Pre crusher 90 000 ton muckpiles

KHUMANI IRON ORE MINE DESIGN CONTINUE
Other v 24 hour 7 day Operation 4 shifts v Global Positioning System (GPS) / Dispatch system v Blasthole sampling – GPS Positioning v Major equipment
v CAT 994 F Front End Loaders v CAT 789 C Dump trucks v Atlas Copco Pit Viper 271 Drills v Cat D10T Track Dozers v Cat 834 Wheel Dozers v Cat 16H Graders

PROCESS DESIGN
v Primary, Scalping & secondary crushing (Bruce/King)
v Convey to plant on Parsons v Run Of Mine blending stockpiles v Tertiary crushing v Washing & screening v Beneficiation
v Jigging

PROCESS DESIGN CONTINUE v Three products stockpiled separately
v Lumpy v Fines v Medium Size Iron Ore
v Dual rapid loadout @ 5400 tph into 342 x 100ton wagons within 5.0 hour turnaround
v Private siding connected directly to Sishen Saldanha line

PROCESS DESIGN POTENTIAL UPSIDE
v Secondary Fines v Super Fines produced from the jig middlings by re crushing and jigging
v ±3% additional yield v Super Fines
v Produced from the main circuit by treating slimes discard tons through a magnetic separation plant
v ±5% additional yield

PASTE DEPOSITION
1. More efficient volumetric storage and higher insitu dry densities
2. Improved water management 3. Improved stability and reduced safety risk 4. Lower operational cost and risk 5. Accelerated rehabilitation

PASTE DEPOSITION

OUTPUTS KHUMANI TOTAL FINAL PRODUCTS
3.24
4.15
4.08
4.49
4.84
5.10
5.84
6.98
6.98
6.98
6.98
7.33 3.3
5 4.19
4.20 4.5
7
4.93
5.19 5.9
5 7.10
7.10
7.10
7.10
7.46
1.1 1.
2 1.3 1.
4
1.6
1.9
1.9
1.9
1.9 2.
0
0 2 4 6 8
10 12 14 16 18
2007/200
8 2008/200
9 2009/201
0 2010/201
1 2011/201
2 2012/201
3 2013/201
4 2014/201
5 2015/201
6 2016/201
7 2017/201
8 2018/201
9 2019/202
0
Millions
YEAR
TONS
LUMPY FINES MSIO

ANTICIPATED SALES ANTICIPATED SALES VOLUME SCHEDULE VOLUME SCHEDULE
6.21
6.71 8.7
0
10.30
11.43
11.10
11.90
12.50
14.20
16.80
16.80
16.80
16.80
16.80
0 2 4 6 8
10 12 14 16 18
2006/2007
2007/2008
2008/2009
2009/2010
2010/2011
2011/2012
2012/2013
2013/2014
2014/2015
2015/2016
2016/2017
2017/2018
2018/2019
2019/2020
Millions
YEAR
TONS
Total Beeshoek Khumani

1.125 1.172 0.813 0.191 MSIO Sales (local + export) Ktpa
1.000 1.100 0.750 0.191 MSIO Production Ktpa
4.640 3.840 3.279 0.370 Fines Production Ktpa
4.380 3.860 3.171 0.439 Lump Production Ktpa
4.079 4.149 3.241 0.533 Lump Sales (local + export) Ktpa
4.196 4.186 3.345 0.494 Fines Sales (local + export) Ktpa
10 13 10 19 MSIO %
46 44 46 37 Fines %
44 44 44 44 Lumpy %
20102011 20092010 20082009 20072008 Year
KHUMANI OUTPUTS EXPORT Production/Sales

Conglomeratic Ore
Laminated Ore
ORE TYPES (In Situ) ORE TYPES (In Situ)
Detrital Ore

BRUCE PITS Ore Distribution 80% laminated ore 20% conglomerate ore
N
Bruce A Pits Bruce B Pits Bruce C Pits Dumps

KING PITS Ore Distribution 80% conglomerate ore 20% laminated ore
N
King Pits Phase 1 Phase 2 Phase 3 Phase 4 Dumps

KHUMANI MINE RESOURCES
v + One Billion Tons of High Grade Iron Ore Resources
v + 300 Million tons Saleable reserves v Ongoing Exploration on Mokaning

ANTICIPATED TYPICAL QUALITY AT PORT OF DELIVERY
0.05 1.7 4.5 65.5 Medium Size
0.068 1.8 4.8 65.0 FINES
0.048 1.5 3.7 66.0 LUMPY
% P Max
Al2O3 Max
%SiO2 Max
% Fe Min
EXPORT EXPORT
2 0.25 0.025
3.5 0.25 0.055
2 0.25 0.025
H2O Max
% K2O Na2O3
Max
% S Max

CAPITAL EXPENDITURE FOR PHASE ONE R000’s
R3 176 397 000 – US$ 525 024 298 Total Budget
R 559 341 000 – US$ 92 453 058 ROE variation/Escalation/Contingencies
R2 617 056 000 US$ 432 571 240 Sub Total
R 497 522 904 – US$ 82 235 190 Indirects
R 179 261 122 – US$ 29 629 938 Rail and Roads
R 77 217 578 – US$ 12 763 235 Paste / Waste Disposal
R 145 391 952 – US$ 24 031 728 Electrical and Instrumentation
R 305 962 439 – US$ 50 572 304 Infrastructure and Services
R 446 957 207 – US$ 73 877 224 Process Plant
R 560 993 719 – US$ 92 726 234 Materials Handling
R 194 810 079 – US$ 32 200 013 Bruce Crusher
R 208 939 000 – US$ 34 535 370 Mining
Budget Rand US Dollar (R6.05 = $1.00) Description Excluding capitalization of interest and fees

PROJECTS TIMING v Earthworks:
v Detail design Completed v Tender, adjudication & appoint Completed v Site Establishment May 06 v Start earthworks June 06
v Start civil construction Aug. 06 v Start steel/plate fabrication Sept. 06 v Start mech. erection Jan. 07 v Start pipe fabrication Feb. 07 v Start pipe erection May 07 v Start Electrical & Instrumentation installation June 07 v Start cold commissioning Sept. 07 v Start hot commissioning Nov. 07 v Hot commissioning complete Feb.08 v Wash/screen plant Mar.08 v Jig plant Apr.08


