30
Irrigation Water Management and Scheduling John Panuska UW – Extension Biological Systems Engineering Dept. WI Crop Management Conference January 2015
| Date post: | 21-Dec-2015 |
| Category: |
Documents |
| Upload: | george-cameron |
| View: | 218 times |
| Download: | 1 times |

Irrigation Water Management and Scheduling
John PanuskaUW – Extension
Biological Systems Engineering Dept.
WI Crop Management ConferenceJanuary 2015

Irrigation Water Management
So you want to irrigate …….
some questions you might ask:
- How often should I irrigate ?
- How much water should I apply ?
- How do I measure my soil moisture ?
These are a few of the questions that will be discussed today.

Root Zone Soil / Water Balance
Water Inputs = Deposits
Irrigation Rainfall
Deep Drainage = Withdrawal
Evapotranspiration (ET) = Withdrawal

Water in the Soil Profile
Unsaturated
Saturated
Source: Sprinkler Irrigation Systems, Midwest Plan Service, MWPS – 30, 1999
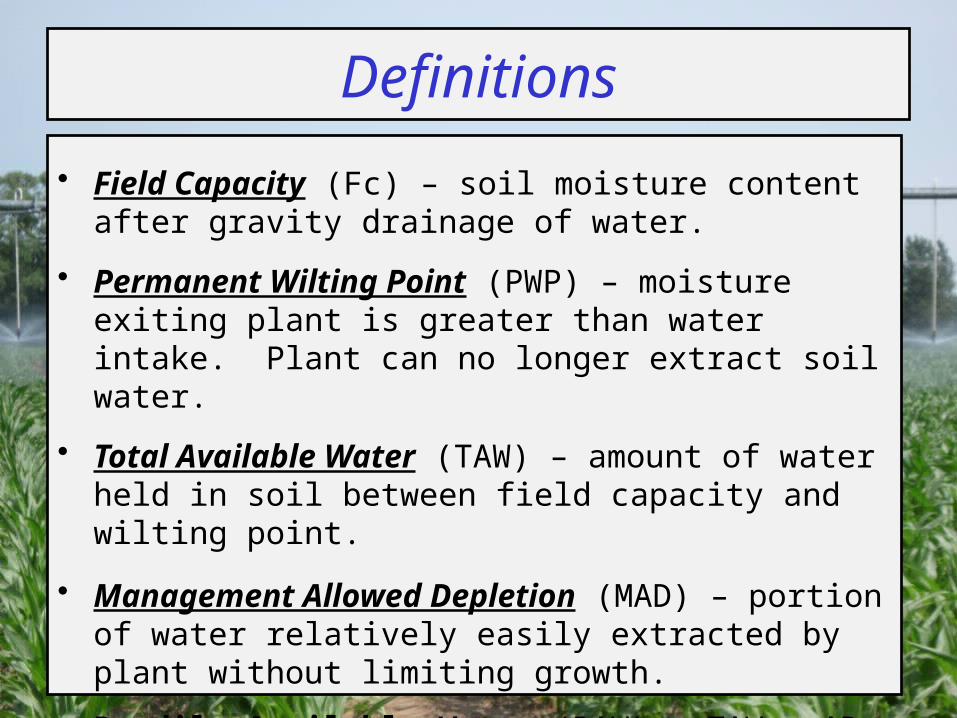
Definitions
• Field Capacity (Fc) – soil moisture content after gravity drainage of water.
• Permanent Wilting Point (PWP) – moisture exiting plant is greater than water intake. Plant can no longer extract soil water.
• Total Available Water (TAW) – amount of water held in soil between field capacity and wilting point.
• Management Allowed Depletion (MAD) – portion of water relatively easily extracted by plant without limiting growth.
• Readily Available Water (RAW) = TAW x AD

Soil Moisture Primer
SaturationField Capacity
Plant water stress begins
Plant water stress increasesPermanent wilting point
Total Available
Water
Unavailable water
Management Allowed Depletion
(MAD ~ 0.5 TAW)
Gravitational Water
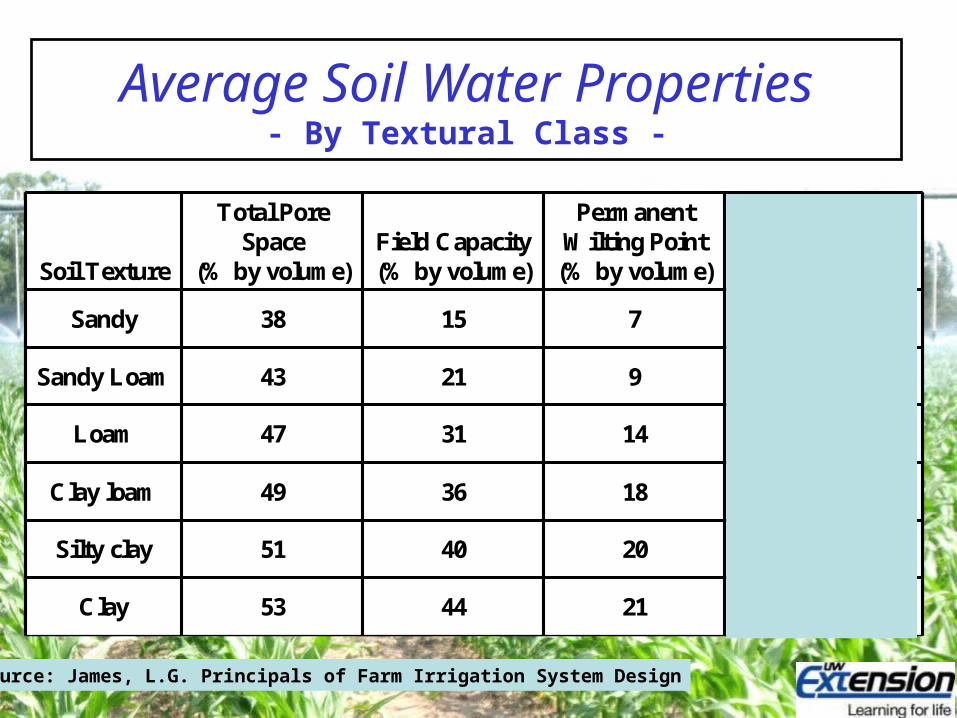
Average Soil Water Properties- By Textural Class -
23214453Clay
20204051Silty clay
18183649Clay loam
17143147Loam
1292143Sandy Loam
871538Sandy
TotalAvailable Water(% by volume)
PermanentWilting Point
(% by volume)Field Capacity(% by volume)
Total Pore Space
(% by volume)Soil Texture
23214453Clay
20204051Silty clay
18183649Clay loam
17143147Loam
1292143Sandy Loam
871538Sandy
TotalAvailable Water(% by volume)
PermanentWilting Point
(% by volume)Field Capacity(% by volume)
Total Pore Space
(% by volume)Soil Texture
Source: James, L.G. Principals of Farm Irrigation System Design
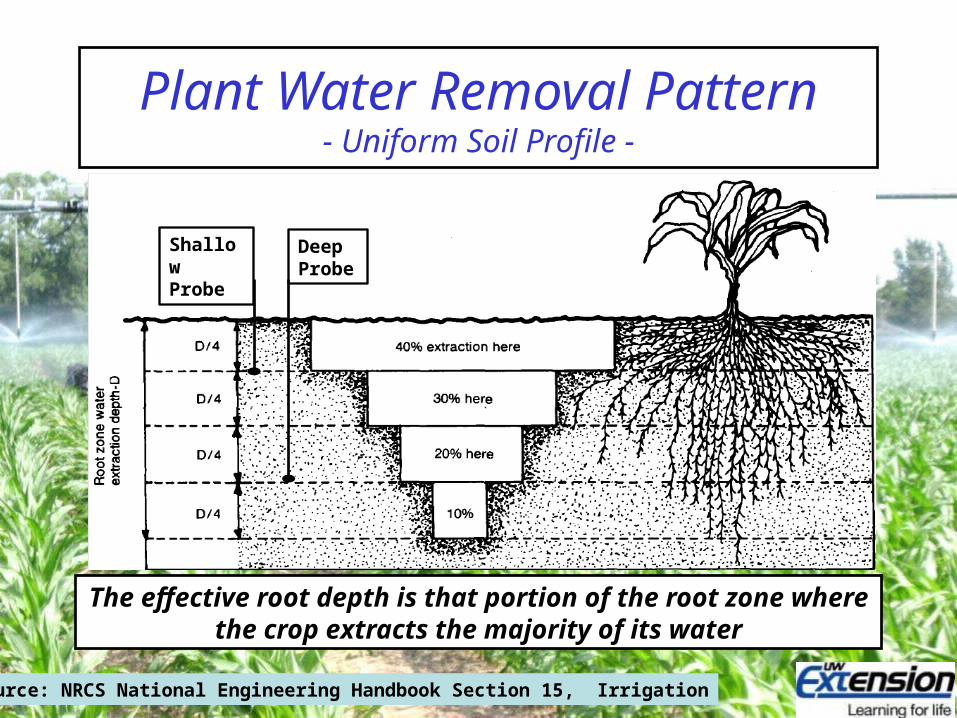
Plant Water Removal Pattern- Uniform Soil Profile -
The effective root depth is that portion of the root zone where the crop extracts the majority of its water
Source: NRCS National Engineering Handbook Section 15, Irrigation
Shallow Probe
Deep Probe
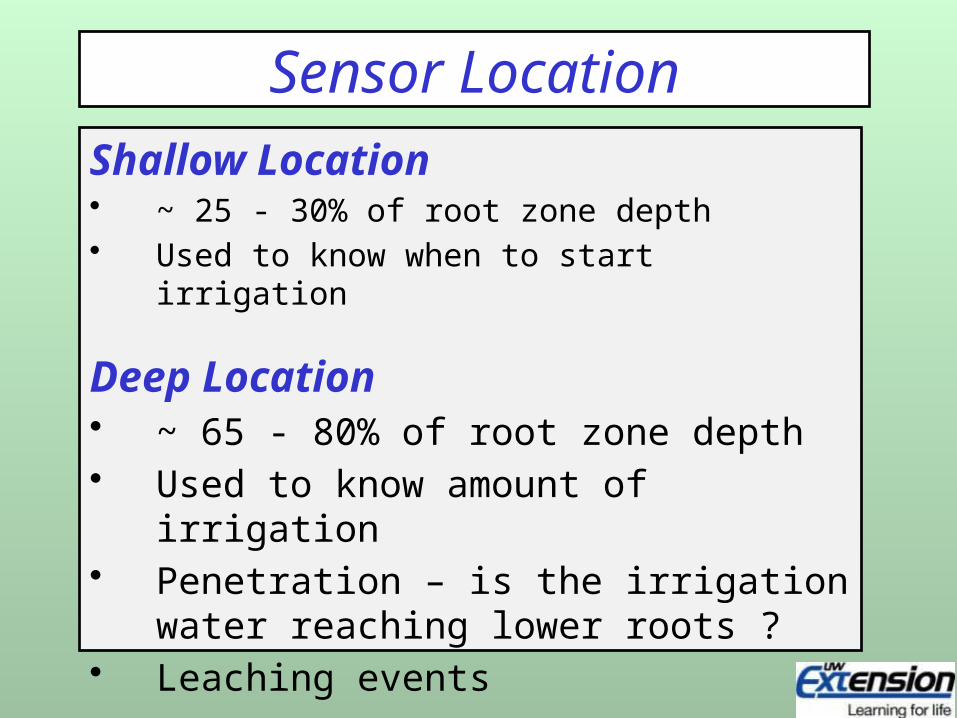
Sensor Location
Shallow Location• ~ 25 - 30% of root zone depth• Used to know when to start irrigation
Deep Location • ~ 65 - 80% of root zone depth• Used to know amount of irrigation• Penetration – is the irrigation water
reaching lower roots ?• Leaching events

Crop
Max Root Depth (in)1
Irrigation Water Mgt. Depth (in) 2
Shallow Sensor
(in) 3
Deep Sensor
(in) 3
Broccoli & cauliflower 24 12 - 18 12 20 - 24
Strawberry 12 - 24 12 - 18 6 12
Potatoes 24 - 36 12 - 18 8 -10 18
Tomato & cantaloupe 36 12 - 24 18 36
Bush bean 24 - 36 18 - 24 10 18
Soybeans 48 - 60 30 - 36 12 - 18 30 - 36
Small grains 48 30 - 36 12 24
Sweet corn 24 - 36 24 - 36 12 24 - 30
Field Corn 48 30 - 36 12 -18 30 - 36
Pumpkins / Winter Squash 36 - 48 30 - 36 18 36
Established alfalfa 60 36 - 48 18 36
Irrigation Water Management Depth
1. USDA – NRCS Part 652 - Irrigation Guide, 1997, Chapter 3, Table 3-42. Depth at which the soil water content should be managed for optimum crop production.3. Soil Moisture Basics, Irrometer Company, http://www.irrometer.com/basics.html

Soil Moisture Management
ManagedRoot Zone
Mgmt. AllowedDepletion
Critical Period
Potatoes 12 - 16” 35% - 50%50%@ vine kill
Flowering and tuber formation to harvest
Peas 24” 50%Start of flowering
and when pods are swelling
Green Beans 24” 40% Blossom through Harvest
Sweet Corn 24” 50% @ establish40% until harvest
Tasseling thru silk stage until kernels
are firm
Grain Corn 36 - 48” 50%Tasseling thru silk stage until kernels
are firm

Crop ET is typically calculated from crop and climate data
ET = (Kc)(ET0)where ET0 = potential ET or reference crop ET and Kc is the crop coefficient that corrects for crop type and canopy development.
Reference crop = well watered (not stressed) alfalfa or grass Potential ET = maximum rate of water removal from soil and plant
surfaces with no plant water stress
In Wisconsin we have statewide potential ET data available
How much water is the crop using ?- Evapotranspiration -

How much water is the crop using ? - WI & MN ET Estimates -
www.soils.wisc.edu/wimnext/water.html
- Based on Priestley - Taylor equation (P-T Potential ET)
- Referenced by latitude and longitude
- Inputs = Solar radiation, temperature, soil heat flux Accuracy : +/- 15 - 20%
- Can be emailed to you daily
Crop ET values from UW Soil Science AG WX site

Precipitation Inputs- Rain Gages -
• Accurate measurements of field conditions
• Three gages in every field is preferred- Records rain and irrigation
• Read gage soon after event to minimize evaporation
• Cost < $50.00

How often should I Irrigate ?- Irrigation Scheduling -
Check Book Method Tracks daily soil water inputs (rain, irrigation), outputs (deep
drainage, ET) and change in storage
Only water when necessary
Use enough to grow a high quality crop
Computer Software or Manual System (Paper) Manually track daily rainfall, irrigation and ET (UWEX A3600)
Use an irrigation scheduling software package

How often should I Irrigate ?- Irrigation Scheduling -
Irrigation scheduling can . . . • Reduce the chance of over irrigating
• Reduce the likelihood of N loss through leaching
• Help to provide more consistent root zone moisture throughout the growing season
• May reduce irrigation cost by taking better advantage of natural rainfall
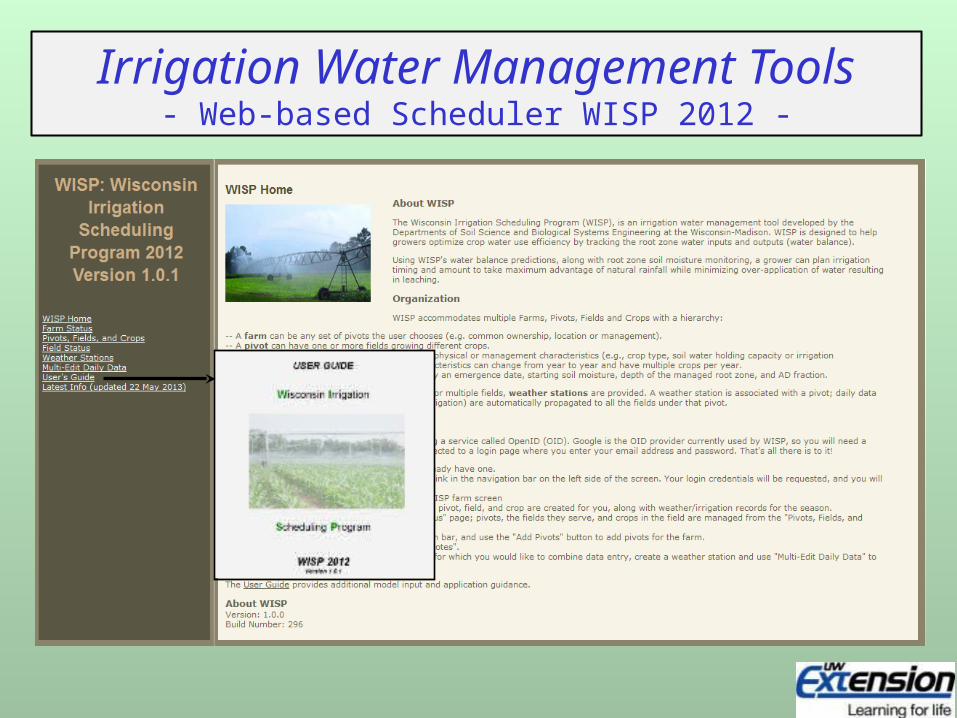
Irrigation Water Management Tools- Web-based Scheduler WISP 2012 -

Source: WISP. CALS. WISC. EDU
Irrigation Water Management Tools- Web-based Scheduler WISP 2012 -

Measuring Soil Moisture
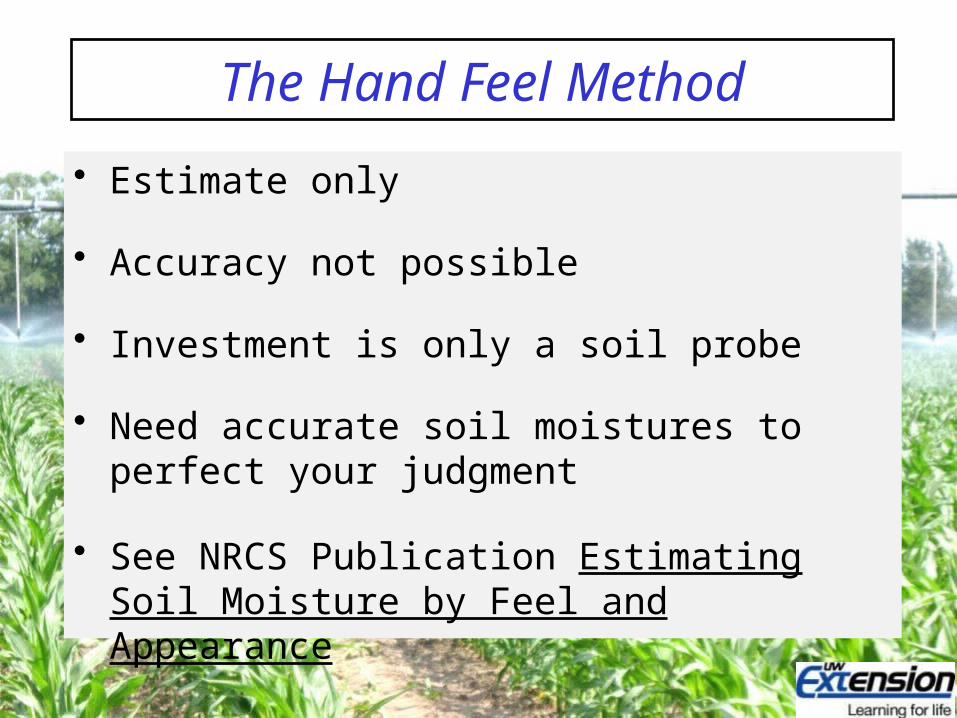
The Hand Feel Method
• Estimate only
• Accuracy not possible
• Investment is only a soil probe
• Need accurate soil moistures to perfect your judgment
• See NRCS Publication Estimating Soil Moisture by Feel and Appearance

Tensiometer
• Works like a mechanical root
• Readings in centibars of vacuum
• Indication of water extraction rate
• Water equilibrates with soil moisture
• Accurate up to 85 centibars (~12 psi)

Tensiometer (Cont.)
• Installed for growing season
• Maintenance required – refill w/distilled water, anti-bacterial agent
• Different lengths
• Cost $82 - 92/each
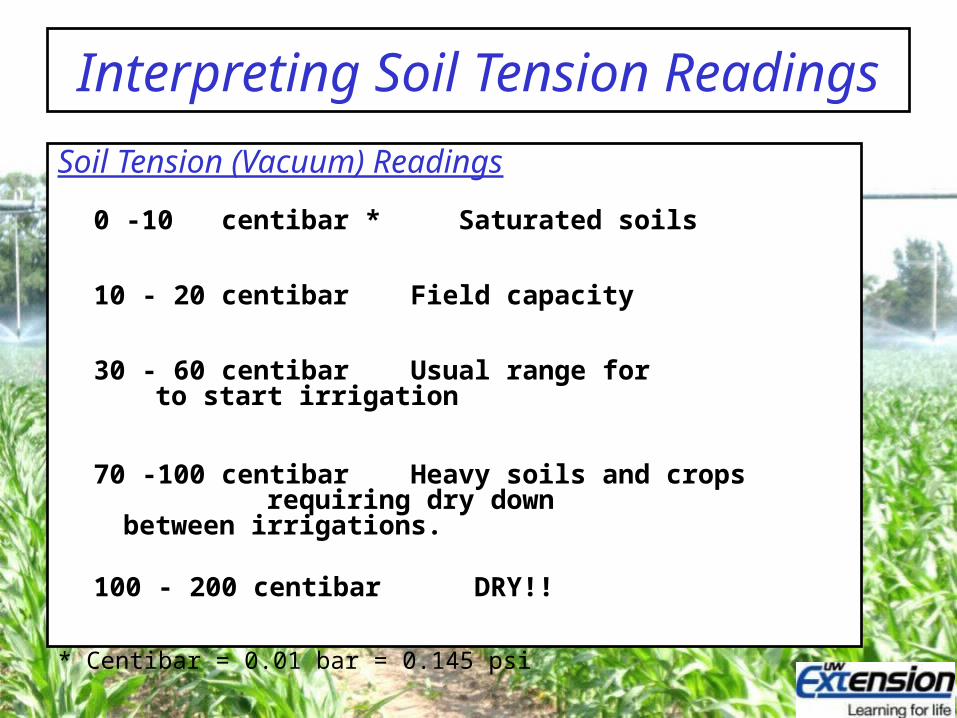
Interpreting Soil Tension Readings
Soil Tension (Vacuum) Readings
0 -10 centibar * Saturated soils
10 - 20 centibar Field capacity
30 - 60 centibar Usual range for to start irrigation
70 -100 centibar Heavy soils and crops requiring dry down between irrigations.
100 - 200 centibar DRY!!
* Centibar = 0.01 bar = 0.145 psi

Electrical Resistance Block
• Solid state • Good soil contact important• Cost
– Sensor: $35 - 45– Meter: $300
• Temperature sensitive• Sensitive to high saline or acid
soils• Withstands freezing, can be re-
use
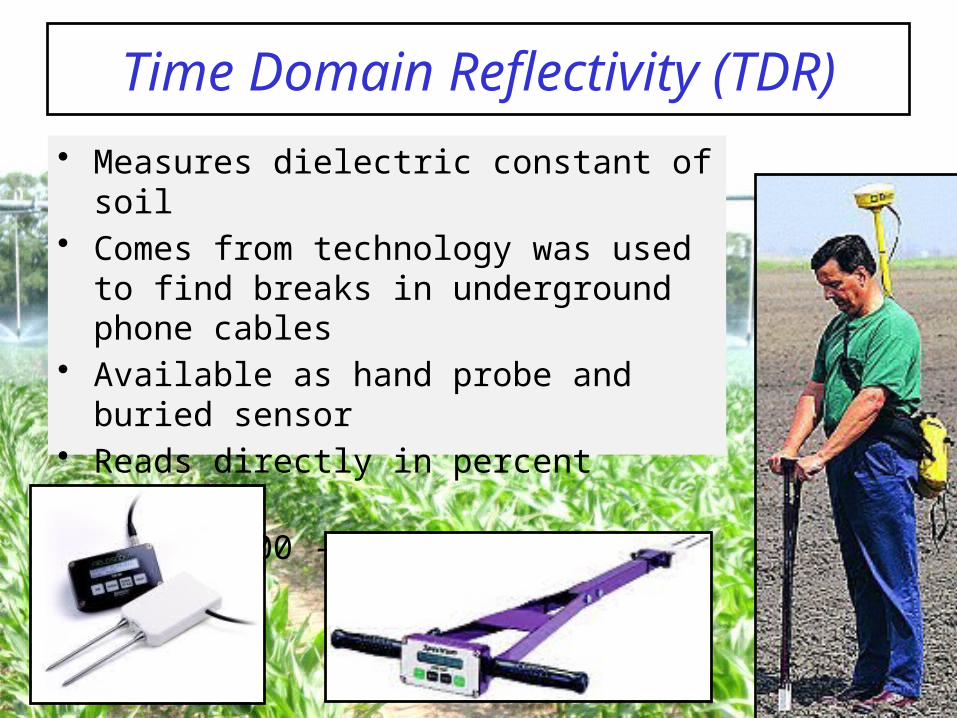
Time Domain Reflectivity (TDR)
• Measures dielectric constant of soil• Comes from technology was used to find
breaks in underground phone cables• Available as hand probe and buried
sensor• Reads directly in percent moisture• Cost: $800 - 1200 – Theta Probe
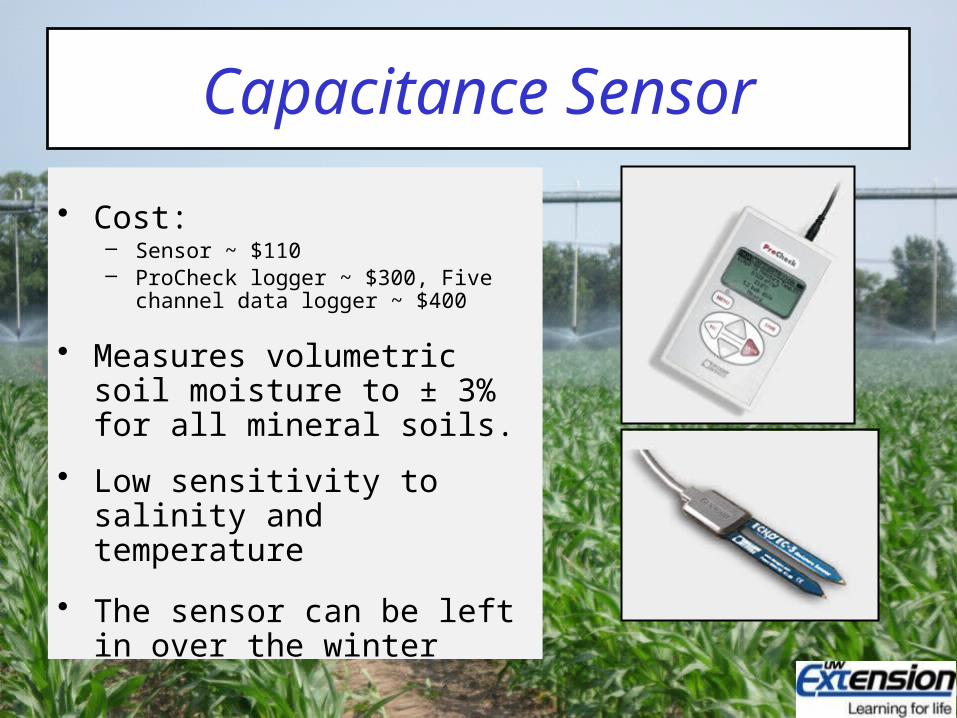
Capacitance Sensor
• Cost: – Sensor ~ $110– ProCheck logger ~ $300, Five channel
data logger ~ $400
• Measures volumetric soil moisture to ± 3% for all mineral soils.
• Low sensitivity to salinity and temperature
• The sensor can be left in over the winter

Multi-Depth Monitoring Systems
- Measure at multiple depths at once
- Uploads data in real time to web
- Often linked with VRI software
- Most costly system $2,000 and up .
AquaSpy System
Photos by Precision Water WorksPlainfield, WI

Moisture Measurement Methods
Sensor Configuration Options
Portable Hand-held Probe (Capacitance, TDR)
• Very portable, can cover a lot of area• A little more difficult to track subsurface
moisture over time (need to dig a hole)
In-place Sensor (tensiometer, resistance blocks)
• Good to monitor moisture at several depths simultaneously
• Limited to a single location

Variable Rate Irrigation (VRI)
Where is VRI useful ??
Overlap areas Boggy or extra dry areas
Varying soil types Non-croped areas
What is VRI ??
VRI allows varying rates of irrigation water application based on the individual field
management zones.

Scott SanfordDistinguished Outreach Specialist
Biological System EngineeringUniversity of [email protected]
608-262-5062
John PanuskaNatural Resources Ext. Specialist
Biological System EngineeringUniversity of [email protected]
608-262-0605


