Irrigation Water Use and its Effective Efficiency in Portugal Naim Haie (1), Rui Pereira (2), Gaspar Machado (2) University of Minho, Campus of Azurem, 4800-058 Guimarães Portugal 1- Water Resources and Environment Group, [email protected]2- Computational Mathematics and Applications Group [email protected], [email protected]ABSTRACT The 2007 report of the Intergovernmental Panel on Climate Change (IPCC) projected with high confidence that the conditions (drought and high temperatures) in the Southern Europe will worsen. It stated that this region that includes Portugal is already vulnerable and will experience a reduction in water availability, hydropower potential and crop yield and productivity. The evidence of such conditions have already struck Portugal when during the 2004-2005 hydrological year experienced one of its worst droughts in decades. Between June to September 2005, the whole country was classified as experiencing sever to extreme drought according to the Palmer Drought Severity Index (PDSI). At the same time, Portugal was developing its new Water Law based on the requirements of the so called Water Framework Directive of the European Union. Its Article 11 states that one of the basic and required measures is to promote efficient and sustainable use of water. As a consequence of these two factors, the Portuguese Government adopted a series of adaptation measures, one of them being a ten year National Program for Efficient Use of Water. This paper will present this program in its irrigation water use, analyse its effective efficiency and discuss advantages and disadvantages of the portfolio of measures that are being considered. Until recently, classical efficiency defined as the ratio of the beneficial output to input was mostly used to calculate irrigation water efficiency. But in this study, the effective efficiency (EE) indicator was used which is defined as the ratio of beneficial output to the effective demand. Beneficial output is essentially net evapotranspiration. The preliminary results show an EE of about 60% corresponding to an effective water demand of about 6.6 billion cubic meter per year. This quantity of water is more than 85% of total water demand in Portugal. The cost of supplying this amount of water is estimated to be about half a billion Euros per year resulting in about 200 millions of Euros of losses. Some specific results of two river basins namely the international Douro River Basin will be presented in this paper. The Program sets a goal of improving the EE to 65% to be achieved in 10 years by 2015. Four areas of intervention were proposed to achieve this goal: information and education, training and technical help, legislation and normalisation, and Measurement and conversion of equipments of water use. Keywords: Effective Efficiency, Irrigation, Douro River Basin, Portugal
Transcript
Irrigation Water Use and its Effective Efficiency in Portugal Naim Haie (1), Rui Pereira (2), Gaspar Machado (2) University of Minho, Campus of Azurem, 4800-058 Guimarães Portugal 1- Water Resources and Environment Group, [email protected] 2- Computational Mathematics and Applications Group [email protected], [email protected] ABSTRACT The 2007 report of the Intergovernmental Panel on Climate Change (IPCC) projected with high confidence that the conditions (drought and high temperatures) in the Southern Europe will worsen. It stated that this region that includes Portugal is already vulnerable and will experience a reduction in water availability, hydropower potential and crop yield and productivity. The evidence of such conditions have already struck Portugal when during the 2004-2005 hydrological year experienced one of its worst droughts in decades. Between June to September 2005, the whole country was classified as experiencing sever to extreme drought according to the Palmer Drought Severity Index (PDSI). At the same time, Portugal was developing its new Water Law based on the requirements of the so called Water Framework Directive of the European Union. Its Article 11 states that one of the basic and required measures is to promote efficient and sustainable use of water. As a consequence of these two factors, the Portuguese Government adopted a series of adaptation measures, one of them being a ten year National Program for Efficient Use of Water. This paper will present this program in its irrigation water use, analyse its effective efficiency and discuss advantages and disadvantages of the portfolio of measures that are being considered. Until recently, classical efficiency defined as the ratio of the beneficial output to input was mostly used to calculate irrigation water efficiency. But in this study, the effective efficiency (EE) indicator was used which is defined as the ratio of beneficial output to the effective demand. Beneficial output is essentially net evapotranspiration. The preliminary results show an EE of about 60% corresponding to an effective water demand of about 6.6 billion cubic meter per year. This quantity of water is more than 85% of total water demand in Portugal. The cost of supplying this amount of water is estimated to be about half a billion Euros per year resulting in about 200 millions of Euros of losses. Some specific results of two river basins namely the international Douro River Basin will be presented in this paper. The Program sets a goal of improving the EE to 65% to be achieved in 10 years by 2015. Four areas of intervention were proposed to achieve this goal: information and education, training and technical help, legislation and normalisation, and Measurement and conversion of equipments of water use. Keywords: Effective Efficiency, Irrigation, Douro River Basin, Portugal
1. INTRODUCTION “Warming of the climate system is unequivocal”. (IPCCa, 2007) The EU Commission recently wrote a Green Paper to the Council, the European Parliament, the European Economic and Social Committee and the Committee of the Regions and mentioned the following (EU Commission, 2007): “… climate change [is] already happening, societies worldwide face the parallel challenge of having to adapt to its impacts as a certain degree of climate change is inevitable throughout this century and beyond, even if global mitigation efforts over the next decades prove successful.” Is the Douro River Basin in Portugal, the study area of this paper, vulnerable to those impacts and threats? The Green Paper states: “The most vulnerable areas in Europe are [see Figure 1 and 2]: Southern Europe and the entire Mediterranean Basin due to the combined effect of high temperature increases and reduced precipitation in areas already coping with water scarcity.” In 2004/05 Portugal suffered a severe drought in its territory. In this hydrological year, records of low rainfall were experienced over the last 100 years in the majority of the places where records exist. By June to September of 2005, the whole territory was experiencing severe or extreme drought according to the Palmer Drought Severity Index-PDSI (RAR, 2005). In the first two weeks of the month of October 2005, the average water storage in the reservoirs of the Douro River Basin was less than 50%, with a minimum of 6% at Sabugal (RAR, 2005). It should be noted that Douro River Basin, one of the Large River Systems of the world, is classified as Strongly Affected by dams and urbanised with large water and wastewater supply systems and equipments (UN, 2006). Irrigation is much dependent on these reservoirs. In broad terms, the basin can be divided in two zones in terms of water availability: West of the municipality of Vila Real and East of it. The first one has a 750 mm annual flow and the latter has a 260 mm (in Europe, only Spain has a drier zone) (MAOT, 2001). In this century, the temperatures in the Douro River Basin is expected to rise by 3-4.5ºC with an average of more than 3.5ºC (Figure 1), and the annual precipitation will reduce by 10-40% with an average of about 25% (Figure 2). This combination is one of the worst conditions for the hydrologic cycle, nature in general and human activities-for sure irrigation, the biggest water user. Indeed the basin in its totality is vulnerable because of multiple stresses and drivers. Adaptation is one of the two key paths to reduce risks and increase resiliency.
Figure 1: Change in mean annual
temperature by the end of this century Figure 2: Change in mean annual
precipitation by the end of this century In a world with climate change and global warming, problems related to water stress are going to increase in some areas of the globe. In Figure 3 (IPCC, 2007) we can see the predicted variation in water availability for the period 2090-99 relative to the period 1980-1999. From this figure we can observe that California, Mediterranean region (including Portugal), Austral Africa, and Western Australia are the most affected areas. Being Agriculture the main water demanding sector in Douro River Basin, irrigation becomes a critical issue.
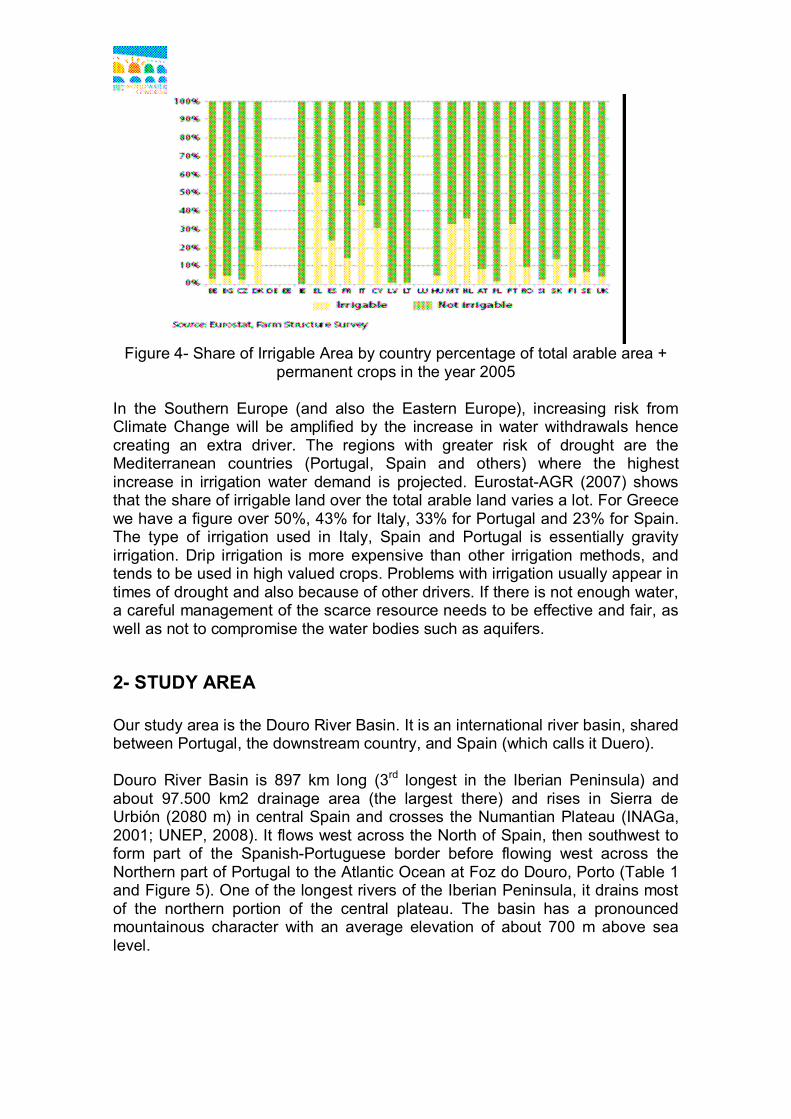
Figure 3- Water availability for the period 2090-99 relative to the period 1980-99 Nowadays, 250 million hectares, or 17% of agricultural area is irrigated, producing about 36% of the World’s food (Wolf, 1996). In the European Union (Eurostat-AGR, 2007) the percentage of irrigated land is 13.5% (excluding Germany), although the figures vary a lot from country to country. The percentage of irrigated land is higher in the Mediterranean and lower in the Northern Europe. In Figure 4 we have the share of irrigable area by country percentage of the total arable area plus permanent crops in the year 2005.
Figure 4- Share of Irrigable Area by country percentage of total arable area +
permanent crops in the year 2005 In the Southern Europe (and also the Eastern Europe), increasing risk from Climate Change will be amplified by the increase in water withdrawals hence creating an extra driver. The regions with greater risk of drought are the Mediterranean countries (Portugal, Spain and others) where the highest increase in irrigation water demand is projected. Eurostat-AGR (2007) shows that the share of irrigable land over the total arable land varies a lot. For Greece we have a figure over 50%, 43% for Italy, 33% for Portugal and 23% for Spain. The type of irrigation used in Italy, Spain and Portugal is essentially gravity irrigation. Drip irrigation is more expensive than other irrigation methods, and tends to be used in high valued crops. Problems with irrigation usually appear in times of drought and also because of other drivers. If there is not enough water, a careful management of the scarce resource needs to be effective and fair, as well as not to compromise the water bodies such as aquifers.
2- STUDY AREA Our study area is the Douro River Basin. It is an international river basin, shared between Portugal, the downstream country, and Spain (which calls it Duero). Douro River Basin is 897 km long (3rd longest in the Iberian Peninsula) and about 97.500 km2 drainage area (the largest there) and rises in Sierra de Urbión (2080 m) in central Spain and crosses the Numantian Plateau (INAGa, 2001; UNEP, 2008). It flows west across the North of Spain, then southwest to form part of the Spanish-Portuguese border before flowing west across the Northern part of Portugal to the Atlantic Ocean at Foz do Douro, Porto (Table 1 and Figure 5). One of the longest rivers of the Iberian Peninsula, it drains most of the northern portion of the central plateau. The basin has a pronounced mountainous character with an average elevation of about 700 m above sea level.
Table 1– Douro River Basin Portugal Spain
Area, km2 18,500 (19%) 79,000 (81%) Average natural runoff, km3/year 8.2 (35%) 15.0 (65%) Liters/m2/year 443 190 Population 1,730,000 2,270,000 Volume/Person, m3/capita 4,740 6,608
Figure 5- Douro River Basin shared between Portugal and Spain (INAG)
The middle Douro is extensively used for irrigation. Grapes are the chief crop of the Douro valley, and the Douro estuary is the centre of Portuguese wine trade. Traditional, private and public irrigation are present in the region with a total area of 2,000 km2. Traditional irrigation is based on surface methods, while the other two types use the three methods of irrigation-Table 2 (INAGa, 2001). Most of the small private irrigations occur mainly in the downstream section of the basin, since there are more water and the soils are more appropriate.
Table 2- Irrigation types in Douro River Basin and their efficiencies Irrigation
Type Área, km2
Surface Efficiency, %
Sprinkler Efficiency, %
Drip Efficiency, %
Private 1,670 60 80 85 Public 30 60 75 80 Traditional 300 50 --- ---
3- METHODS In this study, effective efficiency has been used in order to account for recycled water as well as quality consideration. It is defined as follow (Haie and Keller, 2008): EE = U / ((1-W1) V1 – (1-W2) V2) (1)
Where EE = Effective Efficiency; U = Beneficial output is essentially net evapotranspiration (ET), V1 = volume of flow at section 1 (inflow); V2 = volume of flow at section 2 (outflow); W1 and W2, both ranging between 0 and 1, are quality discount weights that give the effective portions of V1 and V2, respectively. The discounts are generally necessary because of water quality degradation. Section 1 is the point of inflow (basin level) or diversion (project level), and section 2 refers to outflow or return flow. For example, a saline irrigation return flow (V2) is discounted by W2 = LR, LR being the Leaching Requirement, the excess amount of water passing through the crop root zone to control salinity. Equation 1 is called the full quantity and quality model or simply the Full Model (EEF). Besides the F(ull) Model, two other types were defined: A) Type N Model (W1 = 0 and W2 = 0) which is a quaNtity model: EEN = U / (V1 – V2) (2) B) Type C Model (W1 = 0 and W2 = 1) EEC = U / V1 (3) This is a model used most often in the world, but it was shown that it should not be used in favour of the other two models (Haie and Keller, 2008). For the estimation of ET, the following simplified equation for calculating ET0 can be used (Samani, 2000): ET0 = 0.0135 x Rs x (TC + 17.8) Rs = KT x Ra x TD^0.5 KT = 0.00185 x TD^2 - 0.0433 x TD + 0.4023
(4)(5)(6)
where KT is an empirical coefficient, Rs is the solar radiation at the surface in equivalent water evaporation with the same unit as ET, Ra is the extraterrestrial radiation in the same unit as Rs, TD is the maximum daily temperature minus the minimum daily temperature in degrees Celsius, and TC is the average daily temperature in Celsius. For KT, Hargreaves (1994) and Allen et.al. (1998) recommended using 0.16 for "interior" regions and 0.19 for “coastal” zones, but the above equation for KT reduces errors in some cases, according to Samani. He indicates that “at least 80% of ET0 can be explained by temperature and solar radiation”.
4- PRELIMINARY RESULTS AND MEASURES The Portuguese Government adopted a series of adaptation measures, one of them being a ten year National Program for Efficient Use of Water-PNUEA (PCM, 2005). It states that the total demand of water in Portugal is estimated to be 7.5E+09 m3/year. This amount of water has a global value for the society of about 1.9E+09 €/year, taking into account the real cost of water. This value represented about 1.65% of the GDP in the year 2000. Agriculture is the sector that demands more water. Its demand is estimated to be 6.55E+09 m3/year.
This accounts for 87% of the total demand of water. The urban demand for water is estimated to be 5.7E+08 m3/year (8 % of total demand) and industrial demand of water is 3.85E+08 m3/year (5 % of total demand of water). These are shown graphically in Figure 6. If we take into account the effective costs of the water use, we verify that the urban sector becomes the most relevant. It accounts for 8.75E+08 €/year, representing 46% of total cost of water. Agriculture accounts for 5.24E+08 €/year in terms of costs, representing 28% of total cost of water, and finally, industry accounts for 4.84E+08 €/year representing 26% of total cost of water (Figure 7).
Figure 6- Percentage of total water demand by sector per year
Figure 7- Percentage of cost of water per sector per year
For the Douro River Basin, the corresponding values are estimated as follows: the total water demand for agriculture is 2.06E+09 m3/year and the beneficial consumptive use of about 1.20E+09 m3/year. Assuming that about 5 to 10% of the total return-flow (%V2) is being recycled currently, a value of about 60% is found for EEN. This is the base value used in National Policies for deciding on the measures to be developed for the betterment of agricultural efficiency to 65% in 10 years, i.e., by 2015 (PCM, 2005). Using the Full EE model, Figures 8 (a, b, and c) show the impact of different strategies on efficiency in the Douro River Basin:
50
60
70
80
90
EE_F (W1=0.0)
W2%V2
(a)
50
60
70
80
90
EE_F (W1=0.05)
%V2W2
(b)
50
60
70
80
90
EE_F (W1=0.10)
W2%V2
(c)
55
60
65
70
75
0 10 20 30 40 50 60
% V2
EE_N
(d)
Figure 8- Relationships between %V2, W1 (0, 0.05, 0.1), W2 and EEF (a, b, c)
and EEN (d) Figure 8a portrays average conditions with the current situation at about 60% efficiency that corresponds to W1=0 and %V2=5%. W2 does not have much impact on EE because of low value of V2, so W2 could be assumed to be 0 or 0.05. As such, achieving the goal of 65%, the important factor becomes %V2 that should be increased to 30% (W1=0, W2=0.1). However in a dry period, W1 increases and so do W2. But if W1 approaches 0.1, no matter what the W2 and %V2 values are, EE will always be greater than 65% (Figure 8c). However at W1=0.05, W2 = 0.10 (to 0.20), a %V2 of 15% (or an increase of about 10% in 10 years) is needed to achieve the 65% goal (Figure 8b). If a quantity model is used, one sees again that a %V2=25% (or an increase of 20%) is needed to achieve the 65% goal (Figure 8d). One can mention that having everything else constant, EE increases if: W1 increases, W2 decreases or V2 increases. In PNUEA four areas of intervention were proposed to achieve the increases needed in efficiency. They are:
• Measurement and conversion of equipments of water use, • Information and education and public awareness, • Legislation and normalisation, and • Training and technical help.
In order to achieve these results in the Agricultural Sector, a series of measures are being considered (INAGb, 2001): 1) General measures, applicable in all types of irrigation used, either in new
projects or conversion of old systems. This is included in a group of measures to take in situations of scarcity of water. Some of these measures are: a) Improvement of the quality of projects. b) Adaptation of the irrigation techniques used. c) Irrigation warning systems. d) Adequate pricing of water. e) Reduction of irrigation volumes of water in scarcity situations. f) Reduction of the irrigated area in severe scarcity situations.
2) Measures related with the transportation and distribution systems: a) Management optimization of the reservoirs. b) Reduction of losses in the transportation system. c) Management procedures to adjust demand / consumption. d) Improvement of the transport and distribution network.
3) Measures related to gravity irrigation: a) Conversion of the processes of furnishing furrows and borders with water b) Improvement of gravity irrigation subsystem. c) Management improvement of gravity irrigation.
4) Measures related to sprinkler irrigation a) Adaptation of the procedures in sprinkler irrigation: installation of natural /
artificial cut-winds, surface water flow control and irrigation during the night.
b) Substitution of sprinkler irrigation systems in windy regions. c) Suitability of using Cannon sprinkler systems. d) Substitution of mobile sprinkler irrigation equipments.
5) Measures related with drip irrigation a) Adaptation of procedures for drip irrigation b) Substitution of equipment taking into account the soil texture.
5- CONCLUSIONS The 2007 report of IPCC projected with high confidence that the conditions (drought and high temperatures) in Portugal and Spain will worsen to the detriment of water availability, hydropower potential and crop yield and productivity. The 2004-2005 drought was the worst in decades with various months experiencing sever to extreme drought according to PDSI index. Portugal is now equipped with a new Water Law (transposition of the EU Water Framework Directive) and a new ten year National Program for Efficient Use of Water-PNUEA. This paper shows the tentative results of trying to quantify and analyse effective efficiency (EE) at the level of the International Douro River Basin in the North of the Iberian Peninsula. It was shown that EE for a normal year is about 60% in agriculture that should be increased to 65% in ten years, i.e., by 2015 according to PNUEA. An analysis of the results showed that one of the strategies could be to increase the recycling of the irrigation water by about
20 to 25%. It was also shown that if the leaching requirement (or W1) goes toward 0.10, EE will be greater than 65% independent of other variables. In other words, having everything else constant, EE increases if: W1 increases, W2 decreases or V2 increases. Indeed various measurements have been proposed to improve EE. However, the difficulty in quantifying EE (even EEN) at the basin level is what encourages us to continue our research towards a better understanding of efficiency.
6- REFERENCES • Allen, R.G., Pereira, L.S., Raes, D., and Smith, M., 1998, “Crop
evapotranspiration: Guidelines for computing crop water requirements.”
FAO Irrigation and Drainage Paper No. 56, Food and Agricultural
Organization of the United Nations, Rome.
• AR, 2005, “Lei da água”, Lei 58/2005 de 29 de Dezembro (in Portuguese)
• EU Commission, 2007, “Adapting to climate change in Europe – options
for EU action”, Green Paper, from the Commission to the Council, the
European Parliament, the European Economic and Social Committee and
the Committee of the Regions, Brussels, 29.6.2007, COM(2007) 354 final.
• Eurostat-AGR, 2007, “Agriculture Main statistics 2005-06”, Eurostat-
European Comission
• Haie, N, A.A. Keller, “Effective Efficiency as a Tool for Sustainable Water
Resources Management”, Journal of the American Water Resources
Association, in press.
• Hargreaves, G. H., and Samani, Z. A., 1982. “Estimating potential
evapotranspiration.” J. Irrig. Drain. Eng., 108-3, 225–230.
• Hargreaves, G.H., 1994, "Simplified coefficients for estimating monthly
solar radiation in North America and Europe." Departmental Paper, Dept.
of Biol. and Irrig. Eng., Utah State University, Logan, Utah.
• INAGa (Instituto da Água), 2001, “Plano de Bacia Hidrográfica do Rio
Douro”, Relatório Final, Março (in Portuguese)
• INAGb (Instituto da Água), 2001, “Programa nacional para o uso eficiente
da água", LNEC/ISA, Versão Preliminar, September (in Portuguese)
• IPCC (Intergovernmental Panel on Climate Change), 2007, at
http://www.ipcc.ch
• IPCCa, 2007: Climate Change 2007: Impacts, Adaptation and
Vulnerability. Contribution of Working Group II to the Fourth Assessment
Report of the Intergovernmental Panel on Climate Change, M.L. Parry,
O.F. Canziani, J.P. Palutikof, P.J. van der Linden and C.E. Hanson, Eds.,
Cambridge University Press, Cambridge, UK, 976pp.
• MAOT (Ministério do Ambiente e do Ordenamento do Território), 2001,
"Plano de Bacia Hidrográfica do Douro", DR 19/2001, 10 Dezembro (in
Portuguese)
• PCM (Presidency of the Council of Ministers), 2005, "Programa Nacional
para o Uso Eficiente da Água — Bases e Linhas Orientadoras (PNUEA)",
Resolução do Conselho de Ministros n.o 113/2005, 5 June
• PNUEA, 2001, “Programa Nacional para o uso eficiente da água”,
INAG/LNEC/ISA, Setembro (in Portuguese)
• RAR, 2005, “Seca em Portugal Continental – Relatório Assembleia da
República”, 18 de Outubro (in Portuguese)
• Samani, Z., 2000, “Estimating solar radiation and evapotranspiration using
minimum climatological data”, Journal of Irrigation and Drainage
Engineering, Vol. 126, No. 4, July/August, pp. 265-267
• UN, 2006, “Water: A Shared Responsability”, WWDR2, p.176.