AD-A239 068 U ~USA IS E C US Army Information Systems Engineering Command Fort Huachuca, AZ 85613-5300 U.S. ARMY INSTITUTE FOR RESEARCH IN MANAGEMENT INFORMATION, COMMUNICATIONS, AND COMPUTER SCIENCES (AIRMICS) AN ENVIRONMENT FOR SIMULATION OF DISTRIBUTED SYSTEMS (ASQB-GC-90-014) February 1990 )T C ~EL ECT E %AUG 0I1991U D MDSh~U'TION STATEMZNT A Ap.vved for pub~lic rel~eu; Dtiabbutii Unlimitod 115 O'Keefe Bldg Georgia Institute of Technology Atlanta, GA 30332-0800 91-06546 "39
Transcript
AD-A239 068U ~USA IS E CUS Army Information Systems Engineering CommandFort Huachuca, AZ 85613-5300
U.S. ARMY INSTITUTE FOR RESEARCHIN MANAGEMENT INFORMATION,
COMMUNICATIONS, AND COMPUTER SCIENCES(AIRMICS)
AN ENVIRONMENT
FOR SIMULATION OF
DISTRIBUTED SYSTEMS
(ASQB-GC-90-014)
February 1990
)T C~EL ECT E%AUG 0I1991U
D MDSh~U'TION STATEMZNT A
Ap.vved for pub~lic rel~eu;Dtiabbutii Unlimitod
115 O'Keefe BldgGeorgia Institute of TechnologyAtlanta, GA 30332-0800
91-06546"39
UNCLASSIFIED~~Pfl1E~fiwm dt T~AU fPn~PI
REPORT DOCUMENTATION PAGE OMB N. 0704-JU_____________________________________________________Exp. Date: Jos 30.11S6
FUNCLASSIFIED _________________2.SECURITY CLASSIFICATION AUrfORITY 3. DISTRIOUTION I AVAILABILITY OF REPO~r
NIA2b. DECLASSIFICATION I DO UWNOXRADIWG SCIIIEDULE
N/A UNLIMITED4. PERFOMIING ORGANIZATION RtEPORT NUMBIER(S) S. MONITORING ORGANIZATION REPO~rTNIJMBE*(S)
N/A _________ A B]- C-90-014
6a. NAME OF PERFORMING OPGANIZATION (i applOFicaYbl 72. NAME OF MONITORING ORGAWIZATION
Innovative Research. Inc. __________ AIRMICS_dc. ADDRESS (City. State. and ZIP Code) 7i. 'ADDRESS (City. State. and Zip Code)
180 ookStret, uite315115 O'Keefe Bldg.,180 ookStret, uite315Georgia Institute of Technology
Denver, Colorado 80206 _________ Aflinta- GA 30137-lRMlfSa. NAME OF FUNDINGISPONSORING 3 b. OFFICE SYMBOL 9. PROCUREMENT INSTRIIME!NT IDENTIFICATION NUMBER
ORGANIZATION I (it applicable)
AIRMICS j ASQB-GC DAKF1 1-89-C-0023Sc. ADDRESS (City. State. and ZIP Code) 10- StTSCF .F FTt.( T.?1nAtF
115 O'Keefe Bldg., ROGRAM PROJECT ITASK WOKur
Georgia Institute of Technology EL ME T O O g CCSIO O
Atlanta, GA 30332-0800 62783A I DY1O-01-01i011. TITLE (include Security Classification)
Environment for Simulation of Distributed Systems (UNCLASSIFIED)12. PERSONAL AUT1HOR(S)
Mohsen Pazirandeh13a. TY'PE OF REPORT 13b. TIME COVERED 14. DATE OF REPORT (Year. Month. Day) 1S. PAGE COUNT
Final FRIOM _6/1/89 To 12/31/89 1990 February 15 4916. SUPPLEMENTARY NOTATION
N/A17. COSATI CODES 18. SUBJECT TERMS (Continue on reverse if necessary and identify by block number)
FII!ZD GROUP ISUB-GROUP Siuaion, Distributed Systems, Operating Systems, Data Base ManagementSystems, Performance Measurement, Optimization
19. ABSTRACT (Continuc on reverse if necessary and identity by block number)
The purpose of this research was: (1) to study the feasibility of developing an environment for the s'-iulation ofdistributed systems, and (2) to build a prototype version of the proposed environment to show some oi ;Ls capa-bilities. The research showed that such an environment can be developed and must contain a number ,!. librariesincluding hardware components, operating systems, Data Base Management System, algorithms, perforzma:,cemeasures, and several knowledge bases.
The capabilities of such an environment was demonstrated via the implementation and assessment of the perform-ance of a distributed database implemented under a DBMS, native operating system, and the Cronus distributedoperating system. A somewhat complex set of algorithms for evaluating the performance of the database woS de-veloped and implemented. This prototype will form the baseline for Phase 11 development. The major featuresand components of the prototype tool which will be expanded during Phase 11 development are as follows:
- The detailed definition and updating of a number of libraries, including operating systems, performance meas-ures, DBMSs, and databases. (continued next page)
20. DISTRIBUTION / AVAILABILITY OF ABSTRACT 21. ABSTRACT SECURITY CLASSIFICATION
SUNCLASSIFIED I UNL.IMITED []SAME AS RI'T. [] DTIC USERS UNCLASSIFIED
22a. NAME 01- RESPONSIBLE INDIVIDUAL, 22b. TELEPHONE (include Area oe 22c OMFICE SYMBOLSon T. Nguven (404) 894-3136 ASOB-GC
DD FORM 1473, 841 MAR 83 APR edition may be used until exhausted SvLU17 CLSSIFICATION OF TIlS PAGE:All other editions are obsolete UNCLASSIFIED
(continued from Block 19)
- Easy assignment and reassignment of system elements (operating systems, DBMSs, etc.). This is accom-plished by selecting the desired elements and "clicking" on the new host.
- The development of a detailed model of the Cronus distributed operating system which will be used inthe full scale version of environment.
- A library of algorithms for developing simulation, analyzing the performance, and optimizing the systemoperation.
- Knowledge bases for the isolation of performance failures to a device and optimal assignment of applica-tion functions to processors.
- Workload and application functions can be defined, assigned to various processors, and analyzed. Theycan be reassigned to different processors of workstations to evaluate the impact on performance.
Or~c
Accession For
NTIS GRA&I RO
DTIC TAB 5Unannounced 5Justification
By,Distribution/
Availability Codes
Avail and/orDist Special"11
The purpose of this research is to determine the feasibility of developing an environmentfor simulating the operations of disvbuted systems and mapping them into a parallelarchitecture. The distributed systems will consist of a hardware architecture and anapplication which in this case is a discrete event simulation. The application is executedunder two operating systems: a distributed operating system (Cronus) and a nativeoperating system which is a function of the host processor. From an analysis perspective,the two operating systems are considered part of the application and will be modeledaccordingly. The hardware architecture consists of a set of (possibly heterogeneous)processors connected via an interconnection network. The application (simulation and theoperating systems) is decomposed into functions and distributed to various hosts. Theinterprocessor communication among processors is handled by the distributed operatingsystem Cronus while the local requirements are served by the native operating system.There will be heavy interaction between the distributed operating system and the nativeoperating system of each host processor.
This research report is not to be construed as an official Army position, unless sodesignated by other authorized documents. Material included herein is approved forpublic release, distribution unlimited. Not protected by copyright laws.
THIS REPORT HAS BEEN REVIEWED AND IS APPROVED
s/ s/ r
John W. Gowens John R. MitchellDivision Chief DirectorCNSD AIRMICS
Table of Contents
List of Figures ...................................................................................................................... 11.0. Introduction ................................................................................................................... 12.0. Phase I Objectives ....................................................................................................... 3
2.1. Technical Objective 1. Specification of Environment ............................................. 32.2. Technical Objective 2. Proof of Concept ............................................................... 4
3.0. Summary of Phase I Results ............................................................................................ 43.1. Features of Prototype Tool and the Proposed Environment. ........................................ 4
3.1.1. User Interface ....................................................................... t ............. 53.1.2. Analysis ....................................................................................... 53.1.3. Output ......................................................................................... 6
3.2. Phase I Limitations and Assumptions ................................................................ 63.3. Assessment of Phase I Research .................................................................... 7
4.0. Specification of the Environment ................................................................................ 84.1. Requirements of the Environment .................................................................... 9
4.1.1. Characteristics of Distributed Systems ............................................... 94.1.2. Characteristics of Simulation M odels ................................................. 10
4.2. Elements of the Environment ......................................................................... 104.2.1. User Interface .................................................................................. 114.2.2. System Definition ......................................................................... 124.2.3. CPU Editor ................................................................................... 194.2.4. Operating System Editor ................................................................ 204.2.5. Data Base M anagement System Editor ................................................ 214.2.6. Database Editor .............................................................................. 224.2.7. Function Editor ............................................................................ 234.2.8. W orkload Editor .............................................................................. 244.2.9. Analysis ....................................................................................... 254.2.10. Performance Measures ................................................................. 264.2.11. Library of Algorithms .................................................................... 264.2.12. Knowledge Base ........................................................................... 27
6.2. M odel of Cronus .......................................................................................... 367.0. Phase II Plans .......................................................................................................... 37
7.1. Development of User Interface ......................................................................... 377.2. System Definition .......................................................................................... 377.3. Measures of Effectiveness ................................................................................ 387.4. Library of Algorithms ................................................................................... 387.5. Knowledge Base Development ........................................................................ 38
7.5.1. Optimal Assignment of Functions to Processors ................................... 397.5.2. Knowledge Base for Isolation of Performance Failures ................................ A1
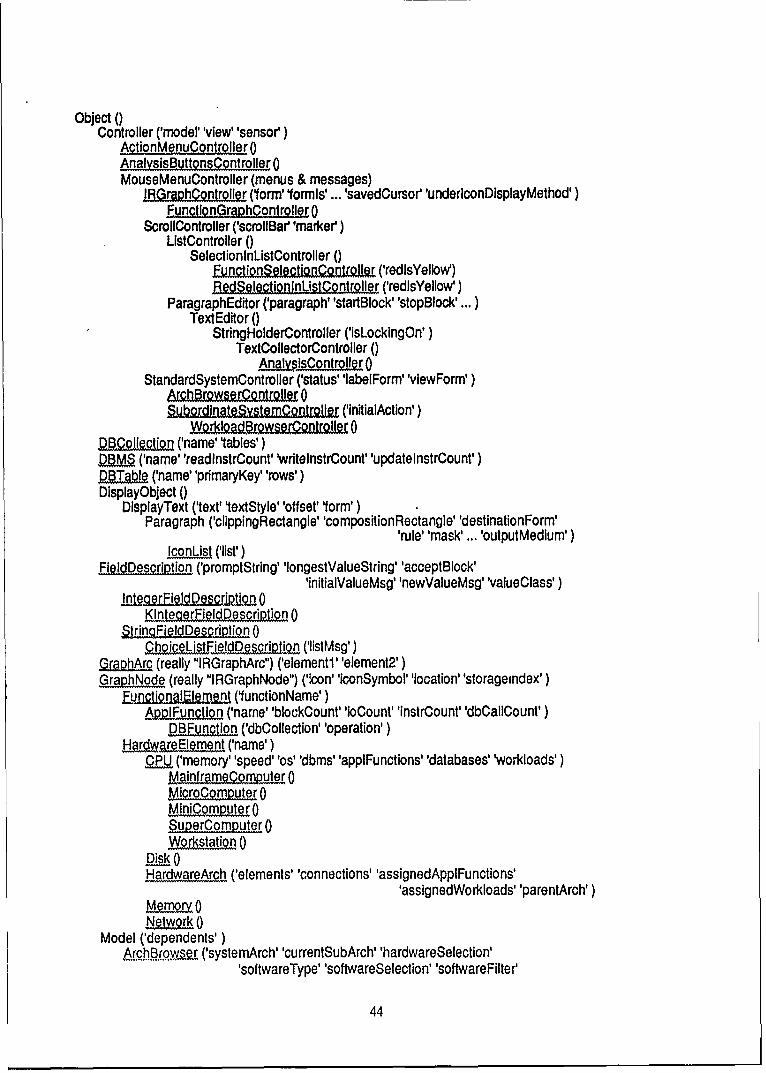
8.1. Phase I Prototype Overall Class Hierarchy ............................................................. 438.2. Object Hierarchy for Graphical Elements of ahr Phase I Prototype ......................... 468.3. Phase I Prototype Editor W indows ................................................................. 468.4. Phase I Prototype System Architecture Object Description ................................... 47
Figure 1. Multiple roles of design assessment .................................... 8Figure 2. Opening window ......................................................... 12Figure 3. Software options ......................................................... 16Figure 4. Software elements ....................................................... 17Figure 5. Software elements assignment status menu .......................... 17Figure 6. System operations menu .................................................... 17Figure 7. Algorithm menu ........................................................... 18Figure 8. CPU editor ............................................................... 19Figure 9. Operating system editor ..................................................... 20Figure 10. Data base management editor .......................................... 21Figure 11. Data base editor ......................................................... 22Figure 12. Function editor ......................................................... 23Figure 13. Workload editor ......................................................... 24Figure 14. Analysis window ...................................................... 25Figure 15. Schematic of updating a record ........................................ 28Figure 16. Distributed architecture of the example .............................. 30Figure 17. Cronus protocol hierarchy ............................................. 35Figure 18. Interface of Cronus, client, and native operating system ....... 37Figure 19. Flow chart of branch selection technique ............................ 41Figure 20. Object hierarchy for graphical elements of the Phase I prototype ..... 46
An Environment for Simulation of Distributed Systems
1.0. Introduction
The purpose of this research is to determine the feasibility of developing an environment forsimulating the operations of distributed systems and mapping them into a parallel architecture. Thedistributed systems will consist of a hardware architecture and an application which in this case is adiscrete event simulation. The application is executed under two operating systems: a distributedoperating system (Cronus) and a native operating system which is a function of the host processor.From an analysis perspective, the two operating systems are considered part of the application andwill be modeled accordingly. The hardware architecture consists of a set of (possiblyheterogeneous) processors connected via an interconnection network. The application (simulationand the operating systems) is decomposed into functions and distributed to various hosts. Theinterprocessor communication among processors is handled by the distributed operating systemCronus while the local requirements are served by the native operating system. There will be heavyinteraction between the distributed operating system Cronus and the native operating system ofeach host processor.The traditional modeling practices and approaches, successfully applied to Von Neumannarchitectures cannot be easily applied to the present problem. There are a number of reasons forthis including:
* Distributed system applications and architectures have unique characteristics whose evaluationrequires new tools and analysis techniques.
- The presence of a distributed operating system (e.g. Cronus) and its interface with the nativeoperating system adds additional complexity to the problem. From the parallel system viewpoint, the distributed operating system is an application which competes for resources with theapplications it is servicing.
- Simulations possess characteristics which distinguish them from other distributed systemapplications. Such issues as entities being simulated, random number generators, the generationof statistical distributions, the derivation of confidence intervals, etc. affect the functionaldecomposition of the application, and the performance of the parallel system.
SThe modeling environment will be a parallel system whose performance depends on how theinherent parallelism of the simulation is exploited, how the simulation is decomposed intofunctions, and how the functions are assigned to processors of the underlying architecture. Thetreamenc of the distributed operating system (Cronus) presents additional complexity since it canbe mapped into the parallel system in a number of ways wit. varied performance consequences.A general discussion of the issues in the design of an application for a parallel system andmethods for assessing the quality of the mapping is discussed in Pazirandeh [8].
The quality of the mapping arid the evaluation of two competing mapping strategies aredependent on metrics employed to measure performance. A number of metrics have beenintroduced for this purpose, but it is generally accepted that no single metric can be applied to allscenarios. Measures to satisfy special situations must be defined, validated, and tracked.
* Though the simulation of distributed systems is the primary interest, the analysis of VonNeumann architectures must also be accommodated.
We have concluded that the best way to overcome these technical issues is to develop anenvironment which can be used to define the distributed system, design the simulation, decomposethe application with maximum parallelism, map its functions into a parallel architecture, andevaluate the performance of the total system. Functionally, the environment will have the followingelements:
Distributed system description. The distributed system will consist of a set of componentsincluding processors, memory, communication networks, etc. These resources and theirinteraction with the system functions and distributed application will be specified.
SDsce the distributed operating Syjtem. The distributed operating system (Cronus) will be animportant part of the simulation and will affect its performance. Cronus interacts with the nativeoperating system to manage the distributed resources. Evaluation of its performance and itsimpact on the simulation will be a major function of the environment.
* Design of the simulation. The design of the simulation requires defining simulation nodes andentities to be simulated, specifying statistical distributions, simulating message, routing them todifferent nodes, etc. The environment must provide tools to perform these tasks.
Decomposition of the simulation. This function provides for the partitioning of the simulation intofunctions with maximum parallelism. This will result in the development of a processing "tree"specifying the functional dependencies and synchronization points. Communication amongprocesses can also be specified. Since the simulation can be partitioned in a number of differentways, the characteristics of the resulting processing tree can vary significantly. The environmentwill enable the user to experiment with various partitioning of the simulation.
Definiion of Jhe system Ughitcturg. The main purpose of the analysis is to experiment withvarious architectural concepts to arrive at the most efficient configuration. This allows the user todefine the architecture in terms of primitives. Different configurations can be easily constructed.The primitives will include processors, memory, disk, interconnection network, etc. The actualconfiguration of these primitives can be changed to allow for the evaluatioa of various scenarios.Memory can be implemented as shared or fragmented, interconnectidon network can take manyforms including hypercube, star, ring, systolic arrays, etc.
* This function will assist in arriving at an optimal mapping strategy to assignthe application components (the simulation, the Cronus operating system, the native operatingsystem, databases, the Data Base Management System, etc.) into the desi-red architecture. It willprovide tools for the optimization of performance.
* S~e~ification of system parameters. In performing trade-off studies, it is often required thatsystem parameters be varied to evaluate their impact on performance. Therefore, the environmentwill allow for the specification and easy alteration of major system variables.
- Librr... of -Defrformance metric . We have aheady indicated that the traditional performancemetrics are not sufficient for the evaluation of modem systems. Therefore, the environment willprovide a library of metrics that can measure the operation and the performance of these systems.A description of each metric with the interpretation of its results will be also included.
eD eri AJLtnonof performance raquirgment. Most applications lack an explicit set of performancerequirements. Yet, the benefits of using an architecture should be quantified in forms familiar toand consistent with the user's expectations. This will require transforming the user'sexpectations to quantities such as response time, speedup or other measures.
2
* Library of algorithms. A library of algorithms for describing the system operation and theapplication's behavior is required. The library must support the analysis of both Von Neumannarchitectures and distributed systems. They fall into three categories:1. Those used in the traditional design assessment techniques based on queueing networks.
These include closed form solutions to M/M/m queues, and approximate solutions andestimates for more general statistical distributions.
2. The operation of modem computers including distributed systems can not be adequatelydescribed in terms of queueing networks alone, and new algorithms must be developed tocomplement these techniques. These include optimization tools, and performance optimizationalgorithms, such as techniques for synchronization, scheduling strategies, resolution ofdeadlock, and parallel algorithms.
3. Simulation models will require the use of a library of statistical routines. These include thegeneration of statistical distributions, techniques for gathering sufficient statistics, andalgorithms for the analysis of output data, e.g., the derivation of confidence intervals.
*Knowedge Bas§. Most system analysis tools produce statistical data which can only beinterpreted by an expert. In a large system, even the experts have difficulty isolating the causes ofa performance failure. A knowledge base which can provide textual feedback on causes ofperformance failure is desired. In an earlier research we have shown that it is possible to developsuch a knowledge base, and we have developed a prototype tool which contains a number ofrules experts use to isolate the causes of performance failure, Pazirandeh [7].
A second knowledge base to assist the user in optimizing the assignment of functions toprocessors will be also available.
° Qutg aegn. The environment should present the results of analyses and simulations informats which are understandable to the user and are easy to follow. Thus, the system outputshould be designed and produced to satisfy the user requirements.
• User Interface. The user interaction with the system should provide for two-way communicationand feedback. The system should prompt the user for entering the required data and information.
Our ideas and approach for providing some of these functionalities during the Phase I of thisresearch are discussed in the next few sections.
2.0. Phase I Objectives
Recognizing the need for these functionalities, we proposed to evaluate the feasibility ofdeveloping an environment for designing and evaluating the simulation of distributed systemsduring Phase I of our research. Two technical objectives were identified which best reflected ourinnovation and whose satisfaction would prove the feasibility of Phase I research. These twoobjectives were described in our Phase I proposal and are as follows:
2.1. Technical Objective 1. Specification of Environment
The purpose of this objective is to define the specification and document the requirements for suchan environment. The research to be performed in Phase I in achieving this objective was to use ourearlier experience as the baseline and define the enhancements and additions required to enable theprototype tool to be suitable for developing simulation models of distributed systems, and to mapthem into a parallel system. These enhancements were to include the following:
3
- Definition of a set of primitives sufficient to represent multiprocessor systems, especially as they
pertain to loosely coupled and tightly coupled distributed systems.
* Definition of a set of metrics to measure their performance and the applicability of each measure.
• Identification of performance optimization algorithms, including techniques for synchronization,scheduling strategies, resolution of deadlock, and parallel algorithms.
* Identification of statistical routines, such as random number generators, generation of variousstatistical distributions, and the derivation of confidence intervals, etc.
* Definition of the requirements of a rule base to interpret the statistical output and recommendactions to improve performance.
2.2. Technical Objective 2. Proof of Concept
We will show the feasibility of these ideas by demonstrating them in a case history supplied byAIRMICS. We have already demonstrated partial feasibility of some of these ideas by twoexamples on the prototype tool. One example based on a Von Neumann architecture represents anactual operational system. The second example discusses the design of an optimal pipeline for avector computer.
3.0. Summary of Phase I Results
The purpose of Phase I of this research is: (1) to prove our innovation by showing the feasibility ofthe technical objectives set out in the proposal, and (2) to build a simple prototype version of theproposed ESDS to show some of its capabilities. The basic idea is to make the tool menu and icondriven. The menus are provided only at the highest level (i.e. presenting major options), and thelower levels of the tool operation are driven by icons (i.e. user will exercise the lower leveloptions graphically by clicking on the appropriate icons).
The prototype tool possesses features which will make its use easy and extremely friendly. Wehave fully utilized the power of object oriented languages to make it fully graphical and optionsdriven from the screen via either menus or icons. It is designed such that its full scale developmentcan be accomplished in a number hardware platforms, including IBM compatible or AppleMacintosh. The environment can be developed in a number of software environments includingC++ , or Smalltalk 80 or V. The prototype tool was developed in Smalltalk 80 on an AppleMacintosh computer with 4 MBytes of memory.
3.1. Features of Prototype Tool and the Proposed Environment
In support of Phase I research a prototype tool was developed. The purpose of this developmentwas to show the feasibility of developing the aforementioned environment and to demonstratesome advanced user interface concepts. We demonstrated the proof of concept via theimplementation and assessment of the performance of a distributed database implemented under aDBMS, native operating system, and the distributed operating system Cronu.. In addition tosatisfying the objectives of Phase I research, the major achievements of the prototype tool was thedevelopment of an advanced user interface. This prototype will form the baseline for our Phase IIdevelopment. We demonstrated the prototype tool and the results of our research to AIRMICSand the U.S. Army Information Systems Engineering Command at Fort Huachuca, Arizona, onJanuary 10, 1990.
4
3.1.1. Ufer Interface
The user interface consists of a main opening window, through which the user can perform almostall operations including hardware and software specification. Also, different operating systems,Data Base Management Systems, databases, and workload elements can be defined and assigned todifferent system components. Subwindows are used for defining and editing various systemelements and input data. Major subwindows are as follows.
• The CPU Definition window allows the user to define, edit and remove processors. Defining andediting activities causes a temporary CPU Definition window to pop up. This window containslabeled fields representing CPU attributes which the user can fill in or edit. The window lists thecurrently defined CPUs by name.
" The Operating System window allows the user to define and remove operating systems whichmay subsequently be assigned to various CPUs. The operating system window lists the currentlydefined CPUs by name. The distributed operating system Cronus is a standard operating systemwhich may assigned to all processors.
* The Data Base Management System (DBMS) window allows the user to define and removeDBMSs which can also be assigned to the various CPUs. The DBMS window lists the currentlydefined DBMSs by name.
" The database window allows the user to define and remove databases which can also be assignedto the various CPUs. The daiabase window lists the currently defined databases by name.
* The Function definition window allows the user to define and remove software functions andalgorithms which can also be assigned to the various CPUs or workload elements. The Functionwindow lists the currently defined functions by name.
* The Workload definition window allows the user to define and remove workload elements ortransactions which can also be assigned to the various CPUs. The Workload window lists thecurrently defined functions by name.
All windows in the Phase I prototype have a fixed size and can be scrolled up and down. Allwindow contents are dynamically updated after any operation which alters their contents. Allinterface functions are mouse-driven. Clicking the mouse over any displayed item (text or icon)selects that item as input for operations specific to that item. All such operations are presented tothe user in menus and all system functions are initiated through menu selections. The Phase Iprototype does not support keyboard redundancy for initiating system functions.
3.1.2. Analysis
The proof of concept is supported by the analysis of a simple distributed system. The applicationconsist of a distributed database with a number of requests for read and write initiated fromdifferent processors. The architecture and the workload though quite simple, are non-trvial andinclude many characteristics of a large distributed system. A realistic model of the distributedoperating system Cronus is implemented. The native operating system is assumed to be Unix,though other operating systems (e.g. MVS) can also be accommodated. Several DBMSs were alsoimplemented including Ingress and Adabase. A number of databases representing variousfunctions of an Army installation (e.g. personnel, financial, etc.) are designed and distributed tovarious processors.
5
The workload consists of a number of requests originated from different workstations orprocessors and directed to various databases. The requests can be for different forms of serviceincluding read and write operations.
An analytical model of the system based on queueing models was developed and implemented. Thealgorithms account for contention and queue time at various nodes of the system. In a distributedenvironment, a request issued from one node of the system accessing a database on another node,affects the performance of both nodes. A realistic and detailed model of this scenario wasdeveloped and implemented. All algorithms are presented in section 5.3. of tis reporL
In analyzing the system, the user can exercise a number of options and evaluate their impact on theperformance. These include:
" Ability to reassign a database to different processors.* Ability to reassign a workload element to different processors.• Ability to reassign a new native operating system from the library." Ability to reassign a new DBMS from the library." Ability to alter most of system parameters.
3.1.3. Output
The model computes performance parameters (utilization and average response time) by device,workload element, and total. The results of analysis are reported on screen.
32. Phase I Limitations and Assumptions
Phase I research, being only a short term feasibility study, was conducted under many constraintsand assumptions. During Phase II these constraints will be relaxed and assumptions eliminated.Some of these include:
* Phase I allows analyses based on analytical techniques. Tools and algorithms required to developdiscrete event simulations are numerous, and therefore, have to be considered during Phase II.
* The ability to designate subsystems as macros and use them in the analysis of larger systems isan important feature, especially in analyzing systems with hundreds or thousands of nodes. Thedevelopment of this capability is postponed to Phase I.
* Interconnection networks have significant impact on distributed system performance. DuringPhase I of this research delays due to the network were not included in the analyses performed insupport of proof of concept. The development of a library of interconnection networks withassociated message passing protocols will be a Phase II objective.
* The user interface and ease by which the user can interact with the system are essential to the finalacceptability of the tool. Phase I of this research produced only sufficient detail to show ourconcept of this important component. The capability for defining attributes of variouscomponents and details were limited. This limited capability was sufficient for Phase I research,but inadequate for the final product. This capability will be greatly expanded during Phase II.
* A desirable feature, considered for Phase II development, is the ability of renaming systementities and parameters. This capability is unavailable in Phase I prototype.
6
* Tie output of the present prototype is a simple screen showing utilization avd mean responsetimes. In final form, ESDS will have a sophisticated output design and will provide a number ofdifferent reports both on-screen and in hard copy. The output requirements of ESDS and ourdesign will be discussed in Phase II technical proposal.
" The development of two knowledge bases mentioned in the introduction is beyond the scope ofPhase I research. We have shown partial feasibility of their development as part of our otherresearch projects. We will briefly discuss our plans for this component of ESDS in section 7.0.of this report, and elaborate further in the technical volume of Phase 11 proposal.
33. Assessment of Phase I Researca
Phase I of this research was primarily a feasibility study with technical objectives outlined insection 2.0. Our assessment of this phase of the research is that in addition to satisfying the twotechnical objectives, we were able to develop additional capabilities and advance user interfaceconcepts. These include:
- During the short Phase I period we were able to develop and implement a somewhat complex setof algorithms for evaluating the performance of a distributed system containing a distributeddatabase subject to a number of read and write requests.
* The prototype tool allows for the detailed definition and updating of a number of libraries,including operating systems, DBMSs, and databases.
- The Phase I prototype allows for an easy assignment and reassignment of system elements(operating systems, DBMSs, etc.).
- We developed a detailed model of the distributed operating system Cronus which will be used inthe full scale version of ESDS developed during Phase II.
* Workload can be defined, assigned to various processors, and analyzed. They can be reassignedto different processors or workstations to evaluate the impact on performance.
* Innovative and advanced user interface concepts were introduced. Some of these will bediscussed in other sections of this report and will form the baseline for Phase II development ofthe user interface.
- We demonstrated the superiority of object oriented languages as the environment for developingsuch tools. Smalltalk 80 was adequate for the Phase I feasibility study. We -are uncertain whetherthis language will be able to support full scale development of ESDS. The determination of anappropriate environment will be a Phase I task.
Our general assessment is that we accomplished more than our basic technical objectives set outfor Phase I, and the full development of ESDS is to the best interest of AIRMICS and InnovativeResearch. In addition to providing AIRMICS with an ad,, anced evaluation tool for distributedsystems, ESDS will be a highly desirable tool for use by other segments of American industry.This is fully compatible with the spirit and the intent of SBIR program.
4.0. Specification of the Environment
In traditional system analysis, a computer system, and hence its model, consists of threecomponents: (1) the application, (2) the system architecture, and (3) the performance requirements(based on a pre-defined set of performance measures, e.g. utilization, response time, throughput,etc.). Usually, one is provided information about two of the three components and the aim of bothanalysis and modeling is to draw inferences about the third component. The purpose of theanalysis depends on which two components are known. Of the three main purposes of modeling,shown in figure 1, the one to ascertain that a candidate architecture can support the processing ofan application under a given set of performance requirements is the most wideiy ,ised.
Confidence in the results of an analysis is dependent on the level of confidence in the inputparameters (application, architecture, etc.), and the robustness of the model. The uncertainties ofthe model are usually no less than the uncertainties of the input parameters, i.e. there is no need todevelop complex models if the confidence in input parameters is low. Therefore, the complexity ofanalysis closely follows the system life cycle, and models are developed with enough detail to meetthe analysis needs. During the requirements analysis and early in the design phase, when the levelof confidence in system parameters is low, only high level models with very little detail areproduced. The effort at this phase of the development is generally directed at finding the "tallpoles" of the system's operation and performance. Analytical models best fit this phase. As thesystem develops and more details become available about the application and the hardwarearchitecture, thus increasing the confidence in input parameters, more detailed models aredeveloped. Late in the development phase, detailed simulation models are appropriate. Thus, thelevel of detail of the model directly follows the level of knowledge about and confidence in thesystem input parameters: the more reliable information available about the system the more faithfulmodels can be and are developed.
e.%rformance
Wol-odicion Architecture
Capacity Evaluation Growth Evaluation
r Perfonnane7 qurment r
Figure 1. Multiple roles of design assessment
8
Many applications do not fit any of these three traditional roles of modeling. Some of the reasonsinclude:
The system architecture for the most part may not always be known. A preliminary analysis mayindicate a certain configuration may offer the best solution, yet often a number of uncertaintiesremain. The major source of uncertainty is that there can be different configurations of the systemwhich may seem adequate to support the processing of the application. Further, one may want touse off-the-shelf components, but their interconnection and communication can vary widely.
In many cases, the application is known in terms of the functions it will perform with very littleknowledge about its timing or sizing. For example in a distributed database application, one mayonly know the sequence processes a transaction has to go through to produce the desired output.But, the conversion of these processes into software functions with known distribution forinsertion into - model is often difficult. Even if the applications is known with some detail, thenumber of ways it can be decomposed and its functions mapped into the processors are majorimpediments to applying the traditional modeling techniques.
The performance requirements of the system are often specified in terms of user expectationsrather than in the traditional form of utilization, response time, and throughput. One task of theanalyst is to convert these expectations into measurable quantities. In the case of distributedsystems, the quantification of user expectations are even more difficult. This is partially due tothe absence of general agreement on what constitutes a good set of measures.
Communication among processors and the synchronization of processes are new parameters, notpresent in the Von Neumann case. These functions, essentially overhead items, can significantlydegrade performance. Further, resource requirements to support these functions are dependenton a number of parameters including the parallelism of the application, mapping of theapplication functions into processors, processor configurations, and the interconnection network.
4.1. Requirements of the Environment
4.1.1. Characteristics of Distributed Systems
Our ability to develop faithful simulation models of Von Neumann architectures was partially dueto the similarity of their organization. This enabled us to represent them by a common set ofprimitives composed of CPU, memory, LAN, Bus, 10, etc. The advent of new architecture,including multiprocessor systems, has opened up new opportunities and capabilities for solvingcomplex scientific and other resource intensive problems. The principle change from theperformance and simulation standpoint is that these architectures and their operations areheterogeneous, and a unified representation is not readily available. These differences can best beillustrated by considering two major classes of multiprocessor systems: loosely and tightly coupledarchitectures.
Tightly coupled systems are composed of a set of processors which communicate through a sharedmemory system, and hence there is a high rate of data transfer between each processor and thememory. To improve performance and compensate for the differences in CPU and memoryspeeds, the shared memory is segmented into several banks. Each processor may also be provideda local memory or cache. The processors are connected to the main memory via an interconnectionnetwork, resulting in a totally connected system, As the number of processors increases, theperformance degrades due to increased memory contention.
Loosely coupled multiprocessor systems lack shared memory. Instead, each processor is providedan Input/Output device and a large local memory. All interprocess communication and datatransfers take place via a message transfer system. The coupling of such systems is quite loose,
9
and hence the addition of more processor units can be done without affecting the operation of thesystem. These systems are generally suited for the applications where the communication amongprocessors is minimal, and thus, they are referred to as distributed systems. Because of theirinability to support high throughput, loosely coupled systems are not suited for applications whichrequire fast response times, e.g., time-critical real-time systems.
4.1.2. Characteristics of Simulation Models
Simulation models possess unique features and requirements which increase the complexity of themodeling effort. The major technical issues in developing a simulation model, as we discused inour proposal, are:
• The entities making up a simulation environment can be heterogeneous, and include messages,events, application programs, hardware, or software components.The simulation traffic can be"triggered" for execution in a variety of ways, including message driven, event driven, periodic,and time-queued. Examples of time-queued tasks are software codes which support thesimulation of a missile launch. These, while not totally periodic, are time-based. A simulationenvironment must represent elements that can be present simultaneously.
* From a processor standpoint two different classes of simulation tasks can be present: (1) Taskswhose processor utilization tends to be uniform over time, e.g., steady state simulation, and (2)tasks which have bursty processor demand, e.g., in simulation of command and controlenvironment, a battlefield query may set-off a chain of events with high CPU demand over ashort period of time. Depending on the mix of these two, the design and the assignment oftasks, and the scheduling of the processors can vary greatly. Thus, if the application is primarilycomposed of the first class of tasks, the processors can be scheduled to near full capacity withoutadversely affecting the performance of the simulation. While, if the application is composed ofthe mix of the two, the processors must be scheduled for the first class of tasks first, withsufficient excess capacity to handle a second class of tasks and avoid CPU bottlenecks.
* From a memory utilization standpoint, two different simulation tasks can be present. Tasks witha high degree of interprocess communication, generally assigned to a shared memoryarchitecture, and local tasks which have minimal interprocess communication needs. Instructionmix can vary from one application to another. Some codes are highly CPU bound and must beassigned to suitable processors, while others are 10 bound and have different needs.
* Simulations usually produce a large amount of data which must be interpreted. In addition, thevalidity and reliability of statistical experiment is always a cause for concern. We have to ensurethat data is gathered in the steady state phase of the simulation, and that the number ofreplications are sufficient. Thus, a set of mathematical and statistical routines are needed tosupport these analysis needs. These include random number generators, statistical distributions,methods for gathering sufficient statistics, and the derivation of confidence intervals. Further,techniques for the analysis of a large amount of statistical data resulting from the simulationruns must be developed. These include techniques for filtration, reduction, detection of outliers,and interpretation of data.
4.2. Elements of the Environment
The foremost consideration in developing such an environment is that often the users will not becxpert modelers and will rely on the environment to guide them in developing the system model.Being system developers or end-users, they are primarily interested in the performance of thesystem. The design and the development of the environment should proceed with this in mind,and posse. the tools required to support such needs. Flexibility is an important consideration asthe environment will be used to analyze a varied class of architectures. Flexibility in this case has a
10
broad interpretation, covering the ability to define a wide range of architectures, applications,performance measures, and operational concepts (e.g., various types of scheduling strategies,synchronization scenarios, parallel algorithms, etc.). Flexibility is also reflected in the number ofoptions the user will need to design and execute a model. The definition of events, identification ofresources to be analyzed, partitioning of the problem, the granularity of the tasks, and theirassignments to processors are just few of these options essential to developing flexible models.The user interface is also an important determinant of its acceptability by the users. We discuss ourconcept of a friendly user interface in section 4.2. ., and the elements of the environment and apossible design of these elements in sections 4.2.2. through 4.2.12.
4.2.1. User Interface
The user interface will be mouse and menu driven, wherein the user directly manipulates textualand graphical objects whenever appropriate. System data and operation on that data will be selectedusing a mouse as a pointing device to make selections from lists encapsulated in menus. Menusfor choosing data, including C7Us, DBMSs, databases, functions, workload, algorithms, etc. willbe screen resident to provide the user with constant feedback about the context of the design andanalysis activity. These menus will provide for scrolling when necessary to access items that donot fit into the fixed reserved area. Menus for operators will "pop-up" as a result of user-initiatedmouse-button actions on the screen background. Pop-up menus will be context-sensitive,providing for selections appropriate to the context of operation and the area of the screen fromwhich they are invoked. The keyboard will be used as necessary for text input in data definitionand to provide shortcuts for menu selections in the context of keyboard-intensive textual input.Also, keyboard redundancy will be provided for many operations to serve those users who preferthis mode of interaction with the scheduling application.
Direct manipulation will be used for scheduling operations on data wherever appropriate. Forinstance, to link nodes in an architecture hierarchy graph, the user will use the mouse as a pointingdevice to select node-pairs on the display to indicate the desire to link them. Similarly, data itemscould be entered into forms, as in CPU definition, by "grabbing" the desired data item from amenu with the mouse and "dragging" an image of the selected item to the appropriate location onthe form.
A default windowing environment will be provided for design and analysis as in the Phase Iprototype. In addition, it will also be possible for the user to reposition the standard windows to"customize" the screen. These customizations can be saved for future use. Most windows can bemoved, resized, and "shrunk" into icons which can then be selected to reopen the window theyrepresent. Editing windows will serve as conceptual "workspaces" in which the menu operationsprovided will be sensitive to the editing context. We show some concrete examples of these ideasby presenting some specific design ideas of the various windows and options.
11
4.2.2. System Definition
On start-up, the user is presented with a screen which may be similar to figure 2., with thefollowing options:
System Architecture Analysis TDaI (last restored frDm: :System Architecture A4]
EditD,I - 06 DBMS _DtMIL.s e Functio-- WoroadIAll
Functions
read Armamentroad BarracKs
ma read Mom~road Payrollread Personnelwrite Armamenwrita Barractswrite Me5
-nd write Payrollwrite PersonnelSSystom Oprtns
[ ~ TuuI: : HELP
Figure 2. Opening window
The user options accessible from this window fall into the following categories:
1. Editors
The environment contains six editors which are accessed from the corresponding buttons in themain opening window. They are CPU, operating system, DBMS, database, function, workloadeditors. These editors are discussed in sections 4.2.2. through 4.2.7.
2. Tools
The environment is equipped with the most commonly used hardware elements. For Phase Iprototype the following set of icons are provided:
Graph editing tools
The following tools are used to edit the hardware and workload graphs in the correspondingeditors. In all cases, the cursor shape becomes the shape of the selected tool. Unless otherwiseindicated, the hot-spot of the cursor is the upper left-hand comer.
12
AMw Tool.
In the Hardware Architecture Editor, this tool is used to select certain items. In the PhaseI prototype, only CPUs may be selected. When selected, the editor for that CPU isactivated. In Phase II, this tool will activate an editor for any parameterized hardwareelement. Additionally, in Phase H, this tool will select a subsystem node which will beexpanded to fill the Hardware Graph window.In the Hardware Architecture Editor, thr Arrow Tool is automatically selected wheneverthe user selects from the list of hard,;ire elements or the list of database, workload, orfunction elements.In the Workload Editor, this tool selects the standard background menu.
.......°......
Move Tool. The move tool is used to move the selected item in the graph.The user must click and release the mouse button over a highlighted item to select it formovement. The item is moved with the mouse button up. A subsequent click of themouse button will place the item at the new location. Connections will move dynamicallywith the item.In Phase II, we will add a provision for moving groups of nodes in a single operation.The hot-spot of the associated cursor is the center.
°.°..°.........
. Copy Tool. The copy tool is used to copy the highlighted item.Copying copies all parameter values to the new instance. Copy functionality is notimplemented in the Phase I prototype.
...... :........
.......... DeleteTool. The delete tool is used to delete the highlighted item.Confirnation is required. Any connections to the selected item are deleted with the item.The START and END nodes in the Workload Editor cannot be deleted.In Phase II, we may add a provision for deleting groups of nodes in a single operation.
Connect Nodes Tml. This tool is used to connect nodes to form graph arcs.The source node is selected by clicking the mouse button over a highlighted item. Then,as the morse is moved around the window, a "rubber-band" line (anchored at the centerof the source node) tracks the mouse. When the mouse button is clicked over a secondhighlighted item, the destination node, a new link is created and the operation iscompleted. If the user clicks the mouse Awhile no item is highlighted or if the user movesthe cursor outside of the window, the operation is aborted.
13
... Disconnect Nodes Tool. This tool is used to disconnect nodes in a graph.
The source node is selected by clicking the mouse button over a highlighted item. Then,as the mouse is moved around the window, only destination nodes, i.e., those itemsconnected to the source node, will highlight. While a destination node is highlighted, thecorresponding connection will be a dashed line instead of a solid line. When the mousebutton is clicked over a destination node, the connection to the source node is deleted andthe operation is completed. If the user clicks the mouse while no item is highlighted or ifthe user moves the cursor outside of the window, the operation is aborted.
Graph Editing Buttons:
The following buttons are used to support editing of the hardware and workload graphs in thecorresponding editors. Unless otherwise indicated, the action of the button is immediate.
U.°..........
............. Restore Display Button.
Occasionally, the depiction of the graph may become corrupted. This button forces re-display of the graph.
.,.............
...... er DisplayBRqon.In the Phase I prototype, this button clears the display of the graph. This is not a usefulfunction and this button will be removed in Phase I.
..... °...,..
r..E. Subsystem Navigation Button.
In the Phase II Hardware Architecture Editor, this tool will be used to navigate betweensubsystems. (See the comments on Subsystem Elements in the section on the HardwareElements List.) When this button is selected a pop-up menu will appear with thefollowing possible selections: TOP, UP ONE LEVEL, OTHER SUBSYSTEM 1, ... , OTHERSUBSYSTEM N. Selection from this menu has results as follows:
TOP displays the top level subsystem. This selection is only available when the useris not already viewing the top level subsystem.UP ONE LEVEL displays the subsystem that contains the one currently displayed.This selection is only available when a subsystem instance (as opposed to asubsystem template) is displayed and that instance is not TOP.OTHER SUBSYSTEM X displays the named subsystem.
In all cases, the subsystem currently displayed is replaced by the selected one.No functionality is implemented for this button in the Phase I prototype. Also, in thePhase I prototype, this button is incorrectly labelled NEW. It should be labelled NAV.
14
3. Hardware Elements
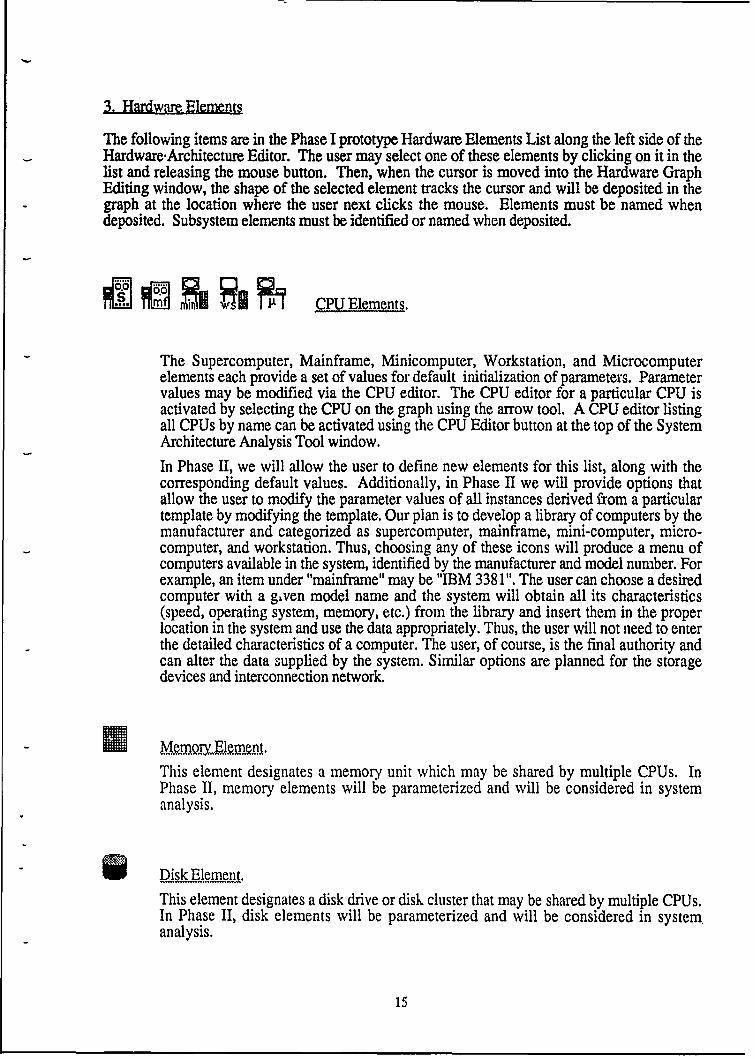
The following items are in the Phase I prototype Hardware Elements List along the left side of theHardware-Architecture Editor. The user may select one of these elements by clicking on it in thelist and releasing the mouse button. Then, when the cursor is moved into the Hardware GraphEditing window, the shape of the selected element tracks the cursor and will be deposited in thegraph at the location where the user next clicks the mouse. Elements must be named whendeposited. Subsystem elements must be identified or named when deposited.
i M ST F1CPU Elements.
The Supercomputer, Mainframe, Minicomputer, Workstation, and Microcomputerelements each provide a set of values for default initialization of parameters. Parametervalues may be modified via the CPU editor. The CPU editor for a particular CPU isactivated by selecting the CPU on the graph using the arrow tool. A CPU editor listingall CPUs by name can be activated using the CPU Editor button at the top of the SystemArchitecture Analysis Tool window.In Phase II, we will allow the user to define new elements for this list, along with thecorresponding default values. Additionally, in Phase II we will provide options thatallow the user to modify the parameter values of all instances derived from a particulartemplate by modifying the template. Our plan is to develop a library of computers by themanufacturer and categorized as supercomputer, mainframe, mini-computer, micro-computer, and workstation. Thus, choosing any of these icons will produce a menu ofcomputers available in the system, identified by the manufacturer and model number. Forexample, an item under "mainframe" may be "IBM 3381". The user can choose a desiredcomputer with a gven model name and the system will obtain all its characteristics(speed, operating system, memory, etc.) from the library and insert them in the properlocation in the system and use the data appropriately. Thus, the user will not need to enterthe detailed characteristics of a computer. The user, of course, is the final authority andcan alter the data supplied by the system. Similar options are planned for the storagedevices and interconnection network.
This element designates a memory unit which may be shared by multiple CPUs. InPhase II, memory elements will be parameterized and will be considered in systemanalysis.
Dik ement.This element designates a disk drive or disk cluster that may be shared by multiple CPUs.In Phase II, disk elements will be parameterized and will be considered in system,analysis.
15
NetworkElement.
This element designates a network. No functionality is provided in the Phase Iprototype. In Phase II, it will consist of a library of interconnection networks and LocalArea Networks (LANs) with associated network protocols. The characteristics of thenetworks will be implemented parametrically. The user can choose a network from thelibrary, make the desired changes to its characteristics, and use it in the analysis of wholesystem. The development of the library, like other libraries, will be incremental.
Foil * ubytm Eemens.Subsystem elements have no functionality in the Phase I prototype.In Phase II, subsystem elements will be defined as named templates. Templates may bedefined in one of two ways.1. By indicating an area of the current Hardware ( All elements and connections
within the indicated area will be included in the ;t. ,iate. Any software assignmentsto selected hardware will not be included as hardware parameter values in thetemplate.
2. By selecting NEW when an instance is being created (see below).
Instances of the templates will be created whenever the user places a new subsystemelement in the Hardware Graph window. At that time, the user will be asked to choosefrom a pop-up menu where the choices are NEW, and the existing named templates.When a template is instantiated, it must be named as a subsystem.
Subsystem element instances may be modified individually or via global modification tothe template.
It is unclear as to how connections to the outside of a subsystem at one level will relate tonodes within the subsystem at the next level. We will investigate solutions to thisproblem in the Phase II design process.
A subsystem can be designated as a macro and used as a (customized) new icon in alarger system. Macros or subsystems can be nested. Each subsysten, can be treated as aseparate system, analyzed, and the results passed to the larger system. The set of allmacros is kept in a library which can be accessed, individually reviewed, edited, orremoved.
4. Software Elements
The software elements fall into three categories, one visible at any given time. A typical option willlook like figure 3.
Functions
Figure 3. Software options
16
Clicking on the function will produce a menu of options available to the user (figure 4). Any of thethree elements of software can be brought to the foreground by selecting it. Thus, the contents ofthe visible portion of the software component can be changed as desired. Once a component isvisible, its elements can be viewed, edited or assigned to hardware devices. The assignment isaccomplished by selecting the desired element, "dragging" it to the host device, and "dropping" itinto the device. Selecting any element of the software element (a workload, a function, or adatabase) will highlight its host device.
Functions
WorkloadsDatabases
Figure 4. Software elements
Clicking on the "All" option on the menu will present the user the menu shown in figure 5.Choosing "All" will show all elements of the chosen category (workload, function, or database)."Assigned" will show all elements assigned thus far, "Unassigned" will show those not yetassigned, and "Partially assigned" will show those which have been assigned to a subsystem or amacro, but not yet assigned to a specific device. The implementation of these features is plannedfor Phase II.
AllAssigned
UnassignedPartially assigned
Figure 5. Software elements assignment status menu
5. System Operations
The system operation option allows the user to access all systems, analysis techniques, algorithmsand output options. Selecting this will produce a menu of options as shown in figure 6.
SaveRestore
AlgorithmsAnalysis
PrintHelp
Figure 6. System operations menu
"Save" option saves the working copy of the system to the disk, "Restore" option produces a listof systems saved from previous analyses, any of which can be chosen and opened. "Print" optionproduces a number of print options including production of hardcopies, and "Help" (whenimplemented) will provide on-line help. "Algorithms" option provides access to all classes of
17
algorithms. The algorithms are envisioned to fall into three categories (figure 7). These are further
discussed in section 4.2.10. of this report.
Simulation toolsOptimization toolsAnalysis tools
Figure 7. Algorithm menu
18
4.2.3. CPU Editor
Selecting the "CPU" button from the opening window will produce the CPU editor (figure 8). Thepane on the right side of the window contains a list of CPUs defined so far (which can be scrolledif they extend beyond the visible part of the pane). An existing CPU can be reviewed and/or editedby selecting its name from the pane. This action will highlight the CPU icon and will show itscharacteristics. The operating system and the DBMS can be changed by selecting the applicablebutton next to each item. This action will produce a list of operating systems and DBMSs availablein the system. A new operating system or DBMS can be assigned by selecting from this list or anew one can be defined by selecting the new option from this menu. If a new option is chosen, theform for defining the new item is produced which can be completed and added to the library ofoperating systems or DBMSs as applicable.
Mainframe 11Mainframe 12Mainframe 13
Mainframe 14
CPU:
Memory (Mb):
Speed (MIPS): L
Operating System: .II
I ~DBMVS: -7
Figure 8. CPU editor
19
4.2.4. Operating System Editor
Selecting the "OS" button from the opening window will produce the operating system editor(figure 9). The pane on the right side of the window contains a list of operating systems defined sofar (which can be scrolled if they extend beyond the visible part of the pane). The characteristics ofan existing operating system can be reviewed and/or edited by selecting its name from the pane.This action will highlight the operating system icon and will show its characteristics. A newoperating system can be added to the library by selecting "new" from the menu which presents theuser a blank form to add the name and other characteristics of the new operating system.
Selecting the "DBMS" button from the opening window will produce the Data Base ManagementSystem (DBMS) editor (figure 10). The pane on the right side of the window contains a list ofDBMSs defined so far (which can be scrolled if they extend beyond the visible part of the pane).An existing DBMS can be reviewed and/or edited by selecting its name from the pane. This actionwill highlight the DBMS icon and will show its characteristics.
DBMSS5
DB2IngresOracle
DBMS: DB2
Instructions/Read (K): 80
Instructions/Write (K): 100
instructions/Update (K): 150
Figure 10. Data base management editor
21
4.2.6. Database Editor
Selecting the "Database" button from the opening window will produce the database editor (figure11). The pane on the right side of the window contains a list of databases defined so far (which canbe scrolled if they extend beyond the visible part of the pane). An existing database can bereviewed and/or edited by selecting its name from the pane. This action will highlight the databaseicon and will show its characteristics. The system allows for the definition of very complex andhierarchical databases. This can be done by selecting "new" in the first column of the window(collections). This represents a collection or class of databases. Once defined, the user can definesubclasses or databases within the collection. This is accomplished by selecting the collection(which causes the name of the collection appear under the "Tables" segment of the window), andchoosing "add new" from the menu in the middle column of the window (tidled "Tables"). The usercan define an unlimited number of databases belonging to this collection. For example in figure 11,the collection "Armaments" contains the data bases "guns", "nuclear", "planes", and "tanks".Selecting any of the other collections will display their corresponding databases. For any databasewithin the collection, the user can define its fields and characteristics (numeric, alphanumeric,logical, etc.). This is done exactly as it was done for defining databases within a collection. Forexample in figure 11, the database "Armaments" has two fields; "hand guns" and "rifles".
Collections Armaments Tables guns Rlows I
Armaments guns hand gunsBarracks nuclear riflesMess planesPayroll tanksPersonnel
Quit
Figure 11. Daia base editor
22
4.2.7. Function Editor
Selecting the "Function" button from the opening window will produce the function editor (figure12). The pane on the right side of the window contains a list of functions defined so far (which canbe scrolled if they extend beyond the visible part of the pane). An existing function can bereviewed and/or edited by selecting its name from the pane. This action will highlight the functionicon and will show its characteristics. The database the function is acting on and the operation it isperforming can be changed by selecting the applicable button next to each item. This action willproduce a list of databases and operations available in the system. A new database or operation canbe assigned by selecting from this list or a new one can be defined by selecting the new optionfrom this menu. If th new option is chosen, the form for defining the new item is produced whichcan be completed and added to the library of databases or operations as applicable. A new functioncan be defined by selecting "new" from the menu which results in the presentation of a blank formto be filled by the user. Upon completion and acceptance by the user, the new function is added tothe library and its name is displayed (alphabetically) among the other functions.
Functions n Fuction: rea A a n
read Armamentread Barracksread Messread Payroll Fread Personnel I unt: [ Ajwrite Armamen Block Count: 10write Barrackswrite Mess Instruction Count:100Iw rite Payroll 1 0 C u twrite Personnel
Database: Armaments
Operation: read
Figure 12. Function editor
23
4.2.8. Workload Editor
Selecting the "Workload" button from the opening window will produce the workload editor(figure 13). The pane on the right side of the window contains a list of workloads defined so far(which can be scrolled if they extend beyond the visible part of the pane) and all the functionsdefined on the right hand pane of the window. An existing workload can be reviewed and/or editedby' selecting its name from the pane. This action will highlight the workload icon and will show itscharacteristics on the top and its functional sequence at the bottom of the window. A newworkload element can be added by selecting "add new item" from the menu which opens a blankworkload definition window. After entering the name and other characteristics of the new element,the user can define its functional sequence. This is done by selecting a function from the functionpane, dragging it to the drawing pane, and depositing in the pane. the software sequence can bespecified by connecting the function using the "connect" tool. Complex software sequencesincluding branching points with probabilities and synchronization points can be specified. Once thedefinition of the new workload element is completed and is accepted by the user, its name isdisplayed in the workload pane.
Once the system is completely specified, it can be analyzed using the analysis algorithms providedby the system. The Phase I prototype tool contains algorithms for analytical algorithms based onthe queueing networks. For this study we have assumed a Markovian process with a First-Come-First-Served queue discipline. The analysis routines are invoked by opening the system operationsmenu and selecting the "Analysis" option from it. This action will open the analysis window(figure 14). Choosing "perform analysis" from the bottom of this window will open up possibleoptions available to the user, e.g. applying different algorithms or the analysis of subsystems. Forthis version of the model two options using different algorithms are available. The two versionsdiffer in how they treat a workload element which is initiated from one node in the system andaccesses a database located at another node of the system. In one version all CPU usage isallocated to the processor containing the database and in the other the usage of resources areallocated based on the tasks each processor will perform (a more realistic model).
Once the analysis is completed the results are displayed on screen which can be scrolled up ordown. Phase II will provide for more sophisticated and detailed reporting of output including theproduction of hardcopies.
The traditional metrics of response time, utilization, and throughput, at least in their traditionalroles, are neither applicable nor sufficient for assessing the performance of distributed systems.The problem becomes even more complex if one considers different architectures for differentimplementations of the same application. In addition to the traditional performance metrics, twoother classes of metrics are available with broad applicability: application and system dependentmeasures. Examples of the former are Hockney's N1,2 and r.,, and an example of the latter class isspeedup. These and the traditional metrics will be the minimum set of measures provided in theenvironment.
4.2.11. Library of Algorithms
The environment will contain a library of algorithms and routines required to support variousanalysis needs of the user. The development of the library of algorithms is a Phase H objective.The algorithms can be categorized in three classes:
Lia of analysi s tools
This is the class of routines which will be used to compute the performance parameters. It includesuch routines as queueing networks which have been successfully used for the analysis of VonNeumann architectures. At this time, the routines considered for inclusion in this portion of thelibrary are the following:
* Formulas for the derivation of the performance parameters based on Markovian distributions (i.e.M/M/m queues) with various queue discipline (First-Come-First-served, priority queues, etc.).The formulas will include the calculation of utilization, mean and percentile response times, andthroughput, by device, workload element, etc. (as applicable).
" Approximate solution for non-Markovian statistical distributions. A number of goodapproximations are available in the literature which should also be included in the library.
Library of statistical routines
Since the development of simulation models will be a major use of the environment, there will befrequent needs for accessing statistical routines. These include the generation of random numbers,production of statistical distributions with given parameters, and the statistical analysis of themodel outputs. The latter requires statistical routines such as the derivation of confidence intervals.Therefore, the library should contain the following statistical routines and algorithms:
* Routines for the generation of uniformly distributed random numbers.* Routines for the generation of random numbers with given statistical distributions including
Poisson, negative exponential, normal, Ehrlangian, geometric, etc., Algorithms for distinguishing transient and steady state of a simulation.
- Algorithms for finding the number of replications needed to attain a level confidence of thesimulation.
* Algorithms for determining the length of the simulation to gather a sufficient set of statistics.- Algorithms for the calculation of the confidence intervals.
26
Several classes of algorithms will be needed to design an optimal system. These will include:
• Mapping of simulation functions into parallel systems
The major objective in designing a parallel system is to take full advantage of an application'sparallelism by decomposing it into parallel functions, and assigning them to processors so that theprocessors have high utilization with very small variance. At the same time no processor'sutilization can exceed one, i.e.; processors cannot be be scheduled beyond their capacity.Attempting to achieve uniform utilization among processors may reduce useful work by increasingthe communication and other overhead requirements. The major design decision, therefore, is howto assign the functions within the application to processors so that the following two sub-objectivesare satisfied:
Subobjective 1. The load among processors is balanced.Subobjective 2. The conmmunication and other overhead are minimized.
Clearly, these two subobjectives cannot be satisfied simultaneously, and hence, there will be atrade-off between maximizing the load balancing and minimizing the total overhead. Further, anysolution to this problem will have to offer the designer the ability to quickly evaluate differentassignments and choose the one that best satisfies his specific requirements. It can be shown thatthe trade-off between the two design objectives can be achieved by:
- Formulating the problem in a (non-linear) optimization context, and- Developing a technique that finds a "better" solution if it is presented with an existing one
which may not necessarily be optimal.
We have shown that this can be formulated as a non-linear optimization problem and solved usinga variation of branch-and-bound technique and produce a near-optimal solution, Pazirandeh [8].
- Other algorithms
These algorithms are those required for the description and operation of multiprocessor systems.These include optimization techniques, interprocess communication and synchronization , deadlockresolution techniques, scheduling strategies, and parallel algorithms for multiprocessors.
4.2.12. Knowledge Base
The environment should contain a number of knowledge bases to assist the user in defining thesystem and interpreting the results of analyses. These fall into three areas:
* A knowledge base to isolate performance failures of the system to a specific component. Thedevelopment of this knowledge base is a difficult and complex task, and should be a continuingand evolutionary effort. By the conclusion of Phase II, the environment should contain aknowledge base to isolate the cause of a failure to a device or subsystem. Lower level isolationshould be part of the further enhancement of the knowledge base. We have shown the feasibilityof developing such a knowledge base in an earlier research and will draw upon its results todevelop it, Pazirandeh [6,7].
* A knowledge base which will provide feedback to the user on the performance of the system andthe quality of mapping the application into the processors. The knowledge base will analyze theassignment and will suggest possible reassignments which will improve performance,
27
throughput, or speedup. We have also shown the feasibility of developing this knowledge base,and will draw from the results of that research to develop it, Pazirandeh [8].
* A knowledge base to assist the user in designing the system with the correct features, e.g.checking for the integrity of input data is also desired. This knowledge base should be developedin consultation with end-users to identify and document their specific requirements.
Our approach for developing the first two knowledge bases will be further discussed under PhaseII plans (section 7.0.).
5.0. Proof of Concept
We demonstrate the capabilities of the prototype tool by analyzing a set of databases consisting of aset of files of Army personnel and related information. We assume that the information about thestaff is contained in several records (figure 15). The files containing the different records areassigned to several processors. The updating of data on one record results in changes to all relatedrecords. For example, if a staff member is promoted to a new rank, the base pay is automaticallyupdated on the the related record. The other records are located on other processors, and theupdating is performed via the Cronus operating system.
Two classes of operations can be performed on the databases: operational and informational. Theoperational consists of those operations which will alter the contents of the database, one of itsfiles, or a record. Operations such as updating a record, writing to a file, adding a new record, andediting a record fall into this category. The informational operation consists of those operationswhich will not alter the contents of the database, but will require accessing and making queries toits files and records. Operations such as reviewing a personnel file, or making statistical analysiswill fall into this category.
When a request is issued, whether operational or informational, the Cronus operating system willprocess the request, use the native operating system to send the request to other processors. Thenative operating system on the receiving processor will hand the request to Cronus which willmake requested changes or retrieve the desired data from the targeted record (figure 15).
record rcrj*Conus kCronus } -I
DBMS DM
processor 1 fatiysr p stivr processor 2
procesor 3 nativ
recordronus
DBMS
Figure 15. Schematic of updating a record
28
The purpose of the prototype tool is to show how the eventual environment will perform analysisof the above operations and derive performance metrics (utilization, response time, etc.). Weassume that a set of requests have been issued consisting of a mixture of operational andinformational requests. We allow the user to specify how many of each operations are to beperformed and how the data is distributed across the system. We define the processing steps andassume a (parametric) resource utilization for each request, and use the information to develop amodel to predict the system performance under the given scenario.
5.1. Assumptions
For the purpose of this demonstration only, we have assumed the following operational constraintsand scenarios:
• The native operating system is UNIX.- The DBMS is a generic one performing only read and write operations." Requests within the same processor will use DBMS, and UNIX* Requests to other processors will use two calls to DBMS (one in each processor), two calls to
UNIX (one in each processor), and one to Cronus.
* UNIX uses u% of resources.* Cronus usage is as follows:
- Supervisor: csup %- Interface with UNIX: cu instructions.- Interface with DBMS (for write): cdw instructions.- Interface with DBMS (for read) : cdr instructions.
• DBMS usage is as follows:
- DBMS write: dw instructions.- DBMS read: dr instructions.
5.2. Configuration
The architecture is a distributed system with the following characteristics (figure 16):
* The system consists on n homogeneous processors denoted by p(i), i = 1,..., n. Non-homogeneous processors can be easily accommodated.
• Memory response time is not considered for this part of the analysis.* Data bases are denoted by DB(i,q), where i = 1,...,m and q is the host processor.* Workloid elements are denoted by W (iF), where i is the requesting processor, F= F(k,DB(j,q))
is the function it is performing. The function is specified by k, where k=W (write) or R (read),and DB(j,q) is the database it is accessing.
29
Figure 16. Distributed architecture of the example
5.3. Analysis
- Interarrival calculations
The arrival of traffic to each processor is calculated as follows. For each processor k, k = 1,.. n,define four classes of requests; write requests within the same processor (A(k,1)), read requestswithin the same processor (A(k,2)), write requests to other processors (A(k,3)), and read requeststo other processors (A(k,4)). Thus the four quantities can be calculated as follows:
A(k,1) = I Y W(i,F,DB(j,q))i=q=k F=W
A(k,2) = I I. W(i,F,DBOj,q))
i=q=k F=R
A(k,3)= I W(iF,DBj,q)) + . X W(i,F,DB(j,q))i=k,q~k F=W i=k,qok F*W
A(k,4) = I W(iF,DB(j,q)) + I .W(i,F,DB(j,q))i=k,q~k F=R ;=k,qc-k F=R
Then the interarrival time to the kth processor,% (kj), is given by:
X (kj) = 1/A(kj), j =1,2,3,4
* Service time calculation
The service time of the kth processor due to the jth type request, t (kj), is computed by:
The utilization of the kth processor due to the jth type request, p(kj), and the total utilization,p(k), are given by:
p(kj) = R. (kj)/X (kj)
4
p(k) = p(kj)j=1
• Response time
Define R(kj) to be the response time of the jth type request on the kth processor. Then:
R(kj) = p. (kj)/ (1 - p(k))
5.4. Results
After execution, ESDS produces several classes of output describing system performance. ForPhase I, at the user option, the output can be received at two different levels of detail. One optionshows all intermediate calculations, and the other produces the final performance parameters. Theoutput is shown on screen, and is similar to figure 14. The program is quite fast. On a macintoshIlci, the total execution time is less than 30 seconds. The high level summary output is showntables 1 and 2.
5.4.1. Utilization Summary
The model computes the utilization by workload element, by function, and by processor. The userhas the option to view the output at different levels of detail. At the minimum, the summary shownin table 1 is presented.
The model computes the response time by workload element and by function. The user has theoption to view the output at different levels of detail. A summary showing the response times byworkload elements is presented in table 2.
The following default assignments and values are used for initial calculations of performanceparameters. The user can change most of these parameters to exercise "what if" questions,including reassigning the databases and the workload elements to different processors
32
- Number of processors: n =4
• Number of databases: m = 5 with the following initial assignments:
* Data base I to processor 1, i.e. DB(1,1)- Data base 2 to processor 2, i.e. DB(2,2)* Data base 3 to processor 3, i.e. DB(3,3)
* Data base 4 to processor 4, i.e. DB(4,4)• Data base 5 to processor 3, i.e. DB(5,3)
- Workload has 12 elements with the following per second arrival rates:
- W (1,w, DB(1,1)) = 10 W (1,w, DB(5,3)) = 10 W (2,r, DB(1,1)) = 15• W (2,r, DB(2,2)) = 15 W (2,r, DB(4,4)) = 15 W (2,r, DB(5,3)) = 10- W (3,r, DB(1,1)) = 20 W (3,r, DB(2,2)) = 25 W (3,r, DB(3,3)) = 20* W (3,r, DB(4,4))= 25 W (4,w, DB(3,3)) = 30 W (4,wDB(4,4))= 30
* Other system parameters are as follows:
* u = 0.25
* csup = 0.30• cu = 100,000* cdw = 100,000
- cdr = 50,000
* dw = 100,000• dr = 50,000• MIPS = 10
6.0. Distributed Operating System (Cronus)
6.1. Description of Cronus
Cronus is an object oriented distributed operating system which interacts with the native operatingsystem. The interaction between Cronus and the native operating system is not a master-slaverelationship rather its is a complementary one, in the sense that the application is served by bothoperating systems based on the type of service requested. Each operating system calls upon theother whenever a request issued by the application program falls into its domain of responsibility.Generally, the requests associated with the distributed environment are handled by Cronus whilelocal processing requests are handled by the native operating system. Sometimes Cronus uses thefacilities of the native operating system to perform its own internal tasks. Thus, the interactionbetween the two operating systems is quite complex. The operations of the operating systems andwhich one is handling the user's requests are transparent to the application program.
33
The Cronus operating system consists of a set of "objects". An object can be any entity; e.g. aprocess, a device, a message, or a traffic element. An object is described by two inseparablecharacteristics: its state and the operations performed on it. The state of the object describesinformation about its present status. The operations are initiated by the application programs (calledthe "clients"). The set of operations collectively determine the objectfs behavior. Often, objectsshare similar properties or similar operations are performed on a set of objects. A set of objectssharing similar behavior form an "object class" and each element of the set is called an "instance"of the class. An object always belongs to a class, even if it is the only instance of that class. Eachobject has its own state called its "instance variable". For example, the class of all CPUs forms anobject class. Then characteristics of the CPUs are the state of the class, e.g. CPU speed or itsoperating system. IBM computers is a subclass of this class and IBM 3861 is an instance of objectclass CPU. The MIPS rating of 8 and MVS are its instance variables of IBM 3861. A subclass ofan object class inherits all properties of its superclass, e.g. the subclass "IBM computers" inheritsthe properties of having a MIPS rating and an operating system.
We can associate one or more procedures, called a "method", to an object, e.g. to the object class"CPU", we can associate a method for computing the impact of the operating system onperformance. The actual implementation of method can vary from object to object, and hence themethod for computing the impact of the operating system can vary from CPU to CPU. Theimportant point is that once a method is associated or defined for an object or an object class, it hasto be specified for each instance of that object. Thus, specifying the method for computing theimpact of the operating system for the class of CPUs requires its specifica.ion for each subclass orinstance of that class. Methods are inherited by the subclasses of an object class, but we canredefine the method for any subclass. Hence, if the method for computing the impact of operatingsystem is defined for the class of CPUs, it is assumed that the computation is inherited by allsubclasses and instances of this class. However, we can insert a new definition of the method for asubclass or an instance of the object.
Cronus treats all resources and entities it manages as objects. The object classes it representsinclude processes, files, resources, and the elements of an operating system. In the Cronusenvironment, communication between a client requesting a service, and a serve providing theservice follows a specific protocol which has great implication on its performance, andconsequently, on its model. The communication protocol hierarchy closely follows a set ofprotocol layers. Each layer of the client communicates with the corresponding layer of the server,called its peer. At the highest layer, the client communicates with the "object manager" of Cronus.However except for the lowest layer, there -s no direct data transfer between peers. Instead, eachlayer of the client and the server passes ZIA.: control and data informations to the next lower orhigher (as appropriate) layer of its own hierarch,. Thus, when a client invokes an operation, themcbsage is passed through each layer of its protocol hierarchy to the lowest layer, is transferred tosystem side, and is passed up through each layer, ending up at the object manager. The core of theCronus operating system is the Object Manager (OM). OM is a complex program which performsthe bulk of the supervisory functions including message handling, access control, multi-tasking,data storage, and other application programs requests pertaining to the distributed environment. Italso interface with the native operating system to use its functions and facilities for servicing localrequests. Figure 17, taken from [2], shows various Cronus protocol hierarchy layers which arebriefly described in the following sections. A more detailed discussion appears in [2].
34
Po= Kenle Kene ProcessIClien c mjrou ICronlus II I
ApitoApplicat
RPC v RPCransaton Opeabon Protocol Translation
MSL MSL
TCPUDP IP
Figure 17. Cronus protocol hierarchy
6.1.1. Application Layer
The application layer consists of entities which fall outside of the domain of Cronus. It is primarilyconcerned with the programs written by the user and the objects that these programs act upon.Applications invoke actions which will operate on objects (e.g. data sets) and receive feedbackfrom them. The application layer communicates through a subroutine library called ProcessSupport Library which is used for invoking program-generated operations.
- Remote Procedure Call (RPC) Translation Layer
The RPC Translation layer translates the procedure calls within an application layer to an operationinvocation on a data object. The RPC layer consists of a library of subroutines within the objectmanager which link with the application program and are executed as part of the applicationprocess. The RPC layer receives operation invocations from processes on other processors via theInter Process Communication (IPC) layer. It then processes the message and sends it to itsdestination. Within RPC, operations are performed via Operation Protocol (OP) whose main taskis to convert native data types into canonical parameters, transport these machine-independentvalues among processors, and convert the canonical data back into new host's data types.Acknowledgement messages are sent back taking similar, but the reverse, route. An OP message isan ordered pair (KP), called key-value pair, where K is the parameter name and P is its value. Thekey-value pairs are constructed from a set of Canonical data types which are machine-independentdata representation. This will allow transfer of data among heterogeneous processors. A library ofsubroutines called Message Structure Library (MSL) facilitates the transformation of machine- orlanguage-dependent data into Canonical data types.
6.1.2. IPC Layer and Cronus Kernel.
After constructing the message, RPC layer passes it to the next lowest layer in the hierarchy, calledthe InterProcess Communication layer. This is accomplished through a Cronus routine calledInvoke. Invoke uses the native operating system's IPC to transfer OP messages from the client'sdomain to a Cronus component called Cronus Kernel. The kernel is a Cronus application programwhich runs under the native operating system on each host. It is composed of five components:
35
* Operations Switch is the standard interface between Cronus and the network software responsiblefor intrahost message delivery. It locates the manager process capable of handling the request anddelivers the message either directly to the process if it is on the same host or to the OperationsSwitch to host where the manager is located. Operation Switches communicate amongthemselves using a low level protocol calledpeer-to-peer protocol. This protocol is used for thespecification of type of messages transferred and managing the network resources.
" Locator is an adjunct to Operation Switch, and using the network broadcast facilities, managesthe protocol for locating objects in a distributed environment.
* Process Manager resides in the Cronus kernel and shares table data structures with OperationSwitch. It converts the Cronus process objects to system calls of the native operating system. Italso uniformly defines the unique features of local processes. Thus, it is the major bridgebetween the Cronus operating system and the native operating system.
* Request Manager is used to maintain information about the status of objects across the network,to inform the user of the progress of tasks, and to notify the users if the system has crashed.
* Broadcast Repeater is used when a number of interconnected networks are used in a distributedenvironment. Its function is to maintain communication among the networks which is transparentto the applications.
6.1.3. Network Layer
The Network Layer is the lowest layer of communication protocol. It provides for reliable datatransport across the network (not to be confused with Network Layer is different from layer 3 ofISO). The Network Layer supports the Internet protocol including Transmission Control Protocol(TCP), the User Datagram Protocol (UDP), and Internet Protocol (IP).
We will treat the native operating as a generic operating system providing the usual services with aknown set of overhead parameters. This method of accounting is a generally accepted method ofmodeling an operating system, especially when detailed information about the operating system isnot available or detailed modeling is not required.
6.2. Model of Cronus
Above discussion and our analysis has resulted in a preliminary model of the Cronus operatingsystem and its interaction with the application and the native operating system. Major elements ofthis model are briefly discussed here and shown in figure 18. We begin by assuming that a requestfor service is issued by a client in host A.
• Process Support Library (PSL) routines transform the request into an invoke operation of theCronus.
• Remote Procedure Call (RPC) translates the operation from a procedure call into a appropriateoperation on the object or the data set.
* Cronus's object manager receives the request to determine whether the data is located in the samehost or must be retrieved from another host.
- Native operating system is used to communicate with Cronus kernel (via intrahost InterProcessCommunication).
• Interhost IPC sends the message over the communication network.
• Interhost IPC on the receiving host receives the message and hands the message Cronus kernel.
36
- Cronus kernel uses the native operating system to hand off the message to RPC translator.
* Object manager on the receiving host finds the data.
* The reply follows a reverse path.
Host A
Clet operation proc. to an op receives handoff IPC CronusMn oiect I Inpfatn :HKernel
Host BRPC Reply= set =in=r~s~_(Etanslation to Cronus IPC to Cin
SIkernelntwr
Figure 18. Interface of Cronus, client, and native operating system
7.0. Phase II Plans
We will briefly discuss our plan for Phase II development of the environment.
7.1. Development of User Interface
We have presented our progress thus far and our plans for the development of user interface forPhase II in section 4.2. We will further elaborate on these ideas in the technical volume of Phase IIproposal.
7.2. System Definition
The capabilities considered for Phase II development of ESDS will include the following features:
- ESDS will contain a library of all major computers (IBM, DEC, etc.) with their characteristicsalready defined in the system. The user can choose one by selecting it from a table or define anew one and add it to the library.
* ESDS will contain a library of all major operating systems (Cronus, MVS, VMS, NOS, Unix,Dos, etc.) with their characteristics already defined in the system. The user can choose one byselecting it from a table and assigning it to a processor or define a new one and add it to thelibrary.
37
* ESDS will contain a library of all major DBMSs (Adabase, Ingress, Oracle, M204, etc.) withtheir characteristics already defined in the system. The user can choose one by selecting it from atable and assigning it to a processor or define a new one and add it to the library.
* ESDS will contain a library of all major networks (star, ring, etc.) with the associated protocols(IEEE 802, etc.) already defined in the system. The user can choose one by selecting it from atable or define a new one and add it to the library.
* After defining the system the user can choose to apply discrete event simulation or analyticaltechniques without having to redefine the system all over again.
* ESDS will contain a library of optimization tools and algorithms. These tools can be used tooptimize various components of the system, e.g. assignment of functions to processors,developing optimum routing algorithms, etc.
• ESDS will permit for dynamic assignment and reassignment of functions, workload elements,and databases to processor or other elements of the system. This is performed by selecting theitem from a menu on the screen, "dragging" it to the desired location, and "dropping" it on itshost. This is an important feature of the tool and will be appreciated by those who developmodels of computer systems.
* Historically, developing the models of large systems have been difficult and cumbersome. ESDSallows for the definition and the designation of subsystems as macros which can be later used asicons in larger systems, thus avoiding large and unwieldy systems with hundreds of nodes to beanalyzed at once. The user can inspect and/or edit a macro by clicking on its icon opening a newwindow containing its characteristics, and if desired, performing subsystem analysis. Thecapability of using macros has many advantages which cannot adequately be discussed here.
* ESDS will have an advanced use interface, a sampling of which is discussed in section 4.2. andwas demonstrated during our briefing in Fort Huachuca. All user actions will be via a mouseusing icons and forms provided by system. Thus the user will never have to be concerned aboutforgetting to enter the required information.
* Redefining the system elements or characteristics of a component can be done ,.ith ease, bypointing the mouse to the desired component or field and entering the change.
7.3. Measures of Effectiveness
It is known that one or two metrics are not sufficient for measuring the effectiveness and theperformance of most modern parallel or distributed systems. ESDS will contain a set ofperformance measures including their description, the area of their applicability, and theirinterpretation. Some of these measures were discussed in section 4.2.10.
7.4. Library of Algorithms
ESDS will contain the library of algorithms discussed in section 4.2.11.
7.5. Knowledge Base Development
By the conclusion of Phase II development we expect to include the first two knowledge basesdiscussed in section 4.2.12. One will be a knowledge base to optimally assign the applicationfunctions to processors. The second knowledge base will isolate performance failures to acomponent or a subsystem. We have shown the feasibility of developing these knowledge basesas part of uur earlier research efforts. Our plan is to continue the development of these knowledge
38
bases during the Phase II development. In this section we present a summary of our approach for
their development
7.5.1. Optimal Assignment of Functions to Processors
Parallel and distributed systems improve the performance of an application by using its inherentparallelism to process tasks concurrently. An immediate consequence of this is that theapplication's tasks assigned to different processors may have to pass or share data, exchangemessages, or synchronize before another task can initiate processing. These and other services,basically overhead elements, can be resource intensive causing degradation of performance.Therefore, a major concern in the design of such systems is how to proceed with the assignment toattain the maximum speedup over sequential processing. It may appear that this objective can berealized by balancing the load among processors, ensuring that no processor's utilization exceedsone, i.e.; none is scheduled beyond its capacity. However, achieving balanced utilization may infact degrade performance by increasing the communication and other overhead requirements. Themajor design decision, therefore, is to devise an assignment strategy that satisfies two objectives:(1) The load among processors is balanced, and (2) The communication and other overhead usageare minimized.
Clearly, these two objectives cannot be satisfied simultaneously, and hence, a trade-off betweenthe two needs to be performed. Further, any solution to this problem will have to offer the designerthe ability to quickly evaluate different assignments and choose the one that best satisfies hisspecific requirements. In this paper we will show that an optimal assignment strategy can be foundby: (1) Formulating the problem in a (non-linear) optimization context, and (2) Developing aknowledge base that finds a "better" solution if it is presented with an existing one which may notnecessarily be optimal. Our approach briefly is as follows:
Assignment of Value
The application's software flow is decomposed into forks and branches. A branch is a series oftasks to be processed sequentially. A fork is a set of branches emanating from a branching pointand converging to a synchronization point. Values are assigned to tasks, branches, and forksreflecting their response times. The value of a task is the sum of the following components:
* Its execution time,* The queue time due to contention at the processor,* Memory access or response time,* Communication time,* Delay due to synchronization, and* Operating system overhead.
The value of a branch is the sum of the values of its tasks. The value of a fork is the value of itslongest branch. The value of the software flow is the value of its longest fork or branch.
A recursive approach is developed to find a better assignment by improving on a previous one.The improvement is measured as the shortening of the total response time (value) of the softwareflow. The recursive technique works as follows:
We choose the two branches with the highest and lowest value, and reassign their tasks amongprocessors. If the branch with the highest value is ai fork itself, the algorithm is applied to that fork.The algorithm will ensure that the value of the fork will not increase. We begin by considering thebranches of the outermost fork in the software flow. In our implementation these algorithms arecoupled to a set of rules that will present the results of a run to the user along with the resultingrecommendations. The user can interpret the recommendations, make changes as appropriate, and
39
run the algorithm again. Recommendations guarantee that a faster end-to-end response time (i.e. a
smaller value) is produced. The rules are implemented in a knowledge base.
Development of a knowledge base
The problem can be formulated as an optimization problem and solved using a number of AI andoperations research techniques. Our approach will be to recursively find a better assignment oftasks to processors by improving on a previous one. The improvement is measured as shorteningthe total response time of the software flow. We assume that an initial assignment has been made.The technique, in summary, is as follows:
- Choose the branch with the highest value, and balance its load with the branch of the fork withthe lowest value. If the branch with the highest value is a fork itself, perform the load balancingwith that fork, first. This will result in a fork with lower response time that the one we startedwith. The user is presented with a recommendation for reassigning tasks which he can reject.
* The load balancing is done by formulating it as an optimization problem.
A top-down approach is used to compute the values of the branches of the outermost fork in thesoftware flow. We apply our algorithm to the longest and shortest branches. The branch selectionand load balancing algorithms are presented in detail below. In our proposed implementation, thesealgorithms will be coupled to a set of rules that will present the results of a run to the user alongwith any recommendations. The user can interpret the recommendations, make changes asappropriate, and run the algorithm again. The pseudo-code for the algorithm, called 'load-balance',is defined as follows:
Begin load-balance (fork):
1. Compute the value of all branches of a fork.
2. If the branch with the highest value contains a fork, recursively apply the load-balance algorithm to thisfork.
3. Choose the two branches with the highest and lowest values for load balancing. Essentially, we aretrying to redistribute the load so that longest branch in the load-balanced fork has a faster time than thatin the current fork. Hence, the response time of the fork will decrease. Our rationale for choosing theshortest branch to shorten the longest branch is that there is no other branch in the fork with greater'slack time' available. If the branch with the lowest value (shortest response time) includes one or morenested forks, initially choose the lowest valued branch of these forks. Thus, the response time of theassociated fork will probably increase less than if another branch is selected.
4. Load-balance the two selected branches using above algorithm.
End.
After running load-balance on the given architecture, the system will summarize the results andpresent its recommendations (if any). The user may then redistribute the load as the algorithmsuggests and run the algorithm again. The algorithm guarantees that its recommendations willproduce a faster end-to-end response time under the given the constraints. We realize, however,that there may be other constraints which are not represented. The user should interpret therecommenidations with these other constraints in mind.The algorithm is summarized in figure 19.
40
Assign total execution timeto the value of each branchin the fork
Recursive call
Pick the two branches with the highest and lowestvalues to load balance. If the branch with thelowest value includes one or more nested forks,initially choose lowest value brach of these forks
Load balanceselected branchel
Figure 19. Flow chart of branch selection technique
We have implemented a variant of above algorithm in a combination of an object oriented languageand Prolog, and have developed a rule base for designing an optimal pipeline in a vector processor.
7.5.2. .Knowledge Base for Isolation of Performance Failures
Of the many roles of performance modeling, the recognition of performance failures and theisolation of their causes are probably the most important. A performance failure is any departure ofa system's actual or predicted behavior from its intended (e.g., designed or specified) behavior.Examples of such failure are the inability of a computer system to sustain a desired level ofthroughput, a job or a transaction failure to meet its prescribed response time, or a device'sutilization exceeding a given threshold. A failure can be actual (as in an operational system), orderived or inferred (as predicted by a model of the system). Upon the detection of a failure itscauses need to be identified and corrective action taken to ensure the mission success. "Expert"modelers use diagnostic reasoning and data to draw inferences to determine the causes of thefailures and take corrective action. The reasons for the absence of such a knowledge base as a partof modeling environments are numerous. Two reasons are thought to be major contributors. First,a performance failure can have numerous sources and its attribution to a specific cause is oftendifficult. Second, the rules governing the cause(s) of a problem are quite complex and expertsoften employ subjective and "rule-of-thumb" approach to arrive at the roots of performance
* failures. Development of a knowledge base for this purpose is a two step process:
• A systematic analysis of a performance problem in the context of total system design andoperational concept is required to isolate the failure to a cause.
* The rules leading to the attribution of the problem to a specific cause need to be implemented in aknowledge base.
41
The seemingly "subjective reasoning" process of finding the causes of a performance failure of acomputer system is based on a systematic approach employed by human "experts". It falls into thebroad category of problem isolation techniques called Diagnostic Reasoning. The technique hasbeen successfully applied by others to detect and isolate the failures of variety of systems. Forexample, Davis R.[4] has applied it for the troubleshooting of electronic digital circuits, Breuer,M.A. and Friedman, A.[3] have applied a modified version of the technique for the failuredetection using guided probe, and Abramovici, M. and Breuer, M.A. [1] have applied it for cause-effect analysis.
The ideas and the terminology of Diagnostic Reasoning have natural counterparts in computerarchitecture with possible new interpretations for some. Previous applications of this techniquediffer from the present problem in an important way. In the past, the technique has been applied toproblems and components which have two deterministic states, i.e., components which are either"working" or have "failed". The application we are considering has a stochastic state space, i.e.,failure is only a statistical inference, and hence, it possesses a continuum of "working" and"failing" states. Yet, the key Diagnostic Reasoning concepts of structure, behavior, adjacency,causal pathways, and categorization and layering of failures still carry over naturally and can beeasily adopted to this problem. Of course, our conclusions and diagnoses will be only statistical,but the same is generally true for problems with deterministic state space, Davis [4].
We see several advantages to this approach for performance diagnosis of computer systems. Themost important is impracticality of the alternative approach, namely the development of proceduresto test various possible branches. This could entail treating the system as a black box andproducing input values with known outputs to test the behavior of various components andsubsystems. The data and statistical analyses required to support such an approach are prohibitive.Practical diagnostic techniques based on reasoning and inference do not require such detailednumerical knowledge to be effective. We believe that encapsulated experience, sophisticated"intelligent" search, and qualitative reasoning are the key to practical diagnostic reasoning aboutsystems that have failed their performance requirements.
Secondly, we believe that our knowledge-based approach provides many of the advantagestypically claimed for expert systems: transfer of expertise to novices (i.e., providing training as aside effect of the diagnosis process), intuitive support for conclusions and recommendations, andthe ability to handle vague and messy problems. Finally, we believe that this line of reasoningleads naturally to insights into system design and design verification.
Principles of Diagnostic Reasoning
One of the standard tools of software engineering and digital hardware is the design of faultdetection experiments and diagnosable machines, e.g., based on the construction of homing anddistinguishing sequences for finite state machines, Zohari [9]. More recently, a nearly independentset of fault diagnosis theories and programs for digital circuits has been emerging in appliedartificial intelligence literature. Stimulated by the seminal contribution of researchers such as deKleer, Cer.,sereth, and Davis, this line of research has led to demonstration programs - practicalfor small problems - that rely on intuitively motivated "qualitative reasoning" algorithms andheuristics.
Although the literature on Artificial Intelligence approaches to fault diagnosis and reasoning israpidly growing and is yet to mature, it has already produced some solid insights and programmingtechniques that have proed useful in the development of knowledge-based systems for faultdiagnosis. Prominent among these are approaches that exploit the concepts of casualty andexplanation to drive the process of testing and diagnosis, and to organize computation and searchefficiently. Diagnostic Reasoning exploits the knowledge of structure and behavior to draw
42
inferences about the causes of failures. Structure covers a broad class of entities which make up thesystem and their interrelationships, including physical components, e.g., hardware devices andtheir connectivities. Behavior describes the system operation or its specified and expectedoperation. Behavior is specified by how the system's output relates to its input. A variety oftechniques is used to describe behavior, including rules for mapping input to output, Petri-nets,simulation, queueing networks, or a combination of these methods.
The process of Diagnostic Reasoning proceeds by using the structure, behavior, and the symptomsof the failure to generate a candidate set of causes, i.e., determine a set of causes which could havepossibly brought abou' the failure. A fundamental principle in finding the sources of the problem isunderstanding the way a failure can propagate through the system. This leads to the developmentof causal pathways, essential to tracing the "path" of a failure. In this effort, one is faced with theinevitable dilemma of complexity vs. completeness, i.e., to produce a complete set of possiblecauses, a costly and complex search is needed. This dilemma is dealt with by categorizing andlayering failures. The essence of layering is the observation that certain failures occur more oftenthan others. Thus, one begins by examining most likely causes and, depending on the desired levelof completeness, continue adding less probable causes. This will ensure capturing importantcauses should one decide to discontinue the search. Hence, associated with each category offailure, there will be a collection of paths of interaction. Thus, an ordering of categories of failureswill produce an ordering of paths of interaction and the resulting causal pathways. This will allowconstraining candidate generation, while no path is completely eliminated from consideration. Weare afforded the opportunity of considering a progressively wider class of candidate causes. Thecategorization of failures thus obtained will naturally lead to their hierarchical classification.
The dis.ussion demonstrates the importance of pathways in acquiring knowledge and finding thecauses of a failure. Implicit in the determination of pathways is the notion of next or adjacententities, i.e., the causes of failure propagate because the system entities are adjacent. Therefore, theconcept of adjacency plays an important and fundamental role in the definition of the pathways ofinteraction. Adjacency can be physical (standard notion), functional, and/or algorithmic. Clearly,broadening the concept enlarges the number of pathways of interaction.
8.0. Phase 1 Prototype Software Description
The Phase I prototype is implemented in the Smalltalk object-oriented programming language.Objects are instances of statically defined classes which specify object attributes (instancevariables) and behavior (i.e., procedures or methods). Classes are hierarchical and each classinherits all instance variables and methods of its superclass. Methods may be overridden in asubclass by rewriting them.
8.1. Phase I Pr,,itotype Overall Class Hierarchy
Below is the complete class hierarchy for the Phase I prototype. In the listing, each tab levelrepresents an inheritance level. For instance, an ActionMenuController is a Controller which, inturn, is an Object. Underlined items are names of classes developed for the prototype. Items notunderlined are classes provided by the Smalltalk environment. Quoted strings within parentLesesare instance variables. Instance variables are always inherited by subclass objects.
Figure 20. Object hierarchy for graphical elements of the Phase I prototype.
8.3. Phase I Prototype Editor Windows
Smalltalk provides a metaphor for building applications that is known as the Model-View-Controller paradigm. The model represents the underlying application, the view (or window)represents the visible aspects of the user interface, and the controller represents the way the usermay interact with the elements of the view. A view and controller are always a pair of interactingobjects. The view/controller pairs are usually nested one level deep, with the outer level beingsome kind of StandardSystemView/ControUer and with the inner levels providing the guts of theapplication. The conceptual nesting corresponds to actual physical nesting of views within views.
The Phase I prototype provides eight editors (plus the analysis window) which are all built fromview/controller hierarchies. Additionally, the prototype adds a primitive form of "interview-communication" via the classes SubordinateEntry, SubordinateSystemView, andSubordinateSystemController. Aspects of the editors are summarized in Table 3 below.
Analysis Analysis- SubordinateSystem- SubordinateSystem- AnalysisView,Results Collector View Controller AnalysisButtonsViewWindow I
Table 3. Editor model/view/controllers in the Phase I prototype.
8.4. Phase I Protozype System Architecture Object Description
In this section we view in additional detail, the class hierarchy of DistributedDBArch, theapplication object being defined, manipulated, and analyzed. For each class, its type and instancevariables with their tpexs are given.
SystemnArch an ObjecthardwareArch a HardwareArchapplFunctions a Dictionary of ApplFunctionsworkloads a Dictionary of Workloadsoss a Dictionary of OSsmacroDefs a Dictionary of HardwareArchs (not implemented)
Distributed DBArch a SystemnArchdbmss a Dictionary of DBMSsdbCollections a Dictionary of DBCollections
HardwareArch a Hardware Element (allows recursive def'n of macros)elements a Dictionary of Hardware Elementsconnections a Set of GraphArcsassignedAppIFunctlons a Set of ApplFunction names (not implemented)assigned Databases a Set of Database names (not Implemented)assigned Workloads a Set of Workload names (not Implemented)parentArch a SystemnArch (not implemented)
47
GraphNode an Objecticon a Formn.
-iconSymbol a Symbollocation a Point
GraphArc anObjectelementi a GraphNodeelement2 a GraphNodepoints an Ordered~oilection of Points
DirectedGraphArc a GraphkrcHardware Element a GraphNode
name a StringCPU a HardwareElement
memory an Integerspeed an Integer (in MIPS)os an OSdbms a DBMSappiFunctions a Set of AppiFunction namesdatabases a Set of DBCollectian namesworkloads a Set of Workload names
-MicroComputer a CPUMiniComputer a CPUMainframeComputer a CPUSuperComputer a CPUWorkstation a CPUMemory a HardwareElementDisk a HardwareElementNetwork a HardwareElementAppiFunction aGraphNode
name a StringblorckCount an IntegerioCount an IntegerinstrCount an IntegerdbCallCount an Integer (eliminated in favor of DBFunctions)
OBFunction an AppiFunctiondbCollection a OB~ollectionoperation a Symbol (#read I #wnte I #update)
Workload an Objectname a Stringfunctional Elements a Set of FunctionalElementsconnections an Set of DirectedGraphArcsarrivaiRate an Integer (represents workloadslsecond)responseTimeReq an Integer (in milliseconds)
Functional Element a GraphNodefunction an ApplFunction name
OS an Objectname a StringsupervisorOverhead an Integer (% of CPU utilization by Supervisor)
(u for UNIX)schedulerlnstrCount an Integer
48
resourcefgrlnstrCount an IntegerblockHandlerlnstrCount an IntegerioHandlerinstrCount an IntegerqueueHandlerlnstrCount an Integer
GronosOS an OS (* supervisorOverhead is cSup)40nativeUsagelnstrCount an Integer (cu for UNNX
dbWriteinstrCount an Integer (cd)dbReadinstrCount an Integer ( dr)
DBMS an Objectname a StringreadinstrCount an Integer (dr)writelnstrCount an Integer ('dw)updateinstrCount an Integer
DBCollection an Objectname a StringdbTables a Set of DBTables;
DBTable an Objectname a StringpfimaryKey a Stringrows a Set of Strings
9.0. Bibliography
[1] Abramovici, M. and Breuer, M.A., "Fault Diagnosis in Synchronous Sequential CircuitsBased on an Effect-Cause Analysis", IEEE Trans. Comput. 31, 1982, pp. 1165-1172.
[2] Berets, 3. C., Sands, R. M., "Introduction to Cronus", BBN Systems and TechnologiesCorporation, 1989.
[3] Breuer, M.A. and Friedman, A., "Diagnosis and Reliable Design of Reliable Systems",Computer Science Press, Rockville, Md. 1976.
[4] Davis, R., "Diagnostic Reasoning Based on Structure and Behavior", Qualitative ReasoningAbout Physical systems, MIT Press, 1985, pp 347-410.
[5] Norman, D.A., "The Psychology of Everyday Things", Basic Books Inc., 1988.
[6] Pazirandeh, M. and Becker, 3., "Object-Oriented Performance Models With Knowledge-BasedDiagnostics", Proceeding of 1987 Winter Simulation Conference, 1987.
[7] Pazirandeh, M., Cox, A., "Identification of Performance Failures Based on DiagnosticReasoning", (in preparation).
[8] Pazirandeh, M., "Optimal Design of Parallel Systems", to be submitted 1990.
[9] Zohari, M., "Finite Automata and Switching Circuits", 1977.