Monash Business School Is Economic Uncertainty Priced in the Cross-Section of Stock Returns? Turan Bali, Georgetown University Stephen Brown, NYU Stern, Monash University Yi Tang, Fordham University 2018 CARE Conference, Washington DC May 18-19, 2018
Transcript
MonashBusinessSchool
Is Economic Uncertainty Priced in the Cross-Section of Stock
Returns?
Turan Bali, Georgetown UniversityStephen Brown, NYU Stern, Monash University
Yi Tang, Fordham University
2018 CARE Conference, Washington DCMay 18-19, 2018
MonashBusinessSchool
Introduction
Knight (1921) distinction between risk and true uncertainty
Uncertainty when probability distribution is itself unknown
Uncertainty, by its nature, cannot be measured and is uninsurable
But is the result of measurable economic changes.
Not much attention in the empirical asset pricing literature
MonashBusinessSchool
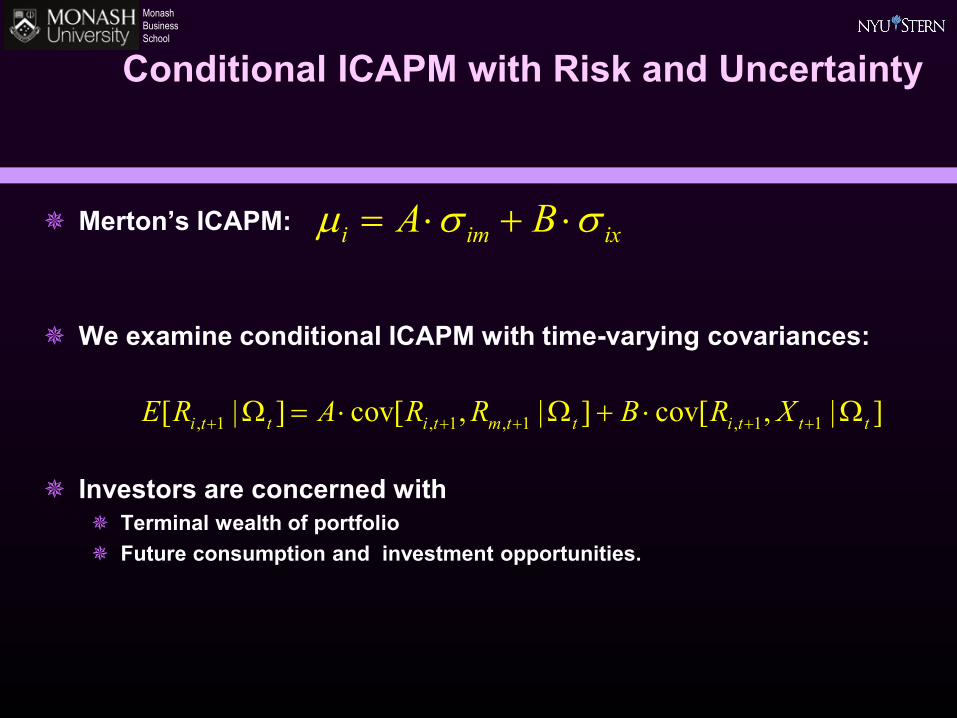
Conditional ICAPM with Risk and Uncertainty
Merton’s ICAPM:
We examine conditional ICAPM with time-varying covariances:
Investors are concerned with Terminal wealth of portfolio Future consumption and investment opportunities.
i im ixA Bµ σ σ= ⋅ + ⋅
, 1 , 1 , 1 , 1 1[ | ] cov[ , | ] cov[ , | ]i t t i t m t t i t t tE R A R R B R X+ + + + +Ω = ⋅ Ω + ⋅ Ω
MonashBusinessSchool
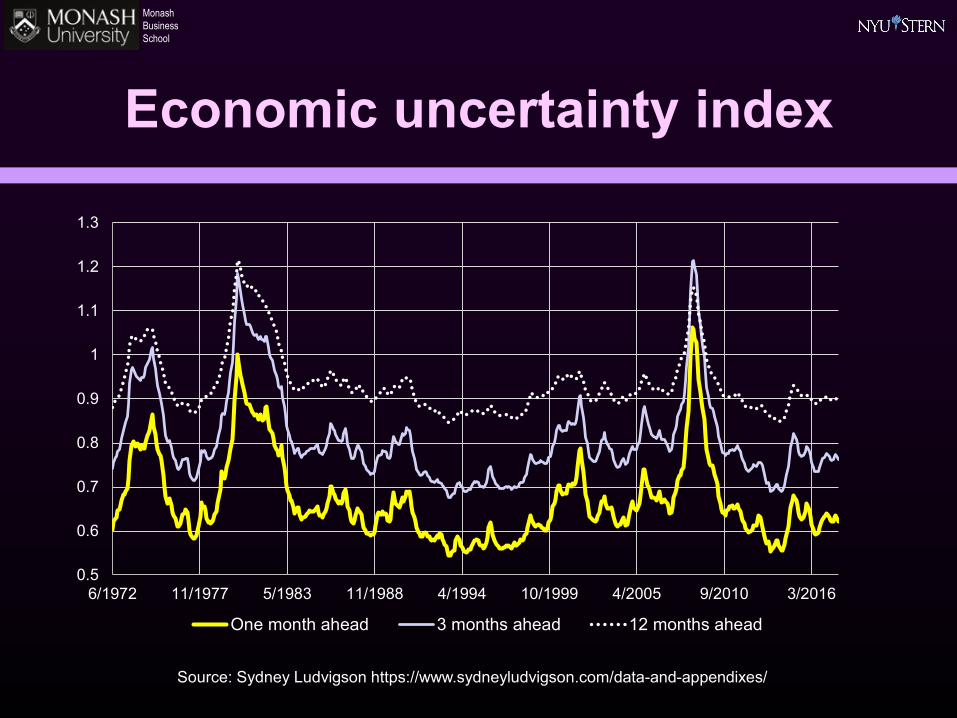
Economic uncertainty index
Jurado, Ludvigson, and Ng (2015) Uncertainty: conditional volatility of innovations
132 macroeconomic time series Real output and income Employment and hours Real retail, manufacturing and trade sales Consumer spending Housing starts etc.
Computed on a one month, three month and one year basis
Source: Sydney Ludvigson https://www.sydneyludvigson.com/data-and-appendixes/
MonashBusinessSchool
Uncertainty Beta
Excess stock returns regressed on uncertainty index
Sixty month rolling regressions
1, ,
// , , ,
( )MKT SMBit ft i t i MKT t ft i t
HML UMD LIQi t i t i tI A ROE
i I A t i ROE t i t
UNCiR r UNC R r SMB
HML UMD LIQR R
α β β
β β β
β ε
β
β
− = + ⋅ + ⋅ − + ⋅
+ ⋅ + ⋅ + ⋅
+ ⋅ + ⋅ +
MonashBusinessSchool
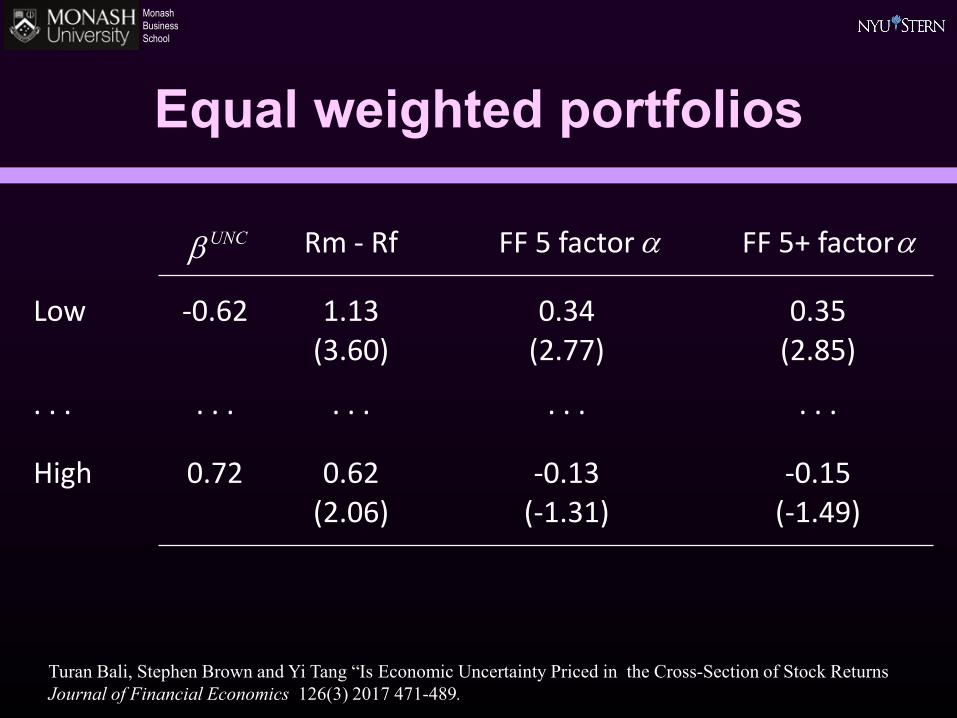
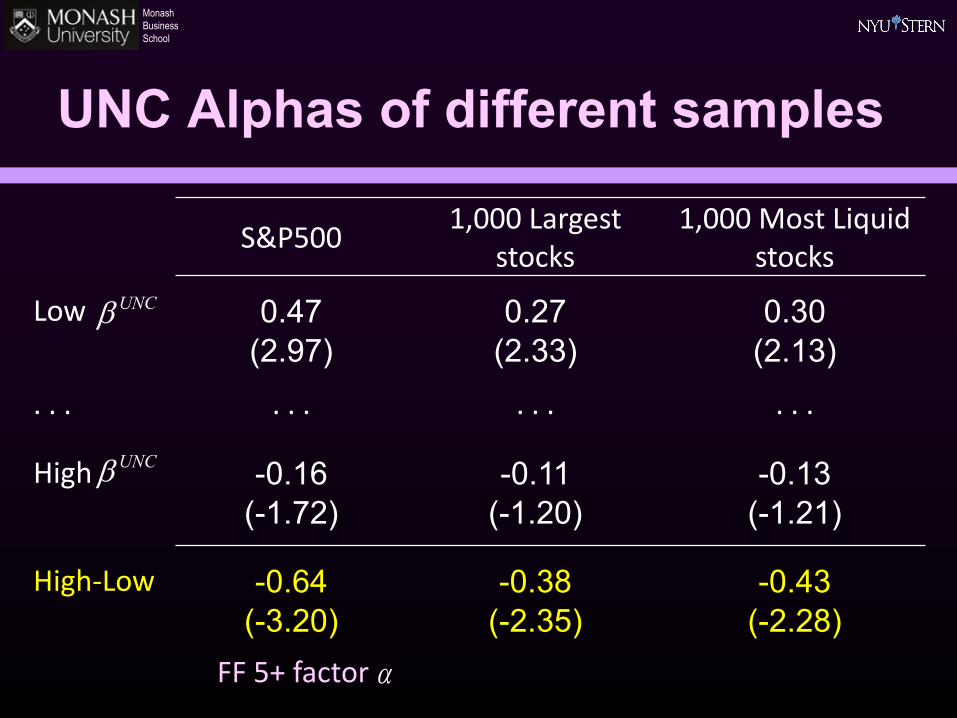
Equal weighted portfolios
Rm - Rf FF 5 factor FF 5+ factor
Low -0.62 1.13 0.34 0.35(3.60) (2.77) (2.85)
. . . . . . . . . . . . . . .
High 0.72 0.62 -0.13 -0.15(2.06) (-1.31) (-1.49)
αUNCβ α
Turan Bali, Stephen Brown and Yi Tang “Is Economic Uncertainty Priced in the Cross-Section of Stock Returns Journal of Financial Economics 126(3) 2017 471-489.
Turan Bali, Stephen Brown and Yi Tang “Is Economic Uncertainty Priced in the Cross-Section of Stock Returns Journal of Financial Economics 126(3) 2017 471-489.
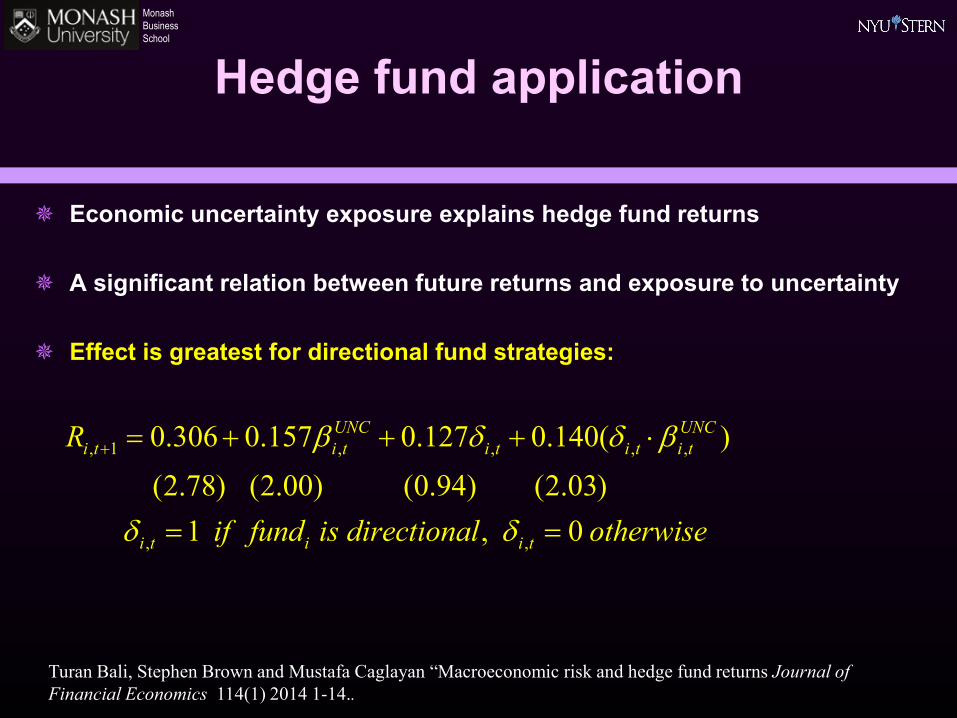
Turan Bali, Stephen Brown and Mustafa Caglayan “Macroeconomic risk and hedge fund returns Journal of Financial Economics 114(1) 2014 1-14..
MonashBusinessSchool
Conclusion
Uncertainty is both measurable and material Is distinct from market volatility Is associated with a negative premium in stock returns
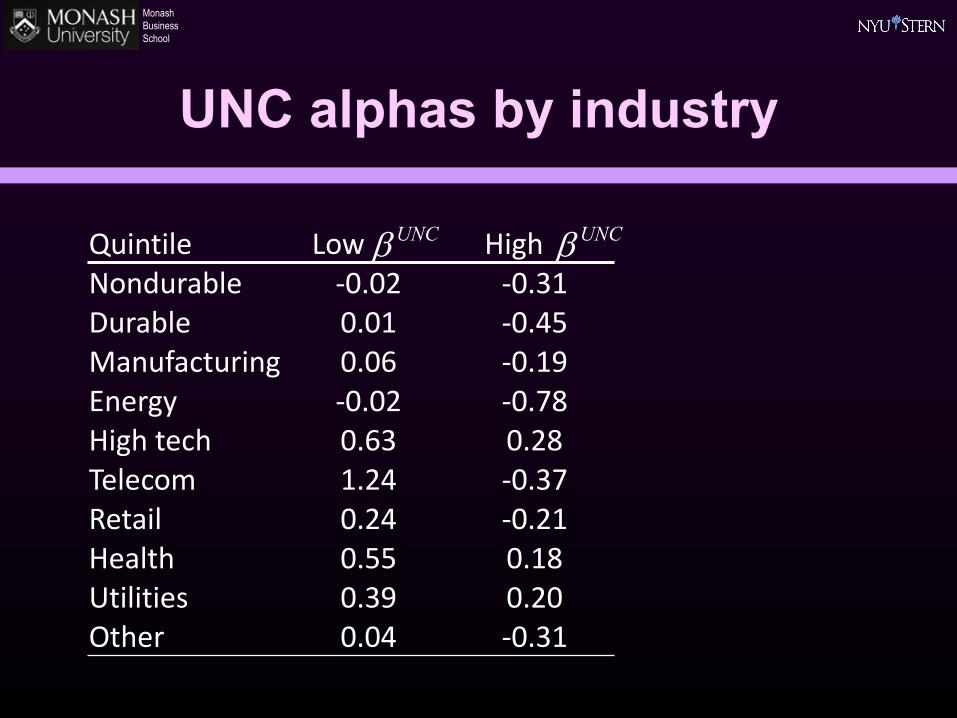
Stocks differ in their sensitivity to this factor Systematic differences in sensitivity by industry
Uncertainty affects consumption and investment Increased uncertainty => unfavorable investment opportunities Uncertainty premium is higher in times of economic distress


![Uncertainty,FinancialFrictions,andIrreversibleInvestmentpeople.bu.edu/sgilchri/research/GSZ_uncertainty_22Mar2013.pdfEisfeldt and Rampini [2006] and Jurado, Ludvigson, and Ng [2013]).](https://static.documents.pub/doc/80x56/5f16f850aef1385ba01eedeb/uncertaintyfinancialfrictionsandirrevers-eisfeldt-and-rampini-2006-and-jurado.jpg)