Is Kindergarten the New First Grade?The Changing Nature of Kindergarten in the
Age of AccountabilityDaphna Bassok1 and Anna Rorem1
1University of Virginia
Updated January 2014
EdPolicyWorks University of Virginia
PO Box 400879 Charlottesville, VA 22904
EdPolicyWorks working papers are available for comment and discussion only. They have not been peer-reviewed. Do not cite or quote without author permission. Working paper retrieved from:
http://curry.virginia.edu/uploads/resourceLibrary/20_Bassok_Is_Kindergarten_The_New_First_Grade.pdf Acknowledgements: : This research was supported by a 2011 grant from the American Educational Research Association which receives funds for its “AERA Grants Program” from the National Science Foundation under NSF Grant #DRL-0941014. Opinions reflect those of the authors and do not necessarily reflect those of the granting agencies. The authors thank Mimi Engel, William Gormley, Jason Grissom, Sara Rimm-Kaufman, and Susanna Loeb for helpful feedback as well as seminar participants when this work was presented previously at: • Vanderbilt University• University of Virginia
EdPolicyWorks Working Paper Series No. 20. January 2014.Available at http://curry.virginia.edu/edpolicyworks/wp
Curry School of Education | Frank Batten School of Leadership and Public Policy | University of Virginia
Recent accounts suggest that accountability pressures have trickled down into the early elementary grades, and that kindergarten today is characterized by a heightened focus on academic skills. This paper documents substan-tial changes in kindergarten classrooms between 1998 and 2006, using two large nationally-representative data-sets. Nearly all measures examined changed substantially over this period, and always in the direction consistent with a heightened academic focus. While in 1998, 31 percent of kindergarten teachers indicated that most chil-dren should learn to read in kindergarten, in 2006 65 percent of teachers agreed with this statement. Time on literacy rose by 25 percent from roughly 5.5 to 7 hours per week and exposure to social studies, science, music, art and physical education all dropped.
• The Society for Research in Child Development Annual Conference (April 2013)• The Association for Education Finance and Policy Annual Conference (March 2013) • The Association for Public Policy Analysis & Management (November 2012)
Bassok – Is Kindergarten The New First Grade
EdPolicyWorks Working Paper Series No. 20. January 2014.
Available at http://curry.virginia.edu/edpolicyworks/wp Curry School of Education | Frank Batten School of Leadership and Public Policy | University of Virginia
1
IS KINDERGARTEN THE NEW FIRST GRADE? THE CHANGING NATURE OF KINDERGARTEN IN THE
AGE OF ACCOUNTABILITY
Daphna Bassok & Anne Rorem
In 2009, the Alliance for Childhood released a report entitled “Crisis in the Kindergarten:
Why Children Need to Play in School” (Miller & Almon, 2009). The report warned that
kindergarten in the United States has radically changed over the past two decades, and that
“developmentally appropriate learning practices” centered on play, exploration and social
interactions have been replaced with highly-prescriptive curricula, test preparation and an explicit
focus on academic skill-building. It then cautioned that these trends have serious implications for
children’s development and called for a “reversal of the pushing down of the curriculum that has
transformed kindergarten into de facto first grade” (Miller & Almon, 2009, p. 63).
Over the past ten years, major news outlets have run stories with titles such as “Kindergarten
Cram,” “The New First Grade: Too Much Too Soon” “More Work, Less Play in Kindergarten”
and “Kindergarten or `Kindergrind’?” (Gao, 2005; Orenstein, 2009; Stenson, 2010; Tyre, 2006;
Vise, 2007). These articles generally align with the crisis narrative, providing accounts of
kindergarten classrooms characterized by mounting homework demands, worksheets, pressure to
learn to read as early as possible, and heightened levels of stress.
Despite these headlines, there is very little empirical evidence about whether kindergarten
classrooms have actually changed over time. This is, however, an important question as in addition
to the lore around the changing nature of kindergarten, a large body of research suggests that there
are meaningful, long-term implications to the way early childhood classrooms are structured and
taught (Chetty et al., 2011; Claessens, Engel, & Curran, 2013; Pianta, La Paro, Payne, Cox, &
Bradley, 2002). This paper aims to fill this gap, describing changes in public school kindergarten
classrooms over time using two large nationally-representative datasets. We focus on four key
dimensions of the kindergarten experience: (1) teachers’ beliefs about school readiness and
kindergarten learning; (2) time allocated to core subjects; (3) curricular coverage and; (4) assessment
practices. We then document systematic changes in kindergarten classrooms between 1998 and
2006, and assess the extent to which kindergarten classrooms in 2006 resemble first grade classrooms in
the late nineties.
Bassok – Is Kindergarten The New First Grade
EdPolicyWorks Working Paper Series No. 20. January 2014.
Available at http://curry.virginia.edu/edpolicyworks/wp Curry School of Education | Frank Batten School of Leadership and Public Policy | University of Virginia
2
The national datasets we leverage straddle the introduction of the Federal No Child Left
Behind Act (NCLB) signed in 2002 and therefore allow us to describe changes in kindergarten
practices during a period characterized both by heightened accountability pressure and by increased
investment in early childhood education (Hustedt, Friedman, & Barnett, 2012; Reardon, 2011). Our
results indicate substantial changes in the kindergarten experience along nearly every dimension we
explore. First, teachers’ expectations for kindergarteners have escalated rapidly. For instance, over
this time period the percentage of teachers who indicated that incoming kindergarteners need to know
most of their letters or count to twenty doubled. Similarly, while in 1998 under a third of
kindergarten teachers agreed that children should learn to read in kindergarten, by 2006 this
percentage more than doubled to 65 percent.
In addition, we find that time spent on reading and language arts rose by about 25 percent
from roughly 5.5 to 7 hours per week. This change is likely driven in part by a substantial
increase over this same period in children attending full-day kindergarten, from about 56 to 75
percent (Flanagan & McPhee, 2009; Walston & West, 2004). However, despite this increase in
the overall time kindergartens are spending in school, we find no change in time spent on
mathematics instruction and actually document significant drops in time spent on social studies,
science, music, art and physical education instruction. We discuss the factors that likely contributed
to these substantial changes, as well as their implications for public policy and learning.
Kindergarten Classrooms and Early Learning
A large body of evidence demonstrates that children’s early childhood learning
environments have large impacts on both short and longer-term life outcomes (Barnett, 1995;
Chetty et al., 2011). It is less clear precisely how classrooms serving young children should be
organized (e.g., what material should be covered and how) in order to yield the greatest learning
gains. In particular, there is substantial and longstanding debate among parents, educators,
researchers and policy makers about the potential benefits and risks of orienting early childhood
learning experiences more squarely towards academic content (Duncan, 2011; Elkind & Whitehurst,
2001; Zigler & Bishop-Josef, 2006; Zigler, 1987).
One major concern is that a focus on academic content will crowd out other important
types of learning experiences that help develop social and regulation skills or foster physical and
mental health, each of which are predictors of children’s longer term outcomes (Datar & Sturm,
Bassok – Is Kindergarten The New First Grade
EdPolicyWorks Working Paper Series No. 20. January 2014.
Available at http://curry.virginia.edu/edpolicyworks/wp Curry School of Education | Frank Batten School of Leadership and Public Policy | University of Virginia
3
2004; Raver & Knitzer, 2002; Shonkoff & Phillips, 2000; Stipek, 2006). This concern is particularly
salient in recent discussions of the Common Core Standards, which provide detailed academic
content standards for all grades including kindergarten. For instance, Robert Pianta, Dean of the
Curry School of Education at the University of Virginia warned that, “we have to be careful that
those standards, particularly as they extend downward, appropriately recognize these important
social, communication, and self-regulation skills that are really as critical for kids' learning in
those early and later years as whether they know the alphabet" (Zubrzycki, 2011).
Another distinct but related issue raised by some educators and psychologists is that
developmentally, many kindergarten-aged children may not be ready for highly academic content or
very structured learning experiences (Copple & Bredekamp, 2009). In the late eighties, the National
Association for the Education of Young Children (NAEYC), a professional and accreditation
organization for early childhood programs, expressed concern over the perceived mounting
academic demands in early childhood classrooms and called for more child-oriented, play and
discovery-based instruction. They released an influential handbook of guidelines for
“Developmentally Appropriate Practices” (DAP) a term defined as “an approach to teaching
grounded in the research on how young children develop and learn and in what is known about
effective early education” (Bredekamp, 1987). The guidebook has undergone revisions twice since
its initial publication reflecting, in part, that over the past two decades our understanding of young
children’s development has improved rapidly, as has our knowledge around processes that support
early learning.
Researchers have examined the impacts of many aspects of early childhood classrooms
including play-based curriculum, didactic versus more child-oriented teaching practices, half versus
full-day kindergarten and high-stakes testing, among others (Gersten, 1988; Gibbs, 2012; Marcon,
1993; Meyer, 1984; Phillips & Stipek, 1993; Schultz & Kagan, 2007). A number of studies have
suggested that academic, didactic or “developmentally inappropriate” kindergarten experiences are
Stipek, Feiler, Daniels, & Milburn, 1995). Stipek (2006), for example, suggests that a heightened
focus on academics may be stressful for children and negatively impact their motivation, self-
confidence and attitudes towards school.
On the other hand, there is also evidence that exposure to academic content in
kindergarten (and particularly to advanced content) can be beneficial for student learning
Bassok – Is Kindergarten The New First Grade
EdPolicyWorks Working Paper Series No. 20. January 2014.
Available at http://curry.virginia.edu/edpolicyworks/wp Curry School of Education | Frank Batten School of Leadership and Public Policy | University of Virginia
4
(Claessens et al., 2013). Magnuson, Ruhm & Waldfogel (2007) show that more academically-
oriented early elementary experiences can help children who did not attend preschool catch up
with their peers. A number of recent papers show that children’s academic skills at school
entry—particularly their math skills—are the strongest predictors of their later performance on a
number of cognitive and non-cognitive outcomes (Claessens, Duncan, & Engel, 2009; Claessens
& Engel, 2013; Duncan et al., 2007). The authors interpret these findings as suggestive evidence
that early childhood interventions that focus on academic skill building might be particularly
effective in improving children’s long-term learning outcomes, especially for low-income
children.
The Changing Nature of Kindergarten
Historical accounts of kindergarten education make it clear that the acute tensions between
the academic and more broad developmental goals of kindergarten are not new (Dombkowski,
2001; Russell, 2011). Cuban (1992) details the ebbs and flows of these two competing foci for
kindergarten over more than a century. That said, there is a growing impression among
practitioners, researchers and the media that in the past two decades preschool and kindergarten
classrooms have rapidly become more academically-oriented and that this change is explained, at
least in part, by heightened accountability pressures due to NCLB (Goldstein, 2007; Graue, 2009;
Pianta, Cox, & Snow, 2007; Stipek, 2006). While NCLB does not require testing for children
before the third grade, it is argued that the intensive pressures that principals and teachers feel
about their students’ performance on high-stakes assessments have led to an “accountability
shovedown” and the “educationalization of early care and education” (Hatch, 2002; Kagan &
Kauerz, 2007)
Large-scale empirical evidence about the changing nature of kindergarten over the past two
decades is lacking, as is research causally linking heightened accountability pressure and changes to
the early childhood curriculum. Miller & Almon (2009) describe findings from a survey of
approximately 250 kindergarten teachers in Los Angeles and New York City, which shows that
teachers feel lack of time, curricular demands, and limited support from principals lead them to
focus primarily on literacy and mathematics skill-building rather than play. Russell (2007) uses
information about the strength of states’ accountability systems in the pre-NCLB period and finds
some evidence that teachers in states with more binding early accountability systems report more
Bassok – Is Kindergarten The New First Grade
EdPolicyWorks Working Paper Series No. 20. January 2014.
Available at http://curry.virginia.edu/edpolicyworks/wp Curry School of Education | Frank Batten School of Leadership and Public Policy | University of Virginia
5
time spent on literacy skills. While the results of these two studies are intriguing, both make use of
a single cross-section of data making any discussion of changes in the academic nature of
kindergarten in recent years impossible.
Empirical evidence about the impacts of NCLB or accountability pressures more broadly
on the experiences of students and teachers working in the untested early grades has also been
limited. Jacob (2005) finds some evidence that high-stakes accountability leads children in early,
untested grades to be “preemptively retained” so that they will not be included in standardized test
scores. Similarly, in her case study of a Texas elementary school, Booher-Jennings (2005) describes
the intense pressure teachers in the untested early grades (K-2) felt to prepare their students for
third grade assessments. In this school, recess was reduced to 15 minutes per week, despite the
concerns of early childhood teachers in the school. In a recent study, Grissom, Kalogrides & Loeb
(2014), show that low-performing teachers in high-stakes grades are disproportionately reassigned
to untested early elementary classrooms, and demonstrate that these transfers of ineffective
teachers into the early grades negatively impact those children’s learning. Taken together, these
findings are consistent with the notion of a “trickling down” of accountability pressures leading to
changes in the kindergarten classroom.
Other societal shifts over the same period may have also contributed to a heightened focus
on more advanced or academic content. There have been substantial increases in both public and
private investments in early childhood education. Between 1990 and 2011, the number of 3-5 year
olds enrolled in public preschool programs more than doubled from 1.2 to 2.9 million children
(Current Population Survey, 2011). Further, a number of scholarly and popular accounts have
documented increases in parental investments in their young children’s learning as well as
heightened pressure among some parents to give young children an academic edge (Bassok &
Reardon, 2013; Otterman, 2009; Ramey & Ramey, 2010; Reardon, 2011). Given these trends, it is
also plausible that incoming kindergarteners are now entering school with more exposure to
academic skills than they once were and that, in part, this is driving kindergarten teachers to change
their practices.
The Current Study
The existing research demonstrates the link between early childhood learning and later life
outcomes, and suggests that the content and organization of early childhood classrooms
Bassok – Is Kindergarten The New First Grade
EdPolicyWorks Working Paper Series No. 20. January 2014.
Available at http://curry.virginia.edu/edpolicyworks/wp Curry School of Education | Frank Batten School of Leadership and Public Policy | University of Virginia
6
meaningfully impacts young children’s learning. While it is commonly noted that kindergarten
classrooms have changed rapidly over the past decades, there is little empirical evidence of exactly
how much and along what dimensions classrooms have changed over time. The current study fills
these gaps, leveraging rich, nationally representative datasets to provide the first detailed account of
the changing kindergarten experience. We focus on changes over a relatively short period of time,
but also a period characterized by heightened accountability as well as increased investment in early
childhood education. We address three descriptive research questions:
1. To what extent and along what dimensions has the kindergarten experience changed
between 1998 and 2006?
2. To what extent did kindergarten classrooms in 2006 resemble first grade classrooms in
the late nineties?
3. Are changes in the kindergarten experience over this period systematically different
in schools serving high proportions of non-white students or high proportions of students
eligible for FRPL?
We hypothesize that due to heightened accountability pressure, kindergarten classrooms in
2006 will be more academically oriented than in 1998. We expect to see increases in time spent on
literacy and math, the subjects tested on high-stakes exams. We also anticipate drops in other topics
such as art, music and physical education due to crowding out from time spent on tested academic
subjects. However, our expectations are somewhat ambiguous, since the increase in enrollment in
full day kindergarten may have led to more time spent across all subject areas.
Relatedly, we expect to see heightened expectations for incoming kindergarteners, more
advanced curriculum presented and, in general, a kindergarten experience that is more similar to first
grade in the late nineties than it is to kindergarten during that period. Because schools and teachers
serving high-proportions of low-income and non-white students are more likely to find the high-
stakes associated with accountability binding, we posit that changes will be particularly pronounced
in those settings.
Method
Data
This study leverages data from the birth and kindergarten cohorts of the Early Childhood
Longitudinal Study (ECLS-B and ECLS-K), each of which include a detailed kindergarten teacher
Bassok – Is Kindergarten The New First Grade
EdPolicyWorks Working Paper Series No. 20. January 2014.
Available at http://curry.virginia.edu/edpolicyworks/wp Curry School of Education | Frank Batten School of Leadership and Public Policy | University of Virginia
7
survey and therefore allow for a rich account of changes between 1998 and 2006 in public school
kindergarten teachers’ beliefs about school readiness and kindergarten learning as well as their time
use, curricular focus, and assessment practices.
The ECLS-K tracks a nationally representative sample of over 20,000 children who were
kindergarteners in the fall of 1998 from school entry through the eighth grade. The study employs a
multistage probability sample design with children selected within schools, which were first selected
from groups of counties. All kindergarten teachers in the sampled schools completed a detailed
questionnaire about their classroom practices, irrespective of whether or not they taught one of the
sampled children. This design yielded a sample of approximately 2,800 public-school kindergarten
teachers and provides a representative sample of all kindergarten teachers in the United States in
1998. In 1999, when most ECLS-K children proceeded to the first grade, their first grade teachers
were surveyed as well. We leverage the responses from nearly 3,500 first grade teachers to assess the
extent to which kindergarten in 2006 mirrored first grade in 1999.
Whereas the ECLS-K tracks a grade cohort of kindergarteners, the ECLS-B follows a
nationally-representative age cohort of infants from their birth in 2001 until they enter kindergarten.
Due to states’ birthday cut-offs for kindergarten entry as well as parents’ decisions to delay
kindergarten, not all children in the dataset begin formal schooling at the same time (Bassok &
Reardon, 2013). About 75 percent of ECLS-B children entered kindergarten in the fall of 2006, and
the remaining children begin the following year (fall, 2007). In the year that a child began
kindergarten, his teacher was asked to complete a detailed survey. We combine the teacher survey
data from both years (2006 and 2007) to construct a “simulated” kindergarten cohort comprised of
more than 4,000 public-school kindergarten teachers which we refer to as the 2006 cohort of
teachers. 1
Measures
A large portion of the teacher survey items are identical across the ECLS-B and ECLS-K
teacher surveys, making comparisons across the two datasets straight-forward. 2,3
Rather than focusing on a single, narrow measure of increased academic focus, we take advantage of
the detailed nature of the teacher surveys to consider a broad set of teacher-reported outcomes
which we group into four categories, described in some detail below. These categories are: school
Bassok – Is Kindergarten The New First Grade
EdPolicyWorks Working Paper Series No. 20. January 2014.
Available at http://curry.virginia.edu/edpolicyworks/wp Curry School of Education | Frank Batten School of Leadership and Public Policy | University of Virginia
8
readiness beliefs and kindergarten expectations, time use, curricular content and assessment
practices.
School readiness beliefs & kindergarten expectations. Teachers were asked to assess the
extent to which they agree with a number of statements regarding “school readiness” and
kindergarten learning expectations. We report the percentage of teachers who either “agree” or
“strongly agree” with the following four statements:
a. Attending preschool (for example, nursery school, prekindergarten, or Head Start) is very important for
success in kindergarten.
b. Children who begin formal reading and math instruction in preschool will do better in elementary school.
c. Parents should make sure their children know the alphabet before they start kindergarten.
d. Most children should learn to read in kindergarten.
These items were chosen to track the extent to which kindergarten teachers support early
introduction to academic content.
We also track teachers’ responses to a series of 13 items asking them to assess how
important they believe certain characteristics are for a child’s school readiness (e.g., counting to 20,
sitting still, and being sensitive to other children’s feelings.) We group these into pre-academic skills,
regulation skills, and other skills, and report the percentage of teachers who deem these skills either
“very important” or “essential.”
Time use. Teachers were asked to report the amount of time, measured in both days per
week and hours per day, they devote to various subjects. We combine these responses to construct
variables measuring the number of minutes per week devoted to four subject areas: (1) reading and
language arts (ELA); (2) mathematics; (3) social studies and science; and (4) music and art. 4,5
Survey items specifically indicate that time spent on activities that fall into multiple categories can be
counted towards all relevant categories. For instance, an activity that combines reading and social
studies should be reported under both topics. This is important because it implies that increases in
one category do not necessarily imply drops in another and that if, for example, literacy lessons are
infused throughout the curriculum, it would not necessarily lead to a drop in the reporting of other
topics.
In addition to these subject-specific time-use measures, we also consider three measures of
exposure to physical education (PE). The first two are the percentage of kindergarten teachers who
Bassok – Is Kindergarten The New First Grade
EdPolicyWorks Working Paper Series No. 20. January 2014.
Available at http://curry.virginia.edu/edpolicyworks/wp Curry School of Education | Frank Batten School of Leadership and Public Policy | University of Virginia
9
report their students typically participate in PE daily and the percentage who indicates their students
never have exposure to PE. Among those teachers who report their students had at least some
exposure to PE, we also look at the percentage who indicates the typical PE session was longer than
15 minutes.
Our final set of time-use measures relate to instructional approach. Specifically, we report
the percentage of teachers who indicate that on a typical day their students spend about an hour or
more on “child-selected activities” and the percentage who indicates they spend three hours or more
on “teacher-directed whole class activities.”
Curricular coverage. In addition to items about aggregated time use, teachers were also
asked to describe how often they do specific ELA and mathematics activities. In each subject, the
skills range from fairly simple (e.g., alphabet and letter recognition) to complex (e.g., composing and
writing stories with an understandable beginning, middle and end). We report the percentage of
teachers who indicated doing particular skills daily, at least once a week, and never. An advantageous
feature of the ECLS-K survey for the purpose of this study is that in 1998 teachers could specify
that an activity never happened because it is “taught at a higher grade level.” This allows us to
describe the extent to which skills that were considered outside the scope of kindergarten by a
substantial portion of kindergarten teachers in 1998 are reported as commonplace by kindergarten
teachers in 2006.
The survey also asked teachers to indicate whether a number of science and social studies
are taught in their kindergarten classroom (e.g., human body, dinosaurs and fossils, important figures
in American history, etc.).6 We examine whether there was a change in the likelihood these topics
were covered during the kindergarten year.
Assessment practices. Our final set of outcome measures relates to the use of assessment
practices. We consider three items. The first asks teachers about their evaluation practices and how
important they consider an “individual child’s achievement relative to local, state, or professional
standards.” We look at the percentage of teachers who indicate this measure is “very” or
“extremely” important. Teachers are then asked whether they have the same evaluation practices
for all children in their class. Specifically, teachers are asked whether they: (1) “hold the same
standards for all children”, (2) “hold the same standards for most children but make exceptions for
children with special needs (for example, children with disabilities, children with limited English
proficiency)”, or (3) “hold different standards for different children based on what I think they are
Bassok – Is Kindergarten The New First Grade
EdPolicyWorks Working Paper Series No. 20. January 2014.
Available at http://curry.virginia.edu/edpolicyworks/wp Curry School of Education | Frank Batten School of Leadership and Public Policy | University of Virginia
10
capable of.” Accountability, state standards, and similar expectations for all children (and
subgroups), were all hallmarks for the NCLB Act. Therefore, if accountability pressures have
trickled down into untested grades, we would expect an increase in the percentage of teachers who
view standards to be very important and an increase in the percentage of teachers reporting holding
the same standards for all children.
In 2006, kindergarten teachers were asked how often they use various tools to assess their
students. Unfortunately, no comparable items exist in the ECLS-K kindergarten survey. However,
in 1999, when the ECLS-K children entered first grade, their first grade teachers were asked identical
questions about assessment practices. We compare the frequency with which kindergarten teachers
in 2006 use state or local standardized tests to assess their students, to the accounts provided by first
grade teachers in 1999.
School and Teacher Characteristics. Our third research question examines whether
changes over time in kindergarten practices differed depending on schools’ demographic
composition, and we focus in particular on schools with high percentages of students eligible for
free or reduced priced lunch (FRPL) and schools serving high percentages of non-white students.
The restricted access versions of the ECLS-B and ECLS-K allow researchers to match each teacher
to detailed information about their schools by linking the datasets to the National Center for
Education Statistics Common Core of Data Public School Universe surveys (CCD), which contain
information about all NCES-registered public schools in the United States.7 We construct indicators
to designate schools in the top quartile with respect to the percentage of children eligible for FRPL
as well as the top quartile with respect to the percentage of non-white children.
In our regression analyses we control for a number of school and teacher characteristics that
may be associated both with the schools’ demographic composition as well as with teachers’ beliefs,
time-use, and practices. In particular, our models control for school size, urbanicity and region. We
also control for whether or not the school offers a preschool program, as schools that provide early
childhood education programs may have systematically different approaches to their kindergarten
curriculum.
The models also include covariates available directly through the ECLS datasets. Most
importantly, we account for whether the teacher works in a half or full-day kindergarten classroom.
This is a critical covariate because time-use variables differ significantly across these settings and
because there has been a substantial shift towards full-day programs over the period examined. To
Bassok – Is Kindergarten The New First Grade
EdPolicyWorks Working Paper Series No. 20. January 2014.
Available at http://curry.virginia.edu/edpolicyworks/wp Curry School of Education | Frank Batten School of Leadership and Public Policy | University of Virginia
11
ensure a consistent definition of full-day care across waves, we constructed an indicator set to one if
the class met for more than 4.5 hours per day.8 Finally, we control for the experience level of the
teacher, defined as an indicator set to one if the teacher is in her first three years of teaching.
Analytic Plan
Our paper addresses three overarching research questions: To what extent and along what
dimensions has the kindergarten experience changed between 1998 and 2006?; To what extent did
kindergarten classrooms in 2006 resemble first grade classrooms in the late nineties? and; Are changes
in the kindergarten experience over this period systematically different in schools serving high
proportions of non-white students or high proportions of students eligible for FRPL?
To address the first question we present descriptive statistics highlighting how kindergarten
teachers’ descriptions of their classrooms have changed over a roughly eight year period. While the
two datasets leveraged in the current study do not track the same teachers or schools, and therefore
do not allow us to assess whether individual teachers changed their own practices or beliefs over this
time period, we are able to describe the extent to which two kindergarten teaching cohorts resemble
one another.9 We use a similar descriptive approach to address our second research question which
aims to directly explore the question raised in the paper’s title: “Is kindergarten the new first grade?”
Here we compare the responses of kindergarten teachers in 2006 to those given by first grade
teachers in 1999.
Over the time period considered there was also a substantial shift towards full-day
kindergarten. This shift is relevant for our analysis because any changes we observe in our outcome
variables, particularly our measures of time spent on particular subjects, may, in part, be driven by
the shift towards full day programs. In other words, students may spend more time on reading
because they spend more time in school. To address this we run our analyses separately for full and
half day programs.
In a final set of analyses we investigate the relationship between kindergarten teachers’
beliefs and practices and the demographic composition of the school where they teach. To do this
where our outcome (K_Practice) is one of ten measures of the kindergarten experience ranging from
teachers’ beliefs about school readiness to their focus on assessment. K2006 is an indicator variable
Bassok – Is Kindergarten The New First Grade
EdPolicyWorks Working Paper Series No. 20. January 2014.
Available at http://curry.virginia.edu/edpolicyworks/wp Curry School of Education | Frank Batten School of Leadership and Public Policy | University of Virginia
12
set to one if the responding teacher is part of the 2006 sample (ECLS-B) and zero if they are from
the 1998 sample (ECLS-K). 𝐹𝑅𝑃𝐿 is another dichotomous variable indicating whether the school
where the teacher works is in the 25th percentile with respect to free and reduced price lunch (FRPL)
eligibility. The coefficient 𝛽3 measures the strength of the interaction between these two
dichotomous variables. In other words, if 𝛽3 is positive and significant, our results suggest that the
changes in K_Practice between 1998 and 2006 were more pronounced in schools serving high
percentages of children eligible for FRPL. School is a set of school-level covariates as discussed
above. 𝛽0 is a constant term and 𝜀 us a stochastic error term. We also run identical models, but
replace FRPL with an indicator set to one for schools in the top quartile with respect to percentage
of non-white students.
Results
Differences in Kindergarten 1998-2006
Nearly all outcomes we examined changed substantially over the study period and our findings are
consistent with a narrative of heightened focus on academic instruction, and particularly literacy,
during the kindergarten year. Below we describe the trends for our four sets of outcomes.
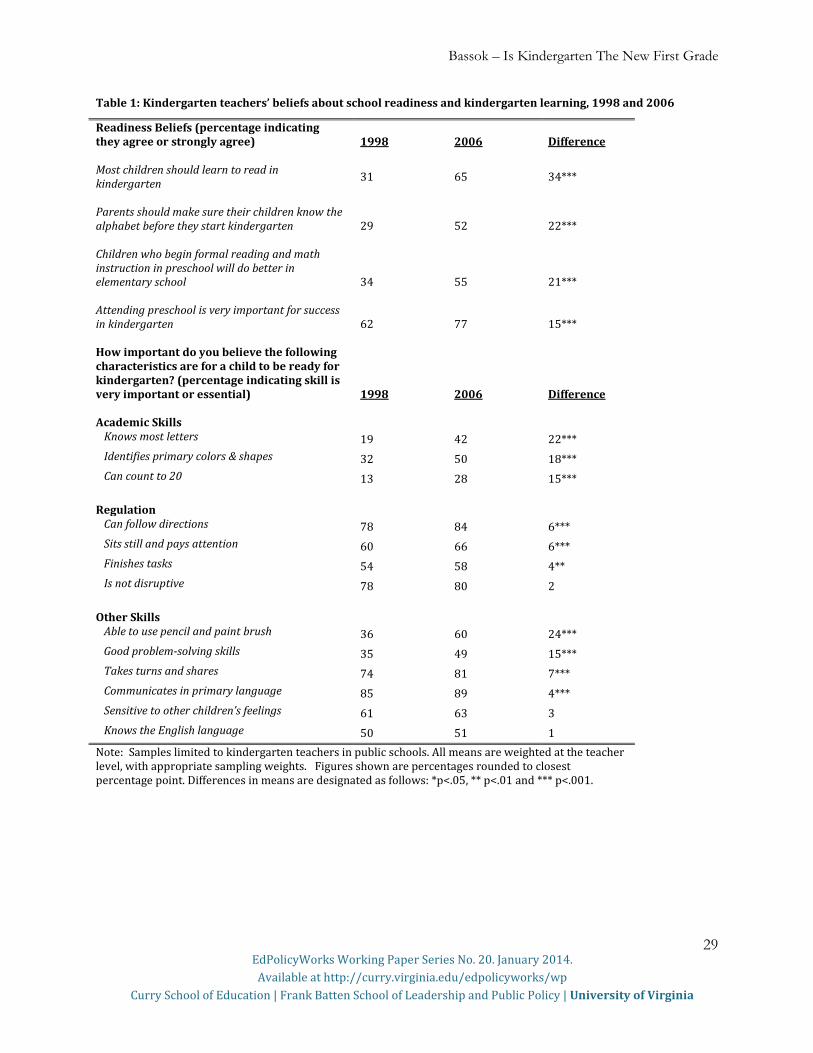
Teacher beliefs. The top panel of Table 1 shows the percentage of teachers who “agree” or
“strongly agree” with a set of statements about school readiness and kindergarten learning.
Strikingly, the percentage of teachers who believe “most children should learn to read in
kindergarten” has more than doubled over the time period from 31 to 65 percent. We also see
substantial increases (between 15 and 22 percentage points) in the percentage of teachers who think
“parents should make sure their children know the alphabet before they start kindergarten” and that
“children who begin formal reading and math instruction before kindergarten will do better in
elementary school.” These patterns suggest that in 2006 public-school kindergarten teachers believe
that children should be introduced to academic content earlier than they did in 1998.
The bottom panel of the table shows the percentage of teachers that believe a diverse set of
skills and characteristics are either “very important” or “essential” for school readiness. The first
thing to note is that in 2006 teachers rated all of the 13 characteristics—both academic and non-
academic—as more important than did kindergarten teachers in 1998. We categorized three items
(knowing letters, identifying colors and shapes, and counting to 20) as pre-academic skills and found
substantial increases on these measures. For instance, while 19 percent of teachers reported that
Bassok – Is Kindergarten The New First Grade
EdPolicyWorks Working Paper Series No. 20. January 2014.
Available at http://curry.virginia.edu/edpolicyworks/wp Curry School of Education | Frank Batten School of Leadership and Public Policy | University of Virginia
13
knowing the alphabet was very important or essential in 1998, in 2006 42 percent did so. The
percentage who indicated color and shape identification was important rose by 18 percentage points
and there was a 15 percentage point increase in teachers rating counting skills as important. We see
much smaller increases in the percentage of teachers who rate regulation skills (e.g., following
directions, sitting still, finishing tasks, etc.) in this way.
Again, these trends are consistent with a pattern of heightened emphasis on early academic
skills. However, it is worth noting that in both periods the three academic skill items were among
the lowest ranked skills. In other words, while the percentage of teachers that believe that the
academic characteristics are important has grown rapidly, far out-pacing changes on other school
readiness dimensions, teachers were still much more likely to identify regulation ability and social
skills (for instance the ability to communicate, not disrupt, and share) as most critical at school entry.
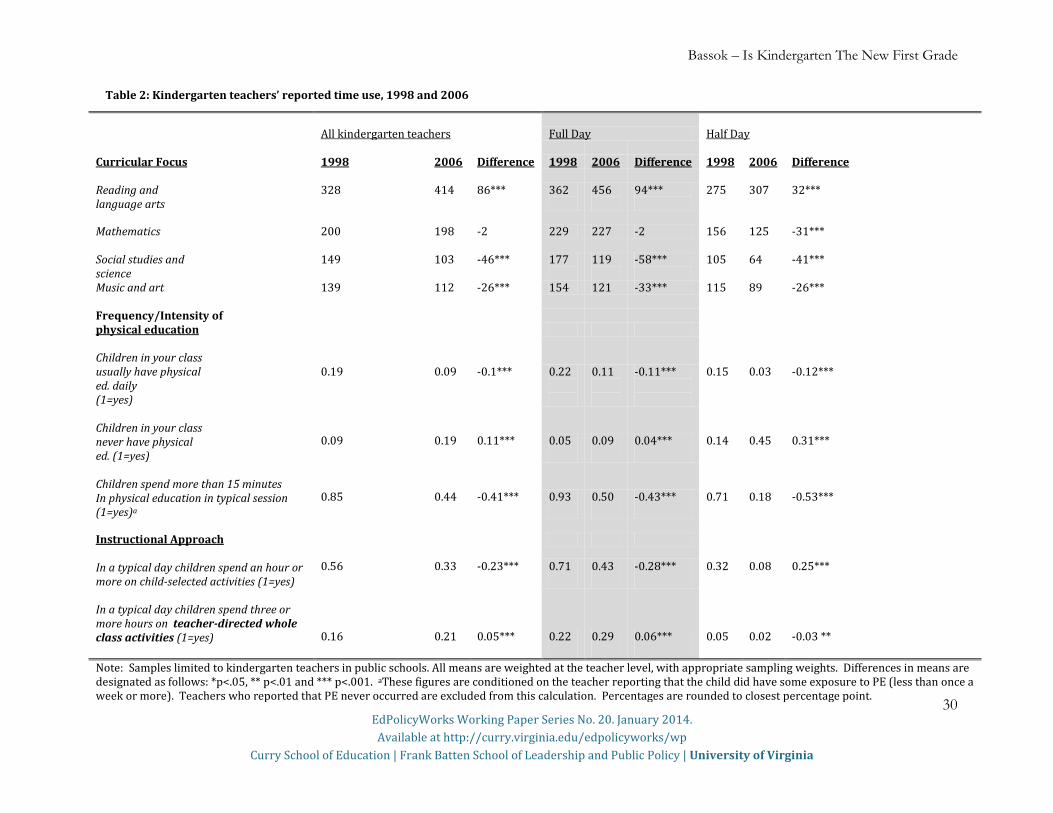
Time use. While we posit teachers’ beliefs about school readiness are related to their
approaches to teaching, their self-reported measures of time use are more likely to capture children’s
day-to-day classroom experiences. Table 2 presents average time spent on academic as well as non-
academic subjects, and also shows time spent on child-selected activities and teacher-directed whole
class instruction. The upper left-hand portion of the table shows the amount of time teachers
reported they spent on ELA, mathematics, social studies and science, and music and art. In 1998,
teachers reported spending about 328 minutes per week, or just over an hour a day, on reading and
language arts. In 2006 this figure rose by about 25 percent to 414 minutes per week (or about 17
additional minutes per day). In contrast, teachers reported almost exactly the same time allocated to
mathematics across the two waves of data.
Time spent on all other subjects dropped. On average, teachers reported spending 46
minutes per week less on social studies and science in 2006 than they did in 1998, dropping by
approximately 30 percent from 149 to 103. Time devoted to music and art also dropped by about
30 minutes per week. Taken together, these teacher reports show that kindergarteners in 2006 spent
as much time on reading and language arts as they did on mathematics, science, social studies, music
and art combined. In considering the implications of these drops, it is worth emphasizing again that
the wording of the teacher surveys did not require teachers to classify their time as either one subject
or another. A lesson that combined literacy and science, for example, could be counted towards both
categories. Therefore, the drop observed in these subjects is unlikely to be driven by teachers simply
re-classifying activities they once considered science or social studies activities as literacy.
Bassok – Is Kindergarten The New First Grade
EdPolicyWorks Working Paper Series No. 20. January 2014.
Available at http://curry.virginia.edu/edpolicyworks/wp Curry School of Education | Frank Batten School of Leadership and Public Policy | University of Virginia
14
Further, our results are not entirely driven by the shift towards full day kindergarten over the
time period we study. We know that between 1998 and 2006 there was a substantial increase in full
rather than half-day enrollment in kindergarten from 56 to 75 percent (Flanagan & McPhee, 2009;
Walston & West, 2004). We therefore disaggregate our time use analysis by length of day, noting
that children enrolled in full day kindergarten spent significantly more time on all the subjects we
consider. The second and third panels of Table 2 show that the pattern of results seen in the full
sample is also present in the half and full day subsamples. In both settings we see substantial
increases in ELA and drops in time spent on social studies, science, music and art. Moreover, while
for the full sample we did not observe an overall change in time spent on mathematics, in half-day
programs we actually find a drop of 31 minutes (or about a 20 percent drop) off the baseline of 156
minutes.
Items assessing time spent on physical education (PE) are asked slightly differently, and we
present those separately. About 19 percent of kindergarten teachers in 1998 reported that their
students usually have PE daily. By 2006, this percentage dropped in half to roughly nine percent.
Conversely, the percentage of teachers reporting their kindergarteners never have PE more than
doubled from 9 percent to 19 percent. A separate item asks teachers who indicated their students
had at least some exposure to PE to report the number of minutes of PE kindergarteners experience
in a typical session. In 1998, 85 percent of kindergarten teachers reported that the typical PE
session was longer than 15 minutes. By 2006, this figure fell sharply to 44 percent.
The drop in both frequency of PE sessions and time spent per session is particularly striking
in light of the fact that many more children are attending full-day kindergarten. Again, the second
and third panels of Table 2 demonstrate that both full and half-day programs saw substantial drops
in PE. The drops for half day programs are particularly large. In 2006, only 3 percent of
kindergarten teachers in half day programs reported that their students had PE daily, and the
percentage who reported their students never had PE tripled from 14 to 45 percent. Of those half-
day teachers who reported at least some exposure to PE, the percentage who reported the typical
session was more than 15 minutes long dropped drastically from 71 to 18 percent. These results are
conditioned on teachers reporting that their students ever experience PE (teachers who reported never
having PE are excluded from these percentages). Therefore, the figures actually overstate the overall
percentage of children who have PE sessions longer than 15 minutes.
Bassok – Is Kindergarten The New First Grade
EdPolicyWorks Working Paper Series No. 20. January 2014.
Available at http://curry.virginia.edu/edpolicyworks/wp Curry School of Education | Frank Batten School of Leadership and Public Policy | University of Virginia
15
The final rows of Table 2 show changes in instructional approach. In 1998, 56 percent of
kindergarten teachers reported that children in their class typically spend more than an hour a day on
child-selected activities. By 2006, this figure dropped to 33 percent. There was also a 5 percentage
point increase in teachers reporting that children typically spend three or more hours on teacher-
directed whole group instruction. Again, the drop in child-selected activities is somewhat surprising,
as we might expect that the shift towards full-day kindergarten would allow for more time on all
instructional approaches. Our results actually show that in full day kindergartens, the percentage of
classrooms with long blocks of teacher-directed instruction increased (from 22 to 29 percent) while
the percentage with daily exposure to more than an hour of child-directed activities fell significantly
(from 71 to 43 percent).
Curricular coverage. In addition to reporting the overall amount of time they devote to
language arts and mathematics, teachers were asked to report the amount of time they devote to
specific curricular content. Table 3 shows teachers’ responses about ELA and Table 4 shows
responses for mathematics. Teachers were asked to provide their best estimate of how often they
do 15 ELA skills considering the school year as a whole. The percentage of teachers reporting they
teach a particular skill daily went up for all 15 of the items considered. For instance, the percentage
of teachers who worked with children daily on “rhyming words and word families” rose from 25 to
36 percent. Daily lessons on following multi-step directions rose from 61 to 73 percent.
In 1998, respondents could indicate that a particular topic was never taught because it was
introduced at a later grade. We designate topics that at least 15 percent of teachers indicated were
not taught until a later grade as “advanced.” There are four ELA skills that were categorized this
way: vocabulary, composing and writing complete sentences, conventional spelling and composing
and writing stories with an understandable beginning, middle and end. In 2006, teaching each of
these skills is much more commonplace. For instance, while in 1998 45 percent of teachers
indicated they never taught conventional spelling in kindergarten, in 2006 this figure dropped to 13
percent. The percentage who indicated they taught conventional spelling daily doubled from 18 to
36 percent, and three quarters of teachers reported teaching conventional spelling at least once a
week.
Teachers’ reported time-use on mathematics content also suggests an increase in the time
spent on skills that were previously deemed too advanced for kindergarten. For instance, while in
1998 60 percent of kindergarten teachers reported they did not teach students to write “math
Bassok – Is Kindergarten The New First Grade
EdPolicyWorks Working Paper Series No. 20. January 2014.
Available at http://curry.virginia.edu/edpolicyworks/wp Curry School of Education | Frank Batten School of Leadership and Public Policy | University of Virginia
16
equations to solve word problems” this figure dropped to 38 percent in 2006, and the percentage
that said they taught this topic at least weekly rose from 15 to 22. Similarly, 61 percent of ECLS-K
teachers reported that they did not teach children how to estimate probability and this figure fell to
28 percent among ECLS-B teachers. That said, the patterns in math seem less consistent and
smaller in magnitude than those reported for ELA. For example, there was a modest drop in the
percentage of teachers reporting doing some math skills daily (i.e. counting beyond 100, adding
single-digit numbers and reading three-digit numbers).
The ECLS-B did not include items comparably assessing days per week spent on specific
science and social studies activities. However, in the first three columns of Table 5 we compare the
percentage of teachers reporting they cover a number of science and social studies topics in the
current school year. We observe a significant drop in all but 2 of the 15 science topics included in
the survey. The percentage of teachers who report teaching about ecology, dinosaurs, sound, light,
tools, the social system and machines each dropped by over 20 percentage points. Similarly, we
observe significant drops in all seven of the social studies topics included, though the drop in social
studies coverage is smaller in magnitude. For instance, we see an 18 percentage point drop in
geography and a 14 percentage point drop in lessons about different cultures.
Assessment. Finally, in the top panel of Table 6 we show how kindergarten teachers’ views
about assessment have changed over time. Here too we observe substantial changes. The
percentage of teachers that indicated they consider an individual child’s achievement relative to local,
state, or professional standards “very important” or “essential” rose from 57 to 76 percent. In 1998,
most teachers (57 percent) indicated they held the same standards for most children but made some exceptions.
The size of this group did not change across the study period. However, while 17 percent of
teachers in the earlier period indicated they held the same standards for all of their students, this
figure rose to 26 percent in 2006. Conversely the percentage that indicated they held different
standards for children based on what they think they are capable of fell from 26 to 16.
Kindergarten as the New First Grade?
Our descriptive analysis thus far demonstrates substantial changes over the eight year period
examined across all four sets of outcomes considered. Kindergarten teachers in 2006 held higher
expectations for their students, they spent more time on ELA, and many of the skills they reported
teaching on a daily or weekly basis, had been designated as too advanced for kindergarteners in the
Bassok – Is Kindergarten The New First Grade
EdPolicyWorks Working Paper Series No. 20. January 2014.
Available at http://curry.virginia.edu/edpolicyworks/wp Curry School of Education | Frank Batten School of Leadership and Public Policy | University of Virginia
17
previous period. In this section we explore the question raised by the paper’s title, assessing the
extent to which kindergarten in 2006 mirrored first grade classrooms in 1999.
Figure 1 shows the amount of time spent on ELA, math, social studies and science, and art
and music for three groups of teachers: kindergarten teachers in 1998, kindergarten teachers in 2006
and first grade teachers in 1999. For each subject we examine whether the middle bar, which
represents kindergarten teachers’ responses in the more recent period, is more similar to the
responses of kindergarten or first grade teachers from the late nineties. We first note that during the
earlier period, first grade teachers reported spending significantly more time than kindergarten
teachers on all academic topics (ELA, math, and social studies and science), but somewhat less time
than kindergarten teachers on art and music.
In some ways, kindergarten classrooms in 2006 do, in fact, look more like first grade
classrooms in the late nineties than they do kindergarten classrooms. Specifically, the increase in
time spent on ELA as well as the drop in time spent on art and music, are more aligned with the
time-use patterns reported by first grade teachers, and these patterns remain even if we limit our
analysis to full-day kindergarten classrooms (not shown).
Notably, however, the drop in time spent on social studies and science does not mirror the
responses given by first grade teachers. In other words, the amount of time spent in kindergarten
on social studies and science in 2006 is significantly lower than what was spent on these topics in the
late nineties by either kindergarten or first grade teachers. As demonstrated in the final two columns
of Table 5, the drop in science and social studies topical coverage (e.g., dinosaurs, solar systems, or
geography) also does not align with the “kindergarten as the new first grade” narrative, as first grade
teachers’ responses to these items were far more similar to those given by kindergarten teachers in
1998 than they were to kindergarten teachers in 2006.
This pattern is echoed in Figure 2 which shows the percentages of teachers who reported
their students did not have regular exposure to physical education. Here too, we see that the
doubling in the percentage of teachers reporting no regular PE time actually represents a shift away
from both kindergarten and first grade classroom norms in the late nineties. Only 2 percent of first
grade teachers reported their students had no regular exposure to PE, compared to 9 percent of
kindergarten teachers in 1998 and 19 percent of kindergarten teachers in 2006.
Finally, the bottom panel of Table 6 compares the frequency of standardized testing
reported by kindergarten teachers in 2006 and first grade teachers in 1999.10 We find that in 2006 a
Bassok – Is Kindergarten The New First Grade
EdPolicyWorks Working Paper Series No. 20. January 2014.
Available at http://curry.virginia.edu/edpolicyworks/wp Curry School of Education | Frank Batten School of Leadership and Public Policy | University of Virginia
18
quarter of kindergarten teachers report using state or local standardized tests once a month or more.
In comparison, only 11 percent of first grade teachers in 1999 reported using standardized tests this
frequently.
Taken together, the results suggest that characterizing kindergarten in 2006 as “the new first
grade” does not accurately capture the full scope of the changes to the kindergarten classroom. We
find that kindergarten classrooms in 2006 had much less exposure to PE and social studies and
science than did first grade classrooms in 1999, and kindergarten teachers were conducting far more
standardized testing than were first grade teachers in the earlier period.
Differences in Kindergarten across Schools
In the final results section we examine whether the changes documented thus far were more
pronounced in particular school settings, focusing in particular on schools serving high proportions
of students eligible for free or reduced-price lunch (FRPL) and schools serving high proportions of
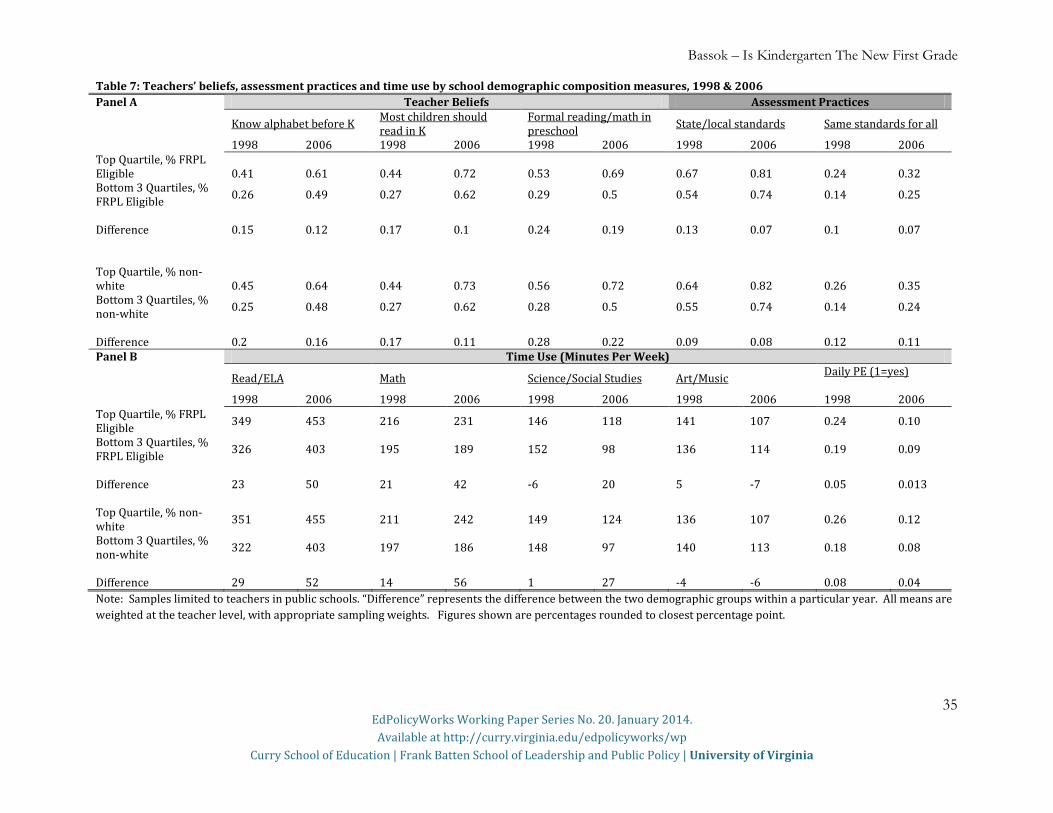
non-white students. Table 7 presents the unadjusted means for ten key outcome measures in 1998
and 2006, disaggregated by schools’ demographic composition. The top panel presents results about
teacher beliefs and accountability practices. The first thing to note is that in 1998, teachers working
in schools serving high percentages of students eligible for FRPL or high percentages of non-White
students report much higher expectations around academic skills, and are more likely to be focused
on standards and accountability than are other schools. For instance, in 1998, 41 percent of teachers
in schools with the highest proportions of students eligible for FRPL reported that children should
know the alphabet before entering kindergarten and 44 percent indicated children should learn to
read in kindergarten. This is in contrast to 26 and 27 percent of teachers in schools with lower
percentages of students eligible for FRPL.
By 2006, teachers working in schools serving high percentages of students eligible for FRPL
or high percentages of non-White students were still more likely to hold higher expectations around
academic skills and to be more focused on standards and accountability. However, the gap between
these schools and comparison schools actually narrowed somewhat. In other words, while both
groups experienced large increases in focus on academics and accountability, the changes were
somewhat more pronounced in the schools that were not serving the highest proportions of non-
white children or children eligible for FRPL.
Bassok – Is Kindergarten The New First Grade
EdPolicyWorks Working Paper Series No. 20. January 2014.
Available at http://curry.virginia.edu/edpolicyworks/wp Curry School of Education | Frank Batten School of Leadership and Public Policy | University of Virginia
19
The bottom panel of Table 7 shows the disaggregated results for time use. Again, we see
that in 1998, teachers working in schools serving high percentages of students eligible for FRPL or
high percentages of non-White students reported spending more minutes per week on ELA and
math than their counterparts in other schools. For instance, teachers working in schools in the top
quartile with respect to students eligible for FRPL spent about 20 minutes per week more on both
ELA and math. Whereas the top panel of Table 7 suggested some narrowing of gaps between 1998
and 2006, gaps in time spent on academics increased. On average, both groups increased time spent
on ELA. However, in schools in the top quartile with respect to FRPL eligibility the increase was
substantially larger. We find that while in schools serving the highest proportions of non-white
students time spent on math increased by roughly a half an hour a week, in other schools time spent
on math actually dropped slightly.
In Table 8 we present results from multivariate models exploring whether these patterns
persist after controlling for a host of school and teacher characteristics. We present results from
regression models predicting the same 10 outcomes based on an indicator for the schools
demographic make-up, an indicator for the ECLS-B (2006) wave and an interaction term between
the ECLS-B indicator and demographic control. All models also include the full set of school and
teacher controls (e.g., preschool availability, teacher experience, full day schedule, etc.). In the top
panel of Table 8, the constant term represents the adjusted mean value of each outcome variable in
1998, for schools that are not in the top quartile with respect to serving students eligible for FRPL.
The “High FRPL eligibility” coefficient measures the extent to which schools with high proportions
of FRPL differed on the outcome variable in 1998. The coefficient on “2006” describes the average
change in the outcome variable for the higher SES schools, and the interaction term measures
whether the magnitude of the changes differed at schools serving the most students eligible for
FRPL.
Our results suggest that while the number of minutes per week spent on reading and
language arts increased in all schools, in schools serving the most students eligible for FRPL time
devoted to this subject increased by about 18 minutes more per week. The results also suggest these
schools saw a larger drop in time spent on PE and time spent on Art and Music, although the latter
is not statistically significant. Notably, for all other outcomes, the coefficient on the interaction term
has the opposite sign relative to the main “2006” coefficient, though in most cases these coefficients
are not statistically significant. In other words, the results suggest that many of the changes
Bassok – Is Kindergarten The New First Grade
EdPolicyWorks Working Paper Series No. 20. January 2014.
Available at http://curry.virginia.edu/edpolicyworks/wp Curry School of Education | Frank Batten School of Leadership and Public Policy | University of Virginia
20
described in the paper were less pronounced in low-SES schools relative to other schools. Given that
these schools were more likely to report higher levels of these measures in 1998, the multivariate
results again provide suggestive evidence of some narrowing in the gap between low and higher-SES
schools with respect to academic expectations and focus on accountability.
The results in the lower panel of Table 8, which look at differential change patterns for
schools serving high percentages of non-white students, largely echo these patterns. Here too we
observe that high-minority schools experienced a larger increase in time spent on reading than did
other schools. Further, in these schools we also see a significant increase in time spent on math. This
is in contrast to schools with lower percentages of non-white students where we actually observe a
significant decline in time spent on math.
Discussion
Our study is the first to document striking increases along a large number of teacher-
reported measures of “academicization” in kindergarten. As hypothesized, we find strong evidence
that, relative to their counterparts in 1998, kindergarten teachers in 2006 are far more likely to
believe that academic instruction in literacy and mathematics should begin in the preschool and
kindergarten years. They are also much more likely to expect children to enter kindergarten already
knowing their letters, numbers, and colors. They expect children will leave their classrooms knowing
to read.
We had hypothesized an increase in time spent on both literacy and mathematics, because
these are the subjects included in the high-stakes accountability programs that were introduced over
the study period. Indeed, teacher-reported time use suggests a substantial (25 percent) increase in the
amount of time allocated towards reading instruction. We also observe a marked increase in
curricular coverage of ELA subjects that in 1998 were considered outside the scope of kindergarten.
Surprisingly, however, we do not observe a similar increase in time spent on math instruction. On
average, time allocated to math has stayed relatively stable, and it actually drops somewhat in half
day programs, and in schools serving fewer nonwhite students. This finding is troubling given the
growing research documenting the importance of early childhood math knowledge(Claessens &
Engel, 2013; Duncan et al., 2007).
Consistent with our hypotheses that a heightened focus on tested academics may crowd out
other types of learning experiences, we find that time spent on subjects that are not tested as part of
Bassok – Is Kindergarten The New First Grade
EdPolicyWorks Working Paper Series No. 20. January 2014.
Available at http://curry.virginia.edu/edpolicyworks/wp Curry School of Education | Frank Batten School of Leadership and Public Policy | University of Virginia
21
NCLB (social studies, science, music, art and particularly P.E.) has dropped. These results are
striking given that overall, the percentage of children enrolled in full rather than half day
kindergarten programs increased substantially over this period. In addition, we see an increase in the
percentage of teachers that find state and local standards very or extremely important in assessing
their students and in the percentage of teachers that report holding the exact same standards for all
of their students.
Our paper set out to explore whether the popular characterization of kindergarten as “the
new first grade” was apt. Our results clearly demonstrate that today’s kindergarten classrooms focus
on more advanced academic content, are more literacy-focused, and rely more heavily on teacher-
directed whole group instruction. However, the changes we document in our study represent
something other than a wholesale shifting of the first grade curriculum down by a year. In many
ways, kindergarten in 2006 looks quite distinct from both kindergarten and first grade classrooms in
the late nineties. For instance, kindergarteners in the later period are exposed to much less PE,
science and social studies and much more standardized testing. These trends may be problematic,
given studies documenting the beneficial impacts of PE for young children, and the challenges of
appropriately using standardized testing with young children (Cawley, Frisvold, & Meyerhoefer,
The overall effect of these changes for young children is an important open question. Critics
of academically-focused kindergarten caution that focusing heavily on academic content is not
“developmentally appropriate.” They worry that not only will such focus fail to achieve the desired
effect of improved academic outcomes, but may actually negatively impact young children’s
development. Nobel laureate, James Heckman, argues that our focus on cognitive and academic
skill-building in early childhood programs in misplaced, and that the long term benefits of early
childhood interventions are driven through their impact on non-cognitive social and behavioral skill-
building (Heckman, Krueger, & Friedman, 2004).
At the same time, recent research suggests that academic content, particularly advanced
content, can improve the learning trajectories of young children (Claessens et al., 2013; Duncan,
2011). This work suggests that early childhood programs with a focus on these types of skills may
actually have uniquely strong long-term impacts, particularly for low-income children who have less
exposure at home to literacy and math topics.
Bassok – Is Kindergarten The New First Grade
EdPolicyWorks Working Paper Series No. 20. January 2014.
Available at http://curry.virginia.edu/edpolicyworks/wp Curry School of Education | Frank Batten School of Leadership and Public Policy | University of Virginia
22
It is important to point out, as do the researchers embedded in these debates, that teaching
academic content need not be at odds with “play” and other types of pedagogical approaches
considered developmentally appropriate in early childhood. While the data provided by the ECLS
surveys allows for two unusually detailed snapshots of kindergarten in the United States, the data are
not “fine-grained” enough to assess to what extent the heightened focus on literacy is happening in a
way that is engaging and enriching to young children. Further research is needed to understand how
much the large changes documented in this study impacted children’s development of both
cognitive and non-cognitive skills, to understand the mechanisms for those changes and to explore
their effects on achievement gaps at kindergarten entry.
1 Due to the differences in study design, the ECLS-K provides a nationally representative sample of kindergarten teachers in 1998, whereas the ECLS-B provides a nationally representative sample of the kindergarten teachers who taught children born in 2001. 2 Although many variables align perfectly across datasets, some items differed slightly with respect to response options. In such cases we recoded variables, often losing some specificity, but gaining the ability to make comparisons over time. For instance, in the ECLS-B survey teachers were often asked to write in the number of minutes they spent on specific subjects per day (e.g., 39 minutes). In contrast, in the ECLS-K teachers were asked to select from an existing set of time ranges (e.g., 31-60 minutes). We recoded the hand-entered minutes into the same time groupings to achieve consistency across data sets. 3Another difference between the datasets worth highlighting is that the ECLS-K survey is somewhat longer and was administered as two components, with the first administered in the fall and the second in the spring. In contrast, in the ECLS-B the full survey was given to teachers in the fall of the school year. It is possible that the same kindergarten teachers would provide different responses, particularly about time-use, depending on when in the school year they were surveyed. Such a difference might bias our estimates of change over time. We hypothesize that the focus on academic components of kindergarten increases throughout the school year. If this is the case, then the difference in timing across the surveys may lead us to underestimate the extent to which kindergarten has become increasingly academic over time. 4 Although both surveys ask teachers about recess and free play, the items do not align in a way that allows comparisons over time. 5 To combine these variables we assign each teacher the midpoint of the range she reported. For instance, if a response indicates that science was taught 1-2 times per week, 61-90 minutes per day, then the number of minutes per week for science was given as 1.5*75 or 112 minutes. We also examine how sensitive our time use results are to alternative coding schemes, and find no meaningful differences. 6 Although the ECLS-K data asks teachers to specify how often they cover each of these topics, in the ECLS-B teachers are only asked whether they will cover them at all. 7 Unfortunately, ECLS-K observations do not include NCES ID numbers for the first year of data collection, though subsequent years (e.g., the first grade wave)did include this identifier. Despite this data limitation, we were able to match the vast majority of kindergarten teachers to CCD data.
Bassok – Is Kindergarten The New First Grade
EdPolicyWorks Working Paper Series No. 20. January 2014.
Available at http://curry.virginia.edu/edpolicyworks/wp Curry School of Education | Frank Batten School of Leadership and Public Policy | University of Virginia
23
8 Our constructed indicator is highly correlated with non-missing responses to an item explicitly asking teachers whether they teach in a full or half day program. 9 We use sampling weights throughout our analysis. For the ECLS-B data we use the sampling weight (WK45T0) which is designed specifically to examine teacher responses from the combined kindergarten entry data. 10 Recall that kindergarten teachers in 1998 were not asked this question.
Bibliography
Barnett, W. S. (1995). Long-term effects of early childhood programs on cognitive and school
outcomes. The Future of Children, 5(3), 25–50.
Bassok, D., & Reardon, S. F. (2013). “Academic Redshirting” in Kindergarten Prevalence, Patterns,
and Implications. Educational Evaluation and Policy Analysis, 35(3), 283–297.
Booher-Jennings, J. (2005). Below the bubble:“Educational triage” and the Texas Accountability
System. American Educational Research Journal, 42(2), 231–268.
Bredekamp, S. (1987). Developmentally appropriate practice in early childhood programs serving children from
birth through age 8. National Association for the Education of Young Children Washington,
DC. Retrieved from http://www.getcited.org/pub/102643389
Cawley, J., Frisvold, D., & Meyerhoefer, C. (2013). The impact of physical education on obesity
among elementary school children. Journal of Health Economics, 32(4), 743–755.
Chetty, R., Friedman, J. N., Hilger, N., Saez, E., Schanzenbach, D. W., & Yagan, D. (2011). How
Does Your Kindergarten Classroom Affect Your Earnings? Evidence from Project Star. The
Quarterly Journal of Economics, 126(4), 1593–1660.
Claessens, A., Duncan, G. J., & Engel, M. (2009). Kindergarten skills and fifth-grade achievement:
Evidence from the ECLS-K. Economics of Education Review, 28(4), 415–427.
Claessens, A., & Engel, M. (2013). How important is where you start? Early mathematics knowledge
and later school success. Teachers College Record, 115, 1–29.
Claessens, A., Engel, M., & Curran, F. C. (2013). Academic Content, Student Learning, and the
Persistence of Preschool Effects. American Educational Research Journal, Forthcoming., 1–32.
Copple, C., & Bredekamp, S. (2009). Developmentally Appropriate Practice in Early Childhood Programs
Serving Children from Birth through Age 8. Third Edition. National Association for the Education
of Young Children.
Bassok – Is Kindergarten The New First Grade
EdPolicyWorks Working Paper Series No. 20. January 2014.
Available at http://curry.virginia.edu/edpolicyworks/wp Curry School of Education | Frank Batten School of Leadership and Public Policy | University of Virginia
24
Cuban, L. (1992). Why some reforms last: The case of the kindergarten. American Journal of Education,
100(2), 166–194.
Current Population Survey. (2011). School Enrollment of the Population 3 Years Old and Over, by
Level and Control of School, Race, and Hispanic Origin 1995 to 2011. United States Census
Bureau.
Datar, A., & Sturm, R. (2004). Physical Education in Elementary School and Body Mass Index:
Evidence from the Early Childhood Longitudinal Study. American Journal of Public Health,
94(9), 1501–1506. doi:10.2105/AJPH.94.9.1501
Dombkowski, K. (2001). Will the real kindergarten please stand up?: defining and redefining the
twentieth-century US kindergarten. History of Education, 30(6), 527–545.
doi:10.1080/00467600110064762
Duncan, G. J. (2011). The Importance of Kindergarten-Entry Academic Skills. In E. F. Zigler, W. S.
Gilliam, & W. S. Barnett (Eds.), The Pre-K Debates: Current Controversies and Issues. Baltimore,
MD: Brookes Publishing Co.
Duncan, G. J., Dowsett, C. J., Claessens, A., Magnuson, K., Huston, A. C., Klebanov, P., … Brooks-
Gunn, J. (2007). School readiness and later achievement. Developmental Psychology, 43(6), 1428–
1446.
Elkind, D., & Whitehurst, G. (2001). Young Einsteins : Should Head Start emphasize academic
skills? EducationNext, 1(2). Retrieved from http://educationnext.org/young-einsteins/
Flanagan, K. D., & McPhee, C. (2009). The children born in 2001 at kindergarten entry: First
findings from the kindergarten data collections of the Early Childhood Longitudinal Study,
Birth Cohort (ECLS-B)(NCES 2010-005). Washington, DC: US Department of Education,
NCES.
Gao, H. (2005, April 11). Kindergarten or `kindergrind’? School getting tougher for kids. Union-
Tribune San Diego. Retrieved from http://legacy.utsandiego.com/news/education/20050411-
9999-1n11kinder.html
Gersten, R. (1988). Effectiveness of a Direct Instruction Academic Kindergarten for Low-Income
Students. Elementary School Journal, 89(2), 227–40.
Gibbs, C. R. (2012). Experimental and quasi-experimental evidence on the impact of full-day kindergarten. The
University of Chicago. Retrieved from http://gradworks.umi.com/35/17/3517151.html
Bassok – Is Kindergarten The New First Grade
EdPolicyWorks Working Paper Series No. 20. January 2014.
Available at http://curry.virginia.edu/edpolicyworks/wp Curry School of Education | Frank Batten School of Leadership and Public Policy | University of Virginia
25
Goldstein, L. S. (2007). Beyond the DAP versus standards dilemma: Examining the unforgiving
complexity of kindergarten teaching in the United States. Early Childhood Research Quarterly,
22(1), 39–54.
Graue, E. (2009). Reimagining Kindergarten: Restoring a Developmental Approach when
Accountability Demands Are Pushing Formal Instruction on the Youngest Learners. School
Administrator, 66(10), 10–15.
Grissom, J., Kalogrides, D., & Susanna, L. (2014). Strategic staffing: How accountability pressures
affect the distribution of teachers within schools and resulting student achievement.
Vanderbilt University Working Paper.
Hatch, J. A. (2002). Accountability shovedown: Resisting the standards movement in early
Heckman, J. J. J., Krueger, A. B., & Friedman, B. M. (2004). Inequality in America. MIT Press
Cambridge, MA.
Huffman, L. R., & Speer, P. W. (2000). Academic performance among at-risk children: The role of
developmentally appropriate practices. Early Childhood Research Quarterly, 15(2), 167–184.
doi:10.1016/S0885-2006(00)00048-X
Hustedt, J. T., Friedman, A. H., & Barnett, W. S. (2012). Investments in Early Education: Resources
at the Federal and State Levels. In R. C. Pianta (Ed.), Handbook of Early Childhood Education (p.
48). New York, NY: The Guilford Press.
Jacob, B. A. (2005). Accountability, incentives and behavior: The impact of high-stakes testing in the
Chicago Public Schools. Journal of Public Economics, 89(5-6), 761–796.
Kagan, S. L., & Kauerz, K. (2007). Reaching for the whole: Integration and alignment in early
education policy.
Magnuson, K. A., Ruhm, C., & Waldfogel, J. (2007). The persistence of preschool effects: Do
subsequent classroom experiences matter? Early Childhood Research Quarterly, 22(1), 18–38.
Marcon, R. A. (1993). Socioemotional versus academic emphasis: Impact on kindergartners’
development and achievement. Early Child Development and Care, 96(1), 81–91.
doi:10.1080/0300443930960108
Marcon, R. A. (1999). Differential impact of preschool models on development and early learning of
inner-city children: A three-cohort study. Developmental Psychology, 35(2), 358–375.
Bassok – Is Kindergarten The New First Grade
EdPolicyWorks Working Paper Series No. 20. January 2014.
Available at http://curry.virginia.edu/edpolicyworks/wp Curry School of Education | Frank Batten School of Leadership and Public Policy | University of Virginia
26
Meyer, L. A. (1984). Long-term academic effects of the direct instruction Project Follow Through.
The Elementary School Journal, 84(4), 380–394.
Miller, E., & Almon, J. (2009). Crisis in the Kindergarten: Why Children Need to Play in School. Alliance for
Childhood.
Orenstein, P. (2009, April 29). Kindergarten Cram. New York Times. Retrieved from
Russell. (2011). From Child’s Garden to Academic Press: The Role of Shifting Institutional Logics in
Redefining Kindergarten Education. American Educational Research Journal.
doi:10.3102/0002831210372135
Russell, J. L. (2007). Not kid stuff anymore? Institutional change in kindergarten education. University of
California, Berkeley.
Bassok – Is Kindergarten The New First Grade
EdPolicyWorks Working Paper Series No. 20. January 2014.
Available at http://curry.virginia.edu/edpolicyworks/wp Curry School of Education | Frank Batten School of Leadership and Public Policy | University of Virginia
27
Schultz, T., & Kagan, S. L. (2007). Taking stock: Assessing and improving early childhood learning and
program quality. A report of the National Early Childhood Accountability Task Force. Washington,
D.C.: Pew Charitable Trusts.
Shepard, L. A. (1997). Children not ready to learn? The invalidity of school readiness testing.
Psychology in the Schools, 34(2), 85–97.
Shonkoff, J. P., & Phillips, D. (2000). From neurons to neighborhoods: The science of early childhood
development. Washington, DC: National Academy Press.
Stenson, J. (2010, July 30). Tutoring tots? Some kids prep for kindergarten. MSNBC. Retrieved
from http://www.nbcnews.com/id/32404017/ns/health-childrens_health/t/tutoring-tots-
some-kids-prep-kindergarten/#.Ut20RLROlpg
Stipek, D. (2006). No child left behind comes to preschool. The Elementary School Journal, 106(5), 455–
466.
Stipek, D., Feiler, R., Daniels, D., & Milburn, S. (1995). Effects of Different Instructional
Approaches on Young Children’s Achievement and Motivation. Child Development, 66(1),
209–223. doi:10.1111/j.1467-8624.1995.tb00866.x
Tyre, P. (2006, September 10). The New First Grade: Too Much Too Soon. Newsweek. Retrieved
from http://www.newsweek.com/new-first-grade-too-much-too-soon-109667
Vise, D. de. (2007, May 23). More Work, Less Play in Kindergarten. The Washington Post. Retrieved
Walston, J., & West, J. (2004). Full-Day and Half-Day Kindergarten in the United States: Findings
from the Early Childhood Longitudinal Study, Kindergarten Class of 1998-99. NCES 2004-
078. National Center for Education Statistics.
Zigler, E. F. (1987). Formal schooling for four-year-olds? No. American Psychologist, 42(3), 254–260.
doi:10.1037/0003-066X.42.3.254
Zigler, E. F., & Bishop-Josef, S. J. (2006). The cognitive child versus the whole child: Lessons from
40 years of Head Start. Play= Learning: How Play Motivates and Enhances Children’s Cognitive and
Social-Emotional Growth, 15–35.
Zubrzycki, J. (2011, December 7). Common Core Poses Challenges for Preschools. Education Week.
Retrieved from http://www.edweek.org/ew/articles/2011/12/07/13prek_ep.h31.html
Bassok – Is Kindergarten The New First Grade
EdPolicyWorks Working Paper Series No. 20. January 2014.
Available at http://curry.virginia.edu/edpolicyworks/wp Curry School of Education | Frank Batten School of Leadership and Public Policy | University of Virginia
28
Figure 1
Figure 2
328
414
449
200 198
273
148
103
173
139
11299
0
100
200
300
400
500
Min
utes
per
wee
k
ELA Math Soc/Sci Art/MusicKG.98 KG.06 GR1.99 KG.98 KG.06 GR1.99 KG.98 KG.06 GR1.99 KG.98 KG.06 GR1.99
Kindergarten 98 & 06, First Grade 1999Weekly Time Use by Subject
0.09
0.19
0.02
0.14
0.45
0.05
0.09
0
.1
.2
.3
.4
.5
Pro
porti
on o
f tea
cher
s
SamplesWhole Sample Half Day Full Day
Kindergarten 1998 & 2006 and First Grade 1999
Percentages of Teachers ReportingNo Regular Physical Education
KG.98KG.06GR1.99
Bassok – Is Kindergarten The New First Grade
EdPolicyWorks Working Paper Series No. 20. January 2014.
Available at http://curry.virginia.edu/edpolicyworks/wp Curry School of Education | Frank Batten School of Leadership and Public Policy | University of Virginia
29
Table 1: Kindergarten teachers’ beliefs about school readiness and kindergarten learning, 1998 and 2006
Readiness Beliefs (percentage indicating they agree or strongly agree)
1998
2006 Difference
Most children should learn to read in kindergarten
31 65 34***
Parents should make sure their children know the alphabet before they start kindergarten
29 52 22***
Children who begin formal reading and math instruction in preschool will do better in elementary school
34
55
21***
Attending preschool is very important for success in kindergarten
62
77
15***
How important do you believe the following characteristics are for a child to be ready for kindergarten? (percentage indicating skill is very important or essential)
1998
2006
Difference
Academic Skills
Knows most letters 19 42 22*** Identifies primary colors & shapes 32 50 18*** Can count to 20 13 28 15*** Regulation
Can follow directions 78 84 6*** Sits still and pays attention 60 66 6*** Finishes tasks 54 58 4** Is not disruptive 78 80 2 Other Skills
Able to use pencil and paint brush 36 60 24*** Good problem-solving skills 35 49 15*** Takes turns and shares 74 81 7*** Communicates in primary language 85 89 4*** Sensitive to other children’s feelings 61 63 3 Knows the English language 50 51 1 Note: Samples limited to kindergarten teachers in public schools. All means are weighted at the teacher level, with appropriate sampling weights. Figures shown are percentages rounded to closest percentage point. Differences in means are designated as follows: *p<.05, ** p<.01 and *** p<.001.
Bassok – Is Kindergarten The New First Grade
EdPolicyWorks Working Paper Series No. 20. January 2014.
Available at http://curry.virginia.edu/edpolicyworks/wp Curry School of Education | Frank Batten School of Leadership and Public Policy | University of Virginia
30
All kindergarten teachers Full Day Half Day Curricular Focus 1998 2006 Difference 1998 2006 Difference 1998 2006 Difference Reading and language arts
328
414
86***
362
456
94***
275
307
32***
Mathematics 200 198 -2 229 227 -2 156 125 -31*** Social studies and science
149
103
-46***
177
119
-58***
105
64
-41***
Music and art
139 112 -26*** 154 121 -33*** 115 89 -26***
Frequency/Intensity of physical education Children in your class usually have physical ed. daily (1=yes)
0.19
0.09
-0.1***
0.22
0.11
-0.11***
0.15
0.03
-0.12***
Children in your class never have physical ed. (1=yes)
Note: Samples limited to kindergarten teachers in public schools. All means are weighted at the teacher level, with appropriate sampling weights. Differences in means are designated as follows: *p<.05, ** p<.01 and *** p<.001. aThese figures are conditioned on the teacher reporting that the child did have some exposure to PE (less than once a week or more). Teachers who reported that PE never occurred are excluded from this calculation. Percentages are rounded to closest percentage point.
Table 2: Kindergarten teachers’ reported time use, 1998 and 2006
Bassok – Is Kindergarten The New First Grade
EdPolicyWorks Working Paper Series No. 20. January 2014.
Available at http://curry.virginia.edu/edpolicyworks/wp Curry School of Education | Frank Batten School of Leadership and Public Policy | University of Virginia
31
Table 3: Kindergarten ELA Content Coverage, 1998 and 2006
Taught daily Taught at least weekly Never taught Topic in ELA 1998 2006 Diff 1998 2006 Diff 1998 2006 Diff
Matching letters to sounds 84 91 7*** 99 100 0 0 0 0*** Conventions of print (left to right orientation, book holding) 75 81 7*** 95 98 2*** 1 0 -1 **
Alphabet and letter recognition 89 94 5*** 99 100 1 ** 1 0 -1 * Rhyming words and word families 25 36 11*** 87 96 8*** 1 0 -1*** Writing own name (first and last) 81 89 9*** 95 98 3*** 2 0 -2*** Making predictions based on text 40 45 5** 92 96 5*** 2 0 -1*** Communicating complete ideas orally 65 70 5*** 95 97 2 ** 2 0 -1*** Remembering and following directions that include a series of actions 61 73 12*** 93 97 4*** 2 0 -1***
Common prepositions such as over and under, up and down 20 21 1 65 79 14*** 8 1 -7***
Identifying the main idea and parts of a story 27 32 5*** 73 90 17*** 12 1 -11***
Using context clues for comprehension 34 40 6*** 80 93 13*** 12 1 -11***
Conventional spelling 18 36 18*** 44 75 32*** 45 13 -32*** Composing and writing stories with an understandable beginning, middle and end
6 12 5*** 24 46 22*** 53 23 -30***
Note: Samples limited to kindergarten teachers in public schools. All means are weighted at the teacher level, with appropriate sampling weights. Differences in means are designated as follows: *p<.05, ** p<.01 and *** p<.001. Figures shown are percentages rounded to closest percentage point.
Bassok – Is Kindergarten The New First Grade
EdPolicyWorks Working Paper Series No. 20. January 2014.
Available at http://curry.virginia.edu/edpolicyworks/wp Curry School of Education | Frank Batten School of Leadership and Public Policy | University of Virginia
32
Table 4: Kindergarten Mathematics Content Coverage, 1998 and 2006,
Taught daily Taught at least weekly Never taught Topic in Math 1998 2006 Diff 1998 2006 Diff 1998 2006 Diff Correspondence between number and quantity 45 61 16*** 94 98 4*** 1 0 -1*** Making, copying, or extending patterns 25 33 8*** 75 83 8*** 1 0 -1*** Writing all numbers between 1 and 10 32 35 3 85 92 7*** 2 0 -2*** Identifying relative quantity (e.g., equal, most, less, more) 23 28 5*** 78 82 4*** 2 0 -1*** Ordering objects by size or other properties 8 9 1 58 62 4** 2 0 -1*** Sorting objects into subgroups according to a rule 10 12 2* 63 72 8*** 3 1 -2*** Reading simple graphs 19 29 10*** 56 68 11*** 3 2 -1* Ordinal numbers (e.g., first, second, third) 24 28 5*** 59 66 7*** 3 2 -2*** Recognizing and naming geometric shapes 21 24 3* 69 74 5*** 4 0 -3*** Performing simple data collection and graphing 10 21 11*** 38 58 20*** 7 2 -5*** Adding single-digit numbers 18 15 -4** 67 56 -11*** 8 10 2 Counting by 2s, 5s, and 10s 30 38 9*** 70 80 9*** 10 4 -7*** Recognizing the value of coins and currency 14 19 5*** 46 51 5*** 10 8 -2* Reading two-digit numbers 46 58 12*** 79 85 6*** 10 4 -6*** Estimating quantities 6 8 1 37 42 4** 10 7 -2* Telling time 14 12 -2 43 40 -3* 17 12 -5*** Subtracting single-digit numbers 13 10 -3** 51 44 -7*** 18 18 0 Using measuring instruments accurately 3 3 0 20 24 4** 19 13 -6*** Counting beyond 100 21 15 -5*** 40 37 -2 36 28 -8*** Fractions (e.g., recognizing that ¼ of a circle is colored) 2 1 0 11 10 -1 43 37 -5** Writing all numbers between 1 and 100 5 7 2* 20 26 6*** 46 30 -16*** Place value 27 43 15*** 40 57 17*** 46 24 -21*** Reading three-digit numbers 19 12 -8*** 33 26 -7*** 51 41 -10*** Writing math equations to solve word problems 3 3 0 15 22 6*** 60 38 -22*** Estimating probability 2 3 1 9 21 12*** 61 28 -33*** Mixed operations (e.g., 4+3-2=5) 1 1 0 5 5 1 88 82 -6***
Note: Samples limited to kindergarten teachers in public schools. All means are weighted at the teacher level, with appropriate sampling weights. Differences in means are designated as follows: *p<.05, ** p<.01 and *** p<.001. Figures shown are percentages rounded to closest percentage point.
Bassok – Is Kindergarten The New First Grade
EdPolicyWorks Working Paper Series No. 20. January 2014.
Available at http://curry.virginia.edu/edpolicyworks/wp Curry School of Education | Frank Batten School of Leadership and Public Policy | University of Virginia
33
Table 5: Science and Social Studies Topics Covered, Kindergarten 1998 & 2006 and First Grade 1999
Ecology 77 34 -43*** 76 -42*** Dinosaurs and fossils 67 32 -34*** 59 -26*** Sound 65 31 -34*** 59 -28*** Light 60 31 -29*** 57 -26*** Tools and their uses 59 32 -27*** 54 -22*** Solar system and space 60 36 -24*** 60 -24*** Machines and motors 37 15 -22*** 42 -27*** Water 78 59 -19*** 77 -17*** Magnetism and electricity 55 37 -18*** 54 -17*** Scientific method 52 40 -12*** 67 -27*** Understand and measure temperature 67 57 -10*** 86 -30*** Health, safety, nutrition, and personal hygiene
99 93 -6*** 98 -5***
Plants and animals 99 95 -4*** 96 -1 Human body (e.g., senses, basic systems) 86 85 -1 75 10*** Weather(e.g., rainy, sunny) 99 98 0 97 2** Topics in Social Studies 1998 2006
Difference K06-K98 1st, 1999
Difference K06-1st_99
Geography 71 53 -18*** 83 -30*** Different cultures 92 78 -14*** 95 -18*** Important figures and events in American history
91 78 -13*** 92 -14***
Community resources (e.g., grocery store, police)
96
85
-12***
90 -6***
Map-reading skills 65
55
-11***
94 -39***
Reasons for rules, laws and government 79 70 -9*** 85 -15*** Social-problem solving 83 79 -4** 86 -7*** Note: Samples limited to teachers in public schools. Final columns refer to first grade teachers. All means are weighted at the teacher level, with appropriate sampling weights. Figures shown are percentages rounded to closest percentage point. Differences in means are designated as follows: *p<.05, ** p<.01 and *** p<.001.
Bassok – Is Kindergarten The New First Grade
EdPolicyWorks Working Paper Series No. 20. January 2014.
Available at http://curry.virginia.edu/edpolicyworks/wp Curry School of Education | Frank Batten School of Leadership and Public Policy | University of Virginia
34
Note: Samples limited to teachers in public schools. Bottom panel compares kindergarten teachers in 2006 (ECLS-B) to first grade teachers in 1999 (ECLS-K). All means are weighted at the teacher level, with appropriate sampling weights. Figures shown are percentages rounded to closest percentage point. Differences in means are designated as follows: *p<.05, ** p<.01 and *** p<.001.
Table 6: Teachers’ beliefs about assessment practices, Kindergarten 1998 & 2006 and First Grade 1999
Individual child’s achievement relative to local, state, or professional standards is very or extremely important
57 76 19***
Comparing Students I hold the same standards for most children, but I make exceptions for children with special needs
57 57 0
I hold different standards for different children based on what I think they are capable of
26 16 -10***
I hold the same standards for everyone in my class
17 26 10***
Panel B How often do you use state or local standardized tests to assess your children?
Kindergarten 2006
First Grade, 1999
Difference (K2006-Gr1_1999)
Never 28 31 -3***
Once or twice a year 47 58 -11***
Once or twice a month 20 8 12***
At least weekly 5 3 3***
Bassok – Is Kindergarten The New First Grade
EdPolicyWorks Working Paper Series No. 20. January 2014.
Available at http://curry.virginia.edu/edpolicyworks/wp Curry School of Education | Frank Batten School of Leadership and Public Policy | University of Virginia
35
Note: Samples limited to teachers in public schools. “Difference” represents the difference between the two demographic groups within a particular year. All means are weighted at the teacher level, with appropriate sampling weights. Figures shown are percentages rounded to closest percentage point.
Table 7: Teachers’ beliefs, assessment practices and time use by school demographic composition measures, 1998 & 2006 Panel A Teacher Beliefs Assessment Practices Know alphabet before K Most children should
read in K Formal reading/math in preschool State/local standards Same standards for all
Difference 0.2 0.16 0.17 0.11 0.28 0.22 0.09 0.08 0.12 0.11 Panel B Time Use (Minutes Per Week) Read/ELA Math Science/Social Studies Art/Music Daily PE (1=yes)
EdPolicyWorks Working Paper Series No. 20. January 2014.
Available at http://curry.virginia.edu/edpolicyworks/wp Curry School of Education | Frank Batten School of Leadership and Public Policy | University of Virginia
36
Table 8: OLS Models predicting changes in teachers’ beliefs, assessment practices and time use 1998-2006, by school demographic composition measures, School Readiness Time Use (minutes per week) Assessment Know
alphabet before K
Most children should read in K
Formal reading /math in preschool
Read/ELA
Math Science/ Social Studies
Art/Music PE Daily State/local standards
Same standards for all
Differential Changes by Percentage Eligible for FRPL