Is nuclear economical in comparison to renewables? Demet Suna a,c,n , Gustav Resch a,b a e-think, Energy Research, Argentinierstrasse 18/10, A-1040 Vienna, Austria b Vienna University of Technology, Energy Economics Group, Gusshausstrasse 25/370-3, A-1040 Vienna, Austria c AIT Austrian Institute of Technology, Energy Department, Giefinggasse 6, A-1210 Vienna, Austria HIGHLIGHTS State aids for new nuclear power is compared with incentives for renewables. Hinkley Point C in the UK is considered as example for new nuclear power. Comparison is conducted for the UK at a country level and for the EU 28 overall. Analysis shows that renewable energies are more economical than nuclear power. article info Article history: Received 18 February 2016 Received in revised form 18 July 2016 Accepted 21 August 2016 Keywords: Hinkley Point C Nuclear Renewables Modelling Effectiveness Economic efficiency abstract The European Union is divided on the issue of electricity production. While there is consensus that generation technologies need to be low on greenhouse gas emissions, the question of whether to use renewables or nuclear to meet this power demand is highly controversial. Both options still require financial support and this is not going to change in the near future. This raises the question of where public money should be invested in order to achieve greater economic efficiency: into support for re- newable energies (RE) or support for nuclear power plants? This paper sets out to answer this question. The detailed model-based prospective scenario assess- ment performed in this study provides the basis for estimating future cost developments. After dis- cussing the existing support schemes for renewables, the paper compares these with a nuclear model. The comparison is conducted exemplarily for the United Kingdom (UK) at a country level and for the EU 28 overall. The recent state aid case for the construction of the Hinkley Point nuclear power plant (NPP) in the UK serves as the model for the nuclear option. & 2016 Elsevier Ltd. All rights reserved. 1. Introduction In line with climate concerns, the European Commission (EC) has set short, mid and long-term targets to achieve a low carbon economy. In the long term the goal of the European Union (EU) is to cut its emissions substantially by 80–95% compared to 1990 levels (EC, 2015). The main binding target for 2030 is the reduction of EU domestic greenhouse gas (GHG) emissions by at least 40% below the 1990 level (EC, 2014a). Furthermore, EC says that to achieve these targets, renewables will play a key role and sets as target for an increase of the renewables share to at least 27% of the EU's energy consumption by 2030. Nevertheless, this target is binding at EU level and it has not been defined yet how the member states should contribute to that. Besides, the EC also leaves the individual member states free to use whatever tech- nology they prefer to achieve emission reductions in the longer term. When it comes to low-carbon electricity generation, renewable energy technologies and nuclear power plants are competing to design the future energy supply of EU member states. While Germany has decided to phase out nuclear power completely by the year 2022, many countries within the EU with existing nuclear power plants (NPPs) such as France, UK, Romania, Slovakia and Bulgaria (WNA, 2015) have disclosed plans to build new NPPs. The economic dimensions of reducing GHG emissions is de- bated through the question whether nuclear or renewables should receive public subsidies, as both options still require financial support. The nuclear technology has also been subsidised since its beginning like fossil fuels (IEA, 2010) and renewables. The sub- sidies for nuclear come in different forms such as government- Contents lists available at ScienceDirect journal homepage: www.elsevier.com/locate/enpol Energy Policy http://dx.doi.org/10.1016/j.enpol.2016.08.023 0301-4215/& 2016 Elsevier Ltd. All rights reserved. n Corresponding author. E-mail addresses: [email protected](D. Suna), [email protected](G. Resch). Energy Policy 98 (2016) 199–209
Transcript
Energy Policy 98 (2016) 199–209
Contents lists available at ScienceDirect
Energy Policy
http://d0301-42
n CorrE-m
resch@e
journal homepage: www.elsevier.com/locate/enpol
Is nuclear economical in comparison to renewables?
Demet Suna a,c,n, Gustav Resch a,b
a e-think, Energy Research, Argentinierstrasse 18/10, A-1040 Vienna, Austriab Vienna University of Technology, Energy Economics Group, Gusshausstrasse 25/370-3, A-1040 Vienna, Austriac AIT Austrian Institute of Technology, Energy Department, Giefinggasse 6, A-1210 Vienna, Austria
H I G H L I G H T S
� State aids for new nuclear power is compared with incentives for renewables.
� Hinkley Point C in the UK is considered as example for new nuclear power.� Comparison is conducted for the UK at a country level and for the EU 28 overall.� Analysis shows that renewable energies are more economical than nuclear power.
a r t i c l e i n f o
Article history:Received 18 February 2016Received in revised form18 July 2016Accepted 21 August 2016
Keywords:Hinkley Point CNuclearRenewablesModellingEffectivenessEconomic efficiency
x.doi.org/10.1016/j.enpol.2016.08.02315/& 2016 Elsevier Ltd. All rights reserved.
esponding author.ail addresses: [email protected] (D. Suna),eg.tuwien.ac.at (G. Resch).
a b s t r a c t
The European Union is divided on the issue of electricity production. While there is consensus thatgeneration technologies need to be low on greenhouse gas emissions, the question of whether to userenewables or nuclear to meet this power demand is highly controversial. Both options still requirefinancial support and this is not going to change in the near future. This raises the question of wherepublic money should be invested in order to achieve greater economic efficiency: into support for re-newable energies (RE) or support for nuclear power plants?
This paper sets out to answer this question. The detailed model-based prospective scenario assess-ment performed in this study provides the basis for estimating future cost developments. After dis-cussing the existing support schemes for renewables, the paper compares these with a nuclear model.The comparison is conducted exemplarily for the United Kingdom (UK) at a country level and for the EU28 overall. The recent state aid case for the construction of the Hinkley Point nuclear power plant (NPP)in the UK serves as the model for the nuclear option.
& 2016 Elsevier Ltd. All rights reserved.
1. Introduction
In line with climate concerns, the European Commission (EC)has set short, mid and long-term targets to achieve a low carboneconomy. In the long term the goal of the European Union (EU) isto cut its emissions substantially by 80–95% compared to 1990levels (EC, 2015). The main binding target for 2030 is the reductionof EU domestic greenhouse gas (GHG) emissions by at least 40%below the 1990 level (EC, 2014a). Furthermore, EC says that toachieve these targets, renewables will play a key role and sets astarget for an increase of the renewables share to at least 27% of theEU's energy consumption by 2030. Nevertheless, this target isbinding at EU level and it has not been defined yet how the
member states should contribute to that. Besides, the EC alsoleaves the individual member states free to use whatever tech-nology they prefer to achieve emission reductions in the longerterm.
When it comes to low-carbon electricity generation, renewableenergy technologies and nuclear power plants are competing todesign the future energy supply of EU member states. WhileGermany has decided to phase out nuclear power completely bythe year 2022, many countries within the EU with existing nuclearpower plants (NPPs) such as France, UK, Romania, Slovakia andBulgaria (WNA, 2015) have disclosed plans to build new NPPs.
The economic dimensions of reducing GHG emissions is de-bated through the question whether nuclear or renewables shouldreceive public subsidies, as both options still require financialsupport. The nuclear technology has also been subsidised since itsbeginning like fossil fuels (IEA, 2010) and renewables. The sub-sidies for nuclear come in different forms such as government-
D. Suna, G. Resch / Energy Policy 98 (2016) 199–209200
funded loans, governmental liability in case of plant failure, in-dustry dumping or tax relief (Biermayr and Haas, 2009; WNA,2015b).
Subsidies for power generation technologies have been ana-lysed in a number of studies; Badcock and Lenzen (2010) reviewthe subsidies for coal-fired, nuclear and most common renewabletechnologies on a global level. A recent study commissioned by theEC, DG Energy quantifies monetarily the public interventions inenergy markets in all 28 EU member states for all energy usesexcept transport (Ecofys, 2014). Zelenika-Zovko and Pearce (2011)compare the indirect nuclear insurance subsidies to the equivalentamounts of indirect subsidies (loan guaranties) for photovoltaicmanufacturing.
Goldberg (2000) analyses the federal energy subsidies in the USto selected electricity generating technologies (nuclear, wind,photovoltaic, and solar thermal) for the period 1947–1999. Hisresults for the first 15 years of observation show that commercial,fission-related nuclear power development received 15.30 $/kWhwhereas between 1975 and 1989 subsidies for solar amounted to7.19 $/kWh and to 46 ¢/kWh in the case of wind power. Further-more, he adds that high early investment has led to a maturenuclear sector by achieving rapid growth. Koplow (2011) reviewsthe full range of subsidies for the nuclear power sector in the USand indicates that the most important subsidies to the industry arenot the cash payments. In contrast, most relevant appear subsidiesthat shift the construction cost and operating risk (from costoverruns and defaults to accidents as well as nuclear waste man-agement) from investors to the taxpayers.
A new milestone in state aid for NPPs will be the new NPP atHinkley Point C in the UK as the planned state aid is a kind of feed-in-tariff (FIT), a system that is often referred to as a start-up me-chanism for a newcomer technology like renewables (Morris,2013). The authors of this work are not aware of any studies thatcompare the subsidies for nuclear and renewables by puttingemphasis on the planned future supports for this new plannedNPPs.
1.1. Scope and structure of this paper
Hence, this paper aims for a comparative assessment of ne-cessary state aids for the construction of new nuclear capacity onthe example of the planned NPP Hinkley Point C with necessarysupport incentives for renewable energies. A comparison is un-dertaken to indicate the effectiveness, that is the amount of elec-tricity generation achieved, and the economic efficiency, that is thecorresponding support required, of both options.
This paper is structured as follows: In Section 2 a closer look istaken at nuclear power in Europe, specifically at past (and future)cost developments and on future prospects, influenced by the UKapproach on providing state aid for the built-up of new NPPs.Section 3 is dedicated to present the approach taken within ourassessment of the effectiveness of financial support. The outcomesof our analysis are discussed in Section 4 and the paper concludeswith key findings and recommendations (Section 5).
2. Background: a closer look at nuclear power in Europe
2.1. Discussion on cost development of nuclear power
For the economic comparison of technologies and for esti-mating their future role in energy supply, it is important to analysetheir historical cost developments. Since these developments havebeen broadly assessed for renewable energy technologies, com-pare for example (Held et al., 2014) or (Ecofys, 2014), we shed lighton a recently less prominently discussed electricity generation
technology: nuclear power. Nuclear power is promoted as one ofthe most reliable and affordable options for power supply by itsproponents. In literature, the cost development of nuclear powerhas been analysed mainly by considering France due to its long-standing nuclear based electricity supply system. Brook et al.(2014) argues the economic viability of nuclear energy by high-lighting the low electricity price in France which is categorisedamong the lowest worldwide. However, the reactors are becomingolder and the average age of reactors is about 30 years (in Franceand within EU) (Schneider et al., 2014). This means that most ofthe reactors have already been depreciated. The older reactors willneed massive investment to increase safety or to extend lifetime aswell as to replace them by building new reactors. A lifetime ex-tension beyond 40 years probably cause, depending on the safetylevel, between € 1 billion and € 4 billion (US$ 1.4– 5.5 billion) perreactor (Marignac, 2014; Schneider et al., 2014).
While the cost of renewables has been decreasing due tolearning effects, there is inconsistency with respect to develop-ment of nuclear energy costs over the years. Grubler (2010) in-dicates a negative learning effect in his analysis in the case ofFrance, meaning that this technology has achieved a cost escala-tion of real-time contraction over the years. Boccard (2014) iden-tifies the levelized cost of French nuclear power over the last fourdecades as 59 €/MWh (best case) and 83 €/MWh (worst case) andestimates the future costs as 76 €/MWh (best case) and 117 €/MWh (worst case).
By contrast, Escobar Rangel and Leveque (2015) revisited theFrench experience due to most recent public data and found po-sitive learning effects when it comes to building the same size andtype of reactors. However, these authors also state that the con-struction of bigger reactors leads to a change in technology (i.e.more complex reactors and longer lead-times) which will cause acost increase (Escobar Rangel and Leveque, 2015). Besides, in caseof large-scale infrastructure projects, the costs dramatically exceedthe initial estimates (Grubler, 2010; Biermayr and Haas, 2009).Each delay in construction leads to higher costs. For example twoNPPs under construction in the EU (Flamanville in France andOlkiluoto in Finland) are suffering from delays of several yearseach, and construction costs in Olkiluoto are now 280% overbudget (Schneider et al., 2014).
Within the EU, the number of reactors is decreasing. Because ofthe large capital costs and high risks, in Western Europe, it tookabout 25 years where no new nuclear power plant was builtoutside France. Finland acted finally as frontrunner, where con-struction works for a new NPP at Olkiluoto in have started. Thisproject could be launched through the large-scale industrydumping and a state subsidised loan from Bayerische Landesbank(Biermayr and Haas, 2009). The construction of Olkiluoto startedin 2005 with the expectation to start (partial) operation in mid-2009 (Schneider et al., 2014). Nevertheless, at the date of thispublication, this NPP is still under construction (Areva, 2015).
2.2. Hinkley Point C: encouraging the built-up of new nuclear powerplants in Europe
Of special interest is a new political development, the launch ofa state aid scheme for a new nuclear power plant at Hinkley PointC in the United Kingdom. The NNB Generation Company Limited(NNBG), part of EDF Energy, plans to construct and operate a newNPP, consisting of two units with an electrical capacity of in totalaround 3,260 MW, producing 26 TWh per year at the HinkleyPoint NPP site (Hinkley Point C 1&2). If constructed, Hinkley PointC would be the UK's first new reactor since 1988.
The construction costs of Hinkley Point C were first estimatedto be close to € 19 billion (EDF, 2013) but were corrected by the ECto € 31.2 billion, and overall capital costs are assumed to be € 43
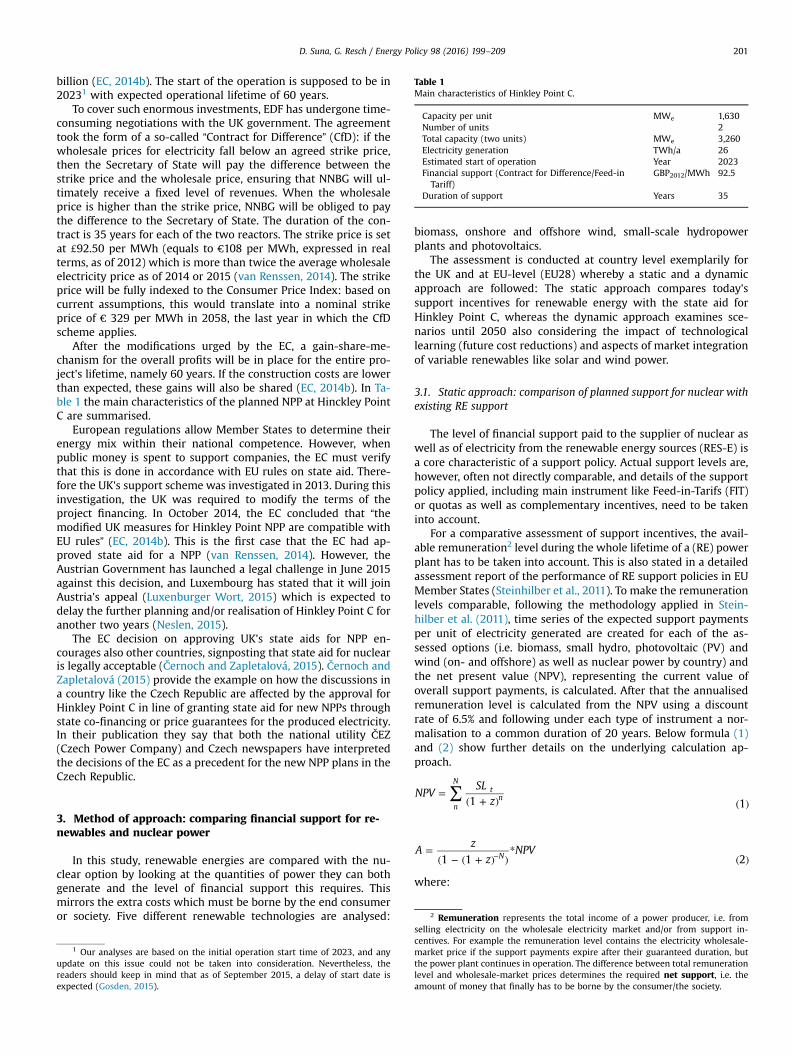
Table 1Main characteristics of Hinkley Point C.
Capacity per unit MWe 1,630Number of units 2Total capacity (two units) MWe 3,260Electricity generation TWh/a 26Estimated start of operation Year 2023Financial support (Contract for Difference/Feed-inTariff)
GBP2012/MWh 92.5
Duration of support Years 35
D. Suna, G. Resch / Energy Policy 98 (2016) 199–209 201
billion (EC, 2014b). The start of the operation is supposed to be in20231 with expected operational lifetime of 60 years.
To cover such enormous investments, EDF has undergone time-consuming negotiations with the UK government. The agreementtook the form of a so-called “Contract for Difference” (CfD): if thewholesale prices for electricity fall below an agreed strike price,then the Secretary of State will pay the difference between thestrike price and the wholesale price, ensuring that NNBG will ul-timately receive a fixed level of revenues. When the wholesaleprice is higher than the strike price, NNBG will be obliged to paythe difference to the Secretary of State. The duration of the con-tract is 35 years for each of the two reactors. The strike price is setat d92.50 per MWh (equals to €108 per MWh, expressed in realterms, as of 2012) which is more than twice the average wholesaleelectricity price as of 2014 or 2015 (van Renssen, 2014). The strikeprice will be fully indexed to the Consumer Price Index: based oncurrent assumptions, this would translate into a nominal strikeprice of € 329 per MWh in 2058, the last year in which the CfDscheme applies.
After the modifications urged by the EC, a gain-share-me-chanism for the overall profits will be in place for the entire pro-ject's lifetime, namely 60 years. If the construction costs are lowerthan expected, these gains will also be shared (EC, 2014b). In Ta-ble 1 the main characteristics of the planned NPP at Hinckley PointC are summarised.
European regulations allow Member States to determine theirenergy mix within their national competence. However, whenpublic money is spent to support companies, the EC must verifythat this is done in accordance with EU rules on state aid. There-fore the UK's support scheme was investigated in 2013. During thisinvestigation, the UK was required to modify the terms of theproject financing. In October 2014, the EC concluded that “themodified UK measures for Hinkley Point NPP are compatible withEU rules” (EC, 2014b). This is the first case that the EC had ap-proved state aid for a NPP (van Renssen, 2014). However, theAustrian Government has launched a legal challenge in June 2015against this decision, and Luxembourg has stated that it will joinAustria's appeal (Luxenburger Wort, 2015) which is expected todelay the further planning and/or realisation of Hinkley Point C foranother two years (Neslen, 2015).
The EC decision on approving UK's state aids for NPP en-courages also other countries, signposting that state aid for nuclearis legally acceptable (Černoch and Zapletalová, 2015). Černoch andZapletalová (2015) provide the example on how the discussions ina country like the Czech Republic are affected by the approval forHinkley Point C in line of granting state aid for new NPPs throughstate co-financing or price guarantees for the produced electricity.In their publication they say that both the national utility ČEZ(Czech Power Company) and Czech newspapers have interpretedthe decisions of the EC as a precedent for the new NPP plans in theCzech Republic.
2 Remuneration represents the total income of a power producer, i.e. from
3. Method of approach: comparing financial support for re-newables and nuclear power
In this study, renewable energies are compared with the nu-clear option by looking at the quantities of power they can bothgenerate and the level of financial support this requires. Thismirrors the extra costs which must be borne by the end consumeror society. Five different renewable technologies are analysed:
1 Our analyses are based on the initial operation start time of 2023, and anyupdate on this issue could not be taken into consideration. Nevertheless, thereaders should keep in mind that as of September 2015, a delay of start date isexpected (Gosden, 2015).
biomass, onshore and offshore wind, small-scale hydropowerplants and photovoltaics.
The assessment is conducted at country level exemplarily forthe UK and at EU-level (EU28) whereby a static and a dynamicapproach are followed: The static approach compares today'ssupport incentives for renewable energy with the state aid forHinkley Point C, whereas the dynamic approach examines sce-narios until 2050 also considering the impact of technologicallearning (future cost reductions) and aspects of market integrationof variable renewables like solar and wind power.
3.1. Static approach: comparison of planned support for nuclear withexisting RE support
The level of financial support paid to the supplier of nuclear aswell as of electricity from the renewable energy sources (RES-E) isa core characteristic of a support policy. Actual support levels are,however, often not directly comparable, and details of the supportpolicy applied, including main instrument like Feed-in-Tarifs (FIT)or quotas as well as complementary incentives, need to be takeninto account.
For a comparative assessment of support incentives, the avail-able remuneration2 level during the whole lifetime of a (RE) powerplant has to be taken into account. This is also stated in a detailedassessment report of the performance of RE support policies in EUMember States (Steinhilber et al., 2011). To make the remunerationlevels comparable, following the methodology applied in Stein-hilber et al. (2011), time series of the expected support paymentsper unit of electricity generated are created for each of the as-sessed options (i.e. biomass, small hydro, photovoltaic (PV) andwind (on- and offshore) as well as nuclear power by country) andthe net present value (NPV), representing the current value ofoverall support payments, is calculated. After that the annualisedremuneration level is calculated from the NPV using a discountrate of 6.5% and following under each type of instrument a nor-malisation to a common duration of 20 years. Below formula (1)and (2) show further details on the underlying calculation ap-proach.
∑=( + ) ( )
NPVSL
z1 1n
Nt
n
=( − ( + ) )
*( )−A
z
zNPV
1 1 2N
where:
selling electricity on the wholesale electricity market and/or from support in-centives. For example the remuneration level contains the electricity wholesale-market price if the support payments expire after their guaranteed duration, butthe power plant continues in operation. The difference between total remunerationlevel and wholesale-market prices determines the required net support, i.e. theamount of money that finally has to be borne by the consumer/the society.
Table 2Main input sources for scenario parameters.
Based on PRIMES Based on Green-X database Defined for thisassessment
� Primary energy prices� Conventional supply port-
folio and conversionefficiencies
� CO2 intensity of sectors
� RE cost (investment,fuel, O&M)
� RE potential� Biomass trade
specification
� RE policyframework
� Reference elec-tricity prices
� Energy demand
D. Suna, G. Resch / Energy Policy 98 (2016) 199–209202
NPV: Net present value;SLt:Support level available in year t;A: Annualised remuneration level;Z: Interest rate;n: Reference year;N: Payback time
In addition, expected future wholesale electricity prices arenormalised over the same time period. In the case of a quotascheme with tradable green certificates (TGCs), it is assumed thatthe total remuneration level is composed of the conventionalelectricity price (wholesale electricity prices) and the average va-lue of TGCs. The results on remuneration levels, wholesale elec-tricity prices or net support expenditures are expressed subse-quently in real terms, using €2013.
3.2. Dynamic approach: a prospective model-based assessment ofplanned support for nuclear with expected future RE support
The dynamic assessment follows the principles sketched above,assessing effectiveness and economic efficiency (i.e. cost effec-tiveness) of RE and nuclear power support from a future per-spective. The approach taken builds on a model-based assessmentof future RE deployment in the European Union and at countrylevel for the UK up to 2050.
A scenario of dedicated RE support is assessed that followsthe policy decisions taken, i.e. the binding 2020 RE target (ofreaching a share of 20% RE in gross final energy demand), and thatreflects the European policy agenda for tomorrow where mitiga-tion of climate change and the built-up of a sustainable energysystem are expected to remain as top priorities in the period post2020.3 The scenario proclaims the prolongation of establishingenhancing framework conditions at EU level while national (or infuture European) RE support instruments aim for setting the cor-responding incentives to assure the achievement of European REtargets by 2030 and beyond. Complementary to fine-tuned fi-nancial incentives for RE this requires enabling framework con-ditions and a mitigation of currently prevailing non-economicbarriers (i.e. administrative barriers and grid constraints thathinder the upscaling of RE deployment across Europe at present).
To derive the scenario, the Green-X model is used. Green-X is adynamic simulation model for assessing the impact of energypolicy instruments on future RE deployment and related costs,expenditures and benefits at technology-, sector- and country-le-vel, that has been widely used in various studies at a national andEuropean level, e.g. for the European Commission to assess thefeasibility and impacts of “20% RE by 2020″, and to explore policyoptions post 2020 – for a detailed description of this model werefer to (Green-X, 2015).
3.2.1. Future requirements concerning support schemes for REGenerally, the need to incentivise the deployment decreases for
RE technologies thanks to technological learning. Technologicalprogress and related cost reductions go hand in hand with theongoing market deployment of a certain technology. This has beenimpressively demonstrated for example by the uptake of PV inGermany and other countries and the achieved significant declineof capital cost. But what has been observed for PV is by far not anexceptional case, it is rather an affirmation of a general empiricalobservation – i.e. the technological learning theory.
On the contrary, with ongoing market deployment of variable
3 The derived scenario of dedicated RE support follows an ambitious deploy-ment of renewables within the EU. 2030 RE deployment at EU level is for examplein accordance with an overall RE share of 30% by 2030 which is above the mini-mum RE target of 27% as agreed at the Council meeting of 22/23 October 2014.
renewables like solar and wind we see however also an opposingtendency that ultimately may cause an increase in the need forfinancial support. This concerns the market value of the producedelectricity that is fed into the grid. For these technologies it isbecoming apparent that in future years (with ongoing deploy-ment) a unit of electricity produced is less valuable than of adispatchable RE technology like biomass where the plant mayinterrupt operation during periods of oversupply (because ofmassive wind and solar power inflow) and correspondingly maylow the wholesale power prices. Accordingly this may increase therequired net support, determined by difference between total re-muneration and market value.
Whether the cost decrease due to technological learning or theincrease in support requirements due to a decreasing market valuewill be of dominance depends on the country- and technology-specific circumstances. This will be analysed in further detail for allassessed energy technologies for the UK and EU 28 within thedynamic assessment.
3.2.2. Overview on key parametersIn order to ensure maximum consistency with existing EU
scenarios and projections the key input parameters of the sce-narios presented in this work are derived from PRIMES modelling(EC, 2013) and from the Green-X database with respect to thepotentials and cost of RE technologies. Table 2 shows whichparameters are based on PRIMES, on the Green-X database andwhich have been defined for this assessment.
More precisely, the PRIMES scenario used is the referencescenario as of 2013 (EC, 2013). However for this assessment, de-mand projections have been contrasted with recent statistics(from Eurostat) and corrected where adequate (in order to assurean appropriate incorporation of impacts related to the recent fi-nancial and economic crisis). Moreover, mid- to long-term trendshave been further modified to reflect an adequate representationof energy efficiency, assuming a proactive implementation of en-ergy efficiency measures in order to reduce overall demandgrowth.
The assessment of energy efficiency policy options is based ondetailed modelling of the final energy demand in the differentdemand sectors. For our assessment the Low Policy Initiative (LPI)scenario is used as derived in the frame of a recent study con-ducted on behalf of DG ENER (Braungardt et al., 2014). The studyfrom Braungardt et al. (2014) evaluates the current energy effi-ciency policy framework in the EU and provides orientation onpolicy options for realising the cost-effective energy-efficiency/saving potential until 2020 and beyond.
An overview on the cost assumptions and trends concerning REtechnologies as used in the modelling is provided by Table 3(status as of 2010) and Table 4 (future trends). More precisely,Table 3 shows the economic parameters and accompanying tech-nical specifications for assessed RE technologies in the electricity
� Technology diffusion /Non-economic barriers
� Learning rates� Market values for vari-
able RES-E
by sector*
Table 3Overview on economic-& technical-specifications for selected RE technologies in the year 2010 (Source: Green-X database (Green-X, 2015)).
D. Suna, G. Resch / Energy Policy 98 (2016) 199–209 203
sector, representing a snapshot for the year 2010 which acts asstarting point in scenario calculations. Please note that the un-derlying assessment of the data relies on a comprehensive litera-ture survey and an expert consultation as discussed in Resch et al.(2014) or Green-X (2015). Expectations on future cost develop-ments as shown in Table 4 stem from Green-X modelling, in-dicating changes in at EU 28 level observable average investmentcost and thereby following the concept of technological learning.As learning is taking place on the international level the deploy-ment of a technology on the global market is considered. Moreprecisely, for the model runs global deployment consists of thefollowing components:
� Deployment within the EU 28 is endogenously determined, i.e.is derived within the model.
� Expected developments in the “rest of the world” are based onforecasts as presented in the IEA World Energy Outlook 2013(IEA, 2013).
As applicable in Table 4 for most RE technologies a decline offuture cost is expected, generally driven by a continuous uptake ofglobal technology markets. In the case of biomass the main reasonfor future cost declines is however not technological learning – i.e.it is the consequence of the expected increase of plant size wherein the past, thanks to grateful support, also small-scale units could
be constructed in several countries. An exception from the generaltrend of declining investment cost is apparent for small-scalehydropower. Since here costs are rather site specific, and in mostcountries best sites are already used, the further expansion ofsmall hydropower generally leads to an increase of specific in-vestment cost on average across the EU 28.
4. Results of the comparative assessment
4.1. Assessment for the UK
This chapter deals with the question, how much electricitycould be generated by renewable sources in the UK if the amountof the public funds for the planned UK NPP Hinkley Point C wouldbe available. Thus a comparison which relates the amount ofpublic funds required for Hinkley Point C with currently im-plemented renewable energy support schemes is conducted, fol-lowing the methodology outlined in Section 3.1 (static approach)of this paper. Furthermore the required future incentives, whichappears necessary for letting renewables play a key role in theongoing energy transition, is considered. Results are presented interms of cost (€ per MWh) and amount of electricity generationfollowing the static and dynamic approach, respectively.
4.1.1. Outlook: role of nuclear power and RE in the energy mixIn the UK, the government aims at promoting nuclear energy
with new policies and also with financial support. For replacementof the old NPP-fleet, eleven new-builds are planned. For two of theplanned reactors (Hinkley Point C 1&2), the Environmental ImpactAssessment procedure is already completed and state aids havebeen concluded by the European Commission (see Section 5). Thecapacity for all eleven planned units is 15.6 GWe (gross), while asof 2012 operating fleet has a capacity of 10 GWe (net) (WNA,2015a).
The electricity from renewable sources is regulated through acombination of a Renewable Obligation (RO), i.e. a quota system
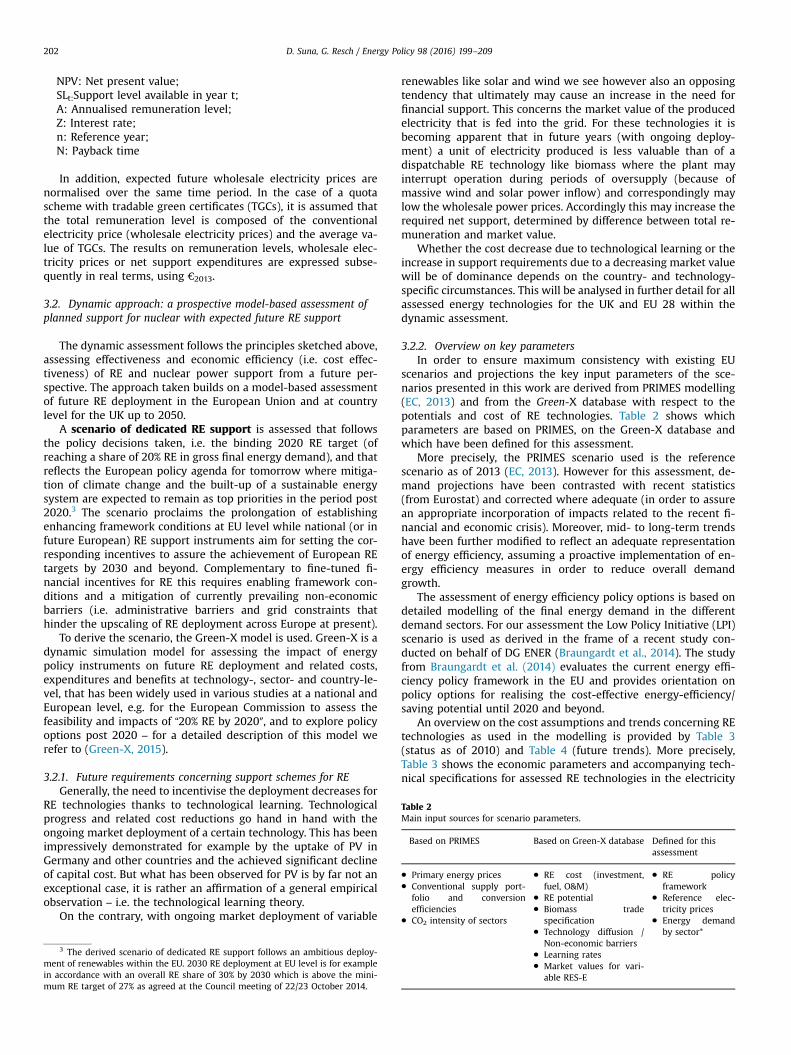
Fig. 1. Comparison of remuneration levels (and of wholesale electricity prices) fornuclear power and for assessed RE technologies in the UK (Source: Own calcula-tions, based on (Steinhilber et al., 2011) and (Held et al., 2014).
D. Suna, G. Resch / Energy Policy 98 (2016) 199–209204
with tradable green certificates, and a FIT system (for small-scaleplants). Under the FIT, accredited producers whose plants have acapacity of less than 5 MW can sell their electricity at fixed tariffrates established by the Gas and Electricity Market Authority(Ofgem). However plants between 50 kW and 5 MWare entitled tochoose between the FIT system and the RO (RES LEGAL, 2014).
4.1.2. Static approach: comparison of planned support for nuclearwith existing RE support in the UK
Fig. 1 provides first outcomes of the assessment, offering acomparison of the expected remuneration levels for Hinkley PointC with those for a new RE power plant (as of 2013) in the UK. Thisgraph shows also the expected future wholesale electricity prices(on average, normalised over 20 years), representing defaultearnings for a power producer in the absence of dedicatedsupport.
In UK, the average total remuneration is highest in the case ofPV (150.2 €/MWh), followed by the wind offshore (135.6). Whileaverage remuneration for wind onshore lies in similar range ofplanned aid scheme for nuclear power at Hinkley Point C (105.6 €/MWh), this is lower for biomass cofiring and small scalehydropower.
In the case of net support, the difference between total re-muneration and wholesale prices is lowest for small scale hydro-power (18 €/MWh) and highest for PV (81 €/MWh). Net supportfor nuclear power and wind onshore comes close; former is about36 €/MWh, the latter is 35 €/MWh.
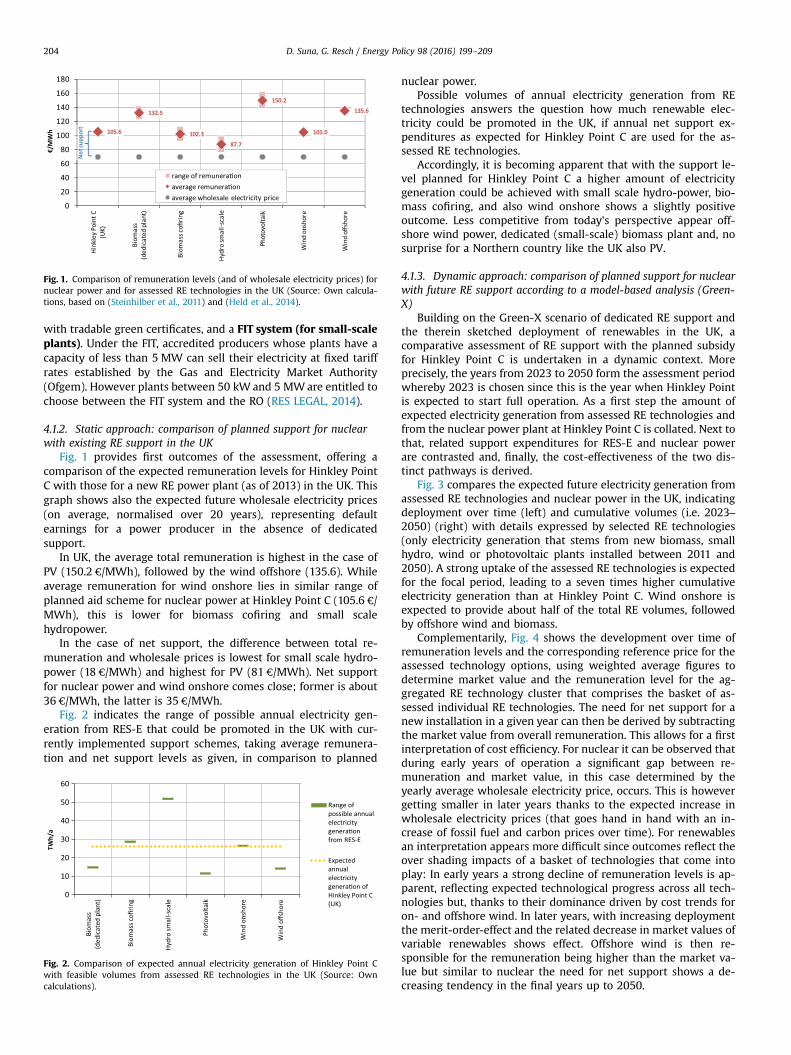
Fig. 2 indicates the range of possible annual electricity gen-eration from RES-E that could be promoted in the UK with cur-rently implemented support schemes, taking average remunera-tion and net support levels as given, in comparison to planned
Fig. 2. Comparison of expected annual electricity generation of Hinkley Point Cwith feasible volumes from assessed RE technologies in the UK (Source: Owncalculations).
nuclear power.Possible volumes of annual electricity generation from RE
technologies answers the question how much renewable elec-tricity could be promoted in the UK, if annual net support ex-penditures as expected for Hinkley Point C are used for the as-sessed RE technologies.
Accordingly, it is becoming apparent that with the support le-vel planned for Hinkley Point C a higher amount of electricitygeneration could be achieved with small scale hydro-power, bio-mass cofiring, and also wind onshore shows a slightly positiveoutcome. Less competitive from today's perspective appear off-shore wind power, dedicated (small-scale) biomass plant and, nosurprise for a Northern country like the UK also PV.
4.1.3. Dynamic approach: comparison of planned support for nuclearwith future RE support according to a model-based analysis (Green-X)
Building on the Green-X scenario of dedicated RE support andthe therein sketched deployment of renewables in the UK, acomparative assessment of RE support with the planned subsidyfor Hinkley Point C is undertaken in a dynamic context. Moreprecisely, the years from 2023 to 2050 form the assessment periodwhereby 2023 is chosen since this is the year when Hinkley Pointis expected to start full operation. As a first step the amount ofexpected electricity generation from assessed RE technologies andfrom the nuclear power plant at Hinkley Point C is collated. Next tothat, related support expenditures for RES-E and nuclear powerare contrasted and, finally, the cost-effectiveness of the two dis-tinct pathways is derived.
Fig. 3 compares the expected future electricity generation fromassessed RE technologies and nuclear power in the UK, indicatingdeployment over time (left) and cumulative volumes (i.e. 2023–2050) (right) with details expressed by selected RE technologies(only electricity generation that stems from new biomass, smallhydro, wind or photovoltaic plants installed between 2011 and2050). A strong uptake of the assessed RE technologies is expectedfor the focal period, leading to a seven times higher cumulativeelectricity generation than at Hinkley Point C. Wind onshore isexpected to provide about half of the total RE volumes, followedby offshore wind and biomass.
Complementarily, Fig. 4 shows the development over time ofremuneration levels and the corresponding reference price for theassessed technology options, using weighted average figures todetermine market value and the remuneration level for the ag-gregated RE technology cluster that comprises the basket of as-sessed individual RE technologies. The need for net support for anew installation in a given year can then be derived by subtractingthe market value from overall remuneration. This allows for a firstinterpretation of cost efficiency. For nuclear it can be observed thatduring early years of operation a significant gap between re-muneration and market value, in this case determined by theyearly average wholesale electricity price, occurs. This is howevergetting smaller in later years thanks to the expected increase inwholesale electricity prices (that goes hand in hand with an in-crease of fossil fuel and carbon prices over time). For renewablesan interpretation appears more difficult since outcomes reflect theover shading impacts of a basket of technologies that come intoplay: In early years a strong decline of remuneration levels is ap-parent, reflecting expected technological progress across all tech-nologies but, thanks to their dominance driven by cost trends foron- and offshore wind. In later years, with increasing deploymentthe merit-order-effect and the related decrease in market values ofvariable renewables shows effect. Offshore wind is then re-sponsible for the remuneration being higher than the market va-lue but similar to nuclear the need for net support shows a de-creasing tendency in the final years up to 2050.
Fig. 4. Future development of remuneration levels and corresponding market values of the assessed RE technologies (as aggregate) and of nuclear power in the UK accordingto the Green-X scenario of dedicated RE support (Source: Own assessment (Green-X)).
Fig. 5. Comparison of expected support expenditures for assessed RE technologies and nuclear power in the UK according to the Green-X scenario of dedicated RE support:development over time (left) and cumulative volumes 2023–2050) (right) by RE technology (Source: Own assessment (Green-X)).
Fig. 3. Comparison of expected future electricity generation from assessed RE technologies and nuclear power in the UK according to the Green-X scenario of dedicated REsupport: development over time (left) and cumulative volumes 2023–2050) (right) by RE technology (Source: Own assessment (Green-X)).
D. Suna, G. Resch / Energy Policy 98 (2016) 199–209 205
In accordance with above, Fig. 5 provides a comparison ofsupport expenditures for assessed RE technologies and nuclearpower in the UK, illustrating the development over time (left) and
in cumulative volumes 2023–2050) (right) with details for theassessed RE technologies. A closer look at the dynamic develop-ment reveals the declining trend for nuclear power as discussed
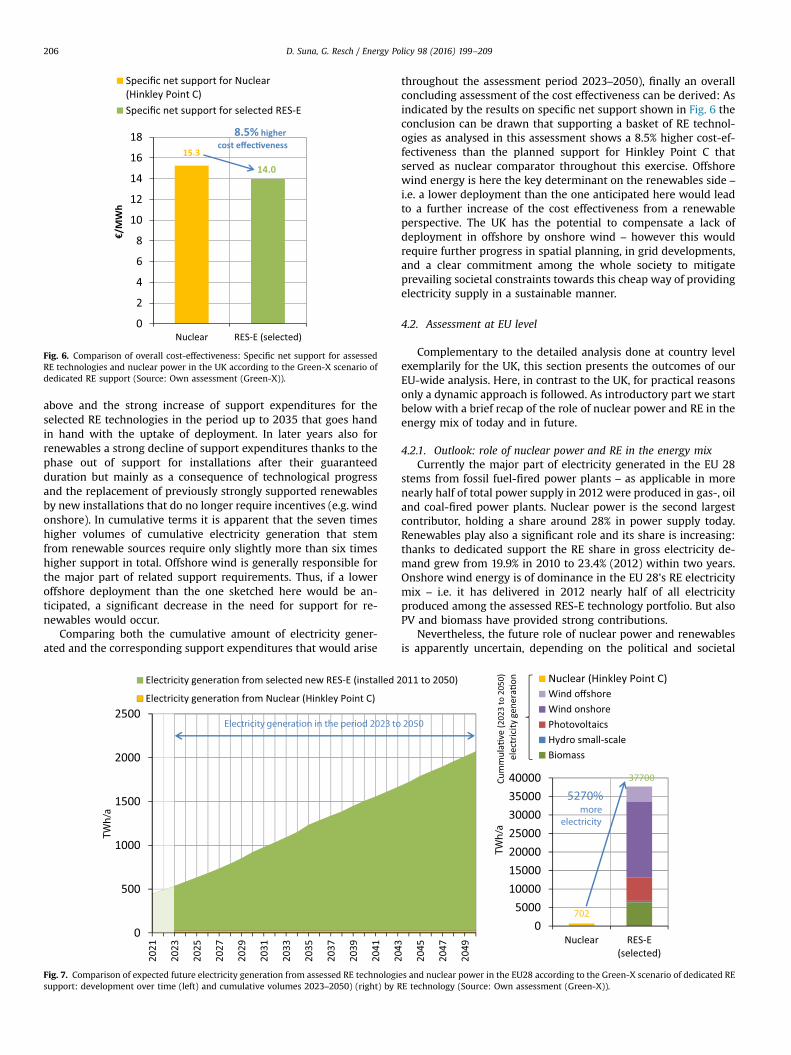
Fig. 6. Comparison of overall cost-effectiveness: Specific net support for assessedRE technologies and nuclear power in the UK according to the Green-X scenario ofdedicated RE support (Source: Own assessment (Green-X)).
D. Suna, G. Resch / Energy Policy 98 (2016) 199–209206
above and the strong increase of support expenditures for theselected RE technologies in the period up to 2035 that goes handin hand with the uptake of deployment. In later years also forrenewables a strong decline of support expenditures thanks to thephase out of support for installations after their guaranteedduration but mainly as a consequence of technological progressand the replacement of previously strongly supported renewablesby new installations that do no longer require incentives (e.g. windonshore). In cumulative terms it is apparent that the seven timeshigher volumes of cumulative electricity generation that stemfrom renewable sources require only slightly more than six timeshigher support in total. Offshore wind is generally responsible forthe major part of related support requirements. Thus, if a loweroffshore deployment than the one sketched here would be an-ticipated, a significant decrease in the need for support for re-newables would occur.
Comparing both the cumulative amount of electricity gener-ated and the corresponding support expenditures that would arise
Fig. 7. Comparison of expected future electricity generation from assessed RE technologisupport: development over time (left) and cumulative volumes 2023–2050) (right) by R
throughout the assessment period 2023–2050), finally an overallconcluding assessment of the cost effectiveness can be derived: Asindicated by the results on specific net support shown in Fig. 6 theconclusion can be drawn that supporting a basket of RE technol-ogies as analysed in this assessment shows a 8.5% higher cost-ef-fectiveness than the planned support for Hinkley Point C thatserved as nuclear comparator throughout this exercise. Offshorewind energy is here the key determinant on the renewables side –
i.e. a lower deployment than the one anticipated here would leadto a further increase of the cost effectiveness from a renewableperspective. The UK has the potential to compensate a lack ofdeployment in offshore by onshore wind – however this wouldrequire further progress in spatial planning, in grid developments,and a clear commitment among the whole society to mitigateprevailing societal constraints towards this cheap way of providingelectricity supply in a sustainable manner.
4.2. Assessment at EU level
Complementary to the detailed analysis done at country levelexemplarily for the UK, this section presents the outcomes of ourEU-wide analysis. Here, in contrast to the UK, for practical reasonsonly a dynamic approach is followed. As introductory part we startbelow with a brief recap of the role of nuclear power and RE in theenergy mix of today and in future.
4.2.1. Outlook: role of nuclear power and RE in the energy mixCurrently the major part of electricity generated in the EU 28
stems from fossil fuel-fired power plants – as applicable in morenearly half of total power supply in 2012 were produced in gas-, oiland coal-fired power plants. Nuclear power is the second largestcontributor, holding a share around 28% in power supply today.Renewables play also a significant role and its share is increasing:thanks to dedicated support the RE share in gross electricity de-mand grew from 19.9% in 2010 to 23.4% (2012) within two years.Onshore wind energy is of dominance in the EU 28's RE electricitymix – i.e. it has delivered in 2012 nearly half of all electricityproduced among the assessed RES-E technology portfolio. But alsoPV and biomass have provided strong contributions.
Nevertheless, the future role of nuclear power and renewablesis apparently uncertain, depending on the political and societal
es and nuclear power in the EU28 according to the Green-X scenario of dedicated REE technology (Source: Own assessment (Green-X)).
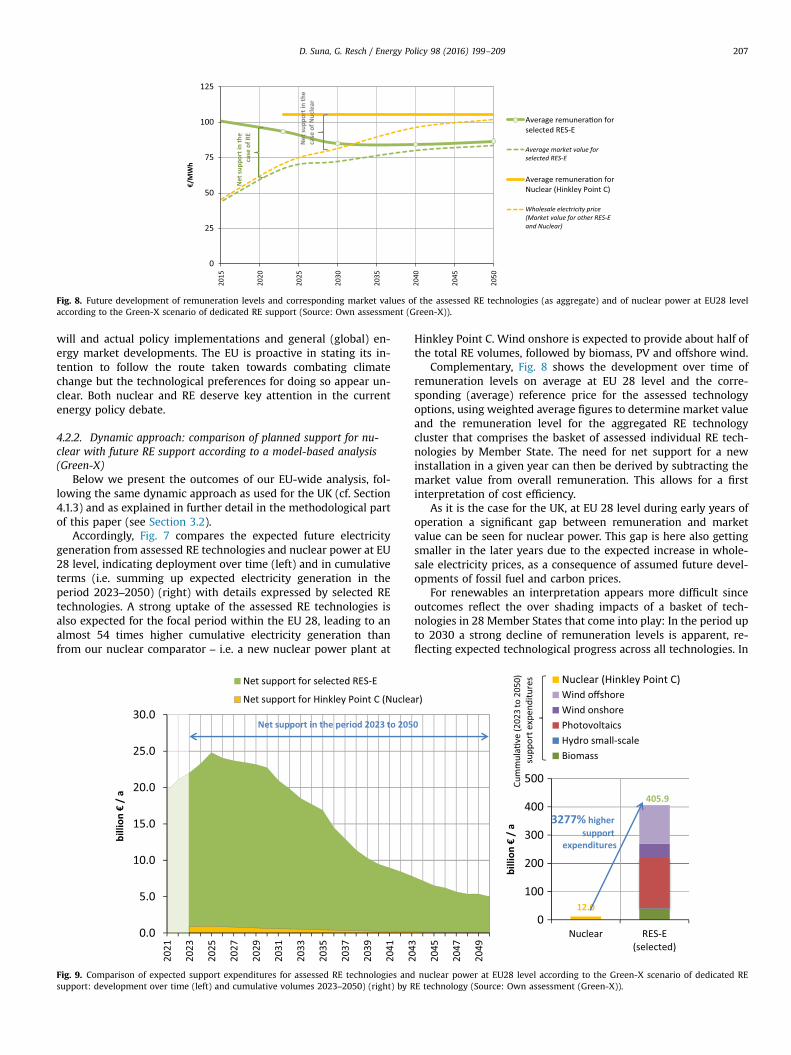
Fig. 8. Future development of remuneration levels and corresponding market values of the assessed RE technologies (as aggregate) and of nuclear power at EU28 levelaccording to the Green-X scenario of dedicated RE support (Source: Own assessment (Green-X)).
D. Suna, G. Resch / Energy Policy 98 (2016) 199–209 207
will and actual policy implementations and general (global) en-ergy market developments. The EU is proactive in stating its in-tention to follow the route taken towards combating climatechange but the technological preferences for doing so appear un-clear. Both nuclear and RE deserve key attention in the currentenergy policy debate.
4.2.2. Dynamic approach: comparison of planned support for nu-clear with future RE support according to a model-based analysis(Green-X)
Below we present the outcomes of our EU-wide analysis, fol-lowing the same dynamic approach as used for the UK (cf. Section4.1.3) and as explained in further detail in the methodological partof this paper (see Section 3.2).
Accordingly, Fig. 7 compares the expected future electricitygeneration from assessed RE technologies and nuclear power at EU28 level, indicating deployment over time (left) and in cumulativeterms (i.e. summing up expected electricity generation in theperiod 2023–2050) (right) with details expressed by selected REtechnologies. A strong uptake of the assessed RE technologies isalso expected for the focal period within the EU 28, leading to analmost 54 times higher cumulative electricity generation thanfrom our nuclear comparator – i.e. a new nuclear power plant at
Fig. 9. Comparison of expected support expenditures for assessed RE technologies andsupport: development over time (left) and cumulative volumes 2023–2050) (right) by R
Hinkley Point C. Wind onshore is expected to provide about half ofthe total RE volumes, followed by biomass, PV and offshore wind.
Complementary, Fig. 8 shows the development over time ofremuneration levels on average at EU 28 level and the corre-sponding (average) reference price for the assessed technologyoptions, using weighted average figures to determine market valueand the remuneration level for the aggregated RE technologycluster that comprises the basket of assessed individual RE tech-nologies by Member State. The need for net support for a newinstallation in a given year can then be derived by subtracting themarket value from overall remuneration. This allows for a firstinterpretation of cost efficiency.
As it is the case for the UK, at EU 28 level during early years ofoperation a significant gap between remuneration and marketvalue can be seen for nuclear power. This gap is here also gettingsmaller in the later years due to the expected increase in whole-sale electricity prices, as a consequence of assumed future devel-opments of fossil fuel and carbon prices.
For renewables an interpretation appears more difficult sinceoutcomes reflect the over shading impacts of a basket of tech-nologies in 28 Member States that come into play: In the period upto 2030 a strong decline of remuneration levels is apparent, re-flecting expected technological progress across all technologies. In
nuclear power at EU28 level according to the Green-X scenario of dedicated REE technology (Source: Own assessment (Green-X)).
Fig. 10. Comparison of overall cost-effectiveness: Specific net support for assessedRE technologies and nuclear power at EU28 level according to the Green-X scenarioof dedicated RE support (Source: Own assessment (Green-X)).
D. Suna, G. Resch / Energy Policy 98 (2016) 199–209208
later years, remuneration remains rather constant. On the con-trary, with increasing deployment the merit-order-effect and therelated decrease in market values of variable renewables showseffect. This decouples the market value from the average whole-sale electricity price, causing a slower but steady increase of thereference price that finally determines the need for (net) support.Beyond 2040 remuneration levels and market values align but asmall gap remains mainly due to offshore wind as used in severalNorthern EU countries, and that fails to achieve full cost compe-titiveness within the assessment period.
In a similar way as shown for electricity generation in Fig. 7,Fig. 9 allows for a comparison of support expenditures for assessedRE technologies and nuclear power in the EU 28, showing thedevelopment over time (left) and cumulative volumes 2023–2050)(right) with details for the assessed RE technologies. A closer lookat the dynamic development reveals the declining trend for nu-clear power as discussed above. For renewables in early years astrong increase of support expenditures is applicable that goeshand in hand with the uptake of deployment. After 2025 a firstmoderate and later on strong decline of RE support expenditurescan be seen. Several factors play here a decisive role: the decline ispartly caused by a phase out of support for RE installations aftertheir guaranteed support duration, partly a consequence of tech-nological progress, and partly because of the replacement of pre-viously strongly supported renewables by new installations thatdo no longer require financial incentives.
Comparing both the cumulative amount of electricity gener-ated and the corresponding support expenditures that would arisethroughout the assessment period 2023–2050) a concluding as-sessment of the cost effectiveness can be derived: As indicated bythe results on specific net support shown in Fig. 10 the conclusioncan be drawn that supporting a basket of RE technologies asanalysed in this assessment shows a 37% higher cost-effectivenessthan the planned support for a new nuclear power plant as ex-emplified for the case of Hinkley Point C in the UK, serving asnuclear comparator throughout this exercise.
5. Conclusion and policy implications
The static approach conducted for the UK compares today'sincentives for RE with a planned aid scheme for NPP Hinkley Point
that may become effective ten years ahead. In the UK the re-muneration levels for small hydro, biomass cofiring and wind-onshore is less than the planned remuneration level for theHinkley Point. Nevertheless wind onshore is only slightly lowerand the fact is that today's support for onshore wind in the UK viaa certificate trading regime can be classified as significantly riskierthan secure revenues stemming from a “Contract for Difference”scheme as planned for Hinkley Point C. Therefore implementingsuch a “low-risk” form of support for all types of low-carbontechnologies (as is planned in the UK for the near future) wouldalso significantly decrease the level of support required for on-shore wind in the UK.
The conducted dynamic approach shows that a constant levelof remuneration, as guaranteed for nuclear power at Hinkley PointC in the UK and EU 28, may lead to a high consumer burden in theearly years. But thanks to expected increases in fossil fuel andcarbon prices, net support will decrease over time. More precisely,during the early years of operation at Hinkley Point C there will bea significant gap between remuneration level and market value, inthis case determined by the yearly average wholesale electricityprice. However, this gap will reduce with time thanks to the ex-pected increase in wholesale electricity prices (which goes hand inhand with an increase in fossil fuel and carbon prices over time).
Since partly significant cost reductions have been achievedthroughout the last decade for several RE technologies it can beexpected that ongoing technological learning would trigger addi-tional cost decreases and, consequently, reduce the need for sup-port in forthcoming years also for the most costly technologiessuch as PV and wind onshore. In contrast, the ongoing marketdeployment of various renewables including solar and wind de-monstrates an opposing tendency that may ultimately cause anincrease in the need for financial support: the market value of thegenerated electricity that is fed into the grid. For these technolo-gies it is becoming apparent that in future years (with ongoingdeployment) a unit of electricity will be less valuable than thatproduced by a dispatchable RE technology such as biomass wherethe plant may interrupt operation during periods of oversupplyand wholesale power prices are correspondingly low.
Thus the level of required net support is determined by thedifference between total remuneration and market value. Whetherthe cost decreases resulting from technological learning outweighthe need for increased support as a result of the decreasing marketvalue, or vice versa, depends on the country and technology-spe-cific circumstances.
The assessment for the UK and for the EU 28 confirms thatremuneration for renewables is expected to decline over time. Thisdecrease is strong in the early years, followed by a slowdown andstagnation in later years. Contrarily, market values for variablerenewables are expected to more strongly decouple from averagewholesale electricity prices in later years, with increases in marketpenetration.
If we compare cumulative electricity generation and corre-sponding support expenditures we can draw an overall conclusionregarding the cost effectiveness of the two distinct pathways (i.e.nuclear vs. RE). Results for specific net support clearly indicate thatsupporting a basket of RE technologies is more cost-effective thanthe planned support for the nuclear power plant at Hinkley Point Cthat has served as the nuclear comparator throughout this ex-ercise. Average savings in support expenditures for the EU 28 as awhole are in the range of 37.1%. In the UK it is also economicallybeneficial to follow a RE pathway rather than the nuclear option,with cost savings of 8.5%.
D. Suna, G. Resch / Energy Policy 98 (2016) 199–209 209
Acknowledgments
This paper builds on an analysis conducted by e-think, EnergyResearch in cooperation with Austrian Institute of Ecology withinthe project “Renewable Energies versus Nuclear Power”, cf. (Mrazet al., 2014). We gratefully acknowledge financial support fromVienna Ombuds Office for Environmental Protection (WUA-406783/2014) (Wiener Umweltanwaltschaft).
References
Areva, 2015. Olkiluoto 3- Finland. Available at: ⟨http://www.areva.com/EN/operations-2389/olkiluoto-3-finland.html⟩ (Accessed 19.06.15).
Badcock, J., Lenzen, M., 2010. Subsidies for electricity-generating technologies: Areview. Special Section on Carbon Emissions and Carbon Management in Citieswith Regular Papers. vol. 38(9), pp. 5038–5047.
Biermayr, P., Haas, R., 2009. A Future for Nuclear Power?, Austrian Federal Ministryfor Transport, Innovation and Technology. (Available at): ⟨http://www.nachhaltigwirtschaften.at/nw_pdf/1003_future_of_nuclear_power.pdf⟩.
Boccard, N., 2014. The cost of nuclear electricity: France after Fukushima. EnergyPolicy 66 (0), 450–461.
Braungardt, S.. Eichhammer, W., Elsland, R., Fleiter, T., Klobasa, M., Krail, M., Pfluger,B., Reuter, M., Schlomann, B., Sensfuss, F., Tariq, S., Kranzl, L., Dovidio, S., Gentili,P., 2014. Study evaluating the current energy efficiency policy framework in theEU and providing orientation on policy options for realising the cost-effectiveenergy-efficiency/saving potential until 2020 and beyond. Report for the Eur-opean Commission, Directorate-General for Energy. Available at: ⟨https://ec.europa.eu/energy/sites/ener/files/documents/2014_report_2020-2030_eu_policy_framework.pdf⟩.
Brook, B.W., et al., 2014. Why nuclear energy is sustainable and has to be part of theenergy mix. Sustain. Mater. Technol. 1–2, 8–16.
Černoch, F., Zapletalová, V., 2015. Hinkley point C: a new chance for nuclear powerplant construction in central Europe? Energy Policy 83, 165–168.
EC, 2013. EU Energy, Transport and GHG Emissions Trends to 2050-ReferenceScenario 2013, European Commission, Directorate-General for Energy, Direc-torate-General for Climate Action and Directorate-General for Mobility andTransport. Available at: ⟨http://ec.europa.eu/transport/media/publications/doc/trends-to-2050-update-2013.pdf⟩.
EC, 2014a. 2030 framework for climate and energy policies. European CommissionClimate Action. Available at: ⟨http://ec.europa.eu/clima/policies/2030/index_en.htm⟩ (Accessed 24.06.15).
EC, 2014b. State aid: Commission concludes modified UK measures for HinkleyPoint nuclear power plant are compatible with EU rules. European Commis-sion-Press Release Database. Available at: ⟨http://europa.eu/rapid/press-release_IP-14-1093_en.htm⟩ (Accessed 22.06.15).
EC, European Commission, Climate Actions, Long-term goal. Available at: ⟨http://ec.europa.eu/clima/citizens/eu/index_en.htm⟩ (Accessed 28.0.5.15).
Ecofys, 2014. Subsidies and costs of EU energy-Final report, European C ommission,Directorate - General for Energy. Available at: ⟨https://ec.europa.eu/energy/sites/ener/files/documents/ECOFYS%202014%20Subsidies%20and%20costs%20of%20EU%20energy_11_Nov.pdf⟩.
EDF, 2013. Agreement reached on commercial terms for the planned Hinkley PointC nuclear power station- Article from 21 October 2013. EDF Energy. AvailableAt: ⟨http://edfenergy.presscentre.com/News-Releases/Agreement-reached-on-commercial-terms-for-the-planned-Hinkley-Point-C-nuclear-power-station-82.aspx⟩ (Accessed 22.06.15).
Escobar Rangel, L., Leveque, F., 2015. Revisiting the Cost Escalation Curse of NuclearPower: New Lessons from the French Experience. Economics of Energy & En-vironmental Policy, 4(2). Available at: ⟨http://www.iaee.org/en/publications/eeeparticle.aspx?id¼89⟩ (Accessed 15.06.15).
Goldberg, M., 2000. Federal Energy Subsideis: Not all Technologies are CreatedEqual,´REPP-Renewable Energy Policy Project. Available at: ⟨http://www.earthtrack.net/files/repp-subsidies.pdf⟩.
Gosden, E., 2015. Nuclear delay: EDF admits Hinkley Point won’t be ready by 2023 -Telegraph. The Telegraph. Available at: ⟨http://www.telegraph.co.uk/finance/
Green-X, 2015. Deriving optimal promotion strategies for increasing the share ofRES-E in a dynamic European electricity market. Available at: ⟨http://www.green-x.at/⟩ (Accessed 15.06.15).
Grubler, A., 2010. The costs of the French nuclear scale-up: A case of negativelearning by doing. Special Section on Carbon Emissions and Carbon Manage-ment in Cities with Regular Papers. Vol. 38(9), pp. 5174–5188.
Held, A., Ragwitz, M., Boie, I., Wigand, F., Janeiro, L., Klessmann, C., Nabe, C., Hussy,C., Neuhoff, K., Grau, T., Schwenen, S., 2014. Indicators on RES support in Eur-ope. A report compiled within the Intelligent Energy Europe Project DIACORE(Policy Dialogue on the Assessment and convergence of RES Policy in EUMember States). Fraunhofer ISI, Karlsruhe, Germany.
IEA, 2010. World Energy Outlook 2010. International Energy Agency, Paris.IEA, 2013. World Energy Outlook 2013. International Energy Agency, Paris.Koplow, D., 2011. Nuclear Power: Still Not Viable without Subsidies, Union of
Concerned Scientists. Available at: ⟨http://www.ucsusa.org/sites/default/files/legacy/assets/documents/nuclear_power/nuclear_subsidies_report.pdf⟩.
Luxenburger Wort, Luxembourg to file complaint against UK nuclear power sub-sidies. Luxenburger Wort. Available at: ⟨http://www.wort.lu/en/politics/hinkley-point-c-luxembourg-to-file-complaint-against-uk-nuclear-power-subsidies-5540aa250c88b46a8ce584ac⟩ (Accessed 02.07.15).
Marignac, Y., 2014. L′échéance Des 40 ans pour LE parc nucléaire français - Pro-cessus De décision, Options De renforcement ET coûts associés à une éventuelleprolongation d′exploitation au delà De 40 ans Des réacteurs d′EDF, Available at:⟨http://www.greenpeace.org/france/PageFiles/266521/greenpeace-rapport-echeance-40-ans.pdf⟩.
Morris, C., 2013. Feed-in Tariffs For Nuclear, Anyone? Energy Transition-the GermanEnergiewende. Available At: ⟨http://energytransition.de/2013/03/feed-in-tariffs-for-nuclear-anyone/⟩ (Accessed 03.06.15).
Mraz, G., Wallner, A., Resch, G., Suna, D., 2014. Renewable Energies vs NUCLEARPower – Comparing FINANCIAL SUPpORT. a STUDY CONDUCTED bY AustrianInstitute OF Ecology AND E-THINK, WITH SUPpORT FROM Vienna OmbudsOFfICE FOR Environmental Protection. Contract No: WUA-406783/2014. Avail-able at: ⟨www.e-think.ac.at⟩.
Neslen, A., 2015. Austria to launch lawsuit over Hinkley Point C nuclear subsidies.the Guardian. Available at: ⟨http://www.theguardian.com/environment/2015/jan/21/austria-to-launch-lawsuit-hinkley-point-c-nuclear-subsidies⟩ (Accessed23.06.15).
RES LEGAL, RES LEGAL. Legal Sources on Renewable Energy. Available at: ⟨http://www.res-legal.eu/⟩ (Accessed 04.06.14).
Resch, G., Ortner, A., Panzer, C., 2014. 2030 RES targets for Europe – a brief pre-assessment of feasibility and impacts. A report compiled within the IntelligentEnergy Europe project Keep-on-Track!, coordinated by Eufores and Eclareon.TU Vienna, Energy Economics Group, Vienna, Austria, 2014. Available at: ⟨www.keepontrack.eu⟩.
Schneider, M., Froggatt, A., Ayukawa, Y., Burnie, S., Piria, R., Thomas, S., Hazemann,J., 2014. The World Nuclear Industry Status Report 2014. Paris/London/Wa-shington, D.C.
Steinhilber, S., Ragwitz, M., Rathmann, M., Klessmann, C., Noothout, P., 2011. In-dicators assessing the performance of renewable energy support policies in 27Member States. A report compiled with the Intelligent Energy Europe ProjectRE-Shaping (Shaping an Effective and Efficient European renewable energymarket). Fraunhofer ISI, Karlsruhe, Germany.
van Renssen, S., 2014. Hinkley Point C: the EU energy market will not be the sameafter this. Energy Post. Available at: ⟨http://www.energypost.eu/hinkley-point-c-eu-energy-market-will/⟩ (Accessed 02.07.15)].
WNA, 2015a. Nuclear Power in the United Kingdom. World Nuclear Association(WNA). Available at: ⟨http://www.world-nuclear.org/info/Country-Profiles/Countries-T-Z/United-Kingdom/⟩.
WNA, 2015b. US Nuclear Power Policy - Updated march 2015. World Nuclear As-sociation (WNA). Available at: ⟨http://www.world-nuclear.org/info/Country-Profiles/Countries-T-Z/USA–Nuclear-Power-Policy/⟩.
WNA, Plans For New Reactors Worldwide. World Nuclear Association (WNA).Available at: ⟨http://www.world-nuclear.org/info/Current-and-Future-Generation/Plans-For-New-Reactors-Worldwide/⟩ (Accessed 11.06.15).
Zelenika-Zovko, I., Pearce, J.M., 2011. Diverting indirect subsidies from the nuclearindustry to the photovoltaic industry: Energy and financial returns. EnergyPolicy 39 (5), 2626–2632.