Institutionen för fysik, kemi och biologi Examensarbete 16 hp Is personality dependent of growth rate in red junglefowl (Gallus gallus)? Andreas Calais LiTH-IFM- Ex--13/2794—SE Handledare: Hanne Løvlie, Linköpings universitet Assisterande handledare: Josefina Zidar, Linköpings universitet Examinator: Anders Hargeby, Linköpings universitet Institutionen för fysik, kemi och biologi Linköpings universitet 581 83 Linköping
Transcript
Institutionen för fysik, kemi och biologi
Examensarbete 16 hp
Is personality dependent of growth rate in red
junglefowl (Gallus gallus)?
Andreas Calais
LiTH-IFM- Ex--13/2794—SE
Handledare: Hanne Løvlie, Linköpings universitet
Assisterande handledare: Josefina Zidar, Linköpings universitet
Examinator: Anders Hargeby, Linköpings universitet
Institutionen för fysik, kemi och biologi
Linköpings universitet
581 83 Linköping
2
This report is a degree thesis at the Bachelors level (16 ECTS credits)
performed by the author in collaboration with two study colleagues,
Johan Almberg and Josefin Kvarnström. This cooperation included some
parts of the planning of the study, and the collection of data. Each student
has written and structured the report in all its parts individually. How the
collected data were divided is described in the section ‘Materials and
methods’ of the report.
Rapporttyp Report category
Examensarbete
C-uppsats
Språk/Language
Engelska/English
Titel/Title:
Is personality dependent of growth rate in red junglefowl (Gallus gallus)?
Författare/Author:
Andreas Calais
Sammanfattning/Abstract:
Personality has been reported in a large variety of animal species, but it is not obvious why
animals have personality. Variation in physiological traits, such as growth rate, should
theoretically affect variation in behaviours and thus can explain why we observe variation in
personalities. Growth rate is, theoretically, positively correlated with active personality types.
Empirical studies have reported this pattern in different fish species, but there are not yet many
studies on endothermic animals. I have therefore scored behaviours of 100 red junglefowl (Gallus
gallus) chicks in four personality assays; novel arena, novel object, tonic immobility, and a
proactive-reactive test, together with recording variation in growth rate of these individuals. The
chicks individual growth rate (% day-1) were calculated and the relationship between personality
and growth rate investigated. There was significant difference in growth rate between the sexes,
where males grew faster than females, detected already at one week of age. However, no
significant correlations between behavioural traits and growth rate were observed, indicating that
personality seem to be independent of growth rate. Further studies should therefore investigate the
generality of this finding, and alternative underlying mechanisms for variation in personality
Further studies are therefore needed to determine the theoretically
predicted relationship between growth rate and personality, particularly in
other species but fish. I have in this study therefore focused on links
between variation in growth rate and personality in an avian species.
In this study the relationship between personality and growth rate during
the juvenile stage was investigated in red junglefowl (Gallus gallus), the
ancestor to the domesticated chickens (Gallus gallus domesticus,
Fumihito et al. 1994). Red junglefowl are easily kept and bred in
captivity and as an endothermic animals, they should provide a better
comparison to other common model organisms than studies on fish
species.
3 Material & methods
3.1 Animals and management
In this study, I used 100 (46 males and 54 females) red junglefowl chicks
from the day they hatched and until they were about 6 weeks old. The
parents of these birds are part of a population kept and bred at Wood-
Gush animal facility of Linköping University, Sweden, since 1998. This
population originates from animals obtained from a red junglefowl
population at a zoological park in the north of Sweden (Frösö zoo), which
were originally brought from Thailand (Schütz et al. 2001). The chicks in
this study came from two batches of eggs, hatching 3 weeks apart in the
Kruijt animal facility of Linköping University. The chicks were kept in
cages with a floor area of 0.5-3 m2, increasing with the chicks’ age. The
floors of the cages were covered with wood shavings and heat lamps
were placed on a height of approximately 60 cm. Food (‘Pullfor’) and
water were always available. The light was set on a 12-12 hour cycle and
the temperature was kept around 27 ºC. During scoring of the personality
of chicks, chicks were transferred to another lab at Linköping University
where they were placed in smaller cages when not used in the study.
These cages had otherwise the same conditions as in the Kruijt animal
facility and birds were allowed acclimatisation before observations took
place. All observations took place between 19/3-16/5 2013. The
experiment and all its procedures were approved by a Swedish regional
ethical committee.
5
3.2 Experimental set-up
3.2.1 Growth rate
All chicks were weighed once a week to follow their weight gain over
time. Weights were obtained with the accuracy of 0.1 grams by the use of
a digital scale.
3.2.2 Novel arena
When the chicks were 4 weeks old they were tested in a novel arena for
investigating individual variation in exploration, activity and fearfulness
(Réale et al. 2007). Two identical arenas were used for the possibility to
test two chicks at the same time. The arenas were measuring 76x114 cm
and were made of 7 mm thick plywood with a wire net as a roof. The
floor consisted of a rubber mat, partially covered with wood shavings.
Familiar food and water containers were presented in the arenas to
obscure the view and encourage exploration. The lighting was turned off
when two chicks were carried from their cages to the two arenas. The
chicks were placed in one of the corners of the arenas and to prevent the
chicks from being disturbed by movements, two video cameras were used
and the observers viewed the film directly on two monitors about 5 m
away from the test arenas. As soon as possible after placing the chicks in
the arenas, the lighting was turned on and the recordings started.
Instantaneous recording for 10 minutes with 10 seconds intervals were
used to record behaviours such as: stand, walk, run, alert stand, alert
walk, head down, peck, groom, escape and lie down (Table 1). Latencies
to the chick started moving and vocalising, as well as total number of
escape attempts, were recorded. The arenas were divided in six imaginary
squares (38x38 cm) and the number of square changes an individual
conducted was noted to measure movement. The data from this test was
recorded together with Johan Almberg and Josefin Kvarnström, and is
also used in their theses.
3.2.3 Novel object
Immediately following the novel arena test, a novel object test was
carried out to investigate individual variation in neophobia (Réale et al.
2007). The lighting was turned off and a brown and yellow plush animal
(spherical, about 15 cm in diameter, with yellow eyes and an about 15 cm
long tail) was placed in the opposing corner from the chick. After this, the
same procedure as in the novel arena test followed and the same
behaviours were recorded for 10 minutes (Table 1). The data from this
test was recorded together with Johan Almberg and Josefin Kvarnström,
and is also used in their theses.
6
3.2.4 Tonic immobility
The day after the novel arena and novel object tests each chick were
tested for tonic immobility, used as a measure of variation in fearfulness
(Forkman et al. 2007). The chicks were one by one placed on their backs
in a V-shaped wooden stand in a dimmed room and a slight pressure was
applied on the chicks’ breasts for 15 seconds by the observer’s hand to
induce tonic immobility. Another hand was placed over the chick’s head
to calm it down. The latency for the chicks to start moving their heads
and the latency to jump back up on its feet were noted. The chicks were
given three attempts to enter tonic immobility and if they did not succeed,
the time 0 seconds was noted. If a chick jumped back up on its feet in less
than 3 seconds it was tested again. If a chick stayed in tonic immobility
for 10 minutes, the test was interrupted and the maximum time was noted
(600 seconds). The data from this test was collected by Josefin
Kvarnström, and was also used in her thesis.
3.2.5 Proactive-reactive
When the chicks were 5 weeks old, 56 (29 males and 27 females) of them
were trained and tested in a U-shaped arena for routine building and
response to broken routines. This was done to capture individual variation
along the proactive-reactive gradient, where more reactive individuals
form a routine slower compared to more proactive individuals, but show
more flexible responses if the routine is broken (Koolhaas et al. 1999).
The arena was measuring 76x114 cm and were made of 7 mm thick
plywood with a wire net as a roof (Figure 1). A wall (wire net the first 18
cm and plywood the last 72 cm) divided the arena in two corridors (38
cm wide), which created the shape of a U. In one of the ends of the U, an
extra box of 38x38 cm was placed as a start position for the chicks. The
floor consisted of a rubber mat partially covered with wood shavings.
Meal worms were offered in a plastic dish behind the plywood wall, out
of sight from the chicks start position (Figure 1). During the tests, two
video cameras were used to be able to observe the chick without
disturbing it and the observers viewed the film directly on two monitors
behind a screen about 5 m away from the test arena. The arena was
divided in seven imaginary squares (38x38 cm) and the number of square
changes was noted to measure movement. The chicks were trained to run
around the U-shaped arena to get the meal worms by showing them the
right route with the use of the observers’ hands and meal worms. When a
chick successfully ran from the start position directly to the meal worms
without turning around, five times in a row, it was considered to have
formed a routine. The number of training sessions required to form the
routine was noted, which enabled estimation of routine building of
7
individuals. When the routine was formed, a shortcut through the arena
was opened by removing the wire net between the corridors and a wall of
wire net was inserted right around the corner of the U to block the
original route (Figure 1b). The chick was once again placed at the starting
position and the time it took for the chick to find the shortcut was
recorded, together with the response individuals had on the routine being
broken. Instantaneous recording with 10 seconds intervals were used,
until the chick had found the meal worms, to capture the same behaviours
as in the novel arena and novel object tests (Table 1). Also the latency for
the chicks to start stress vocalising (for more details and sonogram see
Collias 1987) was noted. The data from this test was recorded together
with Johan Almberg, and is also used in his thesis.
Figure 1. Sketch of the arena for a) the proactive-reactive training, and b) the proactive-reactive test of red junglefowl chicks. Thick black lines represents plywood walls, thick grey double lines represents wire net walls, thin grey dotted lines represents the imaginary division of the arena. The grey circle shows the placement of the meal worm dish.
a) b)
8
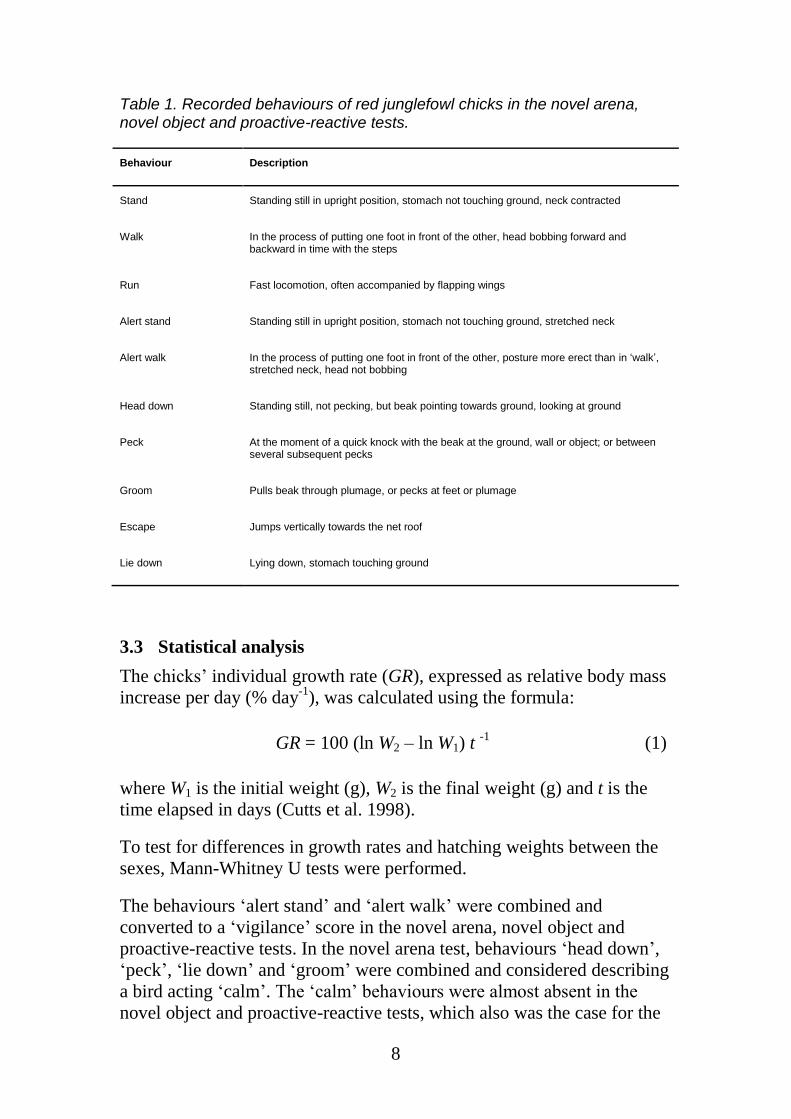
Table 1. Recorded behaviours of red junglefowl chicks in the novel arena, novel object and proactive-reactive tests.
Behaviour Description
Stand Standing still in upright position, stomach not touching ground, neck contracted
Walk In the process of putting one foot in front of the other, head bobbing forward and backward in time with the steps
Run Fast locomotion, often accompanied by flapping wings
Alert stand Standing still in upright position, stomach not touching ground, stretched neck
Alert walk In the process of putting one foot in front of the other, posture more erect than in ‘walk’, stretched neck, head not bobbing
Head down Standing still, not pecking, but beak pointing towards ground, looking at ground
Peck At the moment of a quick knock with the beak at the ground, wall or object; or between several subsequent pecks
Groom Pulls beak through plumage, or pecks at feet or plumage
Escape Jumps vertically towards the net roof
Lie down Lying down, stomach touching ground
3.3 Statistical analysis
The chicks’ individual growth rate (GR), expressed as relative body mass
increase per day (% day-1
), was calculated using the formula:
GR = 100 (ln W2 – ln W1) t -1
(1)
where W1 is the initial weight (g), W2 is the final weight (g) and t is the
time elapsed in days (Cutts et al. 1998).
To test for differences in growth rates and hatching weights between the
sexes, Mann-Whitney U tests were performed.
The behaviours ‘alert stand’ and ‘alert walk’ were combined and
converted to a ‘vigilance’ score in the novel arena, novel object and
proactive-reactive tests. In the novel arena test, behaviours ‘head down’,
‘peck’, ‘lie down’ and ‘groom’ were combined and considered describing
a bird acting ‘calm’. The ‘calm’ behaviours were almost absent in the
novel object and proactive-reactive tests, which also was the case for the
9
behaviour ‘freeze’. These behaviours were therefore not analysed further.
The behaviours in this study were chosen because they have been showed
to be consist over time and/or context, which means they indicate
personality types (R = 0.27 - 0.51, data presented by Johan Almberg,
LiTH-IFM- Ex--13/2787—SE, and Josefin Kvarnström, LiTH-IFM- Ex--
13/2795—SE). The different behaviours from the tests were all tested
against growth rate by the use of Spearman rank correlations. All
Hatching weights did not differ between the sexes (males: 29.4 ± 0.35 g,
females: 29.0 ± 0.30 g, Z = 0.67, P = 0.500, n = 100). However, growth
rate differed significantly between the sexes, with males growing faster
than females already at 1 week of age (Figure 2). Therefore, further
analyses were performed for males and females separately.
Figure 2. Comparison of growth rate (mean ± SE) between male and female red junglefowl chicks at different ages (7-34 days of age; 7 days: Z = 3.67, 14 days: Z = 5.22, 20 days: Z = 6.71, 27 days: Z = 6.75, 34 days: Z = 7.22. All P < 0.001 and n = 100).
The number of training sessions required for an individual to form a
routine in the proactive-reactive test showed a significant positive
correlation with growth rate in females (Figure 3a). However, this
correlation was no longer significant when two extremely low values
were removed (Figure 3b). None of the other behaviours showed
significant correlations with growth rate (Table 2).
***
*** ***
***
***
2.0
4.0
6.0
8.0
7 14 20 27 34
Gro
wth
rate
(%
day
-1)
Age (days)
Males
Females
10
Figure 3. The relationship between growth rate and the number of training sessions required for female red junglefowl chicks to form a routine in the proactive-reactive test. a) R = 0.44, P = 0.021, n = 27, b) two outliers removed, R = 0.32, P = 0.119, n = 25.
Some behaviours tended to show non-significant directions in there
correlations with growth rate, with different patterns observed for males
and females. In the novel arena test, growth rate tended to be negatively
correlated to the behaviour ‘walk’ in females, while there was no
correlation at all observed for this behaviour in males (Table 2). In the
novel object test, there tended to be a positive correlation between growth
rate and the latency to interact with the novel object in females, but males
did not show any correlation (Table 2). In the proactive-reactive test, the
behaviour ‘walk’ tended to be negatively correlated to growth rate in
females (Table 2) and the number of training sessions required for an
individual to form a routine was positively correlated with growth rate in
females (Figure 3). Males did not show any correlations for these traits
(Table 2). The number of square changes per second in the proactive-
reactive test tended to show a negative correlation in females and no
correlation in males (Table 2).
0
25
50
75
3.9 4.9 5.9
Num
ber
of
train
ings
0
25
50
75
3.9 4.9 5.9
Growth rate (% day -1)
a) b)
11
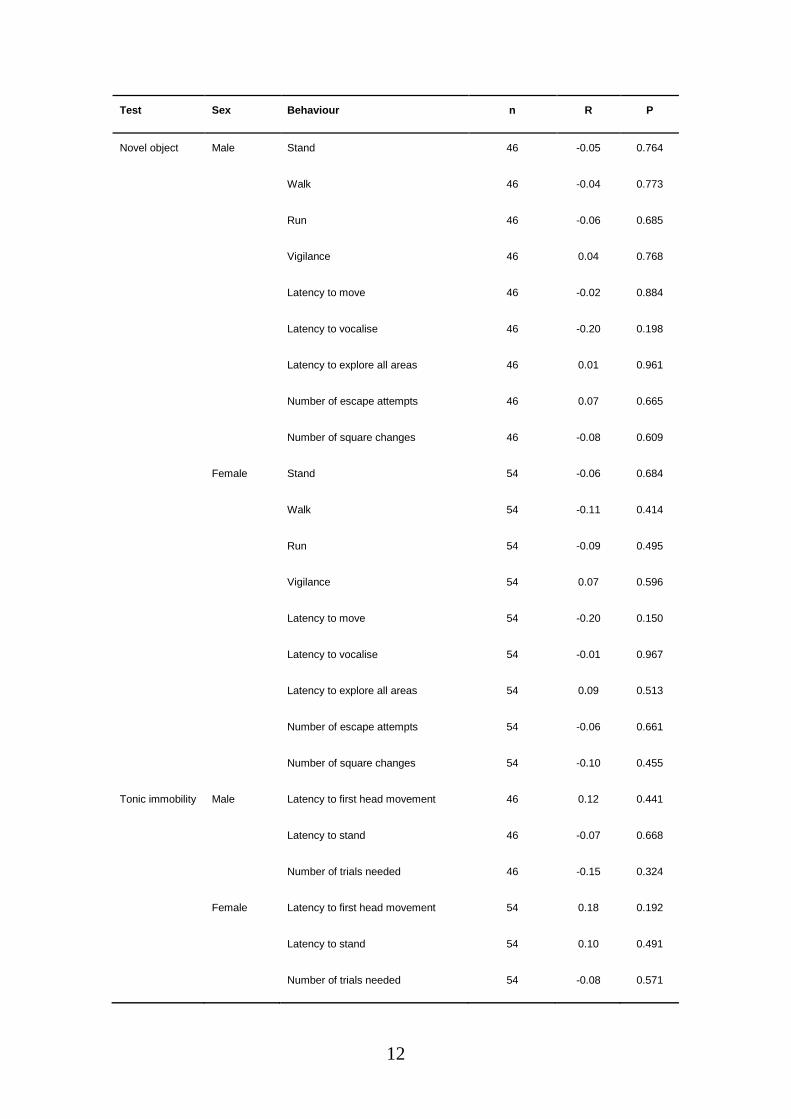
Table 2. The relationship between growth rate and behaviours from the four tests red junglefowl chicks were exposed to. n, R and P values are obtained from the Spearman rank correlations. Significant correlations are symbolised with an asterisk *.
Test Sex Behaviour n R P
Novel arena Male Stand 46 0.19 0.218
Walk 46 0.01 0.951
Run 46 -0.16 0.282
Vigilance 46 -0.19 0.206
Calm 46 0.11 0.471
Freeze 46 -0.02 0.875
Latency to move 46 0.21 0.162
Latency to vocalise 46 0.03 0.818
Latency to explore all areas 46 -0.02 0.873
Number of escape attempts 46 0.11 0.473
Number of square changes 46 -0.05 0.751
Female Stand 54 -0.10 0.494
Walk 54 -0.23 0.093
Run 54 -0.05 0.720
Vigilance 54 0.08 0.578
Calm 54 0.01 0.952
Freeze 54 -0.01 0.939
Latency to move 54 0.21 0.128
Latency to vocalise 54 -0.02 0.897
Latency to explore all areas 54 0.25 0.072
Number of escape attempts 54 -0.16 0.261
Number of square changes 54 -0.01 0.971
12
Test Sex Behaviour n R P
Novel object Male Stand 46 -0.05 0.764
Walk 46 -0.04 0.773
Run 46 -0.06 0.685
Vigilance 46 0.04 0.768
Latency to move 46 -0.02 0.884
Latency to vocalise 46 -0.20 0.198
Latency to explore all areas 46 0.01 0.961
Number of escape attempts 46 0.07 0.665
Number of square changes 46 -0.08 0.609
Female Stand 54 -0.06 0.684
Walk 54 -0.11 0.414
Run 54 -0.09 0.495
Vigilance 54 0.07 0.596
Latency to move 54 -0.20 0.150
Latency to vocalise 54 -0.01 0.967
Latency to explore all areas 54 0.09 0.513
Number of escape attempts 54 -0.06 0.661
Number of square changes 54 -0.10 0.455
Tonic immobility Male Latency to first head movement 46 0.12 0.441
Latency to stand 46 -0.07 0.668
Number of trials needed 46 -0.15 0.324
Female Latency to first head movement 54 0.18 0.192
Latency to stand 54 0.10 0.491
Number of trials needed 54 -0.08 0.571
13
Test Sex Behaviour n R P
Proactive-reactive
Male Number of trainings 29 0.04 0.824
Walk 29 0.06 0.770
Vigilance 29 0.07 0.729
Time to find the meal worms 29 0.07 0.724
Square changes per second 29 0.18 0.346
Female Number of trainings 27 0.44 0.021*a
Walk 27 -0.33 0.093
Vigilance 27 0.30 0.130
Time to find the meal worms 27 0.23 0.251
Square changes per second 27 -0.28 0.163
a) See Figure 3 for more details
5 Discussion
Contrary to what was theoretically predicted (Stamps 2007), the results of
this study indicate that personality is not affected by variation in
individual growth rate, and it is one of few studies to show this,
especially in endotherms.
There was a significant difference in growth rate between the sexes, with
males growing faster than females. This could be seen as early in life as
at the age of 1 week and up to the age of 5 weeks, which were the last
time chicks were weight in this experiment (Figure 2). A difference in
growth rate between the sexes is however not surprising. There is a
sexual dimorphism in red junglefowl and males need to grow bigger in
the same time as females (Parker & Garant 2005). The pattern revealed in
this study, with no difference in hatching weights between the sexes but
differences in juvenile growth rate have been reported for avian species
before (Richter 1983; Mignon-Grasteau et al. 1999; Weimerskirch et al.
2000). Oddie and colleagues (2000) reported a significant body mass
difference between the sexes in 9 days old great tits (Parus major), with
males being heavier. At the age of 2 days, the sexes did not differ in body
mass, which indicate a difference in growth rate almost as early in life as
the one found in my study (Oddie et al. 2000).
14
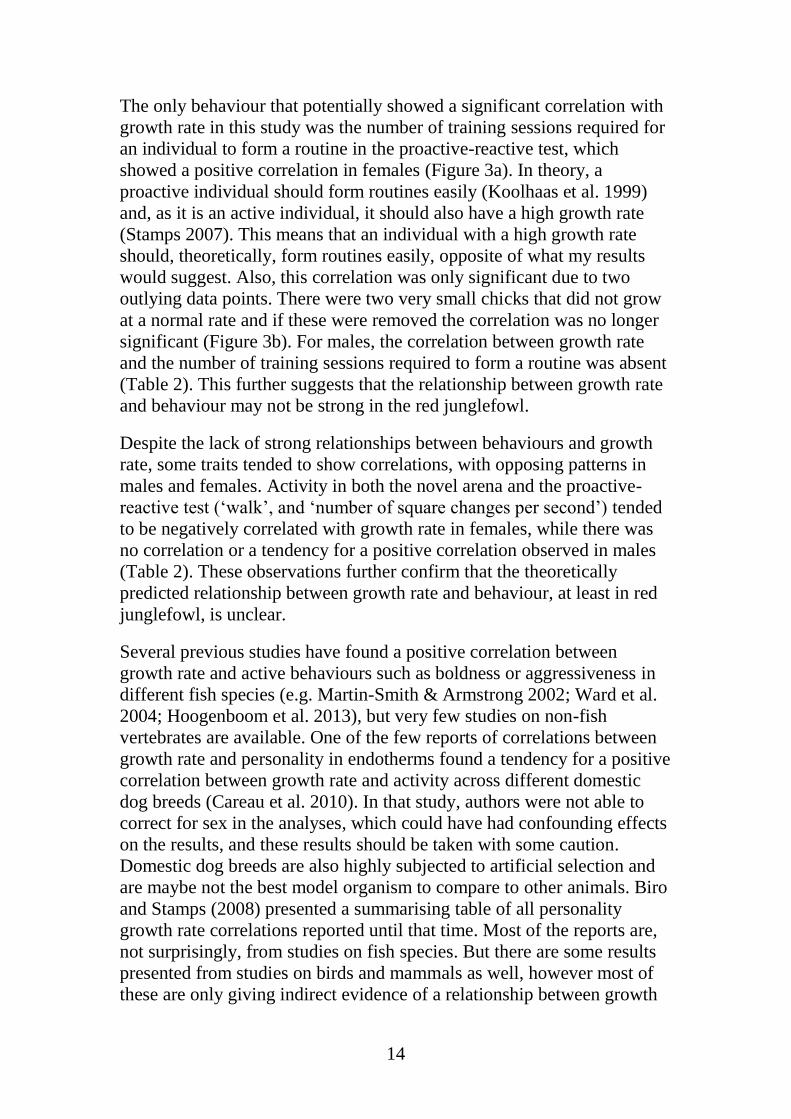
The only behaviour that potentially showed a significant correlation with
growth rate in this study was the number of training sessions required for
an individual to form a routine in the proactive-reactive test, which
showed a positive correlation in females (Figure 3a). In theory, a
proactive individual should form routines easily (Koolhaas et al. 1999)
and, as it is an active individual, it should also have a high growth rate
(Stamps 2007). This means that an individual with a high growth rate
should, theoretically, form routines easily, opposite of what my results
would suggest. Also, this correlation was only significant due to two
outlying data points. There were two very small chicks that did not grow
at a normal rate and if these were removed the correlation was no longer
significant (Figure 3b). For males, the correlation between growth rate
and the number of training sessions required to form a routine was absent
(Table 2). This further suggests that the relationship between growth rate
and behaviour may not be strong in the red junglefowl.
Despite the lack of strong relationships between behaviours and growth
rate, some traits tended to show correlations, with opposing patterns in
males and females. Activity in both the novel arena and the proactive-
reactive test (‘walk’, and ‘number of square changes per second’) tended
to be negatively correlated with growth rate in females, while there was
no correlation or a tendency for a positive correlation observed in males
(Table 2). These observations further confirm that the theoretically
predicted relationship between growth rate and behaviour, at least in red
junglefowl, is unclear.
Several previous studies have found a positive correlation between
growth rate and active behaviours such as boldness or aggressiveness in
different fish species (e.g. Martin-Smith & Armstrong 2002; Ward et al.
2004; Hoogenboom et al. 2013), but very few studies on non-fish
vertebrates are available. One of the few reports of correlations between
growth rate and personality in endotherms found a tendency for a positive
correlation between growth rate and activity across different domestic
dog breeds (Careau et al. 2010). In that study, authors were not able to
correct for sex in the analyses, which could have had confounding effects
on the results, and these results should be taken with some caution.
Domestic dog breeds are also highly subjected to artificial selection and
are maybe not the best model organism to compare to other animals. Biro
and Stamps (2008) presented a summarising table of all personality
growth rate correlations reported until that time. Most of the reports are,
not surprisingly, from studies on fish species. But there are some results
presented from studies on birds and mammals as well, however most of
these are only giving indirect evidence of a relationship between growth
15
rate and personality. The authors listed two studies on avian species;
japanese quail (Coturnix coturnix japonica) and turkeys (Meleagris
gallopavo). However, Biro and Stamps (2008) used a correlation between
body mass and growth rate in quail (Yang et al. 1998) as support for a
relationship between personality and growth rate. Body mass may not be
a good estimate of growth rate in birds, since birds only grow up until
sexual maturation and is also a trait shown to have a relatively strong
genetic component (van Noordwijk et al. 1988). The example presented
on turkeys (Huff et al. 2007) showed a correlation between growth rate
and activity across different breeds (selected for meat or egg production),
thus the relationship was neither here based on actually measures of
growth rates. The reports listed by Biro and Stamps (2008) of personality
growth rate correlations in mammals mainly consist of studies on cattle.
The only trait authors have used to estimate personality have been flight
speed (away from humans, when humans are approaching), as a
measurement of temperament (another term typically used for
personality). A low flight speed should be an indication of a calm
temperament and are correlated with a higher average daily gain. Biro
and Stamps (2008) also listed some studies on mice (selected for a high
or low body mass over 90-108 generations) that showed correlations
between exploratory behaviour/activity and growth rate (see references in
Biro & Stamps 2008). When artificially selecting for only one trait, other
correlated traits can unintendently change and the slow-growing mice
showed a highly increased level of anxiety (Wirth-Dzięciolowska et al.
2005). The reports of personality growth rate correlations are mainly not
from data on individuals, but from data comparing different breeds of a
species. Taken together, the current reports of a relationship between
variation in growth rate and personality of individuals are therefore
scares.
My results suggest that growth rate is not a trait affecting personality
strongly and further studies are needed to explore this predicted
relationship further, together with studies aiming to determine which
physiological traits that actually may have a relationship with personality,
if growth rate show limited influences. A candidate trait for further
studies is for example variation in metabolic rate and personality. Biro
and Stamps (2010) published a literature review which revealed a
positive correlation between basal metabolic rate, resting metabolic rate
or standard metabolic rate and personality traits in fish, birds, mammals,
crustaceans and insects. After that, several reports confirmed such a
positive relationship (Careau et al. 2011; Killen et al. 2011, 2012; Martins
et al. 2011). But even these results are only weakly supported on an
individual level (Careau & Garland 2012) and other reports have not
16
found correlations between personality and metabolic rate (Kane et al.
2008; Lantová et al. 2011). If the relationships between personality and
underlying physiological traits are as unclear as they seems to be, new
ideas are encouraged to explain how personality can be considered an
adaptation and maintained in populations, thus to overall improve our
understanding of why animals have personality.
5.1 Conclusion
In conclusion, this report suggests that personality is not explained by
variation in growth rate among individual red junglefowl chicks, and
these results are of relevance for other vertebrate species complementing
the previous reports of personality growth rate correlations in fish
species.
6 Acknowledgements
I would like to thank my supervisors Hanne Løvlie and Josefina Zidar for
all their help and encouragement during the project. I would also like to
thank Alexandra Balogh, Johan Almberg, Josefin Kvarnström and Elena
Plana for a great teamwork with the behavioural assays.
7 References
Biro PA, Stamps JA (2008) Are animal personality linked to life-history
productivity? Trends in Ecology and Evolution 23, 361-368
Biro PA, Stamps JA (2010) Do consistent individual differences in
metabolic rate promote consistent individual differences in behavior?
Trend in Ecology and Evolution 25, 653-659
Boissy A (1995) Fear and fearfulness in animals. The Quarterly Review
of Biology 70, 165-191
Careau V, Garland Jr. T (2012) Performance, personality, and energetics:
correlation, causation, and mechanism. Physiological and Biochemical
Zoology 85, 543-571
Careau V, Réale D, Humphries MM, Thomas DW (2010) The pace of life
under artificial selection: Personality, energy expenditure, and longevity
are correlated in domestic dogs. The American Naturalist 175, 753-758
Careau V, Thomas D, Pelletier F, Turki L, Landry F, Garant D, Réale D
(2011) Genetic correlation between resting metabolic rate and
exploratory behaviour in deer mice (Peromyscus maniculatus). Journal of