Monthly Real Estate Monitor - June 2013 Is The Indian SEZ Story Faltering? The government has recently done away with the minimum land requirement for SEZs whilst also reducing specified minimum built- up areas. In addition to this, taxes are also being imposed on SEZs while they are generally tax free zones worldwide. Although the SEZs in India have shown a good revenue growth (USD 66 billion in 2012 –2013; 23% of India’s total exports) and are still in a nascent stage compared with those in China, this is a good time to take a look into the current ground situation. The Original SEZ Story In 2005, when the SEZ Act was introduced, it was hailed as a progressive step towards creating infrastructure and employment enclaves that would put the economy on the fast track to growth. In the past seven years, the SEZ performance in India has produced a mixed bag of result. The “China SEZ Model” and its success was considered the benchmark for improving export competitiveness, creating new jobs, increasing GDP and attracting more foreign investment .The idea was also to jump-start the development of secondary cities as engines of growth and employment. This would not only provide for a more inclusive development but also act as a buffer against the increasing pressure of population migration in the metro cities. The most visible fact is that of the 140 odd SEZs that became operational after the promulgation of the SEZ Act of 2005, nearly 90 were for the IT/ITeS business. This shows that such SEZs were another step in providing incentives to an already growing industry. The number of manufacturing SEZs was much lower and represented a lost opportunity. Also, as many as 33 approved SEZs applied for de-notification between 2008 and 2011 as they faced low demand amidst the economic slowdown of this period. Present Scenario There were certain decisions taken that, in hindsight, can be seen to have impacted the SEZ story. The imposition of minimum alternate tax (MAT) and dividend distribution tax (DDT) on SEZ entities has been much debated, since worldwide SEZs are generally tax-free enclaves. Their imposition was contrary to the initial idea of promoting SEZs, and a positive industrial policy change might have been more helpful. Financial incentives with proactive policy reforms go a long way in promoting new industry initiatives, and one without the other causes below-par results. In addition, benefits under the reward schemes, plus duty drawbacks on the freight on board (FOB) value of domestic tariff area (DTA) exports far outweigh the attraction of income tax benefits under the SEZ scheme. As a result, there is a lesser possibility of the entrepreneurs opting to set up manufacturing or service units under SEZ. Grade A Capital Value Office Retail Residential Delhi NCR Mumbai Bangalore Chennai Pune Hyderabad Kolkata Rental Value Figure 1: Financial Indicators Deal of the Month Alchemist, a Delhi-based real estate developer, has bought 20 acres of prime land in the Aerotropolis being developed by Bengal Aerotropolis at Durgapur, 180 km from Kolkata. What’s New!! India would be using Japanese bullet train technology for a high-speed connection between Mumbai and Ahmedabad. The governments of India and Japan are planning to finish technological reviews and costing by March 2014 for this. Green Wall The Indian Green Building Council (IGBC) has launched the first-of-its-kind Rating System to address sustainability aspects in existing buildings. .
Transcript
Monthly Real Estate Monitor - June 2013Monthly Real Estate Monitor – June 2013
Is The Indian SEZ Story Faltering?The government has recently done away with the minimum land requirement for SEZs whilst also reducing specified minimum built-up areas. In addition to this, taxes are also being imposed on SEZs while they are generally tax free zones worldwide. Although the SEZs in India have shown a good revenue growth (USD 66 billion in 2012 –2013; 23% of India’s total exports) and are still in a nascent stage compared with those in China, this is a good time to take alook into the current ground situation.
The Original SEZ Story
In 2005, when the SEZ Act was introduced, it was hailed as a progressive step towards creating infrastructure and employment enclaves that would put the economy on the fast track to growth. In the past seven years, the SEZ performance in India has produced a mixed bag of result. The “China SEZ Model” and its success was considered the benchmark for improving export competitiveness, creating new jobs, increasing GDP and attracting more foreign investment .The idea was also to jump-start the development of secondary cities as engines of growth and employment. This would not only provide for a more inclusive development but also act as a buffer against the increasing pressure of population migration in themetro cities.
The most visible fact is that of the 140 odd SEZs that became operational after the promulgation of the SEZ Act of 2005, nearly 90 were for the IT/ITeS business. This shows that such SEZs were another step in providing incentives to an already growing industry. The number of manufacturing SEZs was much lower and represented a lost opportunity. Also, as many as 33 approved SEZs applied for de-notification between 2008 and 2011 as they faced low demand amidst the economic slowdown of this period.
Present Scenario
There were certain decisions taken that, in hindsight, can be seen to have impacted the SEZ story. The imposition of minimum alternate tax (MAT) and dividend distribution tax (DDT) on SEZ entities has been much debated, since worldwide SEZs are generally tax-free
enclaves. Their imposition was contrary to the initial idea of promoting SEZs, and a positive industrial policy change might have been more helpful. Financial incentives with proactive policy reforms go a long way in promoting new industry initiatives, and one without the other causes below-par results.
In addition, benefits under the reward schemes, plus duty drawbacks on the freight on board (FOB) value of domestic tariff area (DTA) exports far outweigh the attraction of income tax benefits under the SEZ scheme. As a result, there is a lesser possibility of the entrepreneurs opting to set up manufacturing or service units under SEZ.
Grade A Capital ValueOffice Retail Residential
Delhi NCR
Mumbai
Bangalore
Chennai
Pune
Hyderabad
Kolkata
Rental ValueFigure 1: Financial Indicators
Deal of the MonthAlchemist, a Delhi-based real estate developer, has bought 20 acres of prime land in the Aerotropolis
being developed by Bengal Aerotropolis at Durgapur,
180 km from Kolkata.
What’s New!!India would be using Japanesebullet train technology for a
high-speed connection between Mumbai and Ahmedabad. The governments of India and Japan
are planning to finish technological reviews and
costing by March 2014 for this.
Green WallThe Indian Green Building
Council (IGBC) has launched the first-of-its-kind Rating System
to address sustainability aspects in existing buildings.
.
Monthly Real Estate Monitor - June 2013
Pulse •Research Dynamics•2012
The present scenario in the country with the growing services sector contribution to GDP (over 62% in 2012) does argue in favour of promoting IT SEZs. However, the idea behind tax-free enclaves is also to provide a push to domestic industry to improve its export competitiveness. And it can be concluded that this promotion of smaller SEZs compared to China was skewed in favour of plain real estate development rather than creating mega-industrial cities with excellent infrastructure.
The Pathway to an Alternative Future
Recent policy developments, such as the Maharashtra Industrial Policy which allows cancelled SEZs to utilise 40% of their areas for residential and commercial purposes and the remainder for industrial use, look to create integrated industrial estates that may yet offer some hope for the future.
Monthly Real Estate Monitor - June 2013Monthly Real Estate Monitor – June 2013
BangaloreOffice transaction activity in May continued to remain moderate. However, the restricted supply coupled with the demand was instrumental in reducing the vacancy rate. The major transactions in
the month included leasing by Huawei Technologies and Juniper Networks. Pritech Park Block 11 and Block 12 were the new completions of the month. Rents continued to remain stable across the city. However, the capital values appreciated marginally across all submarkets.
The consumer demand continued to be stable in Bangalore during May. The vacancy levels continued its marginal decline on the back of the absence of new completions. Some of the major transactions in
the city included leasing by Jockey and Kate Moss. Rents andcapital values both continued to remain unaltered in the city during May.
Bangalore’s residential market exhibited continued steady demand. The city witnessed increase in the number of launches. The landmark projects launched during the month include Tata Riva by
Tata Housing, Kolte Patil Mirabilis by Kolte-Patil Developers andKlassik Landmark by Klassik Developers. Rents and capital values witnessed nominal increase across the city. The capital values are forecast to be stable and rents for residential property in the city are predicted to witness marginal appreciation during this year.
Office Rents Capital Value
Key PrecinctsINR per sq ft per
month INR per sq ftCBD 48–55 5,500–6,500Old Airport Road 60–65 6,000–7,000Outer Ring Road (Eastern) 46–52 4,700–6,000Old Madras Road 30–34 3,000–3,500Electronic City 26–28 2,500–3,000
Retail Rents Capital Value
Key PrecinctsINR per sq ft per
month INR per sq ftKoramangala 80–150 9,000–16,000Indiranagar 90–180 12,000–18,000New BEL Road 50 – 80 6,000–10,000Commercial Street 175–250 16,000–20,000Jayanagar 80–120 7,000–15,000
Residential Rents Capital Value
Key Precincts
INR per month for a 1,000 sq ft 2BHK apartment INR per sq ft
INFRASTRUCTURE ONGOING>> State government had entrusted the Karnataka Industrial Areas Development (KIADB) to acquire land for BMRCL to implement Phase II. As per estimates, BMRCL will spend INR 2 billion for the land acquisition. The new phase has a total length of 72 km and will have four extensions of existing project — Mysore Road Terminal to Kengeri (6.5 km), Byappanahalli to Whitefield (15 km), Hesaraghatta cross to BIEC (3.7 km), Puttenahalli Cross to Anjanapura Township (up to NICE road) and two new lines – IIMB to Nagawara (21 km including 13.8 km underground stretch) and RV Road to Bommasandra (18.8 km).
Monthly Real Estate Monitor - June 2013Monthly Real Estate Monitor – June 2013
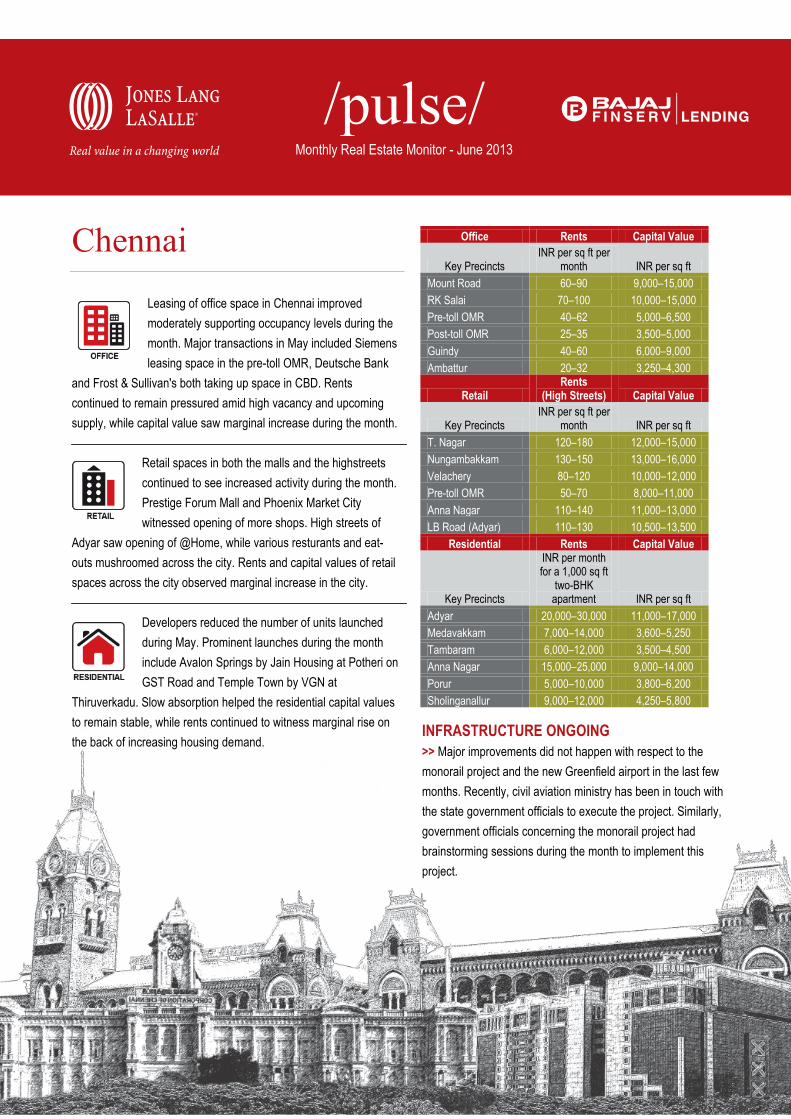
ChennaiLeasing of office space in Chennai improved moderately supporting occupancy levels during the month. Major transactions in May included Siemens leasing space in the pre-toll OMR, Deutsche Bank
and Frost & Sullivan's both taking up space in CBD. Rents continued to remain pressured amid high vacancy and upcoming supply, while capital value saw marginal increase during the month.
Retail spaces in both the malls and the highstreets continued to see increased activity during the month. Prestige Forum Mall and Phoenix Market City witnessed opening of more shops. High streets of
Adyar saw opening of @Home, while various resturants and eat-outs mushroomed across the city. Rents and capital values of retail spaces across the city observed marginal increase in the city.
Developers reduced the number of units launched during May. Prominent launches during the month include Avalon Springs by Jain Housing at Potheri onGST Road and Temple Town by VGN at
Thiruverkadu. Slow absorption helped the residential capital values to remain stable, while rents continued to witness marginal rise on the back of increasing housing demand.
INFRASTRUCTURE ONGOING>> Major improvements did not happen with respect to the monorail project and the new Greenfield airport in the last few months. Recently, civil aviation ministry has been in touch with the state government officials to execute the project. Similarly, government officials concerning the monorail project had brainstorming sessions during the month to implement this project.
Monthly Real Estate Monitor - June 2013Monthly Real Estate Monitor – June 2013
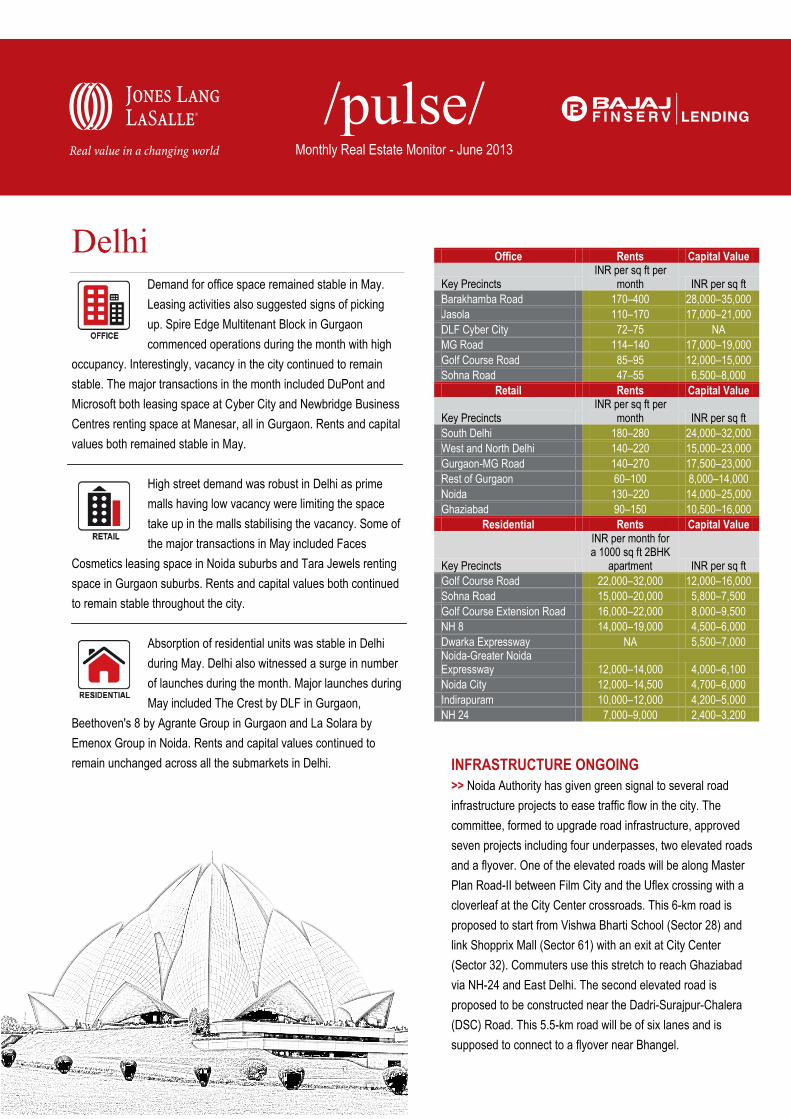
DelhiDemand for office space remained stable in May.Leasing activities also suggested signs of picking up. Spire Edge Multitenant Block in Gurgaon commenced operations during the month with high
occupancy. Interestingly, vacancy in the city continued to remain stable. The major transactions in the month included DuPont andMicrosoft both leasing space at Cyber City and Newbridge Business Centres renting space at Manesar, all in Gurgaon. Rents and capital values both remained stable in May.
High street demand was robust in Delhi as prime malls having low vacancy were limiting the space take up in the malls stabilising the vacancy. Some of the major transactions in May included Faces
Cosmetics leasing space in Noida suburbs and Tara Jewels rentingspace in Gurgaon suburbs. Rents and capital values both continued to remain stable throughout the city.
Absorption of residential units was stable in Delhi during May. Delhi also witnessed a surge in number of launches during the month. Major launches during May included The Crest by DLF in Gurgaon,
Beethoven's 8 by Agrante Group in Gurgaon and La Solara by Emenox Group in Noida. Rents and capital values continued to remain unchanged across all the submarkets in Delhi.
INFRASTRUCTURE ONGOING>> Noida Authority has given green signal to several road infrastructure projects to ease traffic flow in the city. The committee, formed to upgrade road infrastructure, approved seven projects including four underpasses, two elevated roads and a flyover. One of the elevated roads will be along Master Plan Road-II between Film City and the Uflex crossing with a cloverleaf at the City Center crossroads. This 6-km road is proposed to start from Vishwa Bharti School (Sector 28) and link Shopprix Mall (Sector 61) with an exit at City Center (Sector 32). Commuters use this stretch to reach Ghaziabad via NH-24 and East Delhi. The second elevated road is proposed to be constructed near the Dadri-Surajpur-Chalera (DSC) Road. This 5.5-km road will be of six lanes and is supposed to connect to a flyover near Bhangel.
Monthly Real Estate Monitor - June 2013Monthly Real Estate Monitor – June 2013
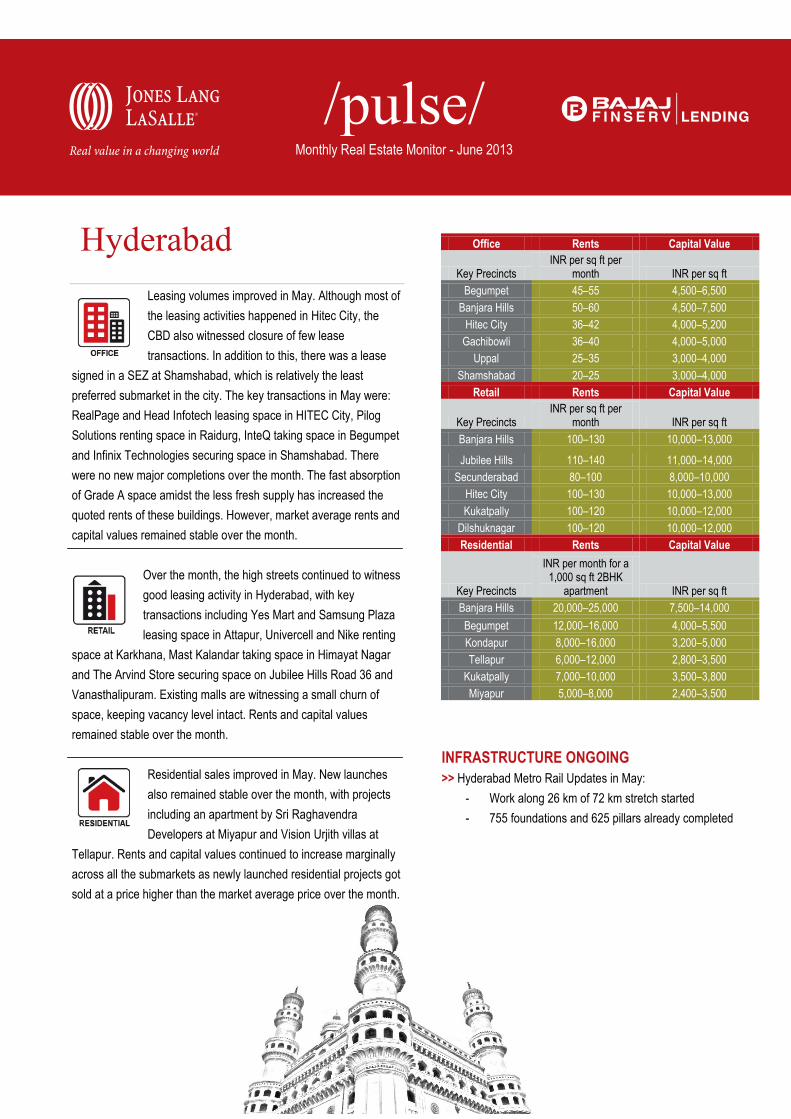
HyderabadLeasing volumes improved in May. Although most of the leasing activities happened in Hitec City, the CBD also witnessed closure of few lease transactions. In addition to this, there was a lease
signed in a SEZ at Shamshabad, which is relatively the least preferred submarket in the city. The key transactions in May were:RealPage and Head Infotech leasing space in HITEC City, Pilog Solutions renting space in Raidurg, InteQ taking space in Begumpet and Infinix Technologies securing space in Shamshabad. There were no new major completions over the month. The fast absorption of Grade A space amidst the less fresh supply has increased the quoted rents of these buildings. However, market average rents andcapital values remained stable over the month.
Over the month, the high streets continued to witness good leasing activity in Hyderabad, with key transactions including Yes Mart and Samsung Plaza leasing space in Attapur, Univercell and Nike renting
space at Karkhana, Mast Kalandar taking space in Himayat Nagarand The Arvind Store securing space on Jubilee Hills Road 36 and Vanasthalipuram. Existing malls are witnessing a small churn of space, keeping vacancy level intact. Rents and capital values remained stable over the month.
Residential sales improved in May. New launches also remained stable over the month, with projects including an apartment by Sri Raghavendra Developers at Miyapur and Vision Urjith villas at
Tellapur. Rents and capital values continued to increase marginally across all the submarkets as newly launched residential projects got sold at a price higher than the market average price over the month.
Office Rents Capital Value
Key PrecinctsINR per sq ft per
month INR per sq ftBegumpet 45–55 4,500–6,500
Banjara Hills 50–60 4,500–7,500Hitec City 36–42 4,000–5,200
INFRASTRUCTURE ONGOING>> Hyderabad Metro Rail Updates in May:
- Work along 26 km of 72 km stretch started- 755 foundations and 625 pillars already completed
Monthly Real Estate Monitor - June 2013Monthly Real Estate Monitor – June 2013
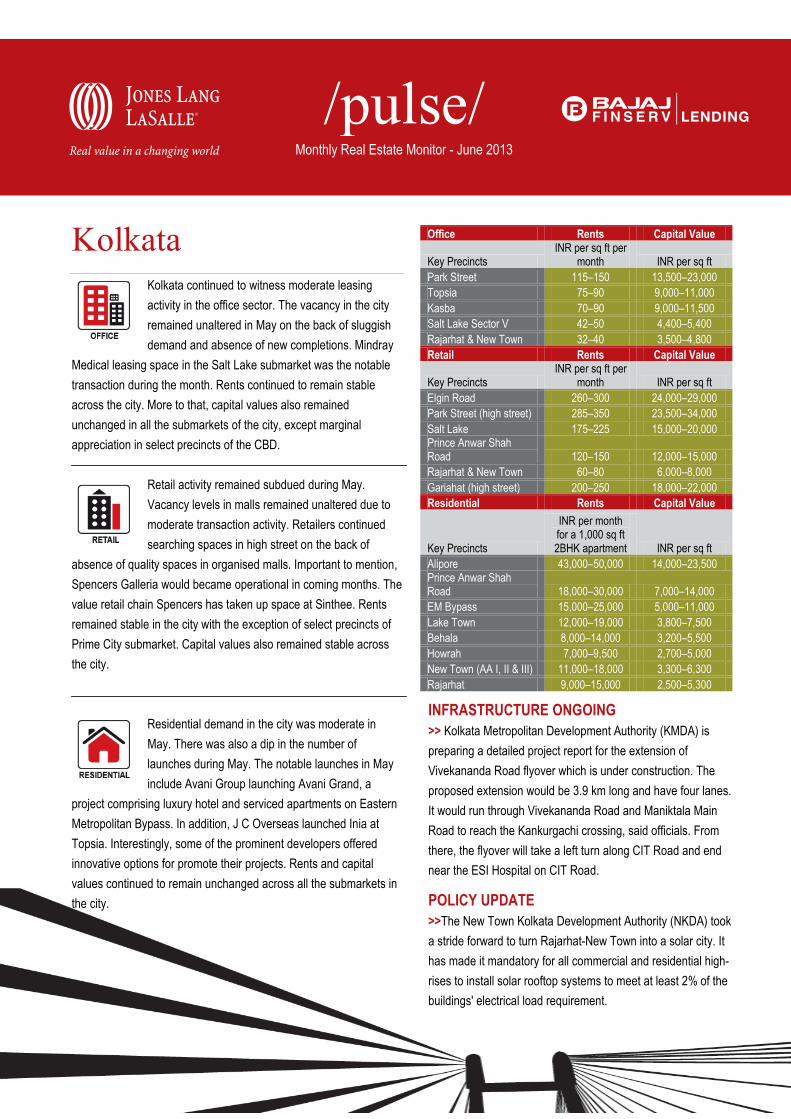
KolkataKolkata continued to witness moderate leasing activity in the office sector. The vacancy in the city remained unaltered in May on the back of sluggish demand and absence of new completions. Mindray
Medical leasing space in the Salt Lake submarket was the notabletransaction during the month. Rents continued to remain stable across the city. More to that, capital values also remained unchanged in all the submarkets of the city, except marginal appreciation in select precincts of the CBD.
Retail activity remained subdued during May.Vacancy levels in malls remained unaltered due to moderate transaction activity. Retailers continued searching spaces in high street on the back of
absence of quality spaces in organised malls. Important to mention, Spencers Galleria would became operational in coming months. The value retail chain Spencers has taken up space at Sinthee. Rents remained stable in the city with the exception of select precincts of Prime City submarket. Capital values also remained stable across the city.
Residential demand in the city was moderate in May. There was also a dip in the number of launches during May. The notable launches in May include Avani Group launching Avani Grand, a
project comprising luxury hotel and serviced apartments on Eastern Metropolitan Bypass. In addition, J C Overseas launched Inia at Topsia. Interestingly, some of the prominent developers offered innovative options for promote their projects. Rents and capital values continued to remain unchanged across all the submarkets in the city.
Office Rents Capital Value
Key PrecinctsINR per sq ft per
month INR per sq ftPark Street 115–150 13,500–23,000Topsia 75–90 9,000–11,000Kasba 70–90 9,000–11,500Salt Lake Sector V 42–50 4,400–5,400Rajarhat & New Town 32–40 3,500–4,800Retail Rents Capital Value
Key PrecinctsINR per sq ft per
month INR per sq ftElgin Road 260–300 24,000–29,000Park Street (high street) 285–350 23,500–34,000Salt Lake 175–225 15,000–20,000Prince Anwar Shah Road 120–150 12,000–15,000Rajarhat & New Town 60–80 6,000–8,000Gariahat (high street) 200–250 18,000–22,000Residential Rents Capital Value
Key Precincts
INR per month for a 1,000 sq ft 2BHK apartment INR per sq ft
Alipore 43,000–50,000 14,000–23,500Prince Anwar Shah Road 18,000–30,000 7,000–14,000EM Bypass 15,000–25,000 5,000–11,000Lake Town 12,000–19,000 3,800–7,500Behala 8,000–14,000 3,200–5,500Howrah 7,000–9,500 2,700–5,000New Town (AA I, II & III) 11,000–18,000 3,300–6,300Rajarhat 9,000–15,000 2,500–5,300
INFRASTRUCTURE ONGOING>> Kolkata Metropolitan Development Authority (KMDA) is preparing a detailed project report for the extension of Vivekananda Road flyover which is under construction. The proposed extension would be 3.9 km long and have four lanes. It would run through Vivekananda Road and Maniktala Main Road to reach the Kankurgachi crossing, said officials. From there, the flyover will take a left turn along CIT Road and end near the ESI Hospital on CIT Road.
POLICY UPDATE>>The New Town Kolkata Development Authority (NKDA) took a stride forward to turn Rajarhat-New Town into a solar city. It has made it mandatory for all commercial and residential high-rises to install solar rooftop systems to meet at least 2% of the buildings' electrical load requirement.
Monthly Real Estate Monitor - June 2013Monthly Real Estate Monitor – June 2013
MumbaiOffice demand witnessed signs of improvement in the month of May. In line with the expectations the submarkets such as SBD BKC and Navi Mumbai witnessed healthy transactions activities. Important to
mention, this month recorded robust sale transactions by select pool of occupiers who were keen on taking up space in projects with larger floor plates. Consolidation and relocation of office space emerged out to be the driving force behind the heavy number of transactions. Vacancy rates reduced minimally across select submarkets in the month. Subsequently, Navi Mumbai submarket,which witnessed the transactions with higher floor plates, helpedvacancy rates to fall visibly. Johnson & Johnson leasing space at SBD North and Barclays renting space at Western Suburbs were the notable transactions during May. In addition, DHFL bought space at SBD BKC. Suvidha Square in SBD North submarket got operational in the month. Rents and capital values both remained unaltered during May.
Mumbai's high street retail space especially Bandra linking road saw lukewarm demand helping high street retail to grow during May. However select retailers considered occupying spaces in quality
retail malls. Select foreign brands were seen considering entering into the Mumbai retail market. Major transactions in May included Creative Lifestyle leasing space at Suburbs and Go Fashion taking up space at Vashi. There were no new completions during this month. Rents and capital values both continued to remain stable across the city in May.
The demand for residential sector continued to remain off beat during the month. As a result, few developers came up with attractive offers during the festive season by offering some amount of gold to
the buyers along with the purchase of the flat. Also, developers continued limited period offers such as 20-80 schemes to gain momentum in sales. Treon by Ajmera Group and Desai Classic by Spark Developers both at Wadala and Hubtown Seasons by Hubtown at Chembur were the new launches in May. Rents
continued to remain stable over the month. Capital values in Mumbai remained stable with select precincts such as Wadala, Ghodbunder Road in Thane and Kharghar gaining some appreciation mainly due to the upcoming infrastructure projects.
INFRASTRUCTURE ONGOING>> 700-m long flyover over Milan subway in Santacruz was thrown open for traffic. The flyover is set to help more than 40,000 motorists save 15 to 30 minutes of travel time between S V Road and Western Express Highway (WEH) during peak hours.
Monthly Real Estate Monitor - June 2013Monthly Real Estate Monitor – June 2013
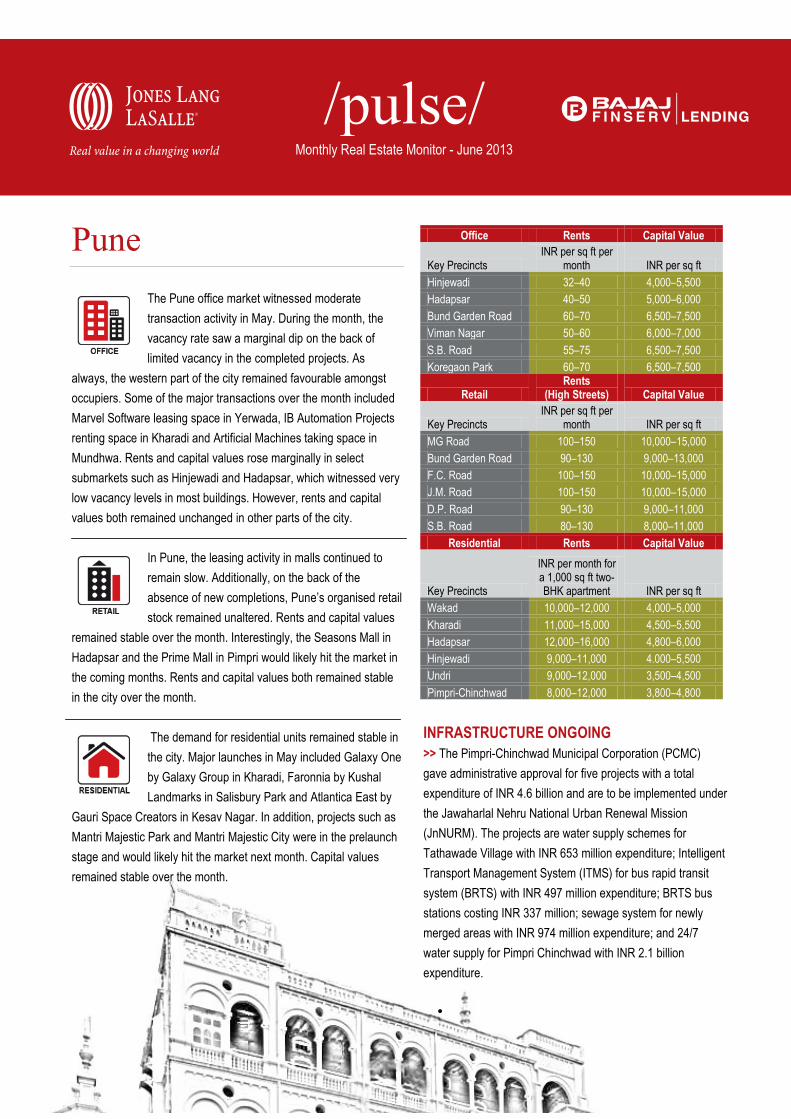
PuneThe Pune office market witnessed moderate transaction activity in May. During the month, the vacancy rate saw a marginal dip on the back of limited vacancy in the completed projects. As
always, the western part of the city remained favourable amongstoccupiers. Some of the major transactions over the month included Marvel Software leasing space in Yerwada, IB Automation Projectsrenting space in Kharadi and Artificial Machines taking space inMundhwa. Rents and capital values rose marginally in select submarkets such as Hinjewadi and Hadapsar, which witnessed very low vacancy levels in most buildings. However, rents and capital values both remained unchanged in other parts of the city.
In Pune, the leasing activity in malls continued to remain slow. Additionally, on the back of the absence of new completions, Pune’s organised retail stock remained unaltered. Rents and capital values
remained stable over the month. Interestingly, the Seasons Mall in Hadapsar and the Prime Mall in Pimpri would likely hit the market in the coming months. Rents and capital values both remained stablein the city over the month.
The demand for residential units remained stable in the city. Major launches in May included Galaxy One by Galaxy Group in Kharadi, Faronnia by Kushal Landmarks in Salisbury Park and Atlantica East by
Gauri Space Creators in Kesav Nagar. In addition, projects such as Mantri Majestic Park and Mantri Majestic City were in the prelaunch stage and would likely hit the market next month. Capital values remained stable over the month.
INFRASTRUCTURE ONGOING>> The Pimpri-Chinchwad Municipal Corporation (PCMC)gave administrative approval for five projects with a totalexpenditure of INR 4.6 billion and are to be implemented under the Jawaharlal Nehru National Urban Renewal Mission(JnNURM). The projects are water supply schemes for Tathawade Village with INR 653 million expenditure; Intelligent Transport Management System (ITMS) for bus rapid transit system (BRTS) with INR 497 million expenditure; BRTS bus stations costing INR 337 million; sewage system for newly merged areas with INR 974 million expenditure; and 24/7water supply for Pimpri Chinchwad with INR 2.1 billionexpenditure.
•
Monthly Real Estate Monitor - June 2013
About Jones Lang LaSalleJones Lang LaSalle (NYSE:JLL) is a financial and professional services firm specializing in real estate. The firm offers integrated services delivered by expertteams worldwide to clients seeking increased value by owning, occupying or investing in real estate. With 2011 global revenue of $3.6 billion, Jones LangLaSalle serves clients in 70 countries from more than 1,000 locations worldwide, including 200 corporate offices. The firm is an industry leader in property andcorporate facility management services, with a portfolio of approximately 2.1 billion square feet worldwide. LaSalle Investment Management, the company’sinvestment management business, is one of the world’s largest and most diverse in real estate with $47 billion of assets under management.Jones Lang LaSalle has over 50 years of experience in Asia Pacific, with over 22,200 employees operating in 79 offices in 14 countries across theregion. The firm was named the Best Property Consultancy in Asia Pacific at ‘The Asia Pacific Property Awards 2012 in association with BloombergTelevision’. For further information, please visit our website, www.ap.joneslanglasalle.com
About Jones Lang LaSalle IndiaJones Lang LaSalle is India’s premier and largest professional services firm specializing in real estate. With an extensive geographic footprint across elevencities (Ahmedabad, Delhi, Mumbai, Bangalore, Pune, Chennai, Hyderabad, Kolkata, Kochi, Chandigarh and Coimbatore) and a staff strength of over 5400,the firm provides investors, developers, local corporates and multinational companies with a comprehensive range of services including research, analytics,consultancy, transactions, project and developmentservices, integrated facility management, property and asset management, sustainability, Industrial, capital markets, residential, hotels, health care,senior living, education and retail advisory. For further information, please visit www.joneslanglasalle.co.in
For more information about our research
Ashutosh Limaye Trivita RoyHead, Research and REIS Assistant Vice President, [email protected][email protected]+91 98211 07054 +91 40 4040 9100 About Bajaj Finserv LendingBajaj Finserv Lending is one of the most diversified NBFCs in the Indian market catering to more than 5 million customers across the country. Headquartered in Pune, the company’s product offering includes Consumer Durable Loans, Personal Loans, Loan against Property, Small Business Loans, Home loans, Credit Cards, Two-wheeler and Three-wheeler Loans, Construction Equipment Loans, Loan against Securities and the recently introduced Lifestyle Finance. Bajaj Finserv Lending prides itself for holding the highest credit rating of FAAA/Stable for any NBFC in the country today.
To know more please visit www.bajajfinservlending.in or send an email to [email protected]
Research Dynamics 2013Pulse reports from Jones Lang LaSalle are frequent updates on real estate market dynamics.