ELSEVIER Lingua 108 (1999) 119-136 Is the rate of linguistic change constant?* Daniel Nettle* Merton College, Oxford and King’s College Research Centre, Cambridge, UK Received 6 May 1998; revised version 22 September 1998 Abstract The computer simulation of language change in a finite, structured population which was presented in an earlier paper (‘Using Social Impact Theory to simulate language change’, Lin- gua 108, 95-117, 1999), is here extended to speech communities of different sizes. On the basis of the results it is proposed (a) that language change may be faster in small communi- ties; (b) that linguistic borrowing is one sense more likely in small communities; and (c) that the evolution of linguistically marked structures is more likely in small communities. It is argued that these three generalisations could he used to make sense of the different patterns of linguistic diversity observed in the Old and New Worlds, and the distribution of marked word orders in the world’s languages. 0 1999 Elsevier Science B.V. All rights reserved. Keywords: Language change; Lexicostatistics; Word order; Computer simulation 1. Introduction Historical linguists have often characterised language change as a rather stately autonomous process little affected by the social context in which it is happening. Swadesh (1951), in proposing his method of glottochronology, assumed that the replacement of core lexical items was like the decay of a radioactive isotope. Radioactive decay, though stochastic, is, on human time scales, so constant that it can be used to date prehistoric artefacts with great precision. Swadesh’s hope was that glottochronology, which uses the number of divergences between two languages on a basic word list as a measure of the time since their separation, would provide an equally useful linguistic clock. Despite some early cross-linguistic evidence which appeared to support a fairly constant rate of lexical replacement (Lees, 1953), Swadesh’s hopes proved mis- * This study was carried out whilst the author was at the King’s College Research Centre, Cambridge, as part of the Human Diversity Project. The author thanks Robin Dunbar, Rob Foley, Jim Hurford and an anonymous referee for comments on the manuscript. * Correspondence to: Merton College, Oxford OX1 4JD, UK. 0024-3841/99/S - see front matter 0 1999 Elsevier Science B.V. All rights reserved. PII: SOO24-3841(98)00047-3
Transcript
ELSEVIER Lingua 108 (1999) 119-136
Is the rate of linguistic change constant?*
Daniel Nettle*
Merton College, Oxford and King’s College Research Centre, Cambridge, UK
Received 6 May 1998; revised version 22 September 1998
Abstract
The computer simulation of language change in a finite, structured population which was presented in an earlier paper (‘Using Social Impact Theory to simulate language change’, Lin- gua 108, 95-117, 1999), is here extended to speech communities of different sizes. On the basis of the results it is proposed (a) that language change may be faster in small communi- ties; (b) that linguistic borrowing is one sense more likely in small communities; and (c) that the evolution of linguistically marked structures is more likely in small communities. It is argued that these three generalisations could he used to make sense of the different patterns of linguistic diversity observed in the Old and New Worlds, and the distribution of marked word orders in the world’s languages. 0 1999 Elsevier Science B.V. All rights reserved.
Keywords: Language change; Lexicostatistics; Word order; Computer simulation
1. Introduction
Historical linguists have often characterised language change as a rather stately autonomous process little affected by the social context in which it is happening. Swadesh (1951), in proposing his method of glottochronology, assumed that the replacement of core lexical items was like the decay of a radioactive isotope. Radioactive decay, though stochastic, is, on human time scales, so constant that it can be used to date prehistoric artefacts with great precision. Swadesh’s hope was that glottochronology, which uses the number of divergences between two languages on a basic word list as a measure of the time since their separation, would provide an equally useful linguistic clock.
Despite some early cross-linguistic evidence which appeared to support a fairly constant rate of lexical replacement (Lees, 1953), Swadesh’s hopes proved mis-
* This study was carried out whilst the author was at the King’s College Research Centre, Cambridge, as part of the Human Diversity Project. The author thanks Robin Dunbar, Rob Foley, Jim Hurford and an anonymous referee for comments on the manuscript. * Correspondence to: Merton College, Oxford OX1 4JD, UK.
0024-3841/99/S - see front matter 0 1999 Elsevier Science B.V. All rights reserved. PII: SOO24-3841(98)00047-3
120 D. Netfle I Lingua 108 (1999) 119-136
placed. Even leaving aside the fact that the lexical stock is not the best system to reveal family relationships (Teeter, 1963) it seems that the rate is rather variable (Rea, 1958; Arndt, 1959; Fodor, 1961; Bergslund and Vogt, 1962), and so glot- tochronology is not widely used today. However, the assumption that the rate of change is approximately constant across all languages and all times is still frequently employed, if more tacitly, by scholars following a more orthodox approach to lin- guistic relatedness. It is implicit in the claim that the comparative method can only reconstruct back 8,000 years or so, and in the attribution of time depths to such fam- ilies as Afroasiatic (c. 8,000 years), Kartvelian (c. 4,000 years) and Uralic (c. 6,000 years) (dates from Nichols, 1994: 206).
Arguments against the constant rate assumption, such as those which have been raised against glottochronology, stress, first, that the history of a language is not autonomous but is rather a function of the history of its speakers (Thomason and Kaufman 1988: 4),* and second, that the situations in which speakers may fmd themselves are incredibly varied. The way a language changes depends on how it is transmitted from generation to generation of speakers, and that transmission will be heavily affected by such factors as the way children are brought up, the structure of social networks, the degree of mobility and inter-group contact, the extent of bilin- gualism and diglossia, the existence of word taboos, and the attitudes and practices of the community at large. Such considerations should lead us to recognise that the rate of linguistic change is likely to vary across time and place for many different reasons.
This argument could easily lead to the conclusion that no generalisations at all were possible about the rate of linguistic change, and therefore that no chronological inferences from the divergence of languages are ever possible. This would be a dis- appointing conclusion, since it would radically reduce the utility of historical lin- guistics as a window on the past. My interest in this paper and elsewhere (Nettle, 1999) is thus to steer between the unrealistic constant-rate assumption and the unhelpful generalisation that the rate differs unpredictably from society to society. Thus we need to know under which social conditions the rate is generally fast or generally slow, and what types of changes might be associated with which types of societal situations. This requires attention to the social processes which lie behind language change.
Dixon (1997) has considered these processes at a macroscopic scale, and he puts forward some interesting suggestions about the dynamics of linguistic divergence across large areas such as continents. Those dynamics are beyond the scope of this paper.* Instead, I wish to consider the dynamics of language change within a single
I Though note that these authors do not specifically argue against a constant rate of change. z Dixon proposes a ‘punctuated equilibrium’ model, in which there are long periods in which the num- ber of languages in an area is relatively constant. Whilst there is ceaseless innovation, most change in these equilibrium periods spreads by inter-language diffusion, and leads to convergent linguistic areas. Occasionally, the equilibrium is disrupted by some development which allows a rapid expansion of pea- ple; the origin of agriculture. for example, or the settling of new lands. During this period people spread rapidly into new niches and become isolated from each other. As a result, many new languages are pro- duced and the divergence of these languages follows the classic family tree model. Once all niches are
D. Nettle I Lingua 108 (1999) 119436 121
community. In particular, I consider the effect of on the rate of change of one of the simplest societal variables: community size.
Different languages have different numbers of speakers. This much is obvious, but the range of variation across different areas, as surveyed in Nettle (1999) using data mainly from Grimes (1993), is very great. Aboriginal Australian languages, and those of lowland New Guinea, had an equilibrium size of only a few hundred indi- viduals. Most European and Northern Asian languages, on the other hand, though not always as large as they are now, have had many thousands of speakers for mil- lennia. Africa has a concentration of medium-sized languages, with the largest towards the Northern and Southern extremities of the continent and the smallest in the tropical forest environments of the centre. In this paper I will argue that the vari- ation in community size might plausibly affect the average rate of language change. The basis of my argument will be partly intuitive - spreading an innovation over a tribe of 500 people is much easier and takes much less time than spreading one over five million people - and partly a computer simulation. This simulation is rather sim- ple, and the reader may choose to dismiss it as simplistic according to his or her taste. However, I will also discuss some of the puzzles of world linguistic diversity which would make sense if the rate of change varied with group size. Taken together, I hope that the intuitive argument, the computer simulation, and the empir- ical applications will amount to a sufficient case for the hypothesis to be seriously considered. There is certainly more support for it than has ever existed for the con- stant rate assumption.
2. The intuitive argument
The conceptualisation of language change presented here is the same as that out- lined in the previous paper in this volume of Lingua (‘Using Social Impact Theory to simulate language change’, henceforth SIT). The reader is referred to that paper for a detailed exposition. Here I present a synopsis.
Speech communities are populations of people who share a (fuzzy) set of linguis- tic items, which they have acquired, by social learning, from each other and earlier community members. Now the social learning process does not replicate linguistic items perfectly. (If it did, languages would never change.) Instead, imperfect learn- ing, the vagaries of production, personal innovations and other idiosyncrasies mean that there exist variants on all linguistic items which differ in some way from the canonical form. Language change occurs when these variants spread from their orig- inators through the population, slowly at first, then with increasing rapidity until their rate of increase levels off and they eventually become universal.
full, however, groups begin to interact and the structure of the tree is gradually obscured by interlan- guage diffusion and also by language shift and extinction. Dixon’s model accounts for the differences in pattern between such families as Indo-European, Bantu, and Polynesian, which have ah undergone recent tree-like expansions, and areas such as Australia, which have been at equilibrium for millennia (there was no Neolithic expansion in Australia), and so family trees are apparently impossible to draw.
122 D. Nettle / Lingua 108 (1999) 119-136
New learners acquire their language by sampling some subset of the speech com- munity and extracting an appropriate norm from the resulting, often heterogeneous, data set. New variants have trouble getting adopted by the community, because they are initially (by definition) extremely rare. Thus learners are exposed to them much less frequently than the more common variant, and so will acquire the common vari- ant instead. In SIT, this was termed the threshold problem. The vast majority of all new variants never spread and simply disappear, because they cannot overcome the threshold of rarity.
Some innovations, however, clearly do spread to the whole community. In SIT it was argued that this was because learners do not simply adopt the most common variant, but instead model their speech to give the most socially desirable effect pos- sible. In any community, there are large differences in local social standing, and so some very influential individuals can get their norms adopted in their part of the community even against the weight of the majority. This social effect can be coupled with functional biases; where there is some cognitive or discourse advantage to one variant over another, that is the one which will tend to be adopted. In SIT, I argued that it was chiefly the social process which made language change possible, though the functional one may affect its direction.
We can now consider the effect of changing community size on the spread of new variants. This is done systematically in the computer’ simulation, but here let us do it by a simple verbal argument. Let us suppose that the likelihood of a learner adopt- ing some linguistic variant 4 depends upon the proportion of the population having q, and the social influence of those having q on the learner. Generally, the impact of q on the learner will be:
f (Proportion of population with q, Relative influence of those with q).
- wheref is some function. This must be weighed against all the impacts of all the alternative variants (let us assume, for now, that there is just one, p). The proportion of people with q is the number of people with q over the total population size. When q is one or some other fixed number, the proportion of people having q is therefore a direct function of population size. The probability of some individual adopting a variant q which is used by a fixed number of people, then, depends heavily on com- munity size.3
The number of acts of successful transmission required for q to spread to the entire community also increases with the size of the community. If with every trans- mission, q has some probability prob, of being adopted, then if all acts of transmis- sion were independent, the probability of q being adopted by the whole community
3 For this to be true, we do not need to assume that the learner samples the entire population; as long as he takes a reasonably large representative sample from it, the sample proportions will approximate to the population proportions. I discuss this aspect of the model further below. The argument also assumes that the learner does not simply acquire the set of alf the variants he is exposed to which fulfill a partic- ular function. This is a reasonable assumption; learners avoid multiple forms with the same function (Clark, 1993), and where. close alternatives coexist in language, they always have a difference in social, geographical or linguistic distribution.
D. Nettle I Lingua 108 (1999) 119-136 123
would be @rob,)“, where n is the community size. In fact, successive acts of trans- mission are not independent, since some people adopting q makes it more likely that subsequent ones will do so (this is why language changes spread in their character- istic rising S-shape). Nonetheless, it is reasonable to assume that the probability of all transmissions required for a variant to be adopted occurring successfully decreases as the community size increases.
As community size increases, then, the probability of some individual adopting a rare variant q becomes smaller, and the number of such adoptions which are required for q to become the community norm increases. Whatever the details of the function which map the probability of adoption of q by any one individual to its probability of being fixed in the whole population, it is intuitively clear that the larger the com- munity, the less likely it is that q will displace the existing norm.
For any rare variant, then, the probability of fixation will be inversely related to population size. A similar result is found in certain models in population genetics (Kimura, 1983). However, this does not mean that the rate of genetic change depends on population size, since the although the probability of some mutation becoming fixed is proportional to population size, so is the number of mutations cropping up, and so the two population size terms cancel, giving, under certain assumptions, a constant rate of change.
For linguistic change, the situation is quite different, because the mechanisms of linguistic and genetic inheritance are so different. In genetic inheritance, an individ- ual has two parents, and if one of these has an allele p and the other q, then the chances are basically 50% that the individual will have q regardless of the popula- tion frequency of q. In language acquisition, on the other hand, learners sample a large number, perhaps hundreds, of linguistic sources, not just their parents. Rare mutants will thus tend not to be reproduced unless there are counteracting factors in their favour. This means that under a wide range of assumptions the probability of a rare q being adopted declines with increasing population size with an exponent greater than 1. Thus, although the number of new variants cropping up increases with population size, it increases less fast than the probability of their fixation declines, and so, we would predict a decrease in the rate of change in the language as population size increases.
Intuitively, then, in large communities, other things being equal, norms should be replaced less often than in small ones. We could also make a number of related pre- dictions using similar lines of thought; small communities should be more susceptible to linguistic borrowing than large ones, and the probability of a small community adopting a marked structure against which there was a functional bias should be greater than the equivalent probability for a large community. However, to give such predictions weight a much more formal model is required, since the outcome of dynamic population processes depends heavily on the details of the algorithms used for transmission. As we are dealing with finite populations and stochastic processes, com- puter simulation is the only technique available. In the next section, then, I present a computer simulation which can be used to examine these speculations more rigorously.
Before proceeding to the simulation section, though, it is worth discussing in some more detail one of the assumptions used generally in this paper, lest it be
124 D. Nettle I Lingua 108 (1999) 119436
felt that I have slipped a critical and inappropriate condition into the model at the outset. In the simulation I present, language learners sample all of the adults in their communities as part of the process of language acquisition. As the commu- nity size increases, then, the number of adults sampled by each learner also increases. It could be argued that this is unrealistic. Instead one might argue that (a) language learners in large communities only sample the small part of it close to them, and so the sample size and structure should not change at all with increasing overall community size; or (b) as community size increases, the number of lin- guistic models stays constant, but they become distributed over a wider and wider area.
Part of the insight behind (a) is built into the simulation. Learners give more weight to data from adults close to them in the social space of the simulation, in fact a great deal more, since the influence of one site on another decreases with the square of the distance between them. In general, though, (a) is unlikely to be true, since if each learner were only sampling his local space, then the dialects of differ- ent parts of the community would almost certainly diverge. Divergence does often happen, but there are also large languages which remain relatively uniform, and in these cases, there must be social mechanisms and linkages which traverse the whole community. This, indeed, is the case we want to consider: that of a community which enlarges without fragmenting. Scenario (a) is therefore inappropriate. Sce- nario (b) may well be close to what actually happens, but as long as the sample of models is quite large and is drawn representatively from the population, the results will be much the same as those presented in the simulation. The sample of models involved in language acquisition is typically fairly large, certainly in the region of several hundred individuals, given that the potential period of acquisition for most items is more than ten years long. It is true that the learner of, say, English, even with television and radio, does not sample all dialects of English. However, the case of English and other world languages is not typical of the present, still less the past. I have more in mind the difference between a large traditional society (e.g. lO,OOO-50,000 people) and a small one (e.g. l-2000 people).
3. Computer simulations
The simulation presented here is that described in detail in SIT. The reader is referred to that paper for a full exposition of the model and a justification of the choice of parameters.
In the simulation, a number of individuals are situated on a grid designed to rep- resent social structure. They pass through five lifestages, during the first two of which they learn a linguistic item, which has two variants p and 9. Their choice of which to learn is determined by the item favoured by the others in the community. For each variant, the learning algorithm calculates the total impact on the learner, which is a function based on the number of individuals using the variant, the aver- age of their squared distances from the learner in the social structure, their average status, and any biases towards the variant which may be intrinsic to the acquisition
D. Nettle I Lingua 108 (1999) 119-136 125
process.4 The variant for which the total impact is the greatest is usually the one adopted, though in a small number of cases (5%, chosen at random) the learner adopts the opposite. This contingency is included to mimic the effects of imperfect learning and other idiosyncrasies which are the ultimate origin of linguistic variation.
With the values set as described and a population size of 400, this simulation was found in SIT to exhibit some behaviour interestingly like that observed in language change. The ‘community’ generally agrees on a single norm, but the other variant occurs idiosyncratically at low frequencies. Occasionally, this rarer variant spreads in part of the space if it is associated with a particularly influential individual or clus- ter there. If this ‘dialect’ attains a critical size, it quickly spreads until it has occupied the whole population within a few lifestages. It then stabilises as the community norm, to be displaced only when the other variant happens to obtain critical mass around some influential individualor cluster elsewhere in the space, and so on. The long term behaviour of the simulation is thus periods of homogeneity with more than ninety percent of the population having either p or q, punctuated by bursts of change in which the frequencies of the variants are reversed.
In this paper, we leave all other parameters unchanged (the effects of varying them were investigated in SIT) and examine the outcome of varying the size of the community. Once that is done, we will use the same basic set-up to simulate lin- guistic borrowing and also the evolution of marked structures in groups of different sizes.
3.1. The rate of internal change
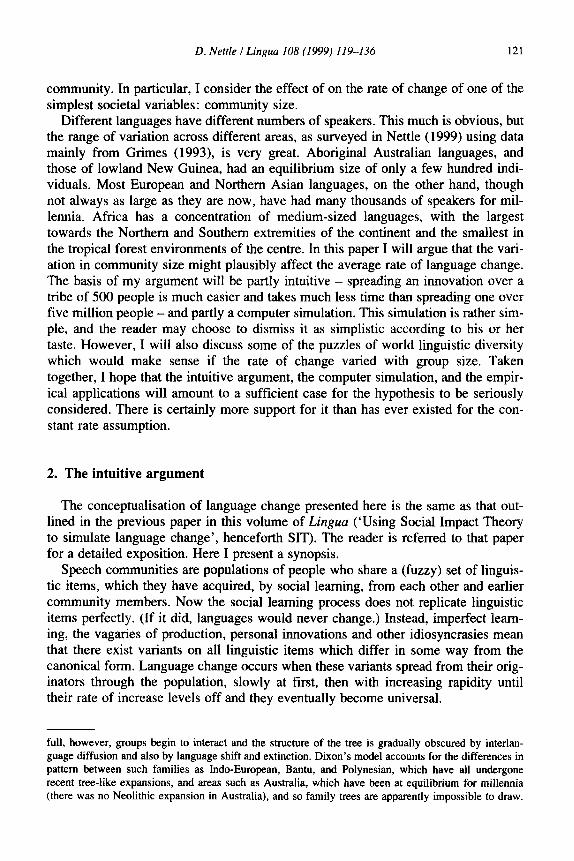
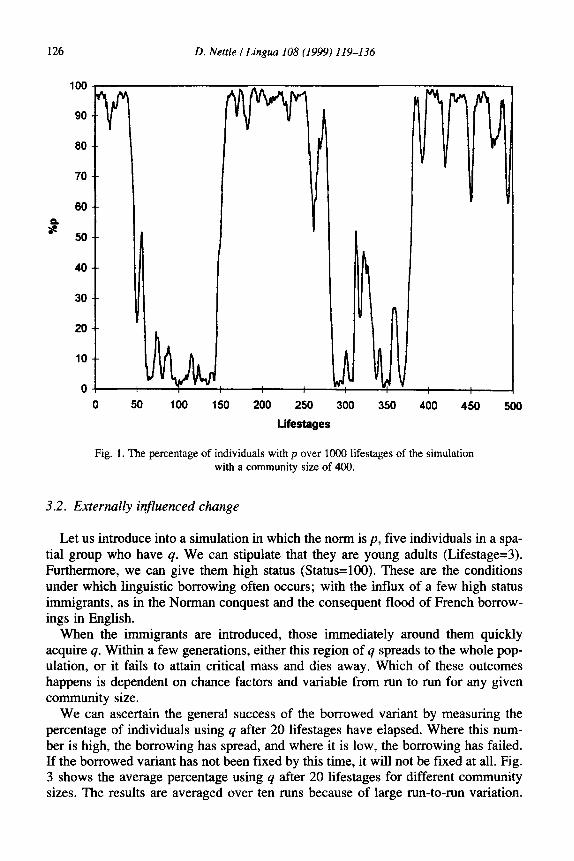
First we consider the rate of internally generated change in the simulation. When the simulation is run with a community size of 400, an initial norm of p and no out- side influences, its behaviour over time can be appreciated by examining Fig. 1. The figure tracks the proportion of individuals having p. There are long periods where either p or q is the norm, punctuated with rapid changes from one norm to the other. We can define the rate of change in the simulations as the number of times the norm changes from p to q or q to p in 1000 lifestages. Fig. 2 shows the rate of change for the simulation run with different population sizes. The results are averaged over three runs because, due to the stochastic nature of the simulation, the results vary from run to run. It is clear that the rate of change declines with community size: in particular, the rate is much faster with communities of less than 200-250 members. Thereafter there is no further decline in the rate; it asymptotes at a small but nonzero value.
The simulation result thus bears out the intuitive argument presented above, that the rate of change in some linguistic item will decrease as the community size increases. We can also consider the case of change in items under external influence, such as that observed in linguistic borrowing.
The impact function is that specified in SIT, equations (3) and (4), with a value of a of 0.8. The biases b, and b, are 1 unless otherwise stated. Status is distributed in the population as described in the simulation using hyperinfluential individuals.
126 D. Nettle I Lingua 108 (1999) 119-136
100 -
“v” 90 --
80 --
I
70 --
60 --
s so--
40 --
30 --
20 --
10 --
I
\
o! 0 50 100 150 200 250
Liiestages
300 350
-
400 450 500
Fig. 1. The percentage of individuals with p over 1000 lifestages of the simulation with a community size of 400.
3.2. Externally influenced change
Let us introduce into a simulation in which the norm is p, five individuals in a spa- tial group who have 4. We can stipulate that they are young adults (Lifestage=3). Furthermore, we can give them high status (Status=lOO). These are the conditions under which linguistic borrowing often occurs; with the influx of a few high status immigrants, as in the Norman conquest and the consequent flood of French borrow- ings in English.
When the immigrants are introduced, those immediately around them quickly acquire q. Within a few generations, either this region of q spreads to the whole pop- ulation, or it fails to attain critical mass and dies away. Which of these outcomes happens is dependent on chance factors and variable from run to run for any given community size.
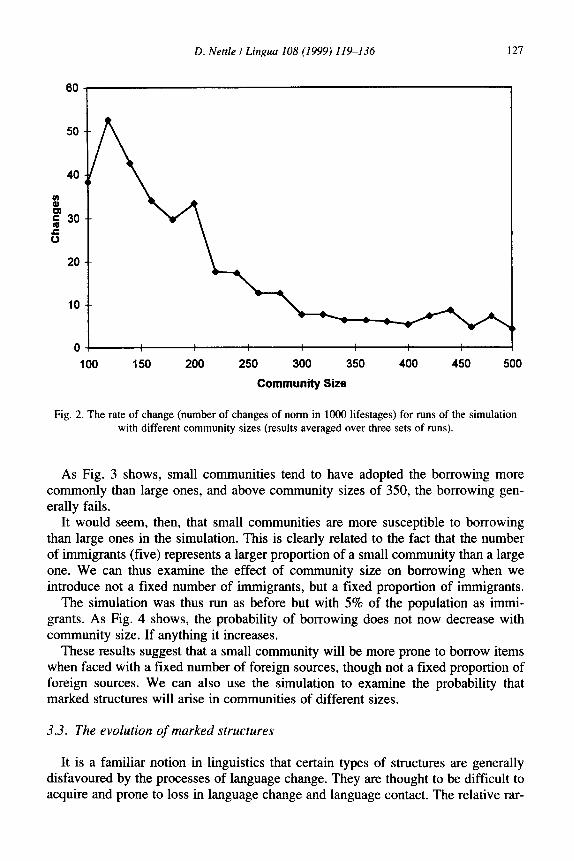
We can ascertain the general success of the borrowed variant by measuring the percentage of individuals using q after 20 lifestages have elapsed. Where this num- ber is high, the borrowing has spread, and where it is low, the borrowing has failed. If the borrowed variant has not been fixed by this time, it will not be fixed at all. Fig. 3 shows the average percentage using q after 20 lifestages for different community sizes. The results are averaged over ten runs because of large run-to-run variation.
D. Nettle I Lingua 108 (1999) 119-136 121
60
50
10
250 300 350
Community Size
Fig. 2. The rate of change (number of changes of norm in 1000 lifestages) for runs of the simulation with different community sizes (results averaged over three sets of runs).
As Fig. 3 shows, small communities tend to have adopted the borrowing more commonly than large ones, and above community sizes of 350, the borrowing gen- erally fails.
It would seem, then, that small communities are more susceptible to borrowing than large ones in the simulation. This is clearly related to the fact that the number of immigrants (five) represents a larger proportion of a small community than a large one. We can thus examine the effect of community size on borrowing when we introduce not a fixed number of immigrants, but a fixed proportion of immigrants.
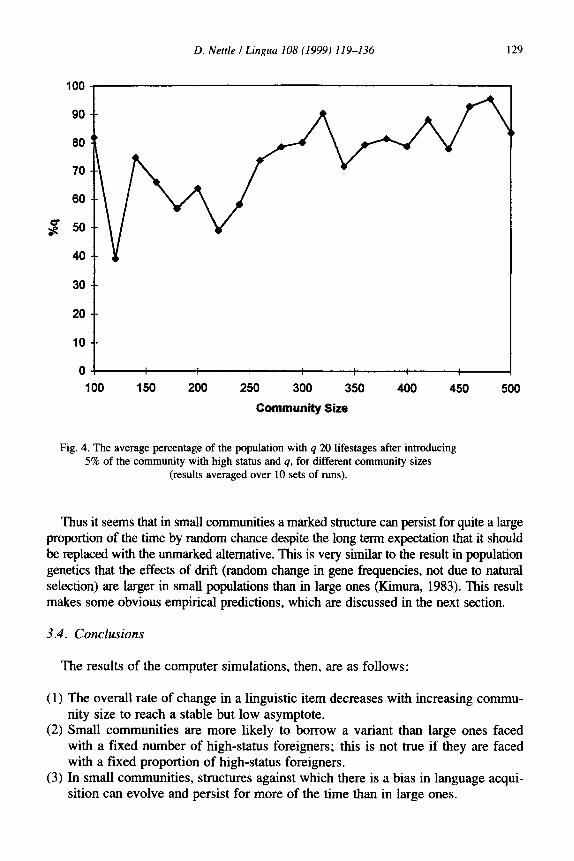
The simulation was thus run as before but with 5% of the population as immi- grants. As Fig. 4 shows, the probability of borrowing does not now decrease with community size. If anything it increases.
These results suggest that a small community will be more prone to borrow items when faced with a fixed number of foreign sources, though not a fixed proportion of foreign sources. We can also use the simulation to examine the probability that marked structures will arise in communities of different sizes.
3.3. The evolution of marked structures
It is a familiar notion in linguistics that certain types of structures are generally disfavoured by the processes of language change. They are thought to be difficult to acquire and prone to loss in language change and language contact. The relative rar-
128 D. Nettle I Lingua 108 (1999) 119436
80
70
60
50
g 40
30
20
10
0
cf
100 150 200 250 300 350
Community Size
400 450 500
Fig. 3. The average percentage of the population with q 20 lifestages after introducing 5 high status individuals using q into the community, for different community sizes
(results averaged over 10 sets of runs).
ity of certain structures or combinations of structures in typological surveys of the world’s languages is usually explained by the notion of markedness in this way. Thus Tomlin (1986) explains the rarity of object-initial word order by its sub-opti- mality in terms of processing strategies involved in language use. However, some Object-Initial languages do occur (Pullum, 1981), and we might ask why they exist at all if change disfavours them.
Markedness can be incorporated into the present simulation of language change by including a small bias against one of the variants in the process of acquisition (for how this is done, see SIT). It was shown in SIT that quite a small bias is generally sufficient to determine the direction of change (away from the marked variant). However, with a small bias, it is still possible for a marked structure to arise and persist for a time.
The simulation was rerun for 1000 cycles with a small bias against q (b4 = 0.8).
The number of lifestages when q was the community norm was then tracked. Fig. 5 shows this number for different community sizes (the results are averaged over three runs). With a large community, such as 400 individuals, the proportion of the time where q is the norm is never more than one-twentieth, but in small communities it may rise to a fifth or a quarter.
D. Nettle I Lingua 108 (1999) 119-136 129
100
90
80
70
60
-g 50
40
30
20
10
0
100 150 200 250 300 350
Community Size
400 450 500
Fig. 4. The average percentage of the population with q 20 lifestages after introducing 5% of the community with high status and q, for different community sizes
(results averaged over 10 sets of runs).
Thus it seems that in small communities a marked structure can persist for quite a large proportion of the time by random chance despite the long term expectation that it should be replaced with the unmarked alternative. This is very similar to the result in population genetics that the effects of drift (random change in gene frequencies, not due to natural selection) are larger in small populations than in large ones (Kimura, 1983). This result makes some obvious empirical predictions, which are discussed in the next section.
3.4. Conclusions
The results of the computer simulations, then, are as follows:
(1) The overall rate of change in a linguistic item decreases with increasing commu- nity size to reach a stable but low asymptote.
(2) Small communities are more likely to borrow a variant than large ones faced with a fixed number of high-status foreigners; this is not true if they are faced with a fixed proportion of high-status foreigners.
(3) In small communities, structures against which there is a bias in language acqui- sition can evolve and persist for more of the time than in large ones.
130 D. Nettle I Lingua 108 (1999) 119436
300
4,
100 150 200 250 300 350 400 450 500
Community Size
Fig. 5. The number of lifestages out of 1000 where q is the norm, with a small bias against q (b&8), for different community sizes (results averaged over three sets of runs).
In all three cases, the accelerated rates are found only in very small communities; as community size passes a few hundred members, an asymptote is reached after which further changes have no effect. In reality, this levelling off would be even more marked as in very large communities, learners probably cease to be able to sample the across whole group and start to sample just a part or sub-group.
The three results are interesting and have obvious empirical implications. The simulation involves a very great simplification of part of a very complex process, and it is quite possible that there are other sets of computational procedures and assumptions which would produce different results. How convincing the reader finds these suggestions will therefore depend upon his attitude to the simulation procedure adopted. I feel I have made a set of reasonable assumptions about how language change operates, and been forced to make them explicit by writing them into a numerical model. If the simulation has one key weakness it is that only one linguis- tic item is considered. In fact, languages are partially integrated sets where change in one item causes change in others. To the extent that this happens, many changes are caused by past changes, leading to chains which are not treated in the present simu- lation and which may be independent of population size. However, all changes must be actuated in real communities, and so it is reasonable to assume that what holds for one item in isolation could hold for a whole linguistic system.
D. Nettle I Lingua 108 (1999) 119-136 131
The results arising from that model are then at least suggestive that similar dynamics might occur in the real world. This is far from proven, however, and sim- ulation alone could never do so. However, if the three results obtained here did really obtain to language change, a number of empirical puzzles would begin to make sense. I will now turn to two cases with real data, then, to urge the plausibility of the notional results presented here.
4. Empirical applications
4.1. Linguistic diversity of the Old World, New World and Pacific
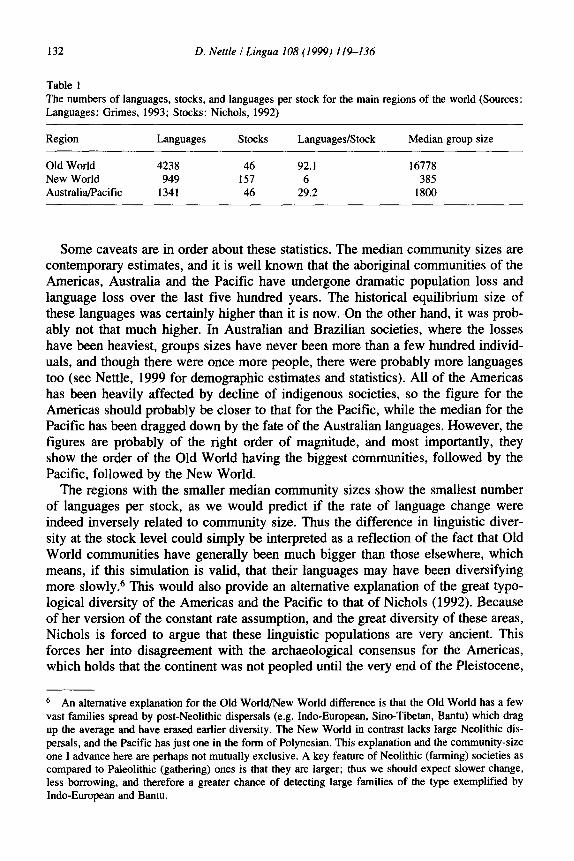
Nichols (1990, 1992: 233) shows that linguistic diversity is very high in the New World, Australia and the Pacific compared to the Old World. She provides a mea- sure of genetic density for all the continents, which is the number of different lin- guistic stocks5 per million square miles of land. This measure is crude, but shows interesting variation from continent to continent. It gives values of 10.6 for the New World, 14.1 for Australia and the Pacific, but only 1.5 for the Old World (Africa and Eurasia). This discrepancy is partly due to there being many languages in the New World and Pacific, but not entirely. Grimes (1993) provides an estimate of the num- ber of different languages for these three geographical regions. The data are shown in Table 1. We can compute the ratio of languages to language stocks, as is done in the third column. This column shows that whereas the average language stock in the Old World has 92 member languages, the average stock in the New World has just 6 members, and in the Pacific, 29 members.
The language stock is the highest grouping which we as observers can identify from the contemporary languages. If languages are changing fast internally, then after they split, identifiable relationship will be quickly erased from their descen- dants, and so, after a given time period, there will appear to be many, small language families. If the languages are changing very slowly, then identifiable relationship will persist for longer, and so the reconstructable language families will be much broader. In short, a slow rate of change predicts the Old World situation, with few families each of which has many members, whilst a fast rate of change predicts the New World situation, with many families each of which contains few languages.
The results reported here suggest a reason why Old World languages might have been changing relatively slowly. That is that they are much bigger than their New World counterparts. Using the database which is used to compile the Ethnologue cat- alogue of languages (Grimes, 1993) I calculated the median number of speakers for languages in the Old World, New World and Pacific (the median is a more infoma- tive measure of central tendency here than the mean, since a few huge languages - English and Chinese, for example - have an unduly large effect on the mean). The results are in the final column of Table 1.
’ Nichols uses the term ‘stock’ to refer to the deepest phylogenetic grouping of languages which can be identified using the traditional comparative method.
132 D. Nettle I Lingua 108 (1999) 119-136
Table 1 The numbers of languages, stocks, and languages per stock for the main regions of the world (Sources: Languages: Grimes, 1993; Stocks: Nichols, 1992)
Region Languages Stocks Languages/Stock Median group size
Old World 4238 46 92.1 16778 New World 949 157 6 385 Australia/Pacific 1341 46 29.2 1800
Some caveats are in order about these statistics. The median community sizes are contemporary estimates, and it is well known that the aboriginal communities of the Americas, Australia and the Pacific have undergone dramatic population loss and language loss over the last five hundred years. The historical equilibrium size of these languages was certainly higher than it is now. On the other hand, it was prob- ably not that much higher. In Australian and Brazilian societies, where the losses have been heaviest, groups sizes have never been more than a few hundred individ- uals, and though there were once more people, there were probably more languages too (see Nettle, 1999 for demographic estimates and statistics). All of the Americas has been heavily affected by decline of indigenous societies, so the figure for the Americas should probably be closer to that for the Pacific, while the median for the Pacific has been dragged down by the fate of the Australian languages. However, the figures are probably of the right order of magnitude, and most importantly, they show the order of the Old World having the biggest communities, followed by the Pacific, followed by the New World.
The regions with the smaller median community sizes show the smallest number of languages per stock, as we would predict if the rate of language change were indeed inversely related to community size. Thus the difference in linguistic diver- sity at the stock level could simply be interpreted as a reflection of the fact that Old World communities have generally been much bigger than those elsewhere, which means, if this simulation is valid, that their languages may have been diversifying more slowly.“j This would also provide an alternative explanation of the great typo- logical diversity of the Americas and the Pacific to that of Nichols (1992). Because of her version of the constant rate assumption, and the great diversity of these areas, Nichols is forced to argue that these linguistic populations are very ancient. This forces her into disagreement with the archaeological consensus for the Americas, which holds that the continent was not peopled until the very end of the Pleistocene,
6 An alternative explanation for the Old World/New World difference is that the Old World has a few vast families spread by post-Neolithic dispersals (e.g. Indo-European, Sino-Tibetan, Bantu) which drag up the average and have erased earlier diversity. The New World in contrast lacks large Neolithic dis- persals, and the Pacific has just one in the form of Polynesian. This explanation and the community-size one I advance here are perhaps not mutually exclusive. A key feature of Neolithic (farming) societies as compared to Paleolithic (gathering) ones is that they are larger; thus we should expect slower change, less borrowing, and therefore a greater chance of detecting large families of the type exemplified by Indo-European and Bantu.
D. Nettle I Lingua 108 (1999) 119-136 133
and also with logic, since Africa is clearly the most ancient of human populations, and is not especially diverse either genetically or typologically (see Nettle, 1999 for a more detailed discussion).
4.2. The distribution of Object-initial word orders
It is often assumed that Object-Initial word orders are disfavoured in language. Tom- lin’s (1986) cognitive and discourse-based principles, for example, predict that SVO and SOV will be the most favoured word orders in the world’s languages, followed by VSO, with VOS and Object-initial orders (OVS and OSV) aberrant. In fact, most languages are SVO, SOV or VSO, and the three minor orders are all very rare, with the Object-initial orders rarest of all (see Pullum, 1981 for a catalogue of languages with the minor word orders). The minor orders in all probability represent function- ally non-optimal configurations whose evolution is generally unlikely, but into which drift (the random change in variant frequencies in finite, socially structured populations) may push languages from time to time.’
If the results of the simulation have any general validity, one could predict that the object-initial word orders would be more likely to be found in small communities than in large ones, due to the observed interaction of community size with the per- sistence of marked traits.
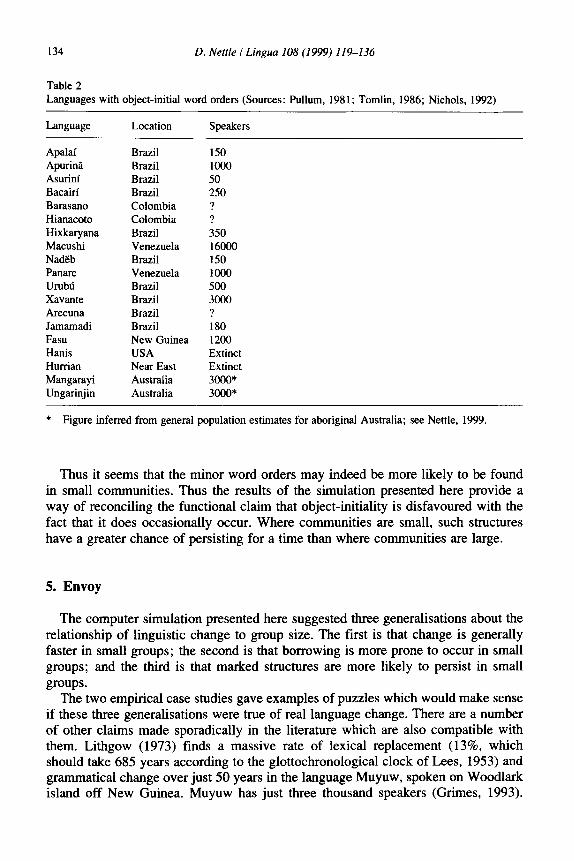
This is a difficult hypothesis to test. By amalgamating reports from several sources in the literature (Pullum, 1981; Tomlin, 1986; Nichols, 1992), I have found 19 claimed cases of object-initial orders. These are listed in Table 2 along with the number of their speakers where this is available or can be estimated with reasonable confidence.
The median size of the communities in Table 2 is 750. The median number of speakers for a human language in general is much greater; 5000, using the SIL data- base (see Nettle, 1999). Thus of the 14 object-initial languages for which there are data, only one (Macushi) is larger than the median size of a language in general, whilst 13 are smaller. It does thus seem that there is an association between object- initial order and community size.
Great care must be taken with data such as these, however, since the languages involved may not be phylogenetically or areally independent. If we count each one as a separate evolution of object-initiality we will certainly overestimate any associ- ation of group size and word order. At worst, it may turn out that there are only five independent instances of object-initial orders evolving; one in tropical South Amer- ica, one in the USA, one in the ancient Near East, one in New Guinea and one in Australia. Of these, we have no community size information for the USA case or the ancient Near-Eastern one; but in the other three cases, we can say with confidence that it arose in very small groups.
’ My use of the term drift here follows that standard in population genetics, rather than that used by Sapir (1921/1970) in his discussion of language change, which means sustained long-term change in a particular direction.
134 D. Nettle I Lingua 108 (1999) 119-136
Table 2 Languages with object-initial word orders (Sources: Pullum, 1981; Tomlin, 1986; Nichols, 1992)
Brazil 150 Brazil 1000 Brazil 50 Brazil 250 Colombia ? Colombia ? Brazil 350 Venezuela 16000 Brazil 150 Venezuela 1000 Brazil 500 Brazil 3000 Brazil ? Brazil 180 New Guinea 1200 USA Extinct Near East Extinct Australia 3oOO* Australia 3000*
* Figure inferred from general population estimates for aboriginal Australia; see Nettle, 1999.
Thus it seems that the minor word orders may indeed be more likely to be found in small communities. Thus the results of the simulation presented here provide a way of reconciling the functional claim that object-initiality is disfavoured with the fact that it does occasionally occur. Where communities are small, such structures have a greater chance of persisting for a time than where communities are large.
5. Envoy
The computer simulation presented here suggested three generalisations about the relationship of linguistic change to group size. The first is that change is generally faster in small groups; the second is that borrowing is more prone to occur in small groups; and the third is that marked structures are more likely to persist in small groups.
The two empirical case studies gave examples of puzzles which would make sense if these three generalisations were true of real language change. There are a number of other claims made sporadically in the literature which are also compatible with them. Lithgow (1973) finds a massive rate of lexical replacement (13%, which should take 685 years according to the glottochronological clock of Lees, 1953) and grammatical change over just 50 years in the language Muyuw, spoken on Woodlark island off New Guinea. Muyuw has just three thousand speakers (Grimes, 1993).
D. Nettle I Lingua 108 (1999) 119-136 135
More generally, there is extensive lexical borrowing and replacement commonly found between Australian languages and between New Guinean languages, which are very small (though this is also related to word tabooing - Dixon, 1997: 26). Thurston (1987: 66-67) specifically attributes the high rate of change and diffusion in this area to the smallness of the groups.
With respect to marked structures, Jakobson (1929) and Hymes (1971: vii) sug- gest that small languages retain greater surface complexity in phonology and mor- phology respectively, though the reasons they give for this differ from those advanced here. Nettle (1998) showed, for a sample of West African languages, that those spoken in the smallest communities had the largest inventories of segments, an finding that extends readily to the Khoisan languages, with their rich inventories of clicks and small group sizes. This is not a general relationship; Australian aboriginal languages, for example, have very simple phonological inventories (Maddieson, 1984); however, there is no case of a large language with an inventory of sounds as marked as that of !Xti, and rare phonetic segments, like the minor word orders, are often restricted to a few small languages (Ladefoged and Everett, 1996).
Facts such as these have not generally been accorded great significance, due to the reasonable commitment of most linguists to uniformitarianism and the autonomy of language from society. The results of this paper suggest, however, that such phe- nomena, and the distribution of language types and language families across human communities in general, might merit further investigation.
References
Arndt, W.W., 1959. The performance of glottochronology in Germanic. Language 35, 180-192. Bergslund, K. and H. Vogt, 1962. On the validity of glottochronology. Current Anthropology 3,
115-153. Clark, E.V., 1993. The lexicon in acquisition. Cambridge: Cambridge University Press. Dixon, R.M.W., 1997. The rise and fall of languages. Cambridge: Cambridge University Press. Fodor, I., 1961. The validity of glottochronology on the basis of the Slavic languages. Studia Slavica 7,
295-346. Grimes, B.F., 1993. Ethnologue: The world’s languages. 12th edition. Dallas, TX: Summer Institute of
Linguistics. Hymes, D., 1971. Introduction. In: M. Swadesh, The origin and diversification of language, v-ix.
Chicago, IL: Aldine Atherton. Jakobson, R., 1929. Remarques sur l’evolution phonologique du russe comparee a celle des autres
langues slaves. In: R. Jakobson, Selected writings, vol. I: Phonological studies, 7-l 16. The Hague: Mouton.
Kimura, M., 1983. The neutral theory of molecular evolution. Cambridge: Cambridge University Press. Ladefoged, P. and D. Everett, 1996. The status of phonetic rarities. Language 72, 794-800. Lees, R.B., 1953. The basis of glottochronology. Language 29, 113-127. Lithgow, D., 1973. Language change on Woodlark island. Oceania 44, 101-108. Maddieson, I., 1984. Patterns of sounds. Cambridge: Cambridge University Press. Nettle, D., 1998. Coevolution of phonology and the lexicon in twelve languages of West Africa. Journal
of Quantitative Linguistics, 5. Nettle, D., 1999. Linguistic diversity. Oxford: Oxford University Press. Nichols, J., 1990. Linguistic diversity and the first settlement of the New World. Language 66,475-521. Nichols, J., 1992. Linguistic diversity in space and time. Chicago, IL: University of Chicago Press.
136 D. Nettle I Lingua 108 (1999) 119-136
Nichols, J., 1994. The spread of languages around the Pacific rim. Evolutionary Anthropology 3, 206-215.
Pullum, G.K., 1981. Languages with subject before object: A comment and a catalogue. Linguistics 19, 147-155.
Rea, J.A., 1958. Concerning the validity of lexicostatistics. International Journal of American Linguis- tics 24, 145-150.
Renfrew, C., 1987. Archeology and language: The puzzle of Indo-European origins. London: Cape. Sapir, E., 1921/1970. Language. London: Harcourt, Brace and World. Swadesh, M., 1951. Diffusional cumulation and archaic residue as historical explanations. Southwestern
Journal of Anthropology 7, l-2 1. Teeter, K.V., 1963. Lexicostatistics and genetic relationship. Language 39, 638-648. Thomason, S.G. and T. Kaufman, 1988. Language contact, creolization, and genetic linguistics. Berke-
ley, CA: University of California Press. Thurston, W., 1987. Processes of change in the languages of Northwestern New Britain. Pacific Lin-
guistics B-99; Canberra: Australian National University. Tomlin, R., 1986. Basic constituent orders: Functional principles. London: Croom Helm.