IS YIELD RESPONSE SITE-SPECIFIC? REVISITING NITROGEN RECOMMENDATIONS ON CORN by Scott M. Swinton and Yanyan Liu* Department of Agricultural Economics Michigan State University, East Lansing, MI Neil R. Miller* Agri-Business Consultants, Inc. Birch Run, MI Selected Paper, American Agricultural Economics Association annual meeting, Long Beach, CA, July 28-31, 2002. Minor revision, August 9, 2002 Copyright 2002 by Scott M. Swinton, Yanyan Liu and Neil R. Miller. All rights reserved. Readers may make verbatim copies of this document for non-commercial purposes by any means, provided that this copyright notice appears on all such copies. * The authors are associate professor and research assistant in the Department of Agricultural Economics at Michigan State University, East Lansing, MI, and partner in Agri-Business Consultants, Inc., Birch Run, MI. They acknowledge financial support from the Corn Marketing Program of Michigan and the Groundwater Stewardship Program of the Michigan Department of Agriculture. The authors thank Ken Blight, Tim Godfrey, Ed Groholski, Eric Hiscock and Lynn Smith, members of the Innovative Farmers of South-central Michigan, whose on-farm experimentation made this analysis possible, as well as Natalie Rector and Bob Battel of Calhoun County MSU Extension for research facilitation, and John D. McGuire of Spatial Agricultural Systems, Inc., of Sherwood, OH, for ArcView Spatial Analyst data transformation. They also thank Sasha Kravchenko, Robert Myers and Ashton Shortridge for modeling insights.
Transcript
IS YIELD RESPONSE SITE-SPECIFIC?
REVISITING NITROGEN RECOMMENDATIONS ON CORN
by
Scott M. Swinton and Yanyan Liu*Department of Agricultural Economics
Michigan State University, East Lansing, MI
Neil R. Miller*Agri-Business Consultants, Inc.
Birch Run, MI
Selected Paper, American Agricultural Economics Association annual meeting,Long Beach, CA, July 28-31, 2002.
Minor revision, August 9, 2002
Copyright 2002 by Scott M. Swinton, Yanyan Liu and Neil R. Miller. All rights reserved.Readers may make verbatim copies of this document for non-commercial purposes by any
means, provided that this copyright notice appears on all such copies.
* The authors are associate professor and research assistant in the Department ofAgricultural Economics at Michigan State University, East Lansing, MI, and partner inAgri-Business Consultants, Inc., Birch Run, MI. They acknowledge financial supportfrom the Corn Marketing Program of Michigan and the Groundwater StewardshipProgram of the Michigan Department of Agriculture.
The authors thank Ken Blight, Tim Godfrey, Ed Groholski, Eric Hiscock and LynnSmith, members of the Innovative Farmers of South-central Michigan, whose on-farmexperimentation made this analysis possible, as well as Natalie Rector and Bob Battel ofCalhoun County MSU Extension for research facilitation, and John D. McGuire ofSpatial Agricultural Systems, Inc., of Sherwood, OH, for ArcView Spatial Analyst datatransformation. They also thank Sasha Kravchenko, Robert Myers and Ashton Shortridgefor modeling insights.
1
IS YIELD RESPONSE SITE-SPECIFIC?
REVISITING NITROGEN RECOMMENDATIONS ON CORN
Introduction
U.S. farmers have been slow to adopt variable rate applied (VRA) fertilizers in
cereal grain crops (Daberkow and McBride, 2000). A major reason is the very uneven
profitability results to date (Lambert and Lowenberg-DeBoer, 2000). Yield gains have
been negligible (Doerge, 2001, Swinton and Lowenberg-DeBoer, 1998) and neither this
nor fertilizer cost savings have outweighed the added costs of information (Hurley, et al.,
2001) and VRA equipment. The failure of yield gains from VRA fertilization to achieve
hoped-for levels has been blamed on poor prediction of soil fertility from interpolated
soil test values, miscalibrated VRA equipment, inaccurate yield goals, and weather.
Largely overlooked has been the possibility that the fertilizer recommendations might be
unsuited to VRA management (Hergert, et al., 1997).
Field crop fertilizer recommendations in the United States were developed during
a half century of multi-locational, small-plot experiments. Despite the celebrated efforts
of agricultural economists like Earl Heady and his associates to develop fertilizer use
rules based on production functions and economic marginality criteria (e.g., Heady and
Dillon, 1961, Hexem and Heady, 1978), the variability of empirical crop yield functions
across diverse landscapes and unpredictable weather was inconsistent with the need for
simple extension recommendations. State-level fertilizer recommendations emerged as
rough but serviceable compromise values, typically based on yield goals and/or soil tests,
not relative prices of fertilizer and crop. With the advent of VRA technologies, farmers
2
have set about making site-specific soil nutrient maps and fertilization plans following
state-level fertilization recommendations. In so doing, they have assumed that while soil
nutrient levels may vary site-specifically, the crop’s yield response to any given nutrient
level will be the same at any location in the state.
This paper challenges the assumption that yield response depends on nutrient
levels alone and not other site characteristics. In so doing, it questions whether the
dominant approach to fertilizer recommendations may be inappropriate for the
information age. Formally, we test the null hypothesis that site characteristics do not
interact with nitrogen (N) in affecting corn yield response. If they do, then site
characteristic variables omitted from yield response models may have led to biased
fertilizer response estimates. We further estimate the potential profitability foregone by
not using site-specific N rates. These estimates indicate potential willingness to pay for
the increased information costs of developing and implementing site-specific fertilizer
response recommendations.
Conceptual Framework
A site-specific model of expected profit maximization
The profit maximization problem for site-specific (SS) nitrogen application can be
conceptualized as optimization of the individual cells in a farm field that has been divided
into a Cartesian grid with i rows and j columns, such that any cell can be identified by its
coordinates i,j. Using this framework, the expected profit-maximization of the variable
rate fertilizer problem can be stated as a combination of a) cell-specific yield revenue and
3
variable-rate input costs and b) field- or farm-level quasi-fixed and fixed costs
(Lowenberg-DeBoer and Boehlje, 1996), as in Equation (1).
FCVGNpYpEEMax ijNijy
n
i
m
jNij
−−−−=∑∑= =
)]([)(1 1
π (1)
s.t. ),,,( ijijijijij cxNyY ε=
where
yp and Np are prices of corn yield and nitrogen respectively,
Yij is the corn yield in cell i,j,
Nij is the nitrogen rate applied to cell i,j,
ijx is the vector of managed variables other than N in cell i,j,
ijc is the vector of site characteristic variables in cell i,j,
G is the quasi-fixed cost of intensive data collection and analysis,
V is the quasi-fixed cost of VRA nitrogen ,
FC refers to all other costs, which are treated as fixed.
What makes this expected profit maximization problem special is the yield
function. Following Bullock and Bullock (Bullock and Bullock, 2000) and Bullock,
Lowenberg-DeBoer and Swinton (Bullock, et al., 2003), the yield function subdivides the
unmanaged variables into two categories, site characteristics (cij) and general stochastic
effects (εij).
4
Biological basis for interaction between corn response to N and site characteristics
Site characteristics may affect corn yield response to applied nitrogen (N) both
from the standpoint of nitrogen production and from the standpoint of nitrogen loss.
Much of the naturally occurring nitrogen available to corn plants is produced by the
mineralization of soil organic matter (OM) to plant-available ammonium (Brady and
Weil, 2002).
Soil colloids fix ammonium N due to the negative charge of clay particles and soil
OM. Soil cation exchange capacity (CEC) is an estimate of the ability of soil colloids to
retain positive cations, including ammonium. This complex may represent either a
source of plant available N or a mechanism for immobilizing free N depending on the
clay mineralogy, the concentration of ammonium in the soil solution, and environmental
conditions. As with OM, the spatial distribution of CEC is not random, and may
therefore be expected to affect the spatial pattern of corn response to applied fertilizer N.
Nitrogen losses in the light-textured soils of south-central Michigan are thought to
occur largely via the leaching of nitrate N through the soil profile. Nitrate is produced
naturally in the soil through oxidation of ammonium or supplied directly by inorganic
fertilizers. Because of their negative charge, nitrate ions are not fixed by soil CEC, and
thus move freely with water. Any factors that affect water infiltration thus affect N losses
and ultimately N availability to corn plants. Soil CEC as well as soil electrical and
magnetic conductivity all are highly correlated with to soil texture, and thus provide some
measurement of the distribution of nitrogen loss potential within fields.
Surface water movement may also function to move nitrogen from higher to
lower elevations within or beyond field borders, although it likely matters less on light
5
textured soils. To the extent that water carries with it soil particles, it will move organic
and ammonium nitrogen as well as nitrate. Water movement may also cause nitrogen
losses through denitrification if water is ponded for significant periods of time. Given
these links between water flows and N movement, surface water flows are expected to
affect the spatial distribution of soil N. An index for achieving this is described under
“Empirical Methods” below.
The rate of photosynthesis affects a corn plant’s ability to produce grain and its
relative demand for nitrogen. While sunlight is a general stochastic variable, topography
influences the propensity of plants to receive sunlight (Lee, 1978). Within a field, slope
and aspect affect both total sunlight and the angle at which sunlight is received. Hence,
by affecting sunlight availability, these terrain features are expected to affect the spatial
distribution of the crop’s photosynthetic activity , and thus its relative demand for N.
Hypothesis tests
Do site characteristics such as landscape position or soil traits change crop yield
response to N? The first null hypothesis claims that corn yield response to N is
completely separable in site characteristics, as follows:
H1: ),,|( ijijijijur
ij cxNyY ε=
versus the alternative hypothesis that nitrogen and site characteristics interact
nonseparably to effect a site-specific yield response, srijY ,
H1A: ),|,( ijijijijsr
ij xcNyY ε=
6
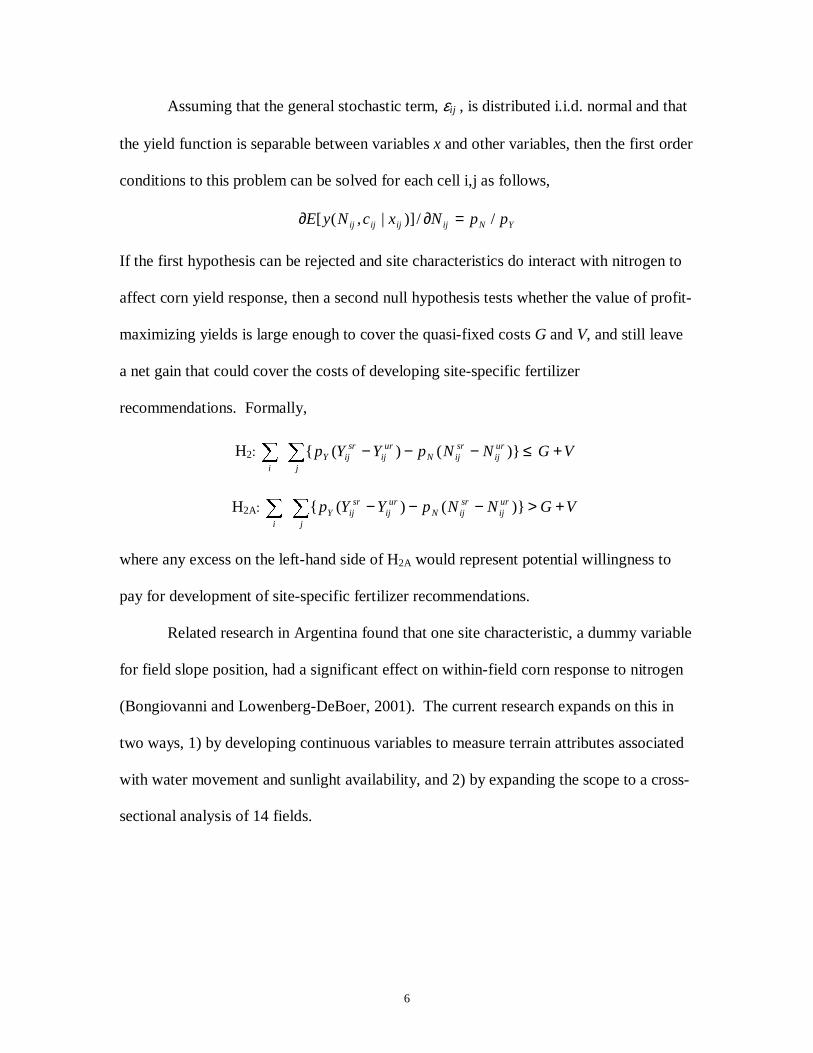
Assuming that the general stochastic term, εij , is distributed i.i.d. normal and that
the yield function is separable between variables x and other variables, then the first order
conditions to this problem can be solved for each cell i,j as follows,
YNijijijij ppNxcNyE //)]|,([ =∂∂
If the first hypothesis can be rejected and site characteristics do interact with nitrogen to
affect corn yield response, then a second null hypothesis tests whether the value of profit-
maximizing yields is large enough to cover the quasi-fixed costs G and V, and still leave
a net gain that could cover the costs of developing site-specific fertilizer
recommendations. Formally,
H2: VGNNpYYpj
urij
srijN
urij
srijY
i
+≤−−−∑∑ )}()({
H2A: VGNNpYYpj
urij
srijN
urij
srijY
i
+>−−−∑∑ )}()({
where any excess on the left-hand side of H2A would represent potential willingness to
pay for development of site-specific fertilizer recommendations.
Related research in Argentina found that one site characteristic, a dummy variable
for field slope position, had a significant effect on within-field corn response to nitrogen
(Bongiovanni and Lowenberg-DeBoer, 2001). The current research expands on this in
two ways, 1) by developing continuous variables to measure terrain attributes associated
with water movement and sunlight availability, and 2) by expanding the scope to a cross-
sectional analysis of 14 fields.
7
Data and Empirical Methods
Experiments were conducted on 14 commercial corn fields during 1999-2001.
The five farmer-cooperators were members of the Innovative Farmers of South Central
Michigan who self-selected on the basis of their interest in optimizing N management
and their ability to carry out spatially referenced on-farm experiments (including the use
of a combine yield monitor equipped with a global positioning system, GPS). As such,
they represent large, progressive producers in the area, not a typical cross-section.
The fields were located in Calhoun and Hillsdale counties, where agricultural
soils are primarily sandy loams and loams, some underlain by sand and gravel. An initial
soil test was taken in each field in fall, 1998, and variable-rate phosphorus, potassium and
lime were applied subsequently in order to eliminate these elements as possible factors
limiting yields. Most fields were planted to corn in two out of the three project years, and
soybeans in the off year. Cooperators selected cultivars, planting dates, populations, in-
row “starter” fertilizers, herbicides, and other inputs, just as they would for ordinary
commercial grain production.
In each experiment year, planter passes were mapped with GPS after planting, and
300 ft plot areas were identified parallel to these passes in randomized complete blocks of
3-5 plots each. Plot width was either 30 ft for cooperators with 6-row combines or 60 ft
for those with 8 row combines. This design allowed for 20-50 replications of each
treatment in a typical 40 acre experiment.
One to two weeks prior to side-dress N application, 12 pre-side-dress nitrate test
(PSNT) soil cores were taken to a depth of 12 inches in a 5-10 ft radius at the center of
each block. Samples were analyzed for soil nitrate, and corresponding nitrate N credits
8
were calculated using a conversion factor of 6 lbs/ac per 1 ppm soil nitrate (Vitosh et al.,
1995). N fertilizer treatments were determined as follows:
1) No side-dress nitrogen,
2) A non-limiting nitrogen rate (180-210 lbs/ac sidedress N),
3) The Tri-State recommended N rate (Vitosh, et al., 1995) based on the formula
(Yield goal*1.36) - 27- (field mean nitrate N-credit)
4) 33% less than treatment #3,
5) 33% more than treatment #3,
Nitrogen was applied when corn plants were 8-24 inches tall using 28% urea-
ammonium nitrate solution. Flow control was achieved using a gate valve run by a Mid-
Tech TASC 6200 contoller, and continuously monitored with a Mid-Tech flow meter.
Variable-rate application software, Agview (GIS Solutions, Inc.) in 1999 and SiteMate
(Farm Works Software) in 2000-2001, also recorded as-applied data from the flow meter.
Fields were harvested with combines equipped with yield monitors. Yield point
data were cropped from 50 ft at the end of each plot, and erroneous data were removed
where appropriate (e.g. combine start/stop points, around obstacles, areas of equipment
malfunction, etc.) Dry bushel yield point data (15.5% moisture), which were very dense,
were averaged over each trimmed experimental plot. The sparser data from the 1998 soil
test, PSNT results from each year, soil electrical (Veris) or magnetic (EM38)
conductivity, and digital elevation mapping, were first interpolated using inverse distance
weighting to the 4th power (or, for the special case of zone-sampled soil data, were
interpolated from sample points using a nearest neighbor technique). Interpolated values
were then cropped and summarized following the same scheme used for yield point data.
9
Digital elevation data were further converted to terrain derivatives (slope, aspect,
curvature, wetness index, and insolation potential) using ArcView Spatial Analyst
(Environmental Systems Research Institute, Inc.) All other GIS data manipulation and
summarization was accomplished using SSToolbox software (Site-Specific Technology
Development Group, Inc.)
Development of site-characteristic variables
A principal innovation of this research is the development of continuous site-
characteristic variables to capture the moisture flow and sunlight effects described above.
Two prior studies have used binary variables to capture the potential effect of site-
characteristics on crop yields. Bullock and Bullock (Bullock and Bullock, 2000)
simulated the potential effect of soil depth on crop yields, characterizing the potential
effects on input recommendations of omitting an unobserved binary soil depth variable.
Bongiovanni and Lowenberg-DeBoer (2000, 2001) conducted a spatial regression
analysis of corn yields in Argentina using binary variables to classify four slope
positions: east slope, hilltop, west slope, and west toe slope. They found that slope
position significantly affected profit-maximizing N recommendations.
The current study uses three classes of continuous variables describing site
characteristics expected to affect crop yield. The first set of soil test point data were
described above. These variables include N-credit from a PSNT, organic matter, and
CEC. The second set contains soil conductivity measures taken with Veris electrical
conductivity and EM38 electro-magnetic soil probes and also interpolated between
sampled points.
10
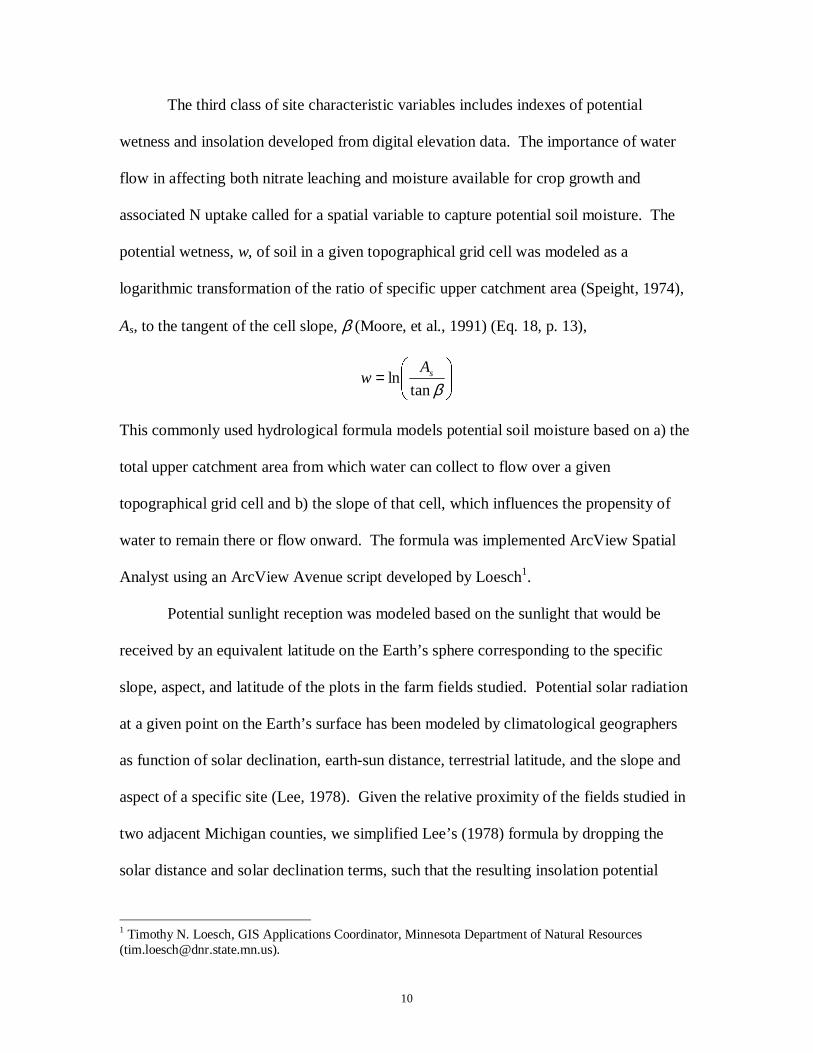
The third class of site characteristic variables includes indexes of potential
wetness and insolation developed from digital elevation data. The importance of water
flow in affecting both nitrate leaching and moisture available for crop growth and
associated N uptake called for a spatial variable to capture potential soil moisture. The
potential wetness, w, of soil in a given topographical grid cell was modeled as a
logarithmic transformation of the ratio of specific upper catchment area (Speight, 1974),
As, to the tangent of the cell slope, β (Moore, et al., 1991) (Eq. 18, p. 13),
=
βtanln sA
w
This commonly used hydrological formula models potential soil moisture based on a) the
total upper catchment area from which water can collect to flow over a given
topographical grid cell and b) the slope of that cell, which influences the propensity of
water to remain there or flow onward. The formula was implemented ArcView Spatial
Analyst using an ArcView Avenue script developed by Loesch1.
Potential sunlight reception was modeled based on the sunlight that would be
received by an equivalent latitude on the Earth’s sphere corresponding to the specific
slope, aspect, and latitude of the plots in the farm fields studied. Potential solar radiation
at a given point on the Earth’s surface has been modeled by climatological geographers
as function of solar declination, earth-sun distance, terrestrial latitude, and the slope and
aspect of a specific site (Lee, 1978). Given the relative proximity of the fields studied in
two adjacent Michigan counties, we simplified Lee’s (1978) formula by dropping the
solar distance and solar declination terms, such that the resulting insolation potential
1 Timothy N. Loesch, GIS Applications Coordinator, Minnesota Department of Natural Resources([email protected]).
11
index differs only in omitting a linear multiple that varies over the year but is constant
across these fields at a moment in time. The insolation potential index, IPI, synthesizes
slope, aspect and latitude as the sine of the equivalent latitude on the surface of the
terrestrial sphere (Lee 1978, Eq. 3.31, p. 57),
))(sin(cos))(cos)(cos(sin'sin λβλαβλ +==IPI
where β remains slope inclination, α is aspect (azimuth measured in degrees clockwise
from north), λ is terrestrial latitude, and λ’ is the latitude of a horizontal surface on the
Earth's surface that would get sunlight equivalent to the measured location.
Given the expected interaction of weather with site characteristics, the three
seasons over which the experiments were conducted offered a wide range of weather
conditions. The 1999 growing season was hot and dry. Under such conditions, there is
little water movement through the soil profile, an observation supported by the relatively
high soil nitrate values and resultant N credits measured in 1999. Crops were limited by
moisture in non-irrigated experiment fields in 1999. By contrast in 2000, near-record
rainfall fell on much of South-Central Michigan. During May and early June, when
nitrate leaching potential is presumably high, most fields recorded at least one 4-day
period over 2 inches of precipitation. Soil nitrate test values were much lower than in
1999. Through the remainder of the growing season, rain was well-distributed and
resulted in record yields on many non-irrigated fields. In 2001, precipitation varied
widely across the region, ranging from record levels in the northwest to droughty
conditions in the southeastern part of the two-county project area.
12
Analytical approach
Specification of the regression models
In preliminary research, three different functional forms were reviewed for the
yield response function, ),( ijijij NyY ε= at the field level. Upon discovering that the null
hypothesis of quadratic yield response could not be rejected over those of a von Liebig-
style linear or quadratic response and plateau, we adopted the maintained hypothesis of
quadratic yield response for the sake of computational tractability (Lau, 1986).
As discussed above, weather – especially rainfall – was expected to interact with
site characteristic variables (c) in effecting yield response. It was therefore inappropriate
to pool the three years’ data unless weather were explicitly modeled as a vector of
explanatory variables. Instead, cross-field data were pooled to specify three different
models of each year (1999, 2000 and 2001):
1. Full model: Ysr = y( N , 2N , c, cN × );
2. Final model: Full model minus jointly insignificant explanatory variables;
3. Simple model: Regress Yield on Yur =y( N , 2N ) (omits site characteristics).
This approach assumes that (1) similar weather prevails across the different fields during
the same year (reasonable, given the fields were in adjacent counties), and (2) site
characteristics affect yield response to nitrogen similarly across different fields,
conditional experiencing similar weather. The full model and final model are based on
the information set including c, while the simple model is based on the information set
without c. The models were estimated separately by year as cross sectional data using
ordinary least squares with a dummy variable assigned to each field to model the fixed
effect across fields. Robust standard errors using the Huber/White/sandwich estimator of
13
variance for fields as clusters were used in Stata 6.0 (Stata Corp. 1999), due to evidence
of spatial autocorrelation in separate analyses (details not reported here). The fixed
effect approach applied here has been shown to control for spatial error structure where
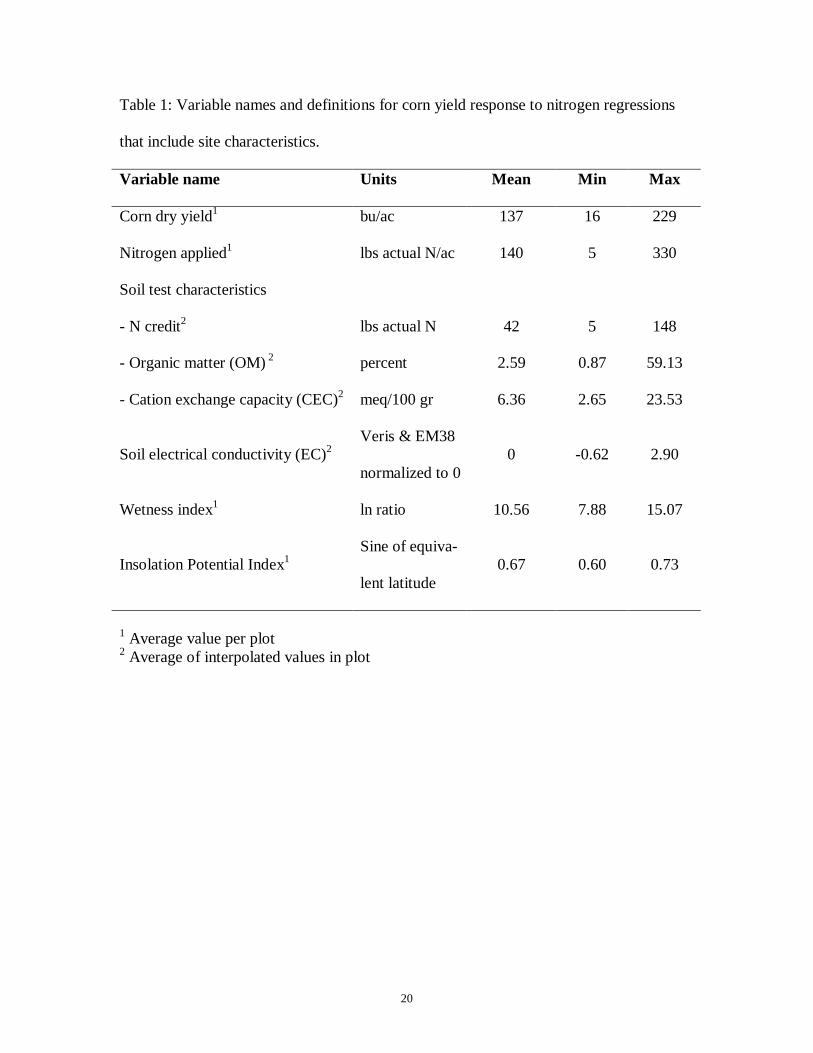
model disturbances are correlated with defined zones (Case, 1991). Descriptive statistics
for all variables included in the yield response models are presented in Table 1.
The test of the second hypothesis addresses the question: Can the value of the
additional site-specific information cover the costs of site-specific data collection and
VRA? Assuming the specified final model from the first hypothesis test is the true
model, we evaluate the value of site-specific information using two different assumptions
about the available information. The two informational assumptions both revolve around
how rainfall or irrigation affects corn response to N. Moisture effects are divided into
two periods, before and after side-dress N is applied in mid-June. During the early
period, from March 1 to June 15, precipitation is expected to cause nitrate leaching from
the crop root zone, making plant-available N scarcer. During the later period, from June
15 to August 15, precipitation is expected to contribute directly to crop growth. Weather
from the early period is known at side-dress time. Weather for the mid-summer period is
not known. However, farmers with irrigation can assure a minimum necessary water
supply.
Two alternative assumptions emerge about the weather information available to a
corn grower. The first assumption (for the irrigated corn grower) is that moisture
availability for the crop year is known or controllable. By side-dress time, most nitrate
leaching has taken place, and water necessary for crop growth can be assured through
irrigation later in the season. The second assumption (for the rainfed corn grower) is that
14
current year weather information is not available, only knowledge of long-term climate
patterns in the area. From this perspective, the grower may ignore N leaching
information prior to side-dress time and cannot predict late season rainfall.
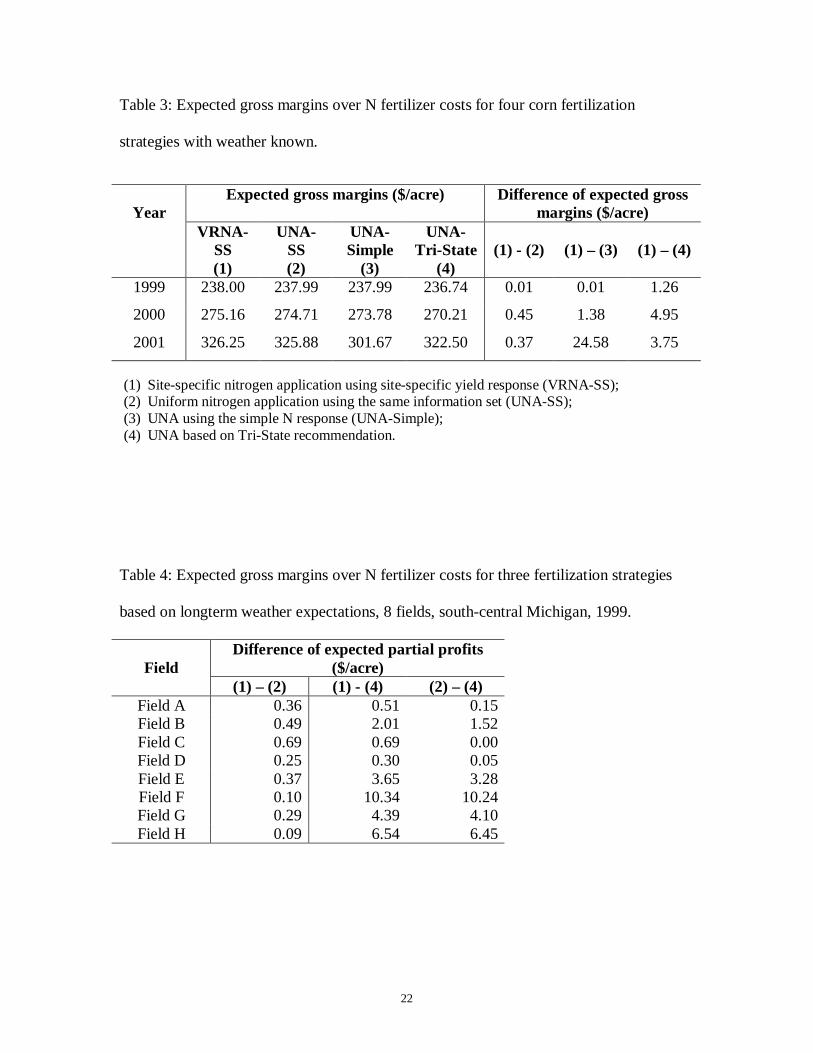
Based on both assumptions, we compare the gross margin )( NpYp Ny − of the
three nitrogen management methods: (1) VR nitrogen application using the final yield
response model with site characteristic variables (VRNA-SS), (2) uniform nitrogen
application, also using the final, site-specific yield response model2 (UNA-SS), (3) UNA
based on simple yield response function without site characteristic variables, and (4)
UNA based on the Tri-State nitrogen fertilizer recommendation for corn (Vitosh, et al.,
1995) . Although VRNA and UNA use parallel information sets, the additional cost
incurred by VRNA is G+V, while the additional cost incurred by UNA is G for the site-
specific case and zero for the Tri-State case.
The second alternative information set assumes that if long-term weather
conditions are known, then particular states of nature can be associated with probabilities.
Suppose there are M possible states of nature, each with probability Mmqm ,...,2,1, = . If
a model of yield response to N and c could be specified for each weather condition, then
an optimal nitrogen rate could be derived to maximize expected profit. Since we only
have three years’ data, such analysis must be done under the assumptions that the three
years represent three distinct states of nature and that no other states of nature are
possible. Given that 1999 was a dry year, 2000 a wet year, and 2001 a mixed year, yield
response for these three years was associated with probabilities of comparable states of
2 This approach includes information cost G but not variable rate application cost V. Schnitkey et al.(1996) showed that site-specific soil nutrient information can be used to improve upon a naïve model ofwhole-field average response for uniform rate fertilizer application.
15
nature occurring. Based on 42 years of daily precipitation data from the nearest weather
stations, annual precipitation data from 1960 to 2001 were divided into three categories:
17 dry years, 7 wet years, and 18 moderate years. Thus the probability of facing a dry
year, a wet year and a moderate year is roughly 40%, 20% and 40%, and these
probabilities were associated with yield response following patterns estimated for 1999,
2000 and 2001, respectively. Returns to N recommendations based upon such average
weather conditions were estimated using yield response functions for the 1999 year.
Results
Do site characteristics affect corn yield response to nitrogen fertilizer?
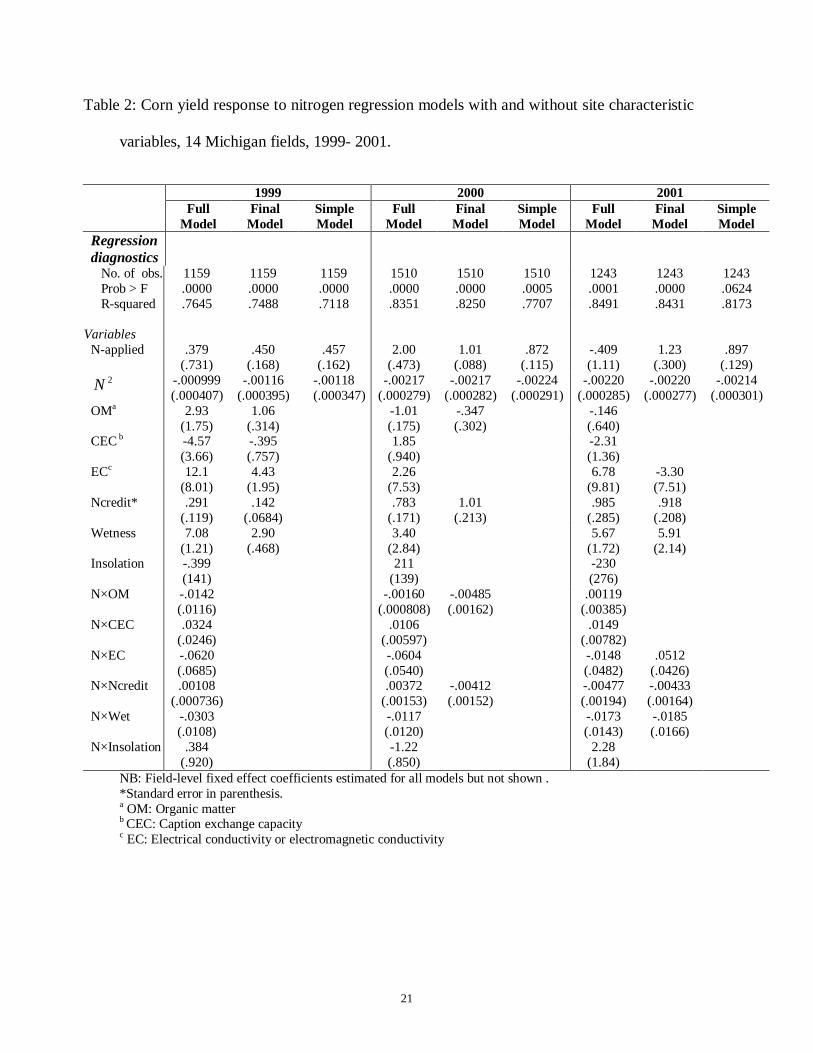
Results of the three statistical models of years 1999, 2000 and 2001 are
summarized in Table 2. The explanatory variables included in the final model and their
coefficient estimates differ considerably from year to year, providing evidence that the
effect of site characteristics on yield response to nitrogen depends on the weather
condition. N credit systematically increased yields in all three years, and the N × Ncredit
interaction term decreased yields, indicating that the N credit works like N itself, as it
should. The Wetness index increased yields in the two drier years (1999, 2001), but had
no significant yield effect in rainy 2000. Organic mater and EC significantly influenced
yields in two years but changed sign, increasing yield in dry 1999 but reducing it in
moderate 2001. Cation exchange capacity (CEC) and several of the N interaction terms
with site characteristics were significant in individual years. The Insolation Potential
Index (IPI) and had no significant effect on corn yields.
16
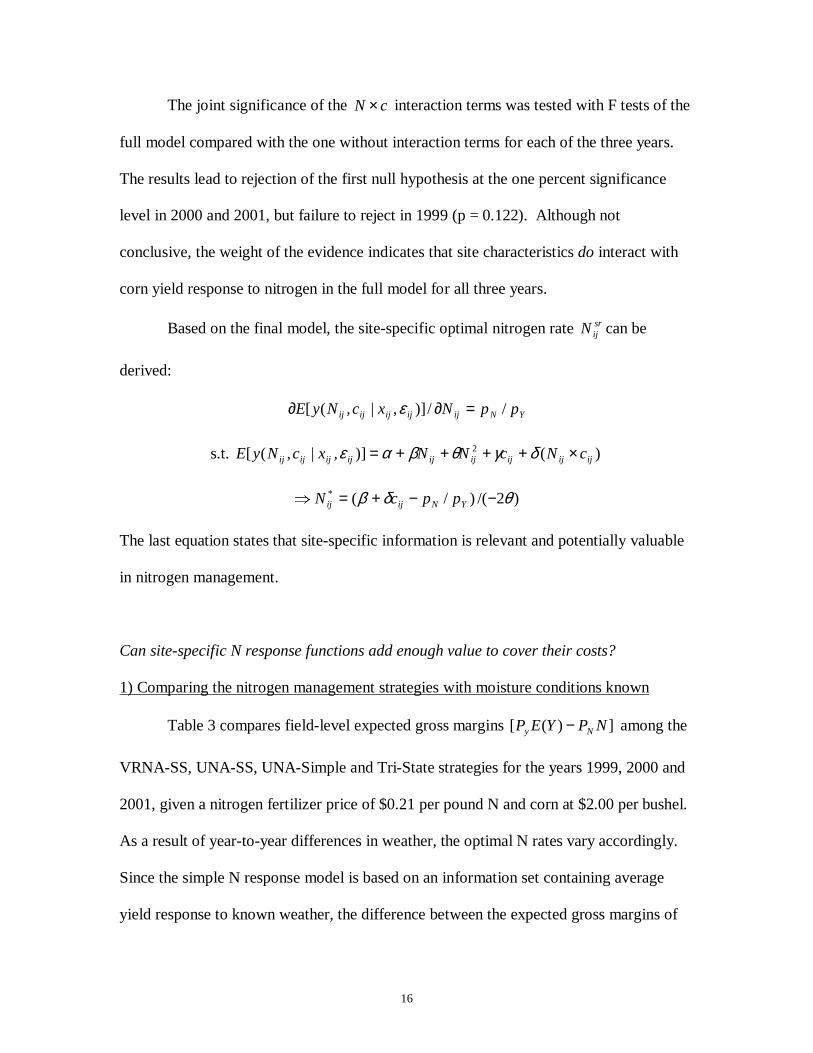
The joint significance of the cN × interaction terms was tested with F tests of the
full model compared with the one without interaction terms for each of the three years.
The results lead to rejection of the first null hypothesis at the one percent significance
level in 2000 and 2001, but failure to reject in 1999 (p = 0.122). Although not
conclusive, the weight of the evidence indicates that site characteristics do interact with
corn yield response to nitrogen in the full model for all three years.
Based on the final model, the site-specific optimal nitrogen rate srijN can be
NB: Field-level fixed effect coefficients estimated for all models but not shown .*Standard error in parenthesis.a OM: Organic matterb CEC: Caption exchange capacityc EC: Electrical conductivity or electromagnetic conductivity
22
Table 3: Expected gross margins over N fertilizer costs for four corn fertilization
strategies with weather known.
Expected gross margins ($/acre) Difference of expected grossmargins ($/acre)Year
VRNA-SS(1)
UNA-SS(2)
UNA-Simple
(3)
UNA-Tri-State
(4)(1) - (2) (1) – (3) (1) – (4)
1999 238.00 237.99 237.99 236.74 0.01 0.01 1.26
2000 275.16 274.71 273.78 270.21 0.45 1.38 4.95
2001 326.25 325.88 301.67 322.50 0.37 24.58 3.75
(1) Site-specific nitrogen application using site-specific yield response (VRNA-SS);(2) Uniform nitrogen application using the same information set (UNA-SS);(3) UNA using the simple N response (UNA-Simple);(4) UNA based on Tri-State recommendation.
Table 4: Expected gross margins over N fertilizer costs for three fertilization strategies
based on longterm weather expectations, 8 fields, south-central Michigan, 1999.
Difference of expected partial profits($/acre)Field
(1) – (2) (1) - (4) (2) – (4)Field A 0.36 0.51 0.15Field B 0.49 2.01 1.52Field C 0.69 0.69 0.00Field D 0.25 0.30 0.05Field E 0.37 3.65 3.28Field F 0.10 10.34 10.24Field G 0.29 4.39 4.10Field H 0.09 6.54 6.45
23
Bibliography
Bongiovanni, R., and Lowenberg-DeBoer, J (2000) "Nitrogen Management in Corn
Using Site-specific Crop Response Estimates from a Spatial Regression Model."
In P. C. Robert, ed. 5th International Conference on Precision Agriculture.
Bloomington, MN: Agronomy Society of America, pp. (forthcoming)
Bongiovanni, R., and J. Lowenberg-DeBoer (2001). "Precision Agriculture: Economics
of Nitrogen Management in Corn Using Site-specific Crop Response Estimates
from a Spatial Regression Model." Selected paper. American Agricultural
Economics Association annual meeting, Chicago, IL.
Brady, N. C and R.R. Weil. The Nature and Properties of Soils. 13th ed. New York:
Macmillan, 2002.
Bullock, D. S., and D. G. Bullock. "From Agronomic Research to Farm Management
Guidelines: A Primer on the Economics of Information and Precision