66
Is Your EPM Implementation Falling Behind? The Top 11 Signs Jim Kubik National Pre-Sales Architect [email protected] 216.798-2236 Add me on LinkedIn!

Is Your EPM
Implementation Falling
Behind? The Top 11 Signs
Jim Kubik
National Pre-Sales Architect
216.798-2236
Add me on LinkedIn!


Disclaimer
These slides represent the work and opinions of the
presenter and do not constitute official positions of Oracle
or any other organization.
This material has not been peer reviewed and is
presented here with the permission of the presenter.
This material should not be reproduced without the
written permission of interRel Consulting.
3

8
Strategic Assessment with interRel
Strategic Assessment Benefits
The Strategic Assessment is designed to analyze immediate and long
term EPM/BI needs including close solutions, planning and modeling
as well as reporting and analysis across the organization. We’ll
discuss and recommend how to deliver a solution that delivers both
management and operational excellence with smart, agile and aligned
solutions.
Dedicated team
Complete Assessment across your EPM / BI environment(s)
Evaluate current and future investments
Short, Mid, and long term roadmap / recommendations
Why you need to do these recommendations vs. How and What
Can be used to evaluate current projects or scope future RFPs
Cloud Strategy Roadmap

9
Glossary – Secret Decoder
9
• OAC = Oracle Analytics Cloud
• BI = Business Intelligence
• DVCS = Data Visualization Cloud Service
• DVD = Data Visualization Desktop
• EssCS = Essbase Cloud Service
• EPBCS = Enterprise Planning Cloud Service
• EPRCS = Enterprise Performance Reporting Cloud Service
• PCMCS = Profitability & Cost Management Cloud Service
• FCCS = Financial Close & Consolidation Cloud Service
• ARCS = Account Reconciliation Cloud Service
• FDMEE – Financial Data Quality Management Enterprise Edition
• Data Management = FDMEE “Lite”

10
Full BI and EPM Data Flow
EPM Reporting & Analysis
Operational
Data Integration
CRM
ERP / GL
Govern (DRM / EDMCS)
ETL
(FDMEE )
(Data Management)
(ODI)
(Other)
Close and
Consolidation
Planning and
Budgeting
Account
Reconciliation
Profitability
and Costing
Other
Unstructured / Data Lake

#1Reporting From the ERP

ERP Reporting is a Problem
Management reporting from ERP systems (EBS FSGs,
PeopleSoft nVision, etc.) is a pre- or non-EPM shop approach
Often considered necessary due to shortcomings in integration
from ERP to EPM
Actuals not loaded frequently enough and/or not quickly enough
Lack of confidence, understanding, or control of load & mapping process
Indicates the enterprise has not shifted thinking and fully bought in
to an EPM philosophy
Centralized reporting
Data federation
Standardized tools and processes
Shifting the “system of record” for financials to EPM
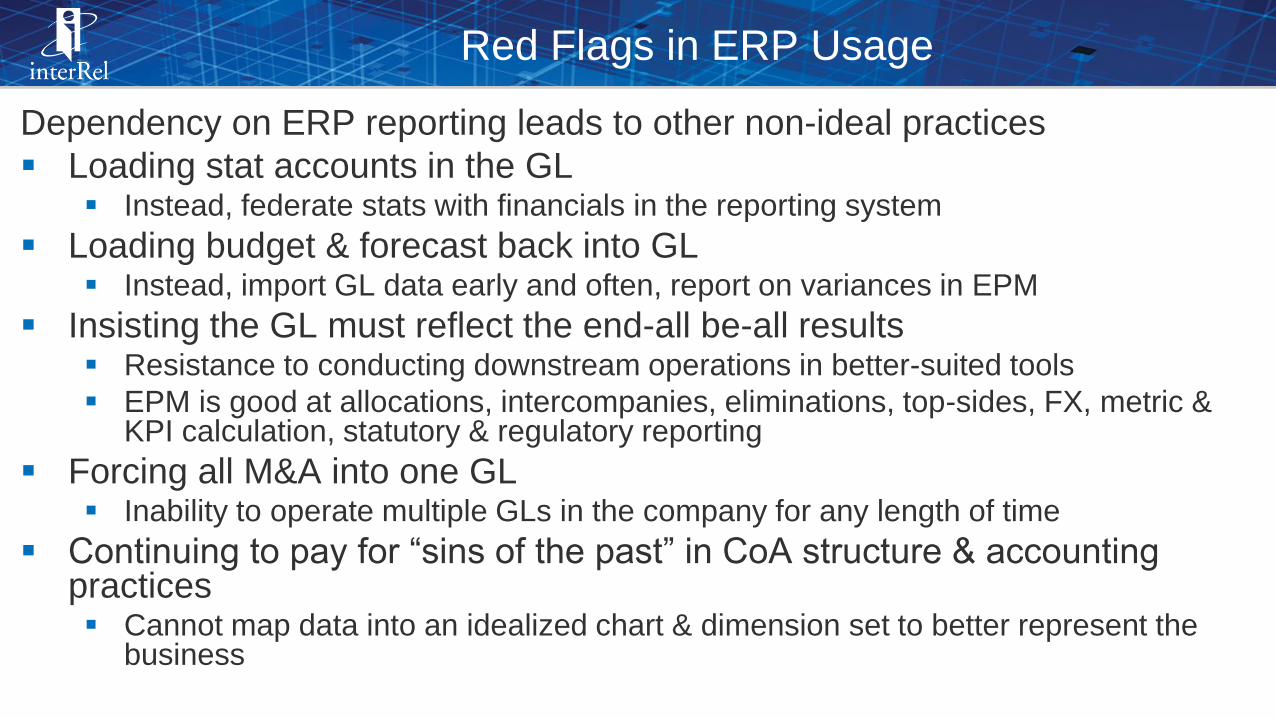
Red Flags in ERP Usage
Dependency on ERP reporting leads to other non-ideal practices
Loading stat accounts in the GL Instead, federate stats with financials in the reporting system
Loading budget & forecast back into GL Instead, import GL data early and often, report on variances in EPM
Insisting the GL must reflect the end-all be-all results Resistance to conducting downstream operations in better-suited tools
EPM is good at allocations, intercompanies, eliminations, top-sides, FX, metric & KPI calculation, statutory & regulatory reporting
Forcing all M&A into one GL Inability to operate multiple GLs in the company for any length of time
Continuing to pay for “sins of the past” in CoA structure & accounting practices Cannot map data into an idealized chart & dimension set to better represent the
business

#2
No Essbase or Not Many
Essbase Cubes
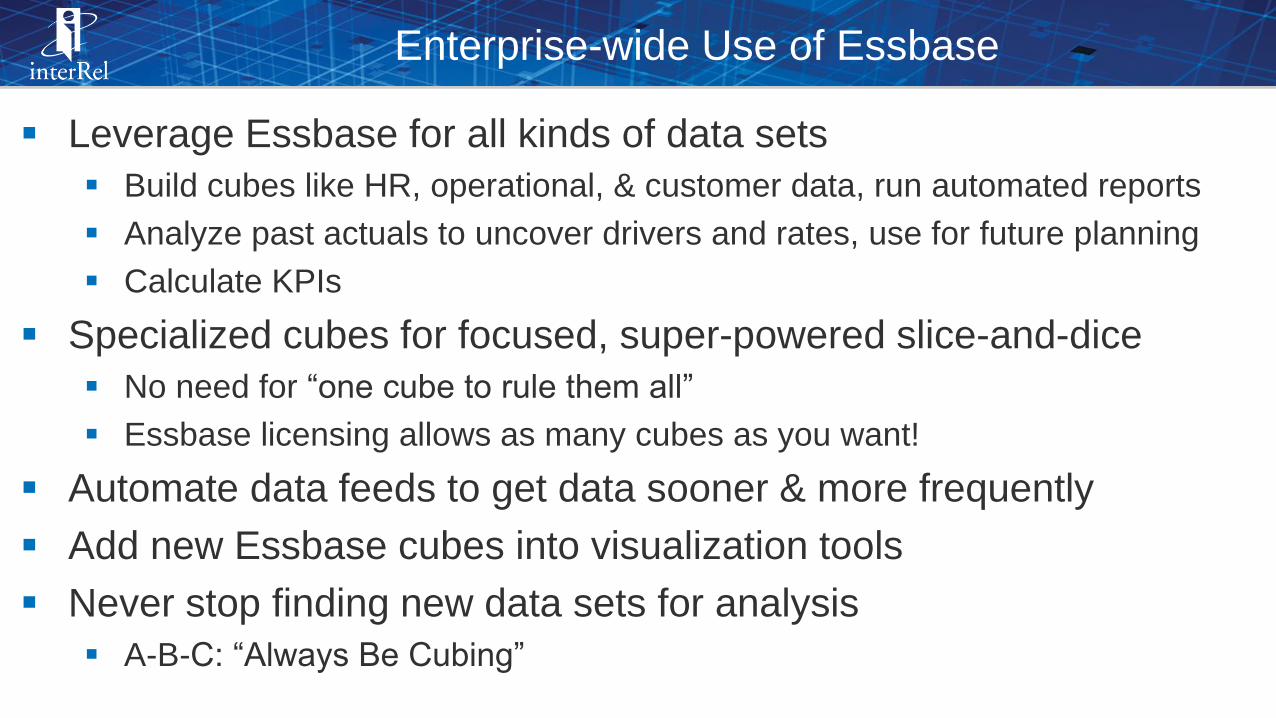
Enterprise-wide Use of Essbase
Leverage Essbase for all kinds of data sets
Build cubes like HR, operational, & customer data, run automated reports
Analyze past actuals to uncover drivers and rates, use for future planning
Calculate KPIs
Specialized cubes for focused, super-powered slice-and-dice
No need for “one cube to rule them all”
Essbase licensing allows as many cubes as you want!
Automate data feeds to get data sooner & more frequently
Add new Essbase cubes into visualization tools
Never stop finding new data sets for analysis
A-B-C: “Always Be Cubing”

Essbase: Not Just for Finance
Sales Sales Force Effectiveness Pipeline Analysis Flash Sales
Customers Customer Segmentation Customer ProfitabilityPromotion & Campaign
Effectiveness
Suppliers Vendor ScorecardsSupply and Demand
PlanningStrategic Sourcing Analysis
Human Resources
Compensation Analysis Time & Labor Analysis Benefits Offering Analysis
Finance Budgeting / Planning Cost Analysis Cash Flow Analysis
Operations Productivity Analysis Quality Analysis Labor and Cost Analysis
#3
No Analytics Strategy

How We Deliver Data
Interactive
Dashboards and Data
Visualization
Pixel
Perfect
Reporting
Mobile
Microsoft Office
integration
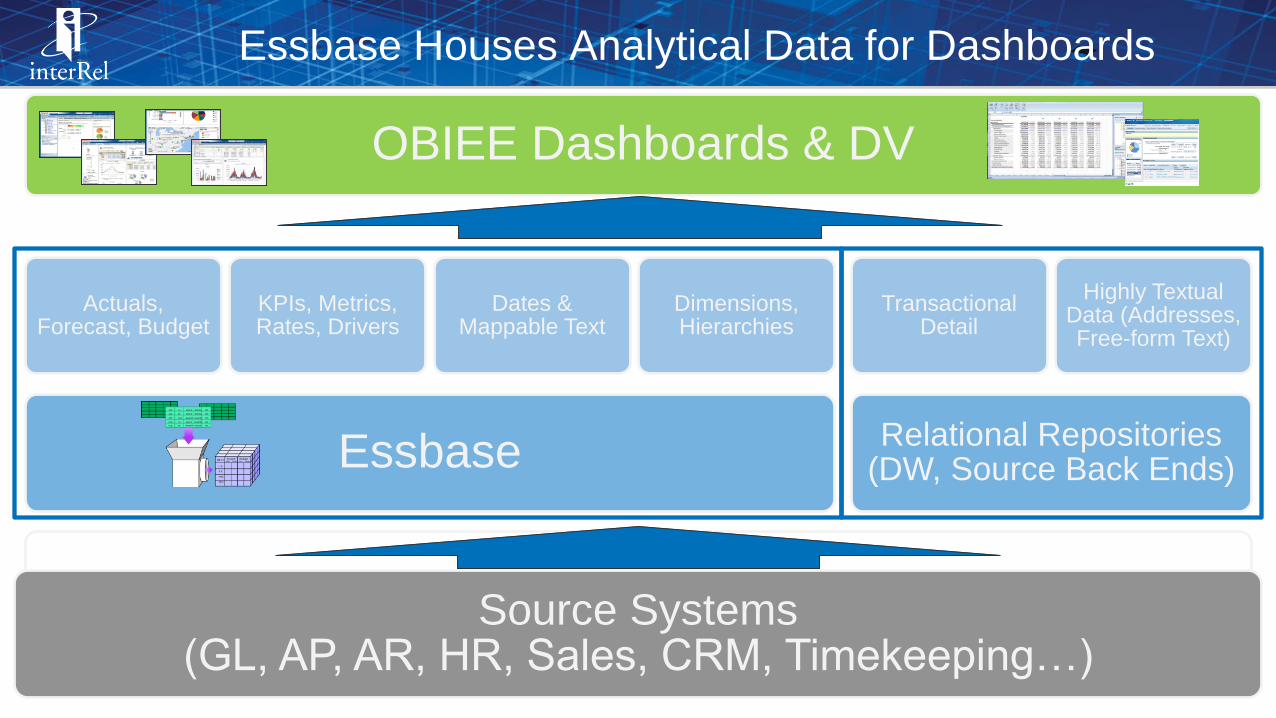
Essbase Houses Analytical Data for Dashboards
Essbase
Actuals, Forecast, Budget
KPIs, Metrics, Rates, Drivers
Dates & Mappable Text
Dimensions, Hierarchies
Relational Repositories(DW, Source Back Ends)
Transactional Detail
Highly Textual Data (Addresses, Free-form Text)
OBIEE Dashboards & DV
Source Systems(GL, AP, AR, HR, Sales, CRM, Timekeeping…)

Integration Between OBIEE & Essbase
Often, dashboarding is primarily grid-based, sourced from the DW
Not connected to Essbase
Data that goes to Essbase takes a different path than to / through DW
OBIEE should be connected to all Essbase reporting cubes
Financial & Operational
Self-service, timely, on-demand
Interactive visualizations
Graphical, summary, high-level, integrated data presented via
OBIEE
Data sets from multiple sources
Interactive charts & graphs
Drill through to more detailed graphics or granular detail

Data Flow thru the Enterprise
Data VisualizationBusiness IntelligenceOffice Integration, Pixel Perfect
reporting and Mobile
Curated Data
Top X dashboards to run the Company
Enterprise
CXO Level
Manager Level
Non - Curated Data
Ad-Hoc
Data Discovery
Next level after BI
Departmental
Dept Manager
Super Users
Analyst
Field People
Financial reports
Customer facing
Field reps
Bursting use cases
Mobile
Day by Day

Oracle Analytics Cloud (OAC)
Data Visualization Cloud (DVCS)
Standard (priced per OCPU)
Data Visualization Cloud Service (DVCS)
Data Visualization Desktop (50 licenses per
OCPU)
Oracle Smart View
Oracle Essbase
Enterprise (priced per OCPU)
All of Standard
Business Intelligence Cloud Service (BICS)
Oracle Essbase Enterprise
Day by Day
Universal CreditsEssbase
BI
Smart View
Day by Day
DVCS
DV Desktop

Oracle Analytics Cloud
Dashboarding and analytics
over the web and in Excel
Based on proven BI technology
relied on by millions of users
Integrated with Oracle
Database Cloud Service
Built-in mobile
Simple administration and data
integration

Start Here!
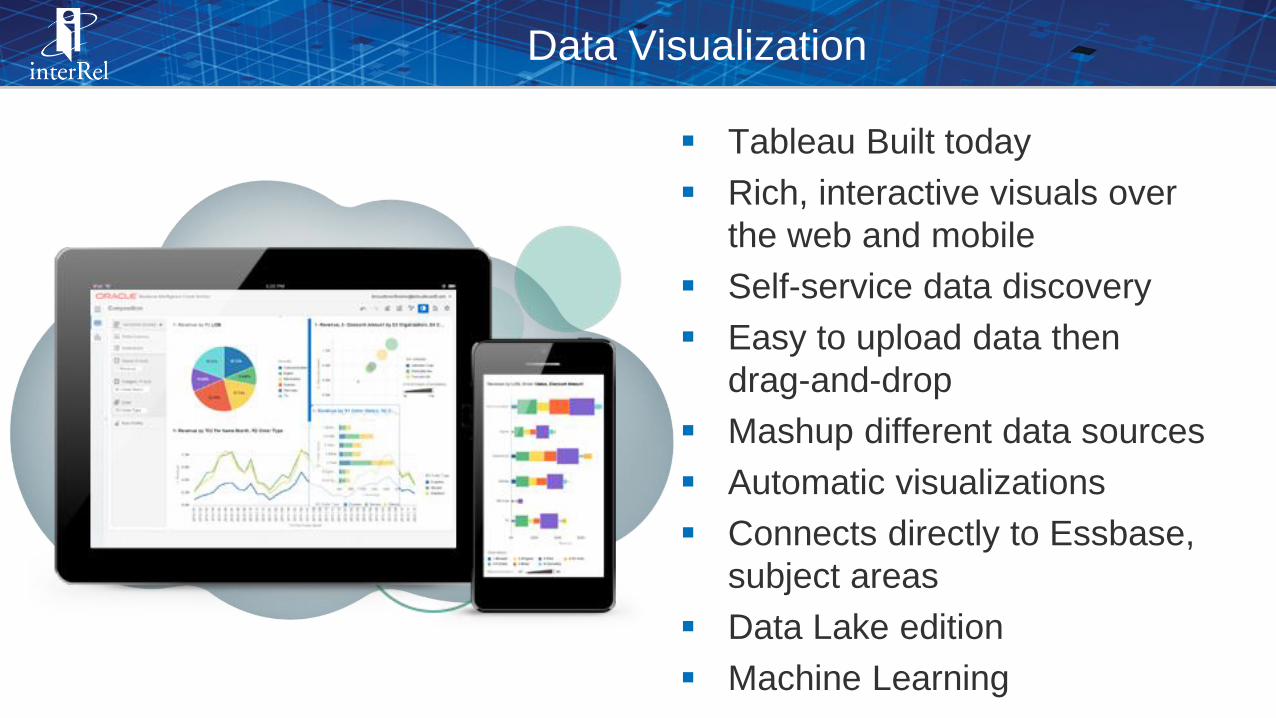
Data Visualization
Tableau Built today
Rich, interactive visuals over
the web and mobile
Self-service data discovery
Easy to upload data then
drag-and-drop
Mashup different data sources
Automatic visualizations
Connects directly to Essbase,
subject areas
Data Lake edition
Machine Learning

DV Demo on Top of an Essbase Cube

Smart View
Common Microsoft add-in for
Oracle EPM solutions (both on
premise and Cloud)
Perform analysis and create
highly formatted reports
Plan in Excel
Perform Consolidations
Maintain dimensions
Often used by power users and
analysts who like to work in the
Excel interface
Integrate Oracle EPM System
data to Word, PowerPoint, Excel,
and Outlook

Driving Innovation with BI Mobile
BI Mobile HDFor Mobile Consumption

Oracle Day by Day
Next generation of mobile analytics
designed to work with BICS
Search and reports generated entirely on
the mobile device
Search can be typed or voice-controlled
Can configure content based on a schedule
or location
Content can be generated based on who is
calling you (Android only)
Access can be fingerprint secured

31
OAC - Bringing it all together
.

#4
No Strategic, Long-Term or
Scenario Planning

Long-Range Planning
High-level, long term plans (5-25 years)
Typically has been done in limited Excel models
Difficult to model, combine, mix-n-match multiple scenarios
Limited slice-n-dice analysis
No system-wide rules enforcement (debt covenants, balance sheet
watchdogs)
Problems with lack of functionality, scalability, usability
Better management through Hyperion Strategic Finance
Very expensive
Now off the strategic roadmap
Functionality now implemented in EPBCS
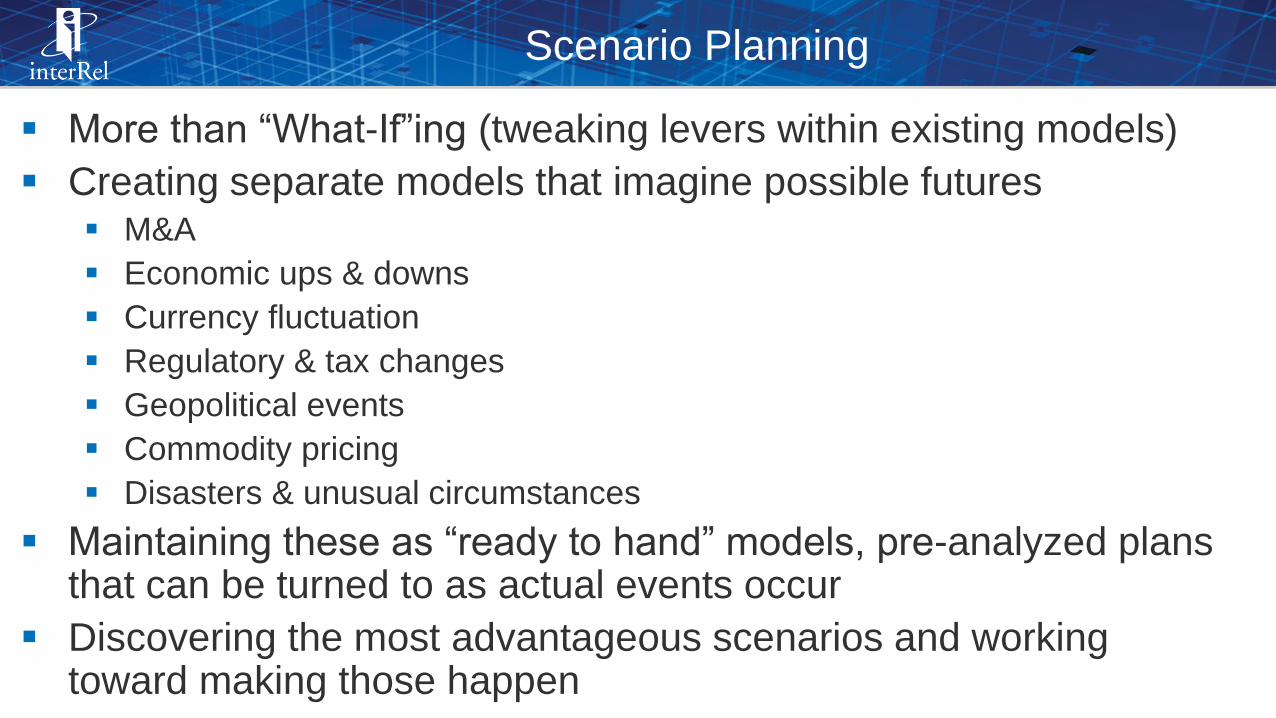
Scenario Planning
More than “What-If”ing (tweaking levers within existing models)
Creating separate models that imagine possible futures M&A
Economic ups & downs
Currency fluctuation
Regulatory & tax changes
Geopolitical events
Commodity pricing
Disasters & unusual circumstances
Maintaining these as “ready to hand” models, pre-analyzed plans that can be turned to as actual events occur
Discovering the most advantageous scenarios and working toward making those happen

What is Hyperion Strategic Finance?
Integrates and consolidates
financial forecast models among
your corporate planning, business
development, treasury, and
investor relation groups
Merger and acquisition analysis
Strategic planning
Equity analysis
Deal underwriting
Portfolio analysis
Top down target setting
Contingency Planning
Strategy Screening
Covenant / Ratio
Analysis
Funding Alternatives
Rating Agencies
M&A Valuation Analysis
Major Capital
InvestmentsDivestitures
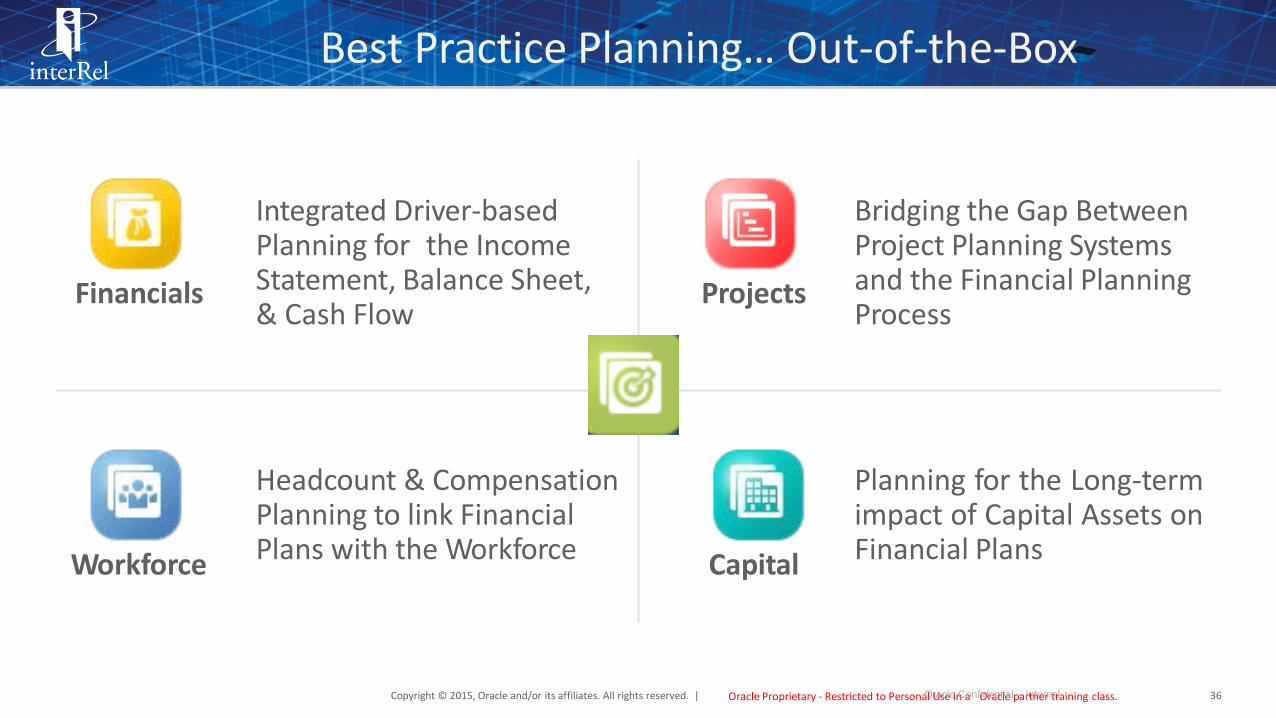
Best Practice Planning… Out-of-the-Box
Integrated Driver-based Planning for the IncomeStatement, Balance Sheet,& Cash Flow
Bridging the Gap Between Project Planning Systemsand the Financial PlanningProcess
Headcount & Compensation Planning to link Financial Plans with the Workforce
Planning for the Long-termimpact of Capital Assets onFinancial Plans
Financials
Oracle Proprietary - Restricted to PersonaOl rUasceleinCaonfOidreanctliealp–arIntnteerrntarlaining class.Copyright © 2015, Oracle and/or its affiliates. All rights reserved. | 36
Projects
CapitalWorkforce

Strategic Modeling: Just Added to EPBCS
Strategic Modeling provides these key features:
Ability to create models on the fly
On the fly scenario Modeling
Consolidate across scenario models
Account forecast with out of the box forecast methods
Audit Trail to determine how values are calculated
Goal seek
Funding options
Out of the box model reports including income statement, balance sheet, and cash flow
Create custom reports using Excel
A built-in hierarchical chart of accounts to get you up and running quickly, along with the ability to add subaccounts for planning at a more detailed level
The ability to check the status of consolidations from the Job Console, and the ability to customize navigation flows
Access control to manage permissions for models
#5
Outdated Planning
Methodology

Elements of Design in a Modern Planning Application
Integrated Calculation
Separation of Purpose
(Planning for planning)
Data In From & Out To Reporting
Cube
Drivers, Allocations,
KPIs, Metrics in system
Smart View in Excel as viewer
Upper levels always up-to-date (Run on
Save)
Focused Aggs (BSO)
Instant Aggs (ASO & Hybrid)
Advanced Methods
Rolling Forecasts /
Beyond Budgeting Concepts
Predictive Planning
Interactive Environment
Customized user experience
Task Lists by User Type
Validation Rules
Right-click menus and inter-form navigation
Graphical Feedback
Composite / Master & Detail
Forms
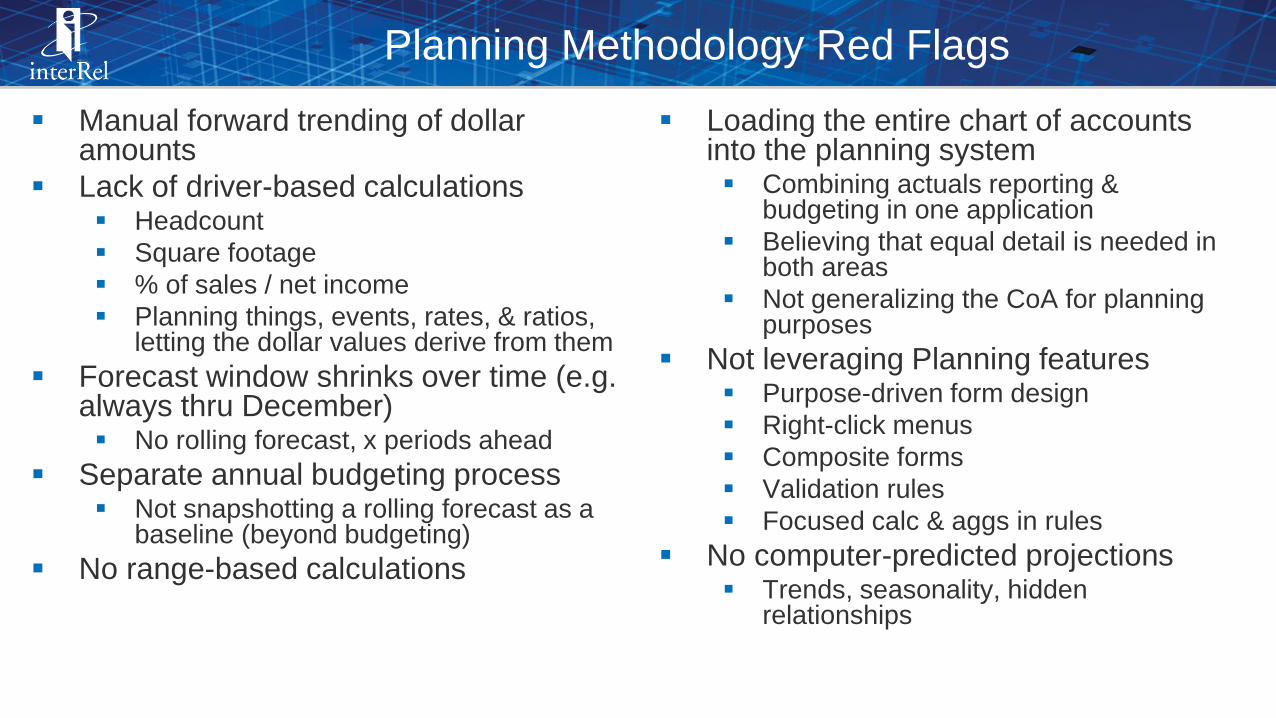
Planning Methodology Red Flags
Manual forward trending of dollar amounts
Lack of driver-based calculations Headcount
Square footage
% of sales / net income
Planning things, events, rates, & ratios, letting the dollar values derive from them
Forecast window shrinks over time (e.g. always thru December) No rolling forecast, x periods ahead
Separate annual budgeting process Not snapshotting a rolling forecast as a
baseline (beyond budgeting)
No range-based calculations
Loading the entire chart of accounts into the planning system Combining actuals reporting &
budgeting in one application
Believing that equal detail is needed in both areas
Not generalizing the CoA for planning purposes
Not leveraging Planning features Purpose-driven form design
Right-click menus
Composite forms
Validation rules
Focused calc & aggs in rules
No computer-predicted projections Trends, seasonality, hidden
relationships

Things to Consider
Your business changes over time
A Planning application that doesn’t change with the business
cannot remain effective in helping run the business
New features and new versions get released
Some of these new features offer competitive advantages
Planning applications (dimensions, hierarchies, forms, menus)
should be modeled after how planners think about the business
Planning features can enable new ways to think about and model
the business
Planning applications need to undergo design review (at a
minimum, and possible re-engineering) every few years

#6
Complex Excel Models

Daily Questions outside of “Standard” Reporting
• We raise pricing by 10%
• We just created a new Brand
• What are current inventory levels of outdated products?
• We just changed our Gross Profit calculation to address a new
way it needs to be seen
• New acquisition was just announced but it’s not “official” and will
takes months to get integrated data in the DW
• I want to see my sales by products but need to exclude a new
product but still keep my original hierarchy
• How are we trending Actuals vs. Forecast?
*** Spreadsheets Fill the Gaps ***
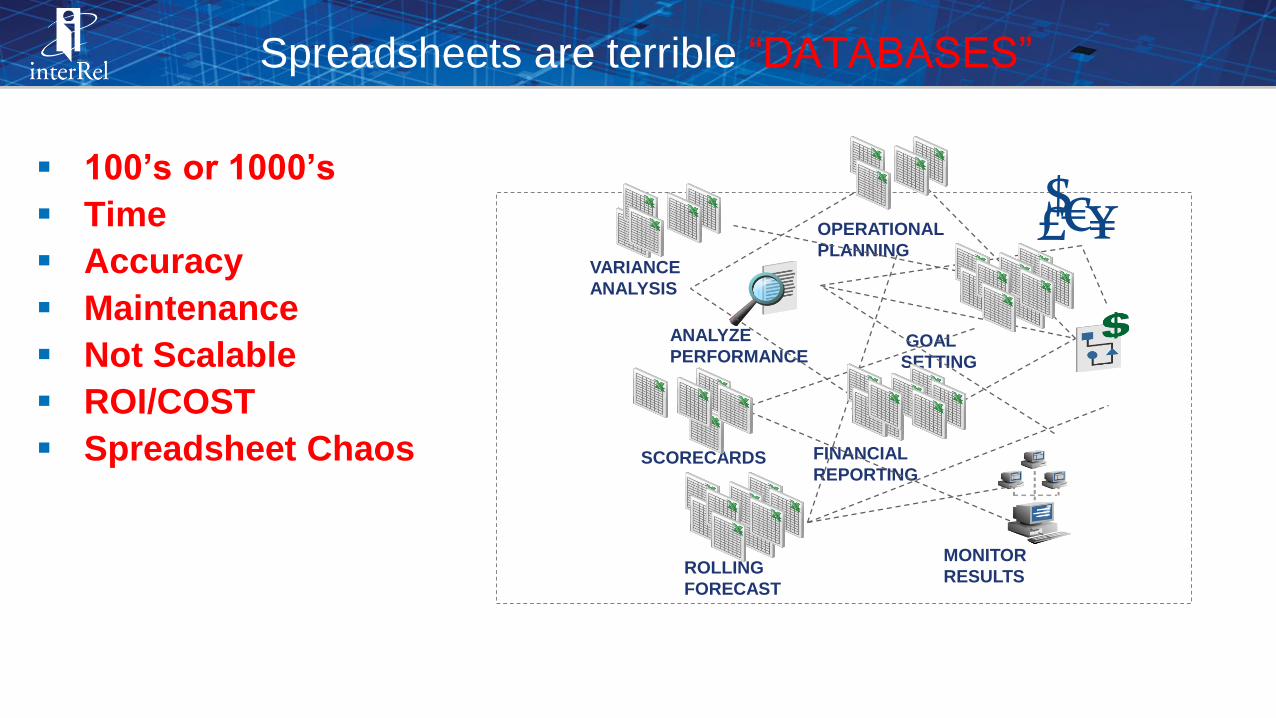
Spreadsheets are terrible “DATABASES”
100’s or 1000’s
Time
Accuracy
Maintenance
Not Scalable
ROI/COST
Spreadsheet Chaos
ANALYZE
PERFORMANCEGOAL
SETTING
SCORECARDS FINANCIAL
REPORTING
VARIANCE
ANALYSIS
ROLLING
FORECAST
OPERATIONAL
PLANNING
MONITOR
RESULTS
$€£ ¥

Excel Model Red Flags
Bulk uploads of data into Essbase from one tab in Excel
Massive re-retrievals and validation tabs to make sure the numbers went up correctly
System is almost never up-to-date (fully updated each time someone enters a number and hits “Save”) Scheduled or manually kicked off bulk aggregations
Lack of visibility into consolidated enterprise numbers until the end
Rush to upload and aggregate at the end of the process
Can’t report the latest numbers until someone updates the model Don’t report on actuals until after close
No PDF versions or automated delivery of reports
Cannot audit and validate every formula on every tab in every workbook

#7
Upgrading Versions Without
Upgrading the Model

Other Things Get Upgraded
Year 2008/09 2010/11 2012/13 2014/15 2016/17
Software 9.3.1 11.1.1.3 11.1.2.1 11.1.2.3 11.1.2.4
HardwarePhysical Servers
Re-Install
Server Refresh
VMsNew VMs
ModelInitial
designSame Design
Same Design
Same Design
Same Design
We upgrade the software and hardware all the time, but not the
model. This must change.
Exa
mp
le

Dimensionality Red Flags
A key factor holding back reporting & analysis at many companies is the dimensional structure of the EPM applications
Bad initial design or changes within aging models lead to significantly problematic issues in dimensionality
Overleveraging of a dimension, attempting to address more than one dimensional concept
Representing the same dimensional concept in more than one dimension (e.g. South Region Sales account & South Region dept)
Confusing interplay of dimensions If you change one, you have to change the other
“It depends”
“This data might not be right. I’m not sure if I pulled from the right place”
Central reporting concepts must be extracted into Excel and re-combined manually

#8
Admins in a Department That
Doesn’t Understand EPM

Everyday ITOS maintenanceOS patchingVirtualizationDisaster recoveryNetwork & disksWeb serversSSL / httpsETLVPN
Three Tiers of Administration
Everyday Essbase
Requirements
Design / Build
Dimensions
Hierarchies
Formulas
Calc Scripts
Start / Stop services
Essbase Techy
Batch
Backup
Essbase patches
Cache settings
Outline optimization
JVM heap sizes
Migration / Lifecycle management

Depends?
Not every business has a “techno-functional” person on board
Some aspects of Essbase administration are too techy for business
users, too specialized for IT
*IF* there are techy Essbase admins available:
They should work for the business
They should be the primary interface with IT
Ideally, they should be part of an Analytic Center of Excellence
*Until* and *unless* they are:
These functions should be outsourced
A third party can do this work more efficiently and more cost-effectively
More up-to-date feature and leading practice knowledge

Org Structure
Essbase Admins /
CoE
Information
Technology
Project
Management &
Business Analysts
Finance &
Business Units
External /
ConsultantsCloud
#9
ETL in ODI, Informatica, or Some
Other Thing That Isn’t FDMEE

Integration Tools, Past & Present
Past Data Integration tools have come and gone HAL / Vignette (2000-2006) – nice tool but retired
Upstream Weblink / FDM (2000-2015) – re-engineered as FDMEE
DIM / Informatica (2006-2008) – short lived rebranding / licensing idea
Sunopsis / ODI (2007-????) – the heir-apparent until it wasn’t
FDMEE introduced with Oracle EPM version 11.1.2.3 Shipped alongside FDM for this version only
Replaced FDM in 11.1.2.4
“Lite” version of FDMEE embedded in Cloud EPM (PBCS / FCCS) as “Data Management” Some features are showing up in the Cloud first
BUT are actually showing up soon afterward on-prem in FDMEE

FDMEE is the Future (the Present, Actually)
Build all EPM-related data flows and integrations with FDMEE (Financial Data Quality Management, Enterprise Edition)
Business-oriented (vs. IT-oriented) technology
Online, shared tool to manage mappings and data validations
Streamlines data integration processes between source and target systems
Provides drill through capabilities
Integrates with both on-premises and Cloud software technologies
Strategic direction for Oracle
As a go-forward integration tool in the Oracle EPM world,
FDMEE is the only game in town

#10
End Users Hate Smart View

If Users Hate Smart View
Why is a critical question
There are reasons it can make sense With some hardware / software configurations
Can be unstable / crashes Excel / gets automatically disabled
More common issue with 64-bit & later versions of Office (2016)
There are more reasons it doesn’t make sense
Are users well versed in Ad-Hoc operations? Mouse-based zooming & pivot instead of keyboard operations and Excel manipulations
Double click (right & left) drag and drop (right & left)
Do they know how to work with Smart View options? All options settings and how they work
The right times to have options on or off
How to set and modify their default options
Switching sets of options to change between modes of interaction
Most dislike of Smart View comes down to training, missing the old add-in, or lingering memories of bad experience with older versions (which were bad)

Many Issues Are Not Smart View Issues
Alleged Issue Response
Retrievals are slow Database issue – optimize
Small timeout window Need to apply Windows registry
settings for network
Can’t retrieve enough rows Essbase / APS setting – increase
Trouble with large retrieves Process issue – why are you doing a
large retrieve?
Can’t find data in database Essbase design issue –
redimensionalize
Can’t highlight & retrieve an area
on the sheet
Yes you can – use multigrid
No patch for buggy version (older
EPM version)
It’s backward compatible – upgrade to
the latest version

#11
You Have No
Cloud Migration Strategy

Oracle BI & EPM Cloud Landscape
OLTP & ODSSystems
Data WarehousesData Marts
PackagedApplications
(Oracle, SAP, Others)Excel
XML/OfficeBusiness
Processes
OLAPSources
Exadata Unstructured & Semi-Structured
Tra
nsa
ctio
nal
Oracle Analytics Cloud
(OAC)Pla
tfo
rm
as a
Serv
ice
Detect& Alert
OfficeIntegration
SearchQuery &Analysis
Reporting &Publishing
InteractiveDashboards
Scorecards MobileEmbedded
Rep
ort
ing
& A
na
lysis
Soft
ware
as a
Serv
ice
Financial Consolidation & Close Cloud Service (FCCS)
Account ReconciliationCloud Service (ARCS)
Tax ReportingCloud Service (TRCS)
Profitability & Cost Management Cloud Service (PCMCS)
Planning BudgetingCloud Service (PBCS)
Enterprise Performance Reporting Cloud Service
(EPRCS)
Enterprise Planning Budgeting Cloud Service (EPBCS)
Financial Close Planning Standalone
Enterprise Data Management
EDMCS

61
Full BI and EPM Data Flow
EPM Reporting & Analysis
Operational
Data Integration
CRM
ERP / GL
Govern (DRM / EDMCS)
ETL
(FDMEE )
(Data Management)
(ODI)
(Other)
Close and
Consolidation
Planning and
Budgeting
Account
Reconciliation
Profitability
and Costing
Other
Unstructured / Data Lake

Four Approaches to the Cloud
0%
10%
20%
30%
40%
50%
60%
AggressiveMigration
CloudFirst
OpportunisticMigration
Stay On-Prem
2015 2016 2017
Aggressive Migration – moving all EPM to the Cloud ASAP
Cloud First – All new EPM development to be done in the Cloud
Opportunistic Migration –Looking for opportunities to move EPM into the Cloud at upgrade time
Stay On-Prem – no plan to put EPM applications on the Cloud

Key Priority: Cloud Migration
EPM CLOUD MIGRATION STRATEGY
Near-term adoption of
mature cloud products
Strategic migration of analytics &
visualization to cloud over time
EPM fully on the cloud at the end of3-5 years

Cloud Benefits
Ease of expansion New companies, geographies, products, or departments
Many new, innovative cloud-only features The only sure way to get access to new features is to be on the cloud
The Cloud versions have left the on-prem versions behind
Should be considered “the latest version”, on-prem is “the previous version”
Lower software fees with SaaS model Automatic, cost-free upgrades and patches
Subscription model with low minimum user counts
Reduced IT costs – both personnel and data center equipment
Simplified UI means reduction in training needs
Business can focus on analytics vs. end-user support
The Cloud vs. on-prem question is answered: The Cloud has already won!

Continuing
Education

Play it Forward Videos to expand on what you've learned
here
Product introductions
New Features in Oracle Analytics
Cutting Edge Cloud updates
Expert-level videos for BI gurus
Technical Reference in video form
To experience the education revolution first-
hand, join our community at epm.bi/videos#PlayItForward

Best Selling Hyperion Technical Book Series
• Build an Oracle Planning & Budgeting Cloud
• Application from start to finish
• Administer and automate your solution
• Migrate from on-premises to the Cloud
• Best practices for setting up your Oracle EPM Cloud Instance
Essbase
Admin Studio Smart View
First Ever Oracle EPM Cloud Books Now Available!
• Build a report package
• Execute the reporting cycle from start to finish
• Sign off or reject the final product
• Assign security
• Migrate objects between environments
• Steps to set up your Oracle Analytics Cloud instance
• How to build Essbase Cloud cubes from start to finish
• Maintaining dimensions and loading data
• Creating calculations and calculating data
• Assigning security
Admin End User Advanced
Planning
Admin/End Users
Cloud
OAC PBCS EPRCS

A Whole Book on OAC!
Look Smarter Than You Are with OAC Standard
*Only OAC book on the market!
Learn:
Processes for setting up your PaaS environment
Foundational Essbase concepts
Foundational Smart View concepts
Best practices for building Essbase Cloud cubes
Best practices for building Cloud data visualizations
Security design best practices
Administration processes
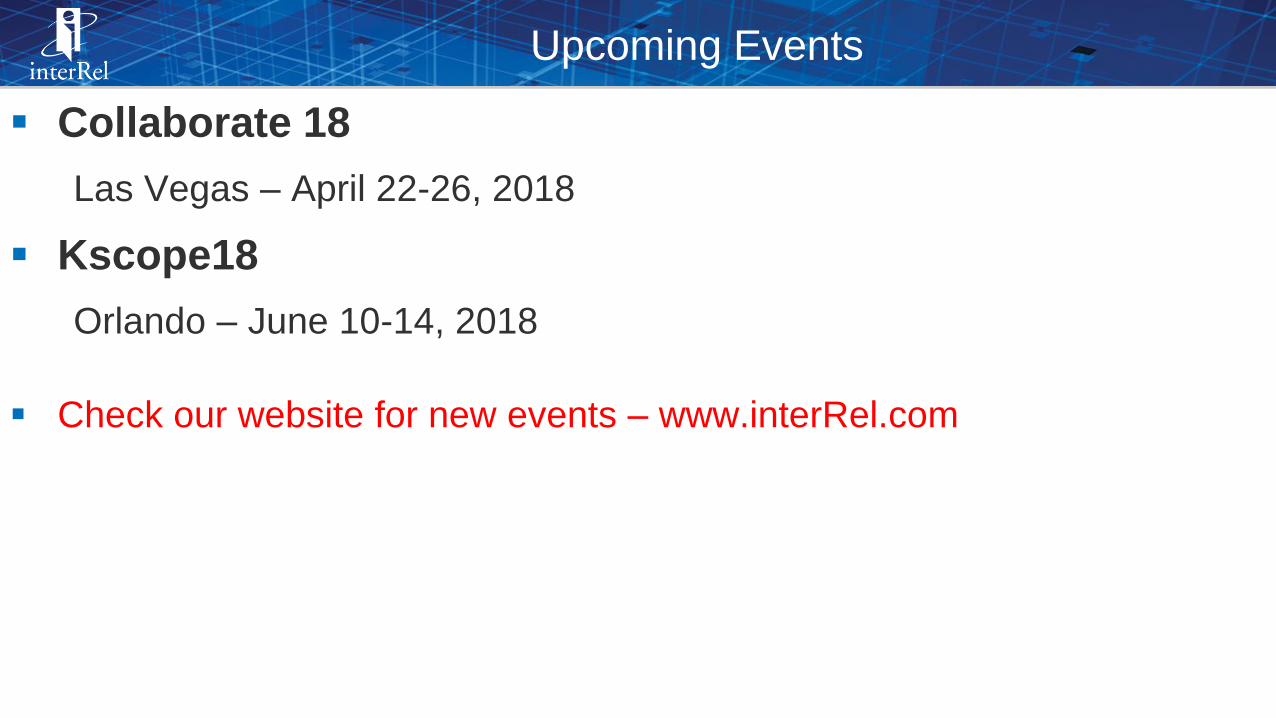
Upcoming Events
Collaborate 18
Las Vegas – April 22-26, 2018
Kscope18
Orlando – June 10-14, 2018
Check our website for new events – www.interRel.com


Is Your EPM Implementation
Falling Behind? The Top 11
Signs
Jim Kubik
National Pre-Sales Architect
216.798-2236


