A Data Warehouse and Business Intelligence Solution For Global Bike, Inc. Prepared By: Mengwan Chen chenmw Lawrence Powers powersln Gary Springer springga Hezhen Wang wang2hh Rui Zhang zhangr3
Transcript
A Data Warehouse and Business Intelligence Solution For Global Bike, Inc.
Prepared By:
Mengwan Chen -‐ chenmw
Lawrence Powers -‐ powersln
Gary Springer -‐ springga
Hezhen Wang -‐ wang2hh
Rui Zhang -‐ zhangr3
Table Of Contents Introduction Section 1 -‐ Business Evaluation and Vendor Selection 1.1 About Global Bike, Inc. 1.2 Vendor Selection Section 2 – System Solution 2.1 SAP Business Warehouse 2.2 Data Warehouse Architecture 2.3 Data Model 2.4 Calculation of Star Schema Size 2.5 ETL Process Section 3 -‐ Analyses 3.1 Seasonal Sales Quantity for Bikes and Accessories 3.2 Big Customers 3.3 Small Customer 3.4 Regional Demands for Popular Bikes in the US 3.5 Simple Discount Model 3.6 Inflation Conclusion
Introduction
The purpose of the project described in this report was to design and implement a data
warehouse and business intelligence solution to support the sales division of Global
Bike, Inc. We began by examining various business needs of Global Bike. Once these
business needs were established, we evaluated product offerings from several leading
vendors and selected the best fit for Global Bike’s needs. We selected an appropriate
data warehouse architecture a corresponding business intelligence platform. We
designed a data model to provide optimal reporting functionality. We implemented our
solution and developed multiple types of reporting capabilities for analyses.
Section 1 – Business Evaluation and Vendor Selection
1.1 About Global Bike Inc.
To determine which data management vendor would be the best fit for GBI, we first
researched the situation that we are facing right now: we are a global bicycle company
producing and selling innovative high-‐performance bicycles to the high-‐end bicycle
consumers for touring and off-‐road racing. We are a process-‐centric organization. The
centralized process provides us a more integrated business platform that enables
consistency of operations and process integrity across the globalized company in a
higher controlled environment. The internet has been used primarily in our company as
an information channel, maximizing the potential for educating consumers and partners
and for marketing the products to a large group of audience. In addition to our strong
customer base and the demand for our high quality products, an extensive sales
operation data management system needs to be established to ensure process
continuity to provide business solutions for decision making in the company.
1.2 Vendor Selection
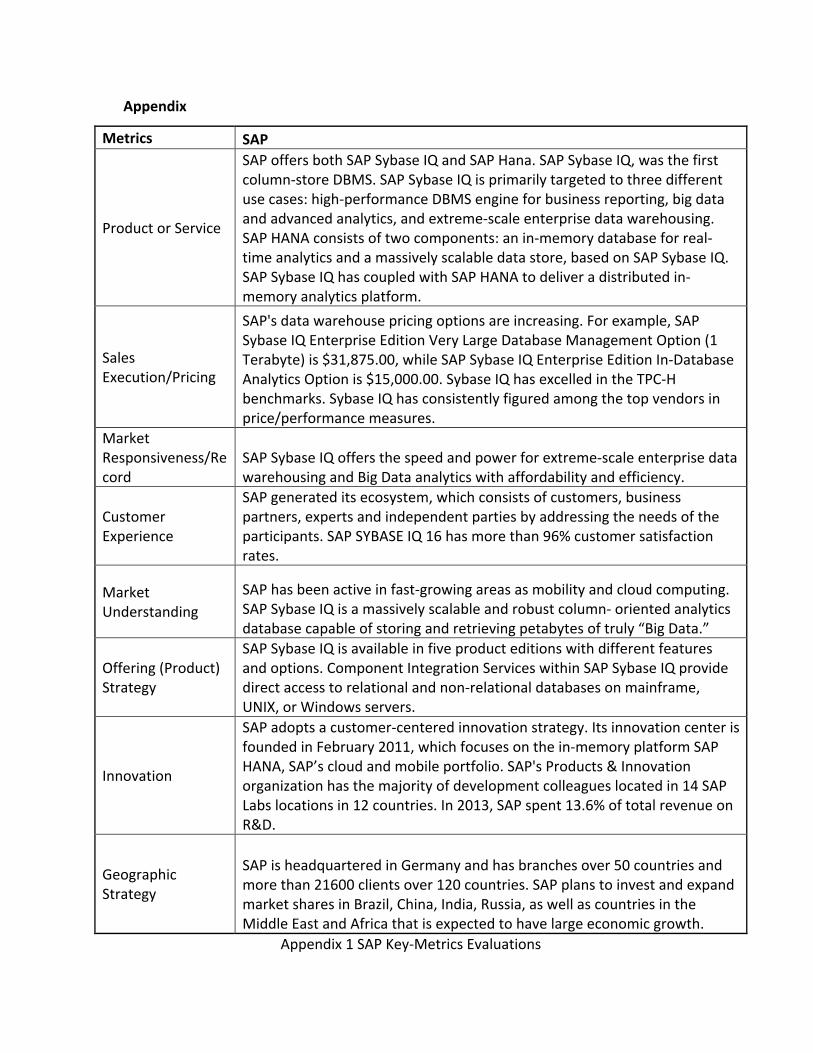
We used several key metrics for our vendor evaluation and selection process. (Appendix
1) After comparing product offerings for Amazon, SAP, IBM, HP, and Cloudera, we chose
the SAP Business Intelligence Suite.
Section 2 – System Solution
2.1 SAP Business Warehouse
SAP Business Warehouse (BW), a separate system that receives data from the SAP ERP
system, provides users powerful analytical functions which collect and analyze
operational data from a variety of sources for decision making processes. It has really
strong connectors to the underlying SAP ERP (Enterprise Resource Planning) systems, or
other SAP source systems. SAP BW has been marked as a leader in the Data Warehouse
market. Its solutions simplify the data management landscape, based on the latest in-‐
memory and computational technologies. Different from OLAP database environment,
SAP BW doesn’t provide real time function. On the contrary, SAP BW allows users to
retrieve historical data to identify trends and patterns and to extract data easily from
databases. Business Objects in SAP BW has an open approach to access multiple sources
to support reporting, analysis, and processes planning.
For Global Bike, the function of retrieving historical sales data is essential to provide the
pattern or trends of our business model for decision making solutions. Tracking real time
data of sales operations is overly expensive and unnecessary. However, we have to
make sure that data can be exported easily for our system users. Additionally,
comprehensive analytical functions can really benefit our high-‐level management team
in making decisions. In sum, SAP Business Warehouse can fulfill all our needs and SAP’s
prominent industry reputation instills confidence in the stability of our data
management.
2.2 Data Warehouse Architecture
We employed a dependent data warehouse architecture for our system solution.
Dependent data marts are data marts are comprised of data from an enterprise data
warehouse and its reconciled data, which match our needs perfectly. A dependent data
mart is one where all the data in the data mart comes from a data warehouse. The data
warehouse granular data is aggregated, summarized, and restructured as it passes into
the data mart. The end result is a data mart that is customized to meet the needs of the
end user.
Dependent Data Mart has a list of distinguishable advantages that would benefit our
data warehouse architecture. First, a burden of processing is removed from the data
warehouse by implementing a dependent data mart. Moreover, the dependent data
marts can be tailored according to specific needs of the data users. Third, the linkage
from one data element to the next can be traced and tracked. Fourth, dependent data
marts allow us to move the data to an external facility, which will reduce the costs of
data processing dramatically. Finally, dependent data marts provides single points of
reconciliation for all dependent data marts, which will help solve system conflicts.
Besides the listed advantages, the largest advantage has nothing to do with technology
or architecture. The biggest advantage may be that different departments in a company
can own their own data. In this case, individual departments can rearrange their data to
meet their needs. It also implies that customized data can be available for users.
Given all the evidence we show in the previous section, we implement dependent data
mart with operational data store to build our data warehouse.
After selecting our vendor and data warehouse architecture, we need to look at the
major components of our data warehouse. Data quality is the fundamental component.
Data must be cleaned, organized, and extracted from the sales’ operational
systems. Making that data useful to a variety of audiences, though, requires
applications to deliver and explain it. These applications range from predefined reports
through query tools to complex tools for analysis and modeling. Equally important,
transforming operational data into a shared resource useful across the boundaries of
functional business domains requires a broad set of functional skills, organized
appropriately and working through proven processes. The architecture for the data
warehouse requires a centralized, integrated data warehouse that is the control point
and single source of all data made available to end users for decision support
applications.
The main goal of a data warehouse is to provide an infrastructure for the provision of
information to support better decision-‐making. One of the core components of a data
warehouse that facilitates the goal is an InfoCube. An InfoCube is a multi-‐dimensional
data container, which forms the basis for reports and analyses in SAP BW. An InfoCube
contains two types of data -‐ key figures (document the performance of a business
process over time) and characteristics (represents a business object or concept, business
term, business entity). Each individual InfoCube should be a self-‐contained dataset
based on a business context. The contents of the data warehouse have two
components: 1.Historical information -‐-‐ referred to as facts, as they usually consist of
discrete facts or measurements. 2. Information about the context in which these events
or measurements occur. This context information is organized along consistent
dimensions. Sample dimensions include time, organization, and student information.
These context dimensions provide the mechanism which enables a shared, enterprise
data warehouse. An InfoCube consists of several InfoObjects and is modeled using a
star schema framework, which comprises a Fact Table containing the Key Figures of the
InfoCube as well as several surrounding Dimension tables that contain the
Characteristics of the cube.
Historical data for sales operation will be modeled and loaded in an InfoCube within SAP
Data warehouse. After we develop the InfoCubes that hold sales data, a data model
(star schema framework) will show the detailed design of our data warehouse in the
next section.
2.3 Data Model
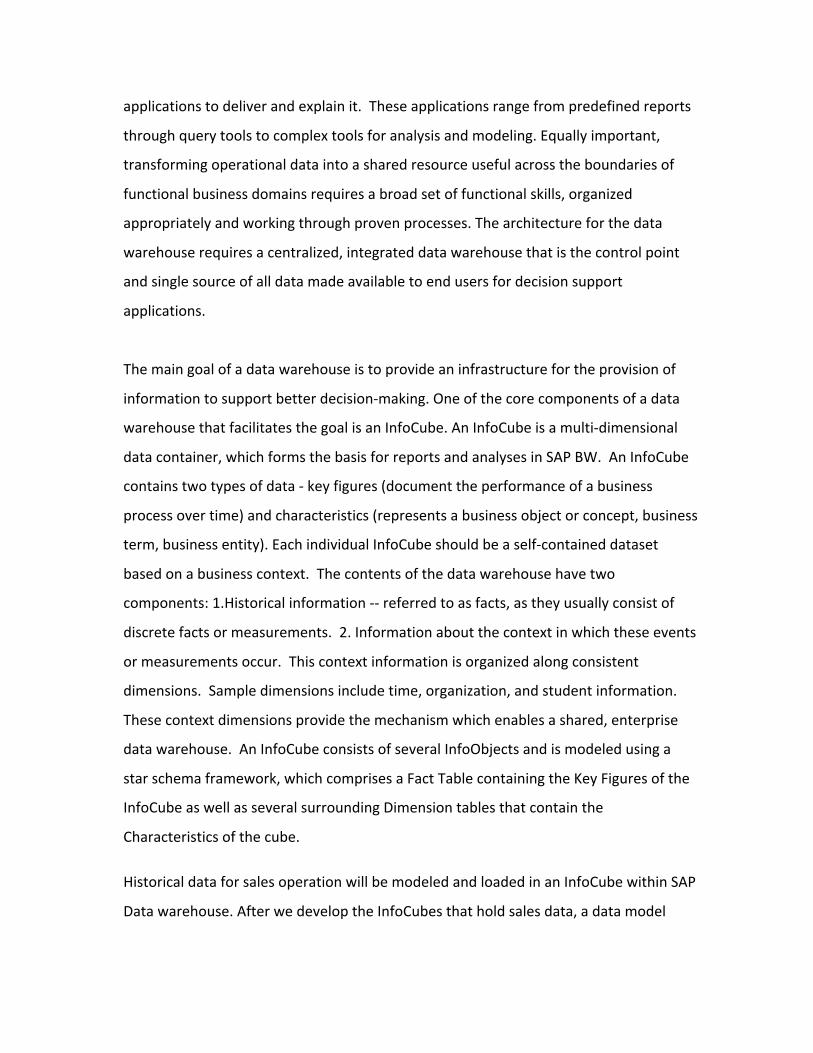
Figure 1 Star Schema for Sales
The dimensional model we created for this project includes one sales fact table and
three dimension tables (product, time, and customer).
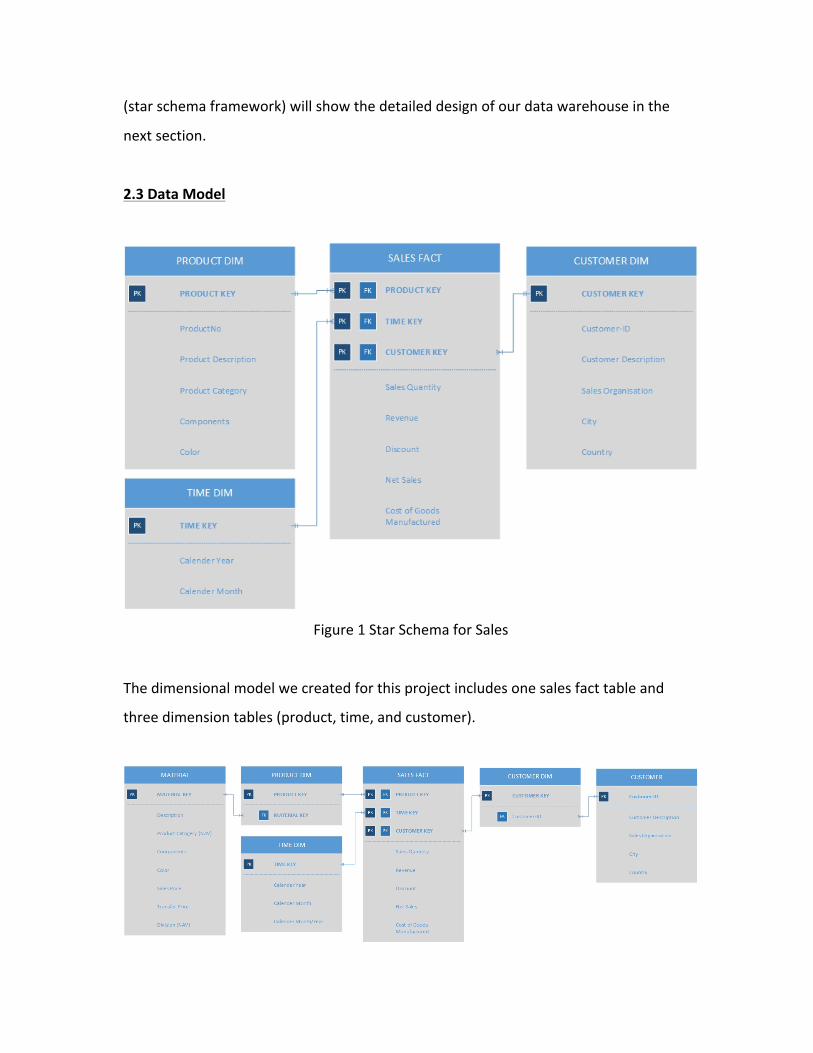
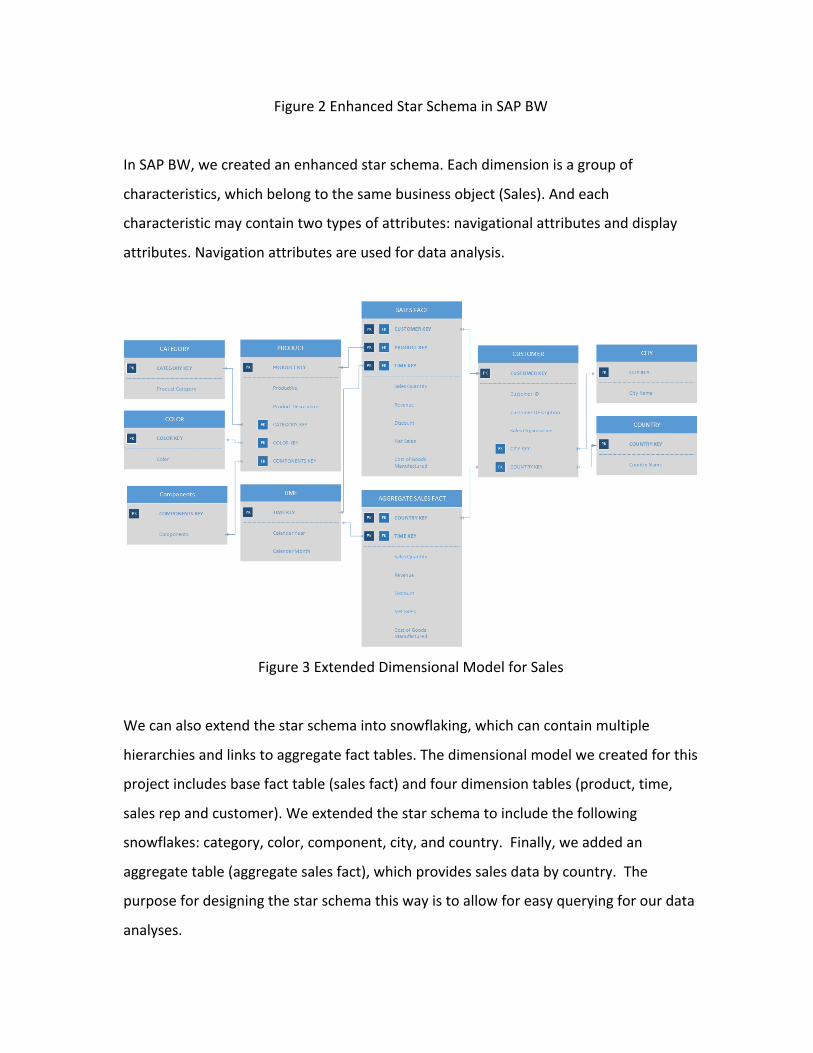
Figure 2 Enhanced Star Schema in SAP BW
In SAP BW, we created an enhanced star schema. Each dimension is a group of
characteristics, which belong to the same business object (Sales). And each
characteristic may contain two types of attributes: navigational attributes and display
attributes. Navigation attributes are used for data analysis.
Figure 3 Extended Dimensional Model for Sales
We can also extend the star schema into snowflaking, which can contain multiple
hierarchies and links to aggregate fact tables. The dimensional model we created for this
project includes base fact table (sales fact) and four dimension tables (product, time,
sales rep and customer). We extended the star schema to include the following
snowflakes: category, color, component, city, and country. Finally, we added an
aggregate table (aggregate sales fact), which provides sales data by country. The
purpose for designing the star schema this way is to allow for easy querying for our data
analyses.
2.4 Calculation of Star Schema Size
According to sales data from 2009 to 2011, the total sales quantity per year is about
95000. The size of the star schema from 2009 to 2011 will be:
95000 records/year *10 bytes*8 attributes*3 years = 22,800,000 bytes
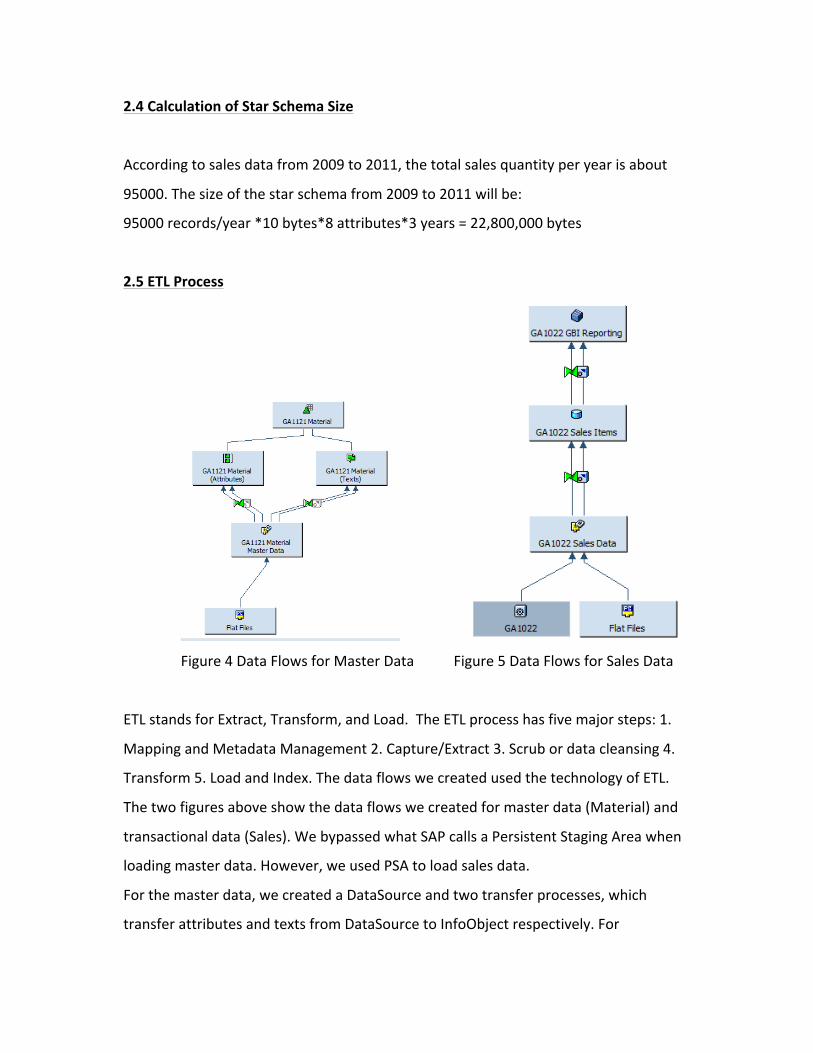
2.5 ETL Process
Figure 4 Data Flows for Master Data Figure 5 Data Flows for Sales Data
ETL stands for Extract, Transform, and Load. The ETL process has five major steps: 1.
Mapping and Metadata Management 2. Capture/Extract 3. Scrub or data cleansing 4.
Transform 5. Load and Index. The data flows we created used the technology of ETL.
The two figures above show the data flows we created for master data (Material) and
transactional data (Sales). We bypassed what SAP calls a Persistent Staging Area when
loading master data. However, we used PSA to load sales data.
For the master data, we created a DataSource and two transfer processes, which
transfer attributes and texts from DataSource to InfoObject respectively. For
transactional data, we create DataSource and use InfoPackage to load data into PSA.
And then Data in PSA will be transferred to DataStoreObject and Infocube.
The data flows for sales data includes three ETL processes. The first ETL process moves
data from an operational database into a DW staging area. In this process, DataSource
extracts data from a csv file, and Infopackage loads data from that flat file to PSA. The
second ETL process moves data from DW staging area to Data Warehoues. In this
process, we transfer data from PSA to DataSourceObject by using transformation rules
we create. The last ETL process moves data from Data Warehouse to Data Marts. In this
process, we transfer data from DataSourceObject to InfoCube by using transformation
rules we created.
The transformation we use is on both field-‐level and record-‐level. The field-‐level
transformation helps us to transfer data from source fields to target InfoObject. The
record-‐level transformation includes selection, joining, normalization, and aggregation.
It helps us to calculate statistics such as Net Sales and Cost of Goods Manufactured. For
the loading process, we will use update mode to capture a snapshot of changed records
at the source. The limitation for our ETL process is the potential data pollution problems
in our source data. There might be problems such as missing data, duplicate data,
misspelled names for customers, and impossible or erroneous effective dates. We can
employ data scrubbing tools to deal with these problems.
We plan to operate the ETL process on a daily basis for the sales data. But in the future,
we can develop real-‐time data acquisition so that management can monitor the sales
data in a timely manner.
Section 3 – Analyses
Based on the infrastructure we built in SAP and the data collected in our data
warehouse, we made several following analyses for management to see what was going
on for this year (2011) and compared it with the years before.
3.1 Seasonal Sales Quantity for Bikes and Accessories
Table 1 Sales Quantity of Germany
The above table is for Germany. Off-‐road Bikes, Road Bikes, Touring Bikes, and
Accessories all sold well in Germany. Also, the sales quantity varies seasonally. The
highest sales quantity for each product happens in summer, which is almost quadruple
the sales quantity of winter. We assume that is because the nice temperature brings
people outside to ride a bike. The second highest sales quantity happens in fall.
Apparently, temperature is a big factor for the sales quantity.
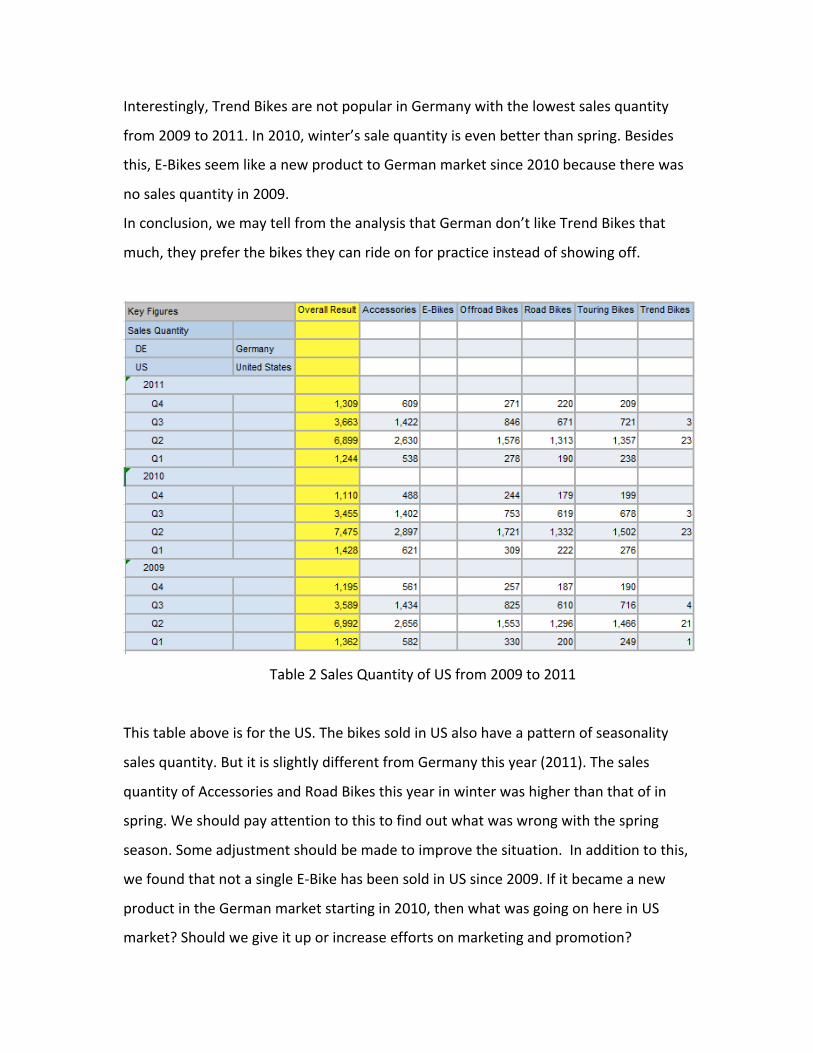
Interestingly, Trend Bikes are not popular in Germany with the lowest sales quantity
from 2009 to 2011. In 2010, winter’s sale quantity is even better than spring. Besides
this, E-‐Bikes seem like a new product to German market since 2010 because there was
no sales quantity in 2009.
In conclusion, we may tell from the analysis that German don’t like Trend Bikes that
much, they prefer the bikes they can ride on for practice instead of showing off.
Table 2 Sales Quantity of US from 2009 to 2011
This table above is for the US. The bikes sold in US also have a pattern of seasonality
sales quantity. But it is slightly different from Germany this year (2011). The sales
quantity of Accessories and Road Bikes this year in winter was higher than that of in
spring. We should pay attention to this to find out what was wrong with the spring
season. Some adjustment should be made to improve the situation. In addition to this,
we found that not a single E-‐Bike has been sold in US since 2009. If it became a new
product in the German market starting in 2010, then what was going on here in US
market? Should we give it up or increase efforts on marketing and promotion?
3.2 Big Customers
As a for-‐profit company, we always want to know who are our big customers, what are
their needs, and what kind of service we can provide them to satisfied their demands.
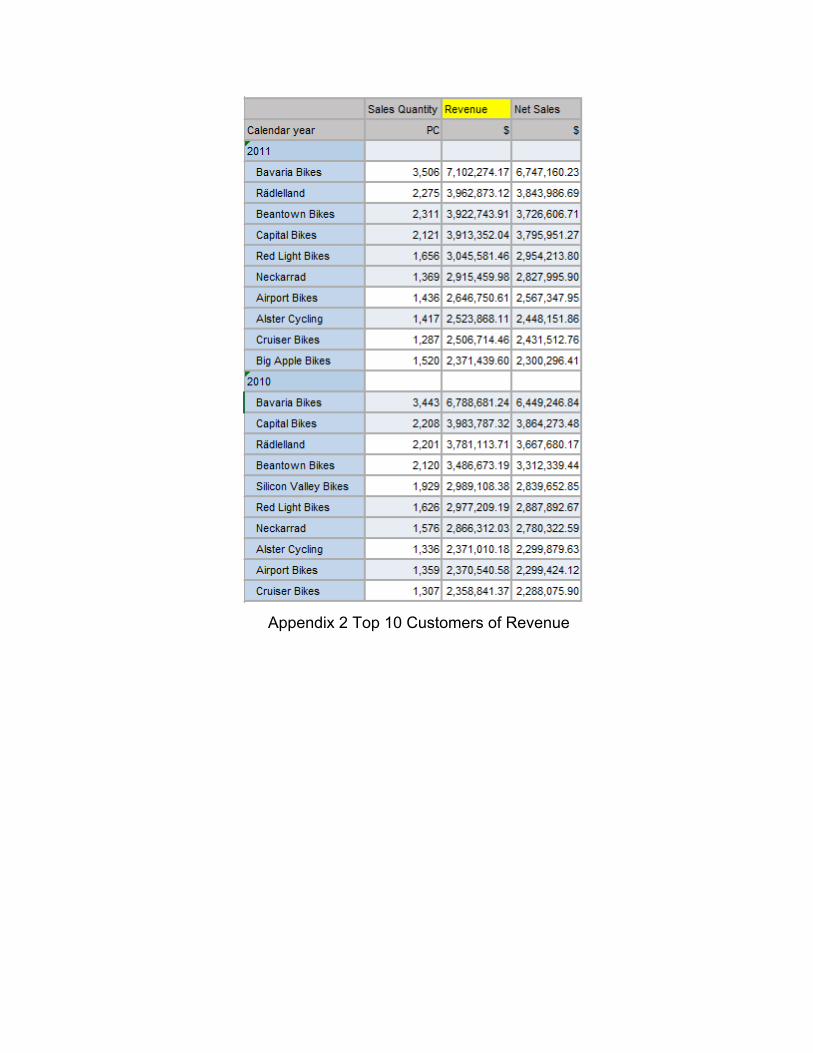
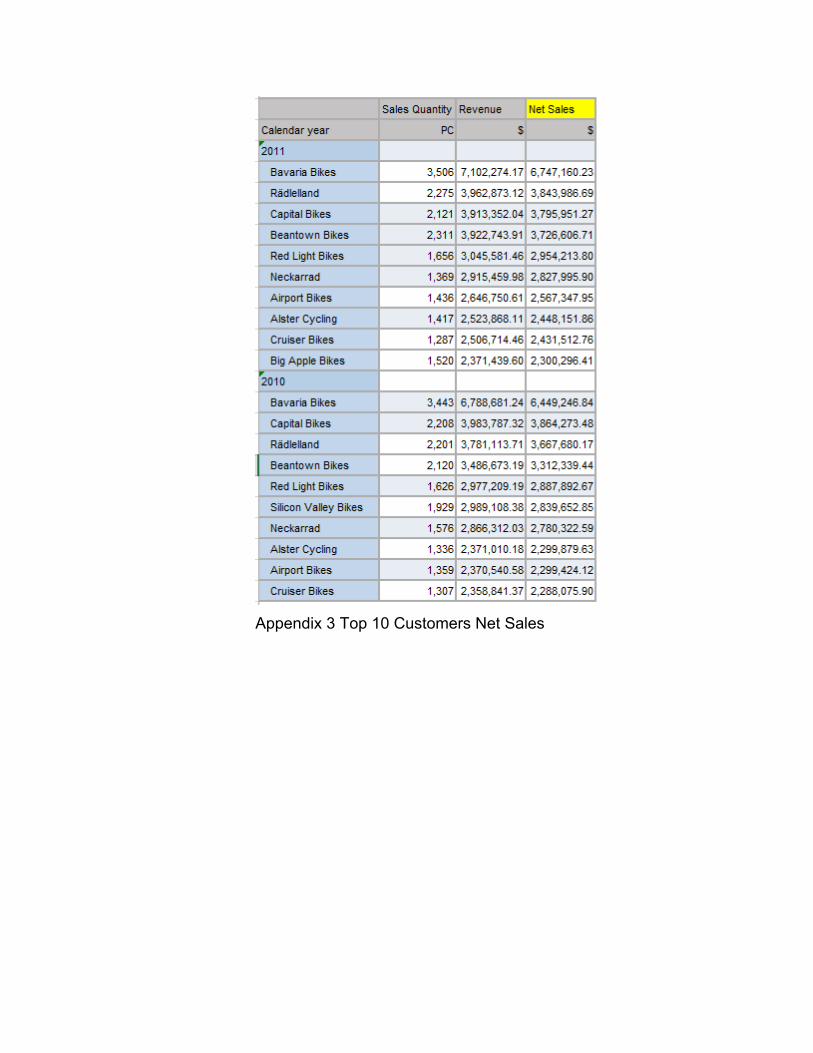
So we did three tables of sales quantity, revenue, and net sales with all the money
converted into US dollars. Each table is in descending order by the highlighted indicator.
But we will only make analysis based on sales quantity table here. Since the top 10
customers are the same for revenue and net sales tables, you can look at the Appendix 2
& 3 for interest.
According to the sales quantity, our top ten customers are Bavaria Bikes, Beantown
Bikes, Radlelland, Capital Bikes, Red Light Bikes, Big Apple Bikes, Airport Bikes, Alster
Cycling, Neckarrad and Cruiser Bikes. Compared with the big customers in last year, Big
Apple Bikes became our big customer this year with Silicon Valley Bikes falling out of the
top 10 lists. So we want to know the reason why Silicon Valley Bikes bought much less
this year than last year, and what attracted Big Apple Bikes to our products.
3.3 Small Customers
For the small customers, we cannot just give up on them. Get to know them better and
come up with a strategy to help them expand their market and buy more products from
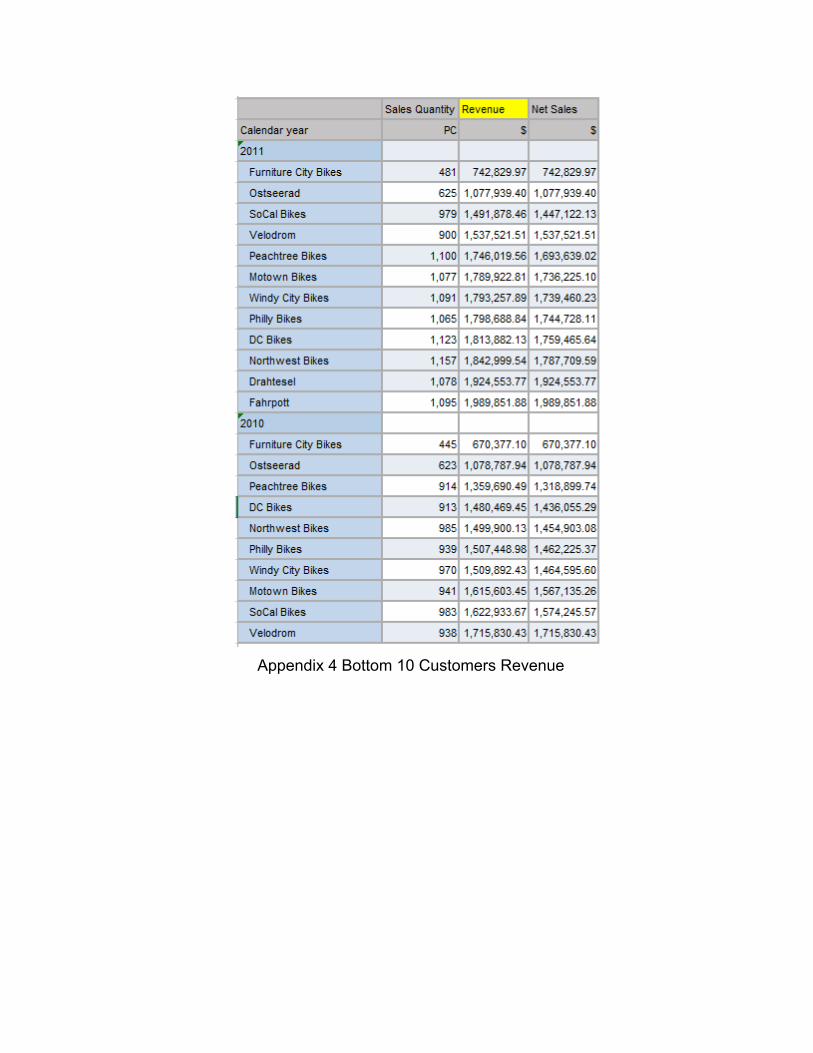
us. We also did three tables for sales quantity, revenue, and net sales with all the money
converted into US dollars. Each table is in ascending order by the highlighted indicator.
But we will only make analysis based on sales quantity table here. Since the bottom 10
customers are the same for revenue and net sales tables, you can look at the Appendix
A 4&5 for interest.
According to the sales quantity, our bottom ten customers are Furniture City Bikes,
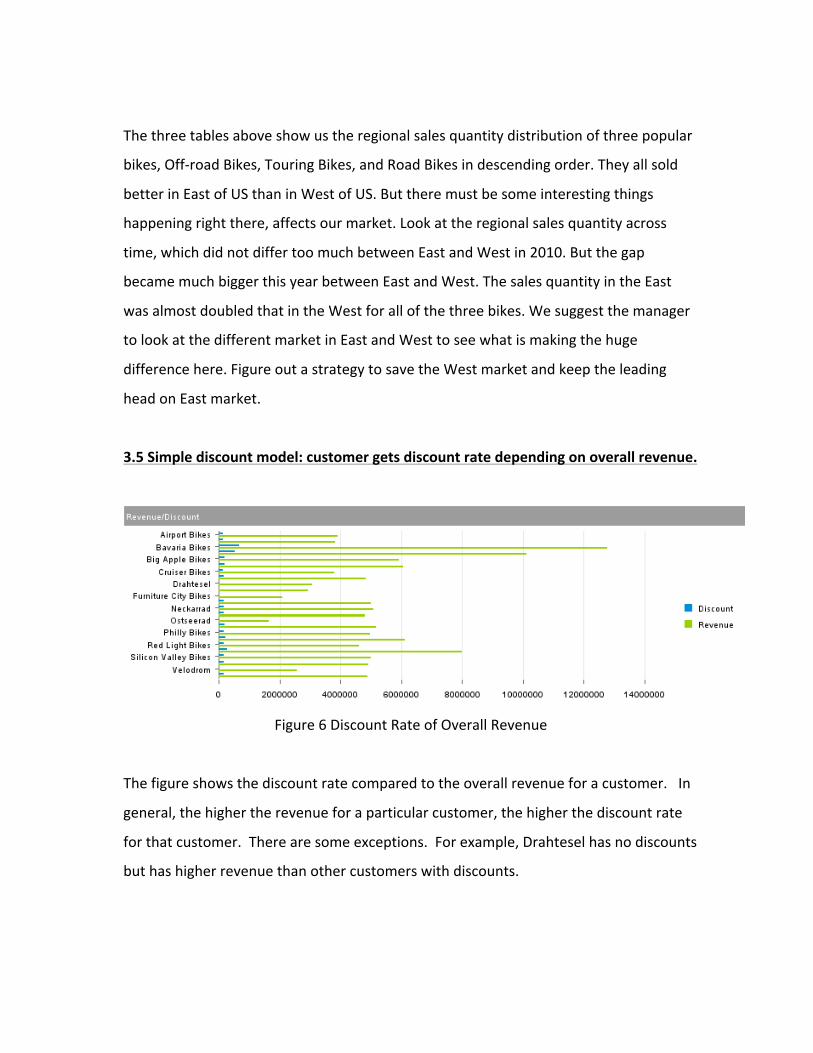
The figure shows the discount rate compared to the overall revenue for a customer. In
general, the higher the revenue for a particular customer, the higher the discount rate
for that customer. There are some exceptions. For example, Drahtesel has no discounts
but has higher revenue than other customers with discounts.
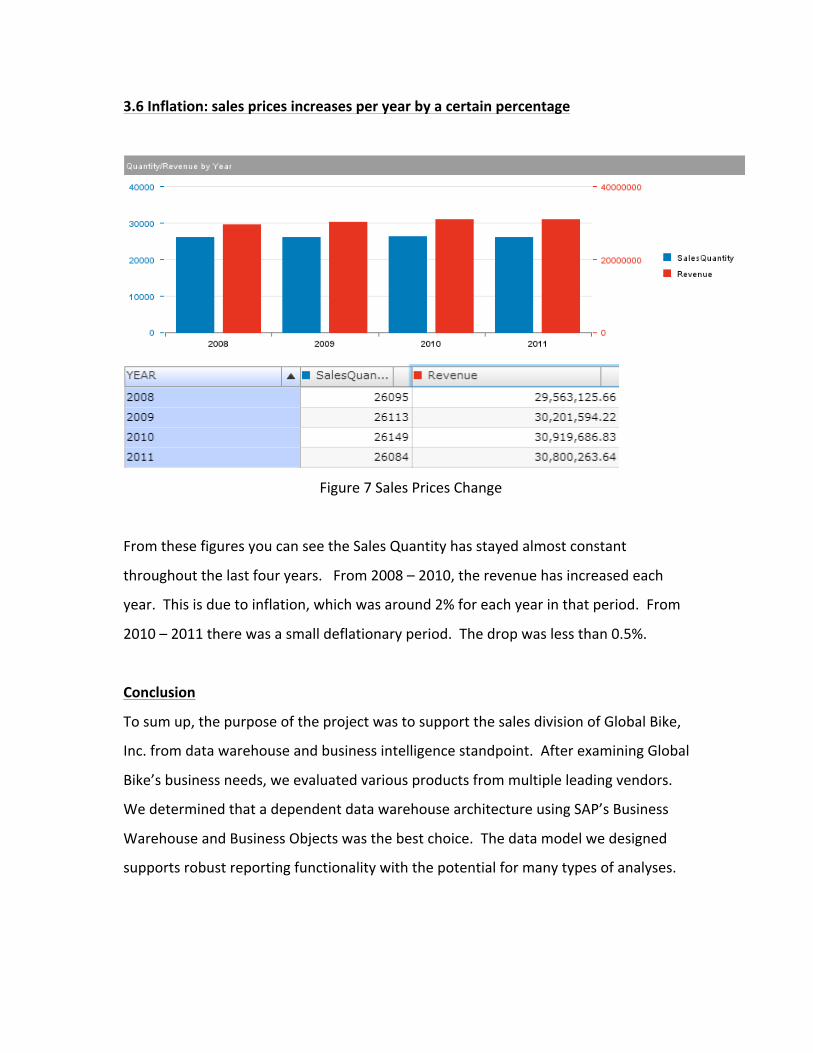
3.6 Inflation: sales prices increases per year by a certain percentage
Figure 7 Sales Prices Change
From these figures you can see the Sales Quantity has stayed almost constant
throughout the last four years. From 2008 – 2010, the revenue has increased each
year. This is due to inflation, which was around 2% for each year in that period. From
2010 – 2011 there was a small deflationary period. The drop was less than 0.5%.
Conclusion
To sum up, the purpose of the project was to support the sales division of Global Bike,
Inc. from data warehouse and business intelligence standpoint. After examining Global
Bike’s business needs, we evaluated various products from multiple leading vendors.
We determined that a dependent data warehouse architecture using SAP’s Business
Warehouse and Business Objects was the best choice. The data model we designed
supports robust reporting functionality with the potential for many types of analyses.
One of the main limitations of the solution we provided was that it only updates daily
with sales figures. If Global Bikes would like to increase their reporting capabilities with
real time sales information, the system would have to be expanded. In the end, the
information gain for analysis purposes from a real-‐time system may not result in a
significant enough increase in sales to justify the investment. However, if a real-‐time
system were in place, there may be some advantages to expanding it further to an
active data warehouse. With this type of technology the occurrence of one event can
be set to trigger another event. The reason Global Bike could benefit is because Global
Bike already uses SAP for their materials management. So for example, if a customer
placed a large order, the system could automatically trigger the purchase of the raw
materials needed to manufacture the finished goods to replace the sold inventory. This
would reduce the potential for human error as well as expedite inventory
replenishment.
In conclusion, Global Bike has system with lots of excellent capabilities. If the company
would like to expand their capabilities in the future, the foundation for that expansion is
already in place.
Appendix
Metrics SAP
Product or Service
SAP offers both SAP Sybase IQ and SAP Hana. SAP Sybase IQ, was the first column-‐store DBMS. SAP Sybase IQ is primarily targeted to three different use cases: high-‐performance DBMS engine for business reporting, big data and advanced analytics, and extreme-‐scale enterprise data warehousing. SAP HANA consists of two components: an in-‐memory database for real-‐time analytics and a massively scalable data store, based on SAP Sybase IQ. SAP Sybase IQ has coupled with SAP HANA to deliver a distributed in-‐memory analytics platform.
Sales Execution/Pricing
SAP's data warehouse pricing options are increasing. For example, SAP Sybase IQ Enterprise Edition Very Large Database Management Option (1 Terabyte) is $31,875.00, while SAP Sybase IQ Enterprise Edition In-‐Database Analytics Option is $15,000.00. Sybase IQ has excelled in the TPC-‐H benchmarks. Sybase IQ has consistently figured among the top vendors in price/performance measures.
Market Responsiveness/Record
SAP Sybase IQ offers the speed and power for extreme-‐scale enterprise data warehousing and Big Data analytics with affordability and efficiency.
Customer Experience
SAP generated its ecosystem, which consists of customers, business partners, experts and independent parties by addressing the needs of the participants. SAP SYBASE IQ 16 has more than 96% customer satisfaction rates.
Market Understanding
SAP has been active in fast-‐growing areas as mobility and cloud computing. SAP Sybase IQ is a massively scalable and robust column-‐ oriented analytics database capable of storing and retrieving petabytes of truly “Big Data.”
Offering (Product) Strategy
SAP Sybase IQ is available in five product editions with different features and options. Component Integration Services within SAP Sybase IQ provide direct access to relational and non-‐relational databases on mainframe, UNIX, or Windows servers.
Innovation
SAP adopts a customer-‐centered innovation strategy. Its innovation center is founded in February 2011, which focuses on the in-‐memory platform SAP HANA, SAP’s cloud and mobile portfolio. SAP's Products & Innovation organization has the majority of development colleagues located in 14 SAP Labs locations in 12 countries. In 2013, SAP spent 13.6% of total revenue on R&D.
Geographic Strategy
SAP is headquartered in Germany and has branches over 50 countries and more than 21600 clients over 120 countries. SAP plans to invest and expand market shares in Brazil, China, India, Russia, as well as countries in the Middle East and Africa that is expected to have large economic growth.