ISAS Working Paper No. 47 – Date: 31 July 2008 469A Bukit Timah Road #07-01, Tower Block, Singapore 259770 Tel: 6516 6179 / 6516 4239 Fax: 6776 7505 / 6314 5447 Email: [email protected]Website: www.isas.nus.edu.sg Justice Delivery in India – A Snapshot of Problems and Reforms Bibek Debroy ∗ Summary In attaining higher gross domestic product growth rates, legal reforms are now recognised as a critical ingredient. The Indian legal infrastructure needed reforms in any case, even if the post-1991 cycle of economic reforms had not occurred. However, liberalisation has provided an additional trigger. The word “law” has various interpretations. Consequently, the expression legal reform also needs to be pinned down. There are three layers in legal reform. First, there is an element of statutory law reform and there are three clear elements to statutory law reform – weeding out old and dysfunctional elements in legislation, unification and harmonization, and reducing state intervention. Second, legal reform has to have an administrative law reform component, meaning the subordinate legislation in the form of rules, orders, regulations and instructions from ministries and government departments. Often, constraints to efficient decision-making come about through administrative law rather than through statutory law and bribery and rent-seeking are fallouts. Finally, the third element of legal reform is what may be called judicial reforms, though faster dispute resolution and contract enforcement are not exclusively judicial issues. In reform initiatives since 1991, judicial reform has often remained outside substantial liberalisation initiatives. This is despite the problem being recognised. Within judicial reforms, one can detect at least four strands in proposed reforms. First, there is the question of judicial strength, though the number and skill-sets of non-judicial staff are equally important. This is a supply-side solution that is the most commonly cited reason for court congestion and delays. However, this is also linked to vacancies and the judicial appointment and promotion process, as judicial workforce planning. Second, there is a set of reforms linked to improving judicial efficiency and court productivity, through education/training, better court administration in non-judicial functions and improved case and case-flow management, facilitated by infrastructure improvements. This too is a supply-side solution. Third, as a sub-strand to number two, information and communication technology (ICT) can specifically be used to enhance productivity. Fourth, the demand for adjudication can be reduced through alternative channels of dispute resolution (mediation, conciliation, arbitration) and reducing the government’s contribution in civil litigation. ∗ Professor Bibek Debroy is a Visiting Senior Research Fellow at the Institute of South Asian Studies, an autonomous research institute at the National University of Singapore. He can be contacted at [email protected] or [email protected].
Transcript
ISAS Working Paper No. 47 – Date: 31 July 2008 469A Bukit Timah Road #07-01, Tower Block, Singapore 259770 Tel: 6516 6179 / 6516 4239 Fax: 6776 7505 / 6314 5447 Email: [email protected] Website: www.isas.nus.edu.sg
Justice Delivery in India – A Snapshot of Problems and Reforms
Bibek Debroy∗
Summary
In attaining higher gross domestic product growth rates, legal reforms are now recognised as a critical ingredient. The Indian legal infrastructure needed reforms in any case, even if the post-1991 cycle of economic reforms had not occurred. However, liberalisation has provided an additional trigger. The word “law” has various interpretations. Consequently, the expression legal reform also needs to be pinned down. There are three layers in legal reform. First, there is an element of statutory law reform and there are three clear elements to statutory law reform – weeding out old and dysfunctional elements in legislation, unification and harmonization, and reducing state intervention. Second, legal reform has to have an administrative law reform component, meaning the subordinate legislation in the form of rules, orders, regulations and instructions from ministries and government departments. Often, constraints to efficient decision-making come about through administrative law rather than through statutory law and bribery and rent-seeking are fallouts. Finally, the third element of legal reform is what may be called judicial reforms, though faster dispute resolution and contract enforcement are not exclusively judicial issues.
In reform initiatives since 1991, judicial reform has often remained outside substantial
liberalisation initiatives. This is despite the problem being recognised. Within judicial reforms, one can detect at least four strands in proposed reforms. First, there is the question of judicial strength, though the number and skill-sets of non-judicial staff are equally important. This is a supply-side solution that is the most commonly cited reason for court congestion and delays. However, this is also linked to vacancies and the judicial appointment and promotion process, as judicial workforce planning. Second, there is a set of reforms linked to improving judicial efficiency and court productivity, through education/training, better court administration in non-judicial functions and improved case and case-flow management, facilitated by infrastructure improvements. This too is a supply-side solution. Third, as a sub-strand to number two, information and communication technology (ICT) can specifically be used to enhance productivity. Fourth, the demand for adjudication can be reduced through alternative channels of dispute resolution (mediation, conciliation, arbitration) and reducing the government’s contribution in civil litigation.
∗ Professor Bibek Debroy is a Visiting Senior Research Fellow at the Institute of South Asian Studies, an
The structure of the paper is as follows. Section 1 is an introduction. Section 2 is a statistical section, outlining the nature of the backlog problem. This is necessary because a lot of the discussion on judicial reform takes place on the basis of rough all-India estimates of pendency, without appreciating the need for disaggregation. Section 3 outlines existing attempts to reduce pendency. On this too, information is normally available only at a very vague and general level. Section 4 is on the question of ICT usage. Section 5 is on the often-neglected question of criminal justice reform. Criminal justice reform cannot be separated from the question of police reform and Section 6 is specifically devoted to that issue. Sections 2 through 6 essentially set out the facts and perform a dissemination function. Using this informational base, Section 7 is a normative one that sets out broad directions for reform.
There are some generic solutions that one should mention first. First, there is the natural conclusion that the number of judges and courts needs to be increased. At a Chief Justices’ conference in 2004, a committee was constituted to get a fix on the recommended judge/case ratio and a figure of 500 to 600 was suggested for district and subordinate courts. Working with the pendency figures, this translates into an additional 35,000 courts or so, depending on how one derives the number. The total number of courts right now is 12,148. Alternatively, one can work with the judge/population ratio. In its 120th report (1987), the Law Commission stated that the number of judges per million population should increase from 10.5 to 50. That figure of 10.5 is often quoted, but is somewhat suspect. On 31 December 2007, the sanctioned strength in district and subordinate courts was 15,917. Because of a large number of vacancies (with large numbers in Uttar Pradesh, Andhra, Maharashtra, West Bengal and Andaman & Nicobar Islands, Gujarat, Karnataka, Madhya Pradesh, Bihar and Uttarakhand), the working strength was only 12,549. However, even if one works with the sanctioned strength, the judge/million population ratio is a shade lower than seven, not 10.5. If the 50 target is accepted, this works out to an additional 98,000 judges.
Second, this raises the issue of financial autonomy for the judiciary. The point about planning and budgetary exercises being undertaken without consulting the judiciary is a valid one, though since 1993, the expenditure on judicial administration has become a Plan subject. Since 1993, there has also been a centrally-sponsored scheme for improvement of infrastructure. Fifty percent of the expenditure is met by the centre and there has to be a 50 percent matching grant from states. These funds are made available by the Planning Commission. It is a separate matter that many state governments have been reluctant to provide the matching grants. The National Commission set up to review the Constitution also flagged paucity of funds, both through the Planning Commission and the Finance Commission, and recommended planning and budgetary exercises through a national and state-level Judicial Councils. However, accepting that there is a financial problem is one thing. Arguing that there should be complete financial autonomy is another. Without firm evidence that the judiciary has sought to reduce pendency, the argument for financial autonomy will have few takers. For instance, the judicial appointment and promotion process is de facto in the hands of the judiciary. What then explains the high vacancy rates? Alternatively, one can quibble about the precise indicator used to measure judicial productivity, but why is the judiciary reluctant to accept disposal targets?
Third, there are procedural improvements required. While the Code of Civil Procedure was amended in 2001 and 2002, there is still scope for improving orders issued under the code for issues like written statements, costs, examination of parties, framing of issues, evidence on affidavits and ex-parte injunctions. Since two-thirds of the backlog
3
consists of criminal cases, amendments to the Code of Criminal Procedure and the Indian Evidence Act are long overdue. Consequently, there are problems with lack of pre-trial hearings, service of summons, delays in supplying copies to the accused, exempting the accused from personal appearances, delays in framing charges, repeated adjournments, non-availability of witnesses and compounding, not to speak of lack of public prosecutors and problems with the police. But it is necessary to mention that the average conviction rate isn’t 6 percent, as is commonly believed to be the case.
Fourth, while the three points made above are generic, there is a case for focusing on certain types of cases. For instance, the government litigation policy for civil cases crowds out citizens from using the court system, though Section 80 of the Code of Civil Procedure allows for out-of-court settlements. That apart, specific focus on the Negotiable Instruments Act, Motor Accidents Claims Tribunal cases, petty cases, old cases and cases related to excise is possible.
Fifth, generic improvements require large sums of money. Experiments like Lok Adalats, fast track courts, Family Courts, mobile courts, Nyaya Panchayats, Gram Nyayalayas, People’s Courts and Women’s Courts can accordingly be perceived as driven by the motive of getting a bigger bang for the buck. This has been described as load shedding and a hollowing out of the Indian State. That may amount to stating it a bit too strongly. However, there is no getting away from the fundamental constraints with the justice delivery system, with these solutions being no more than add-ons and quick fixes.
The High Court problem is in Allahabad (criminal and civil), Madras (criminal and
civil), Bombay (civil), Calcutta (civil), Patna (criminal), Punjab & Haryana (civil), Rajasthan (criminal and civil), Delhi (criminal and civil), Jharkhand (criminal), Madhya Pradesh (criminal) and Orissa (civil). The Lower Court problem is in Tamil Nadu (civil and criminal), Uttar Pradesh (civil and criminal), Rajasthan (civil and criminal), Punjab (civil), Haryana (civil), Orissa (criminal), West Bengal (criminal), Kerala (civil), Bihar (civil and criminal), Gujarat (civil), Delhi (criminal) and Maharashtra (criminal). To recapitulate from Section 3, the Lok Adalat success has been in Bihar, Gujarat, Haryana, Jammu & Kashmir, Jharkhand, Karnataka, Madhya Pradesh, Maharashtra, Orissa, Punjab, Rajasthan and Uttar Pradesh. The Fast Track Courts success has been in Andhra Pradesh, Gujarat, Maharashtra, Tamil Nadu and Uttar Pradesh. The Family Court success has been most evident in Kerala, Maharashtra and Uttar Pradesh. This raises a very simple point. With or without Finance Commission funds, reforms require a buy-in from states. Clearly, different States have different priorities. Why should there be a central scheme that is uniform and standard for all states? Why should States not be asked to determine what they would like to focus on? For instance, Bihar might want to build on the Lok Adalat success, while Kerala might want to build on the Family Court success.
4
Section 1: Introduction
This paper is deliberately descriptive in focus and not normative, barring this introductory first section and the concluding one. A lot has been written on law reform in India. In attaining higher gross domestic product (GDP) growth rates, legal reforms are now recognised as a critical ingredient. In a somewhat belated recognition of the importance of legal reforms, Economic Survey 2004-05 had a section on the infrastructure of contract enforcement.1 The Indian legal infrastructure needed reforms in any case, even if the post-1991 cycle of economic reforms had not occurred. However, liberalisation has provided an additional trigger. The word “law” has various interpretations. Consequently, the expression legal reform also needs to be pinned down. There are three layers in legal reform. First, there is an element of statutory law reform and there are three clear elements to statutory law reform – weeding out old and dysfunctional elements in legislation, unification and harmonisation and reducing State intervention. Second, legal reform has to have an administrative law reform component, meaning the subordinate legislation in the form of rules, orders, regulations and instructions from ministries and government departments. Often, constraints to efficient decision-making come about through administrative law rather than through statutory law and bribery and rent-seeking are fallouts. Finally, the third element of legal reform is what may be called judicial reforms, though faster dispute resolution and contract enforcement are not exclusively judicial issues.
In reform initiatives since 1991, judicial reform has often remained outside substantial
liberalisation initiatives. “If there is one sector which has kept away from the reforms process it is the administration of justice.”2 This is despite the problem being recognised. “There was, no doubt, a time when Judiciary was highly respected by the people who had faith in the quality of justice, dispensed with promptly by the Judges. Now the people have started losing (sic) faith in the entire judicial system because of every day increasing arrears… It is a usual phenomenon to hear the conversation between suitors that they are not likely to reap the fruits of litigation during their life time. Eminent Jurists have gone even to the extent of observing that our justice delivery system is cracking under the oppressive weight of delay and arrears. It has been repeated ad nauseam that to delay Justice is to deny Justice…. From time to time, public attention has been drawn to this sorry state of affairs and though the matter has been frequently discussed both in the Parliament and outside, yet the problem has defied any solution. Pt. Jawaharlal Nehru, while addressing a conference of State Law Ministers expressed alarm at the slow pace of the wheels of justice and pleaded for a change of attitude and a genuine effort to accelerate the judicial machine which according to him was rusty and out-moded.”3 The Gujarat High Court remarked that the life span of a civil case was, on an average, between eight and twelve years.4
For those unfamiliar with the Indian judicial structure, a few preliminary remarks are
in order. There are around 12,000 courts – one Supreme Court, 21 High Courts, 3,150 District Level Courts, 4,816 Munsif/Magistrate Courts and 1,964 Magistrate II and equivalent Courts. 1 Economic Survey has usually set out the reform agenda, at least since 1991, and particularly in the first
chapter. Although Economic Survey originates with Finance Ministry and the Department of Economic Affairs, it is remarkable that legal reforms found no explicit mention earlier, except for references to specific statutes.
2 Arun Jaitley, the then Union Law Minister, “India’s Judicial Reforms,” R.N. Malhotra Memorial Lecture, India International Centre, 14 February 2001.
3 Siddhartha Kumar and others v. Upper Civil Judge, Senior Division, Ghazipur and others, 1998(!)AWC593, Allahabad High Court.
4 Dineshbhai Dhemenrai v. State of Gujarat, MANU/GJ/0421/2000.
5
Only six of the High Courts have original jurisdiction, that is, civil suits can be directly filed in these courts, provided the monetary value of the suit is above a certain amount. These are the High Courts of Bombay, Calcutta, Delhi, Himachal Pradesh, Jammu & Kashmir and Madras. The minimum monetary values admissible differ among these 6 courts. Other High Courts are appellate courts. In States where the High Court does not have original jurisdiction, even disputes involving large sums of money have to go through lower courts, which often do not possess requisite expertise to adjudicate on complicated matters. The case eventually winds up in the High Court, but only after delays. Even when High Courts have original jurisdiction, the monetary threshold is sometimes so low that cases unnecessarily go directly to High Courts. All High Courts also have additional original jurisdiction under specific statutes. Civil and criminal cases are handled by the same Court. Because of non-judicial reasons, criminal cases sometimes receive priority, increasing transaction costs for civil cases. There are other problems of overlap too. A district magistrate has to deal with land revenue cases and general administration, but is simultaneously the appellate authority on criminal cases. There is no clear distinction across administrative and judicial responsibilities. A judicial reform framework primarily needs to target District and Subordinate Courts, because these are usually the trial courts. To add to the court system, there are tribunals and other quasi-judicial forums. One should also mention that Constitutional matters are not within the purview of the lower judiciary. Although writs are meant to be extraordinary remedies, they account for a large chunk of the volume of litigation.
Despite caveats to cross-country comparisons, such studies often link economic
growth to “rule of law”.5 There is also the World Bank Institute’s Governance Matters set of indicators,6 with a specific head of rule of law. In 2004, among 209 countries, India had a percentile rank of 50.7 percent for rule of law. Within judicial reforms, one can detect at least four strands in proposed reforms.7 First, there is the question of judicial strength, though the number and skill-sets of non-judicial staff are equally important. This is a supply-side solution that is the most commonly cited reason for court congestion and delays. However, this is also linked to vacancies and the judicial appointment and promotion process, as judicial workforce planning. Second, there is a set of reforms linked to improving judicial efficiency and court productivity, through education/training, better court administration in non-judicial functions and improved case and case-flow management, facilitated by infrastructure improvements. This too is a supply-side solution. Third, as a sub-strand to number two, information and communication technology (ICT) can specifically be used to enhance productivity. Fourth, demand for adjudication can be reduced through alternative channels of dispute resolution (mediation, conciliation, arbitration) and reducing the government’s contribution in civil litigation.
With this introduction, the structure of the rest of the paper is as follows. Section 2 is
a statistical section, outlining the nature of the backlog problem. This is necessary because a lot of the discussion on judicial reform takes place on the basis of rough all-India estimates of pendency, without appreciating the need for disaggregation. Section 3 outlines existing
5 In particular, see, Ronald J. Daniels and Michael Trebilcock, “The Political Economy of Rule of Law
Reform in Developing Countries,” www.wdi.bus.umich.edu/global_conf/papers/revised/Treblicock_ Michael.pdf, 2004 and Daniel Kauffmann, Aart Kraay and Pablo Zoido-Lobaton, “Governance Matters,” World Bank Policy Research Working Papers, No. 2196, 1999.
6 http://www.worldbank.org/wbi/governance/ 7 This should not be taken to mean that there are not any other areas that require reforms. But these three are
the most important and represent the core of judicial reforms. And even more importantly, these require little change in procedural rules.
6
attempts to reduce pendency. On this too, information is normally available only at a very vague and general level. Section 4 is on the afore-mentioned question of ICT usage. Section 5 is on the often-neglected question of criminal justice reform. Criminal justice reform cannot be separated from the question of police reform and Section 6 is specifically devoted to that issue. Sections 2 through 6 essentially set out the facts and perform a dissemination function. Using this informational base, Section 7 is a normative one that sets out broad directions for reform.
Section 2: The Magnitude of Pendency
2.1: The Supreme Court The Supreme Court accounts for only a small share of the pendency. What is however odd is that ten years ago, the Supreme Court was able to reduce the pendency to a shade less than 20,000 and at that point, this was lauded as a demonstrated success of better case management and IT usage. In 1950, the pendency in the Supreme Court was 771 cases.8 By 1978, pendency was 23,092, and in 1983, pendency crossed 100,000. On 31 December 1991, the number of cases pending before the Supreme Court was 134,221. 9 Then this number was substantially reduced to 19,806 in 1998 and it was 21,715 at the end of 2001.10 Since those days of reduction, the pendency has increased by between 13 and 15 percent every year and has more than doubled. Compared to the all-India pendency figures, even 50,000 is a small number. But surely some explanation should have been forthcoming about what has now gone wrong with the Supreme Court. In 2007, the Supreme Court disposed of 61,957 cases. This is the right place to draw a possible distinction between the terms pendency, arrears, delay and backlog, often used synonymously. Since these terms are used synonymously in virtually every discussion, we tend to do the same in this paper as well. However, if a distinction is to be drawn, pendency simply means the total number of cases in the court system. Indeed, high levels of pendency indicate faith in the judicial system. Arrears are an excess of new cases over disposed cases. Arrears contribute to delays. Delays are old cases that are not disposed of. The word backlog is sometimes used in the sense of pendency and sometimes in the sense of delays. Given these different senses in which these terms are used, perhaps one should eventually transit to a term like court congestion. This will also be more in conformity with international usage. The total pendency in the court system, excluding other quasi-judicial forums, now amounts to 29.1 million - 46,926 in the Supreme Court, 3.7 million in High Courts and 25.4 million in Lower Courts.
Table 1: Pendency in the Supreme Court11
31 December 2004 31 December 2005 31 December 2006 31 December 2007 30,151 34,481 39,780 46,926
8 Thommen Kochu T, “Arrears in Courts: Measures to contain them”, (1983) 3 SCC (Jour) 15. 9 Mohd. Shamim J., “How to clear the backlog of arrears of cases in courts?”, AIR 1994 (Jour) 129. 10 Chapter – II, Annual Report 2000-2001, Ministry of Home Affairs. 11 Figures for 2004 to 2006 from Govt. of India, Ministry of Law and Justice, Lok Sabha starred question No.
35, answered on 16.11.2007 and for 2007 from a statement by the Union Minister for Law and Justice.
7
2.2: The High Courts
As has been mentioned before, the High Courts enjoy civil as well as criminal, ordinary as well as extraordinary, and general as well as special, jurisdiction. The source for the jurisdiction is the Constitution of India and various statutes, along with other instruments constituting the High Courts. 12 The High Courts enjoy extraordinary jurisdiction under Articles 226 and 227 of the Constitution, enabling them to issue prerogative wrist, such as habeas corpus, mandamus, prohibition and certiorari. Being courts of record, they have the power to punish for contempt of High Courts, as well as contempt of subordinate courts. At present, there are 21 High Courts - Allahabad (with a bench in Lucknow), Andhra Pradesh (seat in Hyderabad), Calcutta, Bombay (with benches in Aurangabad, Panaji and Nagpur), Jammu and Kashmir (seats in Jammu and Srinagar), Madras, Jharkhand (seat in Ranchi), Chhattisgarh (seat in Bilaspur), Gauhati (benches in Aizwal, Kohima and Imphal and circuit benches in Agartala and Shillong), Patna, Sikkim (seat in Gangtok), Rajasthan (seat in Jodhpur, with a bench in Jaipur), Madhya Pradesh (seat in Jabalpur, with benches in Gwalior and Indore), Delhi, Gujarat (seat in Ahmedabad), Himachal Pradesh (seat in Shimla), Karnataka (seat in Bangalore), Orissa (seat in Cuttack), Kerala (seat in Ernakulam), Punjab and Haryana (seat in Chandigarh) and Uttaranchal (seat in Nainital).
The pendency in High Courts was 1.48 million in 1987.13 Pendency increased to 2.651 million in January 1994, 2.981 million in January 1996, 3.181 million in January 1998, 3.365 million in January 2000, 3.557 million in January 2001 and 3.743 million in December 2007.14
Table 2 provides more details. Allahabad High Court has the dubious distinction of accounting for 22 percent of the pendency, followed by Madras High Court (11.5 percent), Bombay High Court (10 percent), Calcutta High Court (7.5 percent), Punjab and Haryana High Court (seven percent), Orissa High Court (6.2 percent) and Rajasthan High Court (5.7 percent). The High Courts of Allahabad, Madras, Bombay, Calcutta and Punjab & Haryana account for 60 percent of the pendency in High Courts. If one adds Rajasthan, Orissa, Madhya Pradesh and Kerala, one accounts for 71 percent of the pendency. This suggests a targeted focus on specific High Courts. Understandably, as Table 3 shows, civil cases account for the bulk of the pendency in High Courts. Criminal cases account for between 18 and 19 percent of the pendency. The High Court pendency problem is fundamentally a civil one. This is not to deny that there is some criminal case pendency in High Courts. But this is concentrated in Allahabad, Patna, Madras, Rajasthan, Delhi, Jharkhand and Madhya Pradesh, with Allahabad alone accounting for 30 percent. Judged in terms of pendency alone, the targeted criminal case focus should be on Allahabad, Patna, Madras and Delhi.
12 Law Commission of India, 124th Report on the High Court Arrears – A Fresh Look, 1988. 13 Ibid. 14 Data come from different sources, though they all originate with the Ministry of Law, Justice & Company
Affairs. However, some data used are from the Annual Reports of the Ministry. Others from answers to Parliamentary questions and still others from the Supreme Court’s on-line Court News. For the same year, there are sometimes discrepancies in figures.
8
Table 2: Pendency in High Courts
S.No Name of the High Court Number of cases pending 1.1.2005 1.1.2006 1.1.2007 31.12.2007
However, pendency is a stock. Arrears (new cases minus disposed cases) are flows and better indicators of change. The visual graphs that follow indicate the incremental change in High Courts for the period 2004 to 2008. So far as arrears are concerned, there should be a criminal case concern in Rajasthan, Jharkhand and MP. Judged in terms of civil case arrears, the High Courts to worry about are Madras, Allahabad, Orissa, Calcutta, Punjab & Haryana, Rajasthan and Bombay. These account for 75 percent of the arrears in civil cases in the case of High Courts. If one splices the pendency (stock) and arrears (flow) identification together, one zeroes in on the High Courts of Allahabad (criminal and civil), Madras (criminal and civil), Bombay (civil), Calcutta (civil), Patna (criminal), Punjab & Haryana (civil), Rajasthan (criminal and civil), Delhi (criminal and civil), Jharkhand (criminal), MP (criminal) and Orissa (civil). While these are major courts, accounting for high shares of both pendency and arrears, it is not the case that every High Court has a pendency or arrears problem. As the graphs show, while there are sometimes fluctuations, High Courts like Andhra, Gujarat, Kerala, MP and Uttaranchal have been able to reduce pendency. But one also has experiences like Allahabad, Bombay, Madras, Himachal, Orissa, Patna, Rajasthan and Jharkhand.
9
Table 3: High Court Pendency – Civil and Criminal Cases
Before leaving High Courts, one should say a few words about old cases, often used anecdotally to drive home the point that the speed of dispute resolution in India is inordinately slow. Probably because there were question marks about the quality of data, figures on age-wise classification of cases are no longer available in the public domain now. There is a dated figure for 31 December 2005, to the effect that 531,477 cases pending in High Courts were more than 10-years old.15 There is an obvious argument for setting up special benches for hearing cases that are more than 3-years old. 2.3: The Lower Courts Table 4 provides a snapshot of the pendency in Lower (Subordinate and District) Courts. As is understandable, in a reversal of the trend in High Courts, 71.3 percent of the pendency in Lower Courts is of criminal cases, not civil ones. 70 percent of the pendency in Lower Courts is concentrated in Uttar Pradesh, Maharashtra, Gujarat, West Bengal, Bihar, Karnataka and Rajasthan. If uses the flow of arrears (excess of institutions over disposals) rather than the stock of pendency to identify regions that face a problem, criminal cases constitute a problem in UP, Maharashtra, Bihar, Orissa, Tamil Nadu, Delhi and West Bengal. Twenty six percent of arrears are in UP alone. With a focus on civil case arrears, one ends up
15 “Delayed Justice,” Justice Sobhag Mal Jain Memorial Lecture delivered by the then Chief Justice of India,
Y. K. Sabharwal on 25 July 2006.
17
identifying Kerala, Tamil Nadu, UP, Rajasthan, Bihar, Gujarat, Punjab and Haryana. Sixty percent of civil case arrears are in Kerala. A region-specific targeted intervention should be based on Tamil Nadu (civil and criminal), UP (civil and criminal), Rajasthan (civil and criminal), Punjab (civil), Haryana (civil), Orissa (criminal), West Bengal (criminal), Kerala (civil), Bihar (civil and criminal), Gujarat (civil), Delhi (criminal) and Maharashtra (criminal). A comment has already been made about age-specific data no longer being available. Data from the late-1990s show that 31 percent of civil cases in Lower Courts are more than 3-years old and a comparable figure is 25 percent for criminal cases. On an average, across High Courts and Lower Courts, probably around 15 percent of cases are more than 3-years old and around 0.5 percent are more than 10-years old. Though High Courts, and their jurisdictions, vary widely, on an average, such old cases number between 7000 and 8000 for every High Court jurisdiction.
A 29.1 million pendency figure is horrendous, even if data on arrears are not that bad. The problem is as old as the hills. Exodus, 18.13 states, “And it came to pass on the morrow that Moses sat to judge the people: and the people stood by Moses from the morning unto the evening.” As a single judge, Moses simply could not handle the problem. Jethro’s solution was simple, more judges, more courts and more benches. “Moreover thou shalt provide out of all the people able men, such as fear God, men of truth, hating covetousness; and place such over them, to be rulers of thousands, and rulers of hundreds, rulers of fifties, and rulers of tens. And let them judge the people at all seasons: and it shall be, that every great matter they shall bring unto thee, but every small matter they shall judge: so shall it be easier for thyself, and they shall bear the burden with thee.”16 The earliest government committee to examine the problem of pendency and arrears was the Rankin Committee (1924) and there were High Courts Arrears Committees in 1949 and 1972, several Law Commission reports, an Estimates Committee in 1986, a Satish Chandra Committee in 1986 and another Arrears Committee in 1990. These recommendations fit into the pattern of supply-side solutions mentioned earlier, with increased IT-usage as a recent trend. On 29th April 2005, the then President of India addressed an all-India seminar on judicial reforms, with special reference to arrears and identified the main reasons for delays as (a) inadequate number of courts; (b) inadequate number of judicial officers; (c) ill-equipped judicial officers; (d) dilatory tactics by lawyers and litigants; and (e) role of court administrative staff.17 The intention of this section is not to revisit such diagnoses or suggested solutions. Instead, we focus on some recent attempts to reduce pendency.
3.1: Lok Adalats
Lok Adalats originated because the established legal and juridical system failed to provide effective, fast and inexpensive justice. In 1980, a Committee known as CILAS (Committee for Implementing Legal Aid Schemes) was set up to monitor legal aid activities. This gave birth to Lok Adalats and the first Lok Adalat was held in 1982 in Junagadh, Gujarat. Lok Adalats are supplementary forums to provide quick, easy, accessible, non-technical and sympathetic dispute resolution mechanisms and should also address pendency problems. The Legal Services Authorities Act was enacted in 1987 to provide free and competent legal service to weaker sections of society and to ensure that opportunities for securing justice are not denied to any citizen by reason of economic or other disabilities.18 In 2002, the Legal Services Authorities Act was amended, requiring establishment of permanent Lok Adalats for public utility services. Lok Adalats differ from the earlier Nyaya Panchayats in that they are not constrained by being restricted to specific categories or “minor” matters. Through a compromise between the parties, they have the jurisdiction not only to settle matters that have not yet been formally instituted in a court of law, but also those which are pending in courts. This covers both civil and criminal cases. However, an offence that is not compoundable
16 Exodus, 18.21-22. 17 http://presidentofindia.nic.in/, 2005. 18 The Legal Services Authorities Act, 1987, states in its Statement of Objects and Reasons – “For some time
now, Lok Adalats are being constituted at various places in the country for disposal, in a summary way and through the process of arbitration and settlement between the parties, of a large number of cases expeditiously and with lesser costs. The institution of Lok Adalats is at present functioning as a voluntary and conciliatory agency without any statutory backing for its decisions. It has proved to be very popular in providing for a speedier system of administration of justice. In view of its growing popularity, there has been a demand for providing a statutory backing to this institution and the awards given by Lok Adalats. It is felt that such a statutory support would not only reduce the burden of arrears of work in regular courts, but would also take justice to the doorsteps of the poor and the needy and make justice quicker and less expensive.” Chapter VI of the Legal Services Authorities Act, 1987 deals with Lok Adalats.
19
cannot be decided by a Lok Adalat, even if the two parties agree to this. There are no court fees and if the case had earlier been lodged in a regular court, that court fee is refunded. The key is consent19 and a Lok Adalat decision cannot be forced on either party. However, once the two parties have agreed to refer a matter to a Lok Adalat, the decision is binding. The Supreme Court has also held that if the consent of the parties has not been obtained, the Lok Adalat’s decision is not executable and the regular litigation process must be resorted to.20 The National Legal Services Authority (NALSA) not only has the responsibility of providing legal services to those who are eligible, it also has the responsibility of organising Lok Adalats. Hence, funds to State Legal Services Authorities are also channeled through NALSA for organising Lok Adalats.
With all these advantages, the Lok Adalat system should have exploded. But as Table
5 shows, this is not quite what has happened. 21 The number of Lok Adalats organised increased from 33,810 in 2001-02 to 35,167 in 2002-03 and 43,493 in 2003-04. However, this apparent success has not been matched by the number of cases that Lok Adalats have disposed of. That figure was 1,448,472 in 2001-02, but dipped to 1,252,021 in 2002-03 and 1,180,371 in 2003-04. The problem does not seem to be paucity of financial resources. What is also noticeable is the great inter-State variation in performance of Lok Adalats. For instance, if cases disposed of divided by number of Lok Adalats organised is an acceptable indicator of Lok Adalat productivity, among major States, the performances of Bihar, Gujarat, Haryana, Jammu & Kashmir, Jharkhand, Karnataka, Madhya Pradesh, Maharashtra, Orissa, Punjab, Rajasthan and Uttar Pradesh have been outstanding. At the risk of sounding speculative, there seems to be a correlation with the States identified for specific focus in Section 2, especially at the Lower Court level. As a hypothesis, this makes eminent sense.
19 However, the parties need not only be those who are entitled to free legal aid. 20 Jagtar Singh and another v. State of Punjab and others, 2004 Indlaw SC 784. 21 Govt. of India, Ministry of Law and Justice, Lok Sabha Unstarred Question No. 1465, 11.03.2005.
The Eleventh Finance Commission recommended and sanctioned the setting up of 1,734 Fast Track Courts (FTCs), with a special focus on cases involving under-trials, who had remained in jails for a period of more than two years. The original note prepared for the Eleventh Finance Commission is symptomatic. “The demand made to us by the States for upgradation of judicial administration, including establishment of new courts, sums up to Rs 4,870 crores…. This is too large an amount to be met out of the upgradation grant that this Commission has at its disposal. It also goes without saying that the creation of these new courts would require very large recurring and non-recurring expenditure. Therefore, we should evolve a scheme whereby a smaller fund would serve the larger purpose of clearing the backlog substantially by the end of 2004-05…. The Scheme is that instead of employing new judged, retired sessions judges and additional sessions judges be appointed as ad hoc judges for disposing of the pending sessions cases…. Some definite guidelines for the disposal of cases may be given to them, for example, 14 sessions trial cases to be disposed of in a month. If 5 judges are appointed in a district (of course, looking to the size of the district and the pendency of the cases) and they dispose of 14 sessions cases in a month, each judge will then be disposing of 168 cases in a year and 5 judges, 840 cases. In 600 districts (this is a round figure, though the districts are 571), the total disposal will be 500,000 cases per year
22
and in four years time, that is, 2001-05, approximately two million cases will be disposed of… Quite interestingly, this would also entail enormous saving of expenses over the under-trials languishing in jails…. In other words, if the trial of cases is expeditiously taken up and disposed, the presence of 120,000 under-trials would not be necessary…. It is true that a year’s time may be required to work out the modalities to be settled by the Law Ministry for amendment of the laws, making rules for the appointment of the ad hoc judges, their selection and appointment, and for the construction of the court rooms etc. But, safely enough, this exercise can be completed by 31.3.2001. And if a beginning is made immediately, concrete results should be attainable by 2005 and most of the backlog may be cleared in about 8 to 10 years time.”22
The Eleventh Finance Commission approved a total grant of Rs. 5.029 billion for the
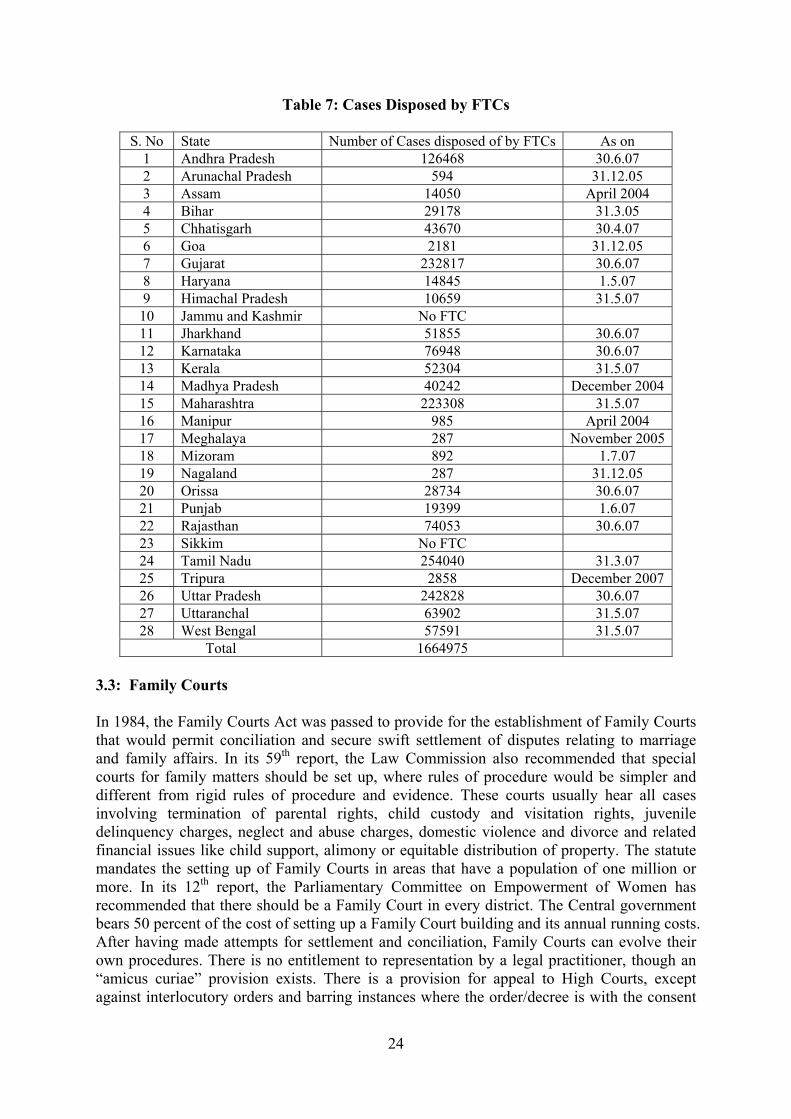
1734 FTCs. Grants for FTCs were one of the twelve upgradation grants recommended by the Commission and Rs4.33.75 billion was released as grants until 28th March, 2005. Of this, Rs3.0148 billion was reported as utilised.23 Dr. Manmohan Singh, speaking at the conference of Chief Ministers and Chief Justices of High Courts on Administration of Justice on Fast Track in April 2007, pointed out that the Government had provided Rs5.09 billion for the organisation of FTCs and expressed concern that the receipt of utilisation reports from States was not satisfactory, thus leading to a delay in disbursal.24 In the first five years of their creation (2000-05), FTCs have disposed of 800,000 cases, compared to the 500,000 cases that they were expected to dispose of in a single year. The FTCs have disposed of roughly half the 1,500,000 cases that have been transferred to them. Till 31 March 2005, State governments notified only 1711 FTCs and only 1562 were functional. Table 6 gives a breakup of the 1562 functional FTCs.25 Table 7 shows the number of cases disposed by FTCs.26 The FTC scheme was supposed to end on 31 March 2005. However, since they have been at least partly effective, their term has been extended by another five years, till 31st March 2010. Judicial response to FTCs often is that they need to be made permanent, with appointments into a regular judicial service under the disciplinary control of the High Court. This confuses the intent behind FTCs with a broader objective of improving court systems in general. It is a separate matter to argue that, in addition to cases from sessions courts, those from magistrates’ courts, and even civil cases, should also be transferred to FTCs. The regional variation across FTC performance is also evident. The all-India average of cases disposed per month is 15, per FTC. As originally envisaged, this was meant to be a per judge norm, not per FTC. Per FTC, Tamil Nadu has been logging 63 cases per month. There is no getting away from the fact that there are broader governance (including judicial) problems in parts of the country. The FTC scheme has only ensured funds, without ensuring accountability. It has not incentivised reforms.
22 Note by N. C. Jain, Member, Eleventh Finance Commission, 29.6.2000. 23 Department related Parliamentary Standing Committee on Personnel, Public Grievances, Law and Justice,
Sixth report on Demands for Grants (2005-06) of the Ministry of Law and Justice, Presented to the Rajya Sabha on 20th April, 2005 and laid on the table of the Lok Sabha on 20th April, 2005, Rajya Sabha Secretariat, New Delhi, April 2005.
24 Singh Manmohan, “Administration of Justice on fast track”, (2007) 4 SCC J-9, p.1. 25 Govt. of India, Ministry of Law and Justice, Lok Sabha starred question No. 325, 18.08.2006. 26 Govt. of India, Ministry of Law and Justice, Lok Sabha unstarred question No. 870, 17.08.2007.
23
Table 6: Functional FTCs
S. No States/Union Territories No. of FTCs functional as on 31.3.2005 1 Andhra Pradesh 86 2 Arunachal Pradesh 3 3 Assam 20 4 Bihar 150 5 Chhatisgarh 31 6 Goa 5 7 Gujarat 166 8 Haryana 16 9 Himachal Pradesh 9
S. No State Number of Cases disposed of by FTCs As on 1 Andhra Pradesh 126468 30.6.07 2 Arunachal Pradesh 594 31.12.05 3 Assam 14050 April 2004 4 Bihar 29178 31.3.05 5 Chhatisgarh 43670 30.4.07 6 Goa 2181 31.12.05 7 Gujarat 232817 30.6.07 8 Haryana 14845 1.5.07 9 Himachal Pradesh 10659 31.5.07 10 Jammu and Kashmir No FTC 11 Jharkhand 51855 30.6.07 12 Karnataka 76948 30.6.07 13 Kerala 52304 31.5.07 14 Madhya Pradesh 40242 December 2004 15 Maharashtra 223308 31.5.07 16 Manipur 985 April 2004 17 Meghalaya 287 November 200518 Mizoram 892 1.7.07 19 Nagaland 287 31.12.05 20 Orissa 28734 30.6.07 21 Punjab 19399 1.6.07 22 Rajasthan 74053 30.6.07 23 Sikkim No FTC 24 Tamil Nadu 254040 31.3.07 25 Tripura 2858 December 2007 26 Uttar Pradesh 242828 30.6.07 27 Uttaranchal 63902 31.5.07 28 West Bengal 57591 31.5.07
Total 1664975 3.3: Family Courts In 1984, the Family Courts Act was passed to provide for the establishment of Family Courts that would permit conciliation and secure swift settlement of disputes relating to marriage and family affairs. In its 59th report, the Law Commission also recommended that special courts for family matters should be set up, where rules of procedure would be simpler and different from rigid rules of procedure and evidence. These courts usually hear all cases involving termination of parental rights, child custody and visitation rights, juvenile delinquency charges, neglect and abuse charges, domestic violence and divorce and related financial issues like child support, alimony or equitable distribution of property. The statute mandates the setting up of Family Courts in areas that have a population of one million or more. In its 12th report, the Parliamentary Committee on Empowerment of Women has recommended that there should be a Family Court in every district. The Central government bears 50 percent of the cost of setting up a Family Court building and its annual running costs. After having made attempts for settlement and conciliation, Family Courts can evolve their own procedures. There is no entitlement to representation by a legal practitioner, though an “amicus curiae” provision exists. There is a provision for appeal to High Courts, except against interlocutory orders and barring instances where the order/decree is with the consent
25
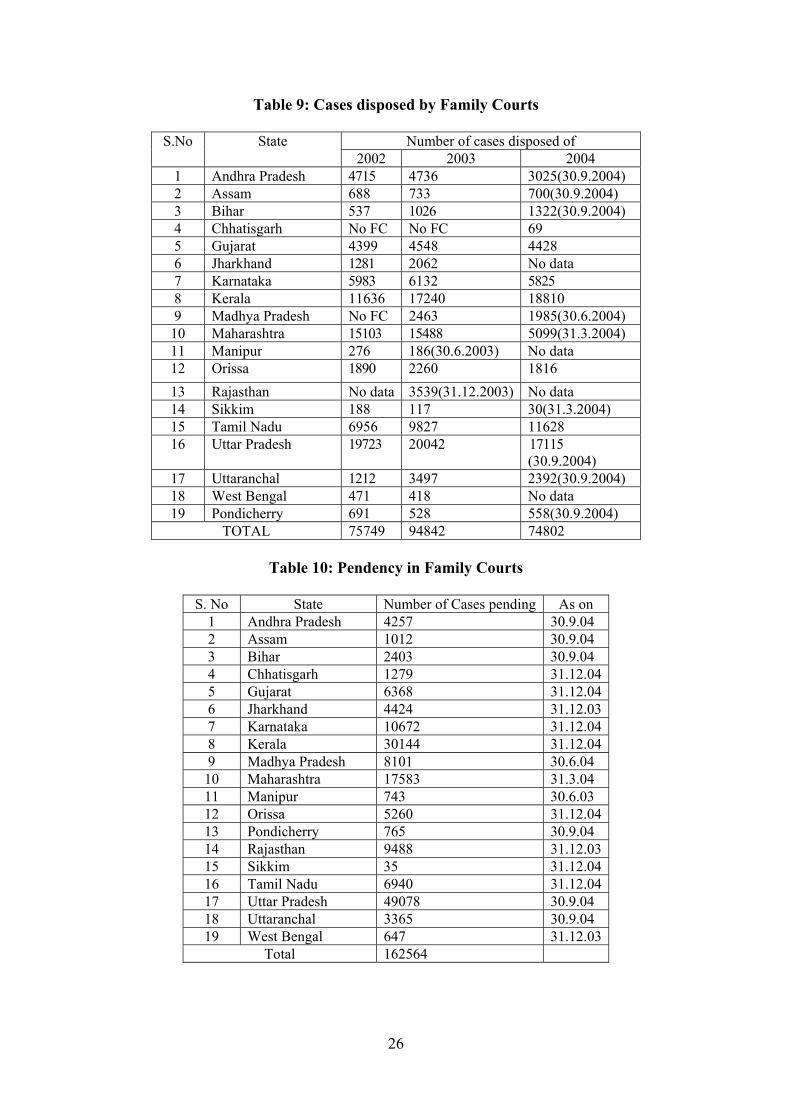
of both the parties. Table 8 shows the number of Family Courts that have been set up and Table 9 shows the number of cases that have been disposed by them.27 Table 10 shows the existing pendency in Family Courts. Clearly, Family Courts also suffer from the standard malaise of pendency and arrears.
Table 8: Number of Family Courts
S. No State Number of Family Courts 1 Andhra Pradesh 8 2 Assam 5 3 Bihar 4 4 Chhatisgarh 2 5 Gujarat 7 6 Jammu and Kashmir 1 7 Jharkhand 6 8 Karnataka 12 9 Kerala 16
27 Govt. of India, Ministry of Law and Justice, Lok Sabha unstarred question No. 679, 4.03.2005.
26
Table 9: Cases disposed by Family Courts
S.No State Number of cases disposed of 2002 2003 2004
1 Andhra Pradesh 4715 4736 3025(30.9.2004) 2 Assam 688 733 700(30.9.2004) 3 Bihar 537 1026 1322(30.9.2004) 4 Chhatisgarh No FC No FC 69 5 Gujarat 4399 4548 4428 6 Jharkhand 1281 2062 No data 7 Karnataka 5983 6132 5825 8 Kerala 11636 17240 18810 9 Madhya Pradesh No FC 2463 1985(30.6.2004) 10 Maharashtra 15103 15488 5099(31.3.2004) 11 Manipur 276 186(30.6.2003) No data 12 Orissa 1890 2260 1816 13 Rajasthan No data 3539(31.12.2003) No data 14 Sikkim 188 117 30(31.3.2004) 15 Tamil Nadu 6956 9827 11628 16 Uttar Pradesh 19723 20042 17115
(30.9.2004) 17 Uttaranchal 1212 3497 2392(30.9.2004) 18 West Bengal 471 418 No data 19 Pondicherry 691 528 558(30.9.2004)
TOTAL 75749 94842 74802
Table 10: Pendency in Family Courts
S. No State Number of Cases pending As on 1 Andhra Pradesh 4257 30.9.04 2 Assam 1012 30.9.04 3 Bihar 2403 30.9.04 4 Chhatisgarh 1279 31.12.04 5 Gujarat 6368 31.12.04 6 Jharkhand 4424 31.12.03 7 Karnataka 10672 31.12.04 8 Kerala 30144 31.12.04 9 Madhya Pradesh 8101 30.6.04 10 Maharashtra 17583 31.3.04 11 Manipur 743 30.6.03 12 Orissa 5260 31.12.04 13 Pondicherry 765 30.9.04 14 Rajasthan 9488 31.12.03 15 Sikkim 35 31.12.04 16 Tamil Nadu 6940 31.12.04 17 Uttar Pradesh 49078 30.9.04 18 Uttaranchal 3365 30.9.04 19 West Bengal 647 31.12.03
Total 162564
27
3.4: Mobile Courts A few mobile courts have also been set up, the first one in Haryana’s Mewat district. These have all the powers of usual judicial courts. The Central government has announced that it will provide funds for 7000 mobile courts throughout the country and bear the salary and allowance expenditure for the first three years, after which, the responsibility devolves on States. Since these mobile courts are of very recent vintage, it is still too early to judge how they will fare. 3.5: Nyaya Panchayats Article 39A of the Constitution has the goal of setting up dispute resolution mechanisms with the participation of the people. Article 40 requires the State to take steps to set up village panchayats, though dispute resolution is not directly mentioned in this Article. Instead, the expressions self-government is used. However, even in the early part of the 20th century, there were suggestions that nyaya panchayats be set up and several subsequent committees recommended this too.28 However, it was only in 1993, with the 73rd amendment to the Constitution that the roles of panchayats were clearly laid down. But the extent to which rights and responsibilities devolve on panchayats is still largely a function of what State governments decide to. Having said this, panchayats are subject to the standard criticisms of gender biases, low literacy levels, lack of representativeness and capture by elite, the latter including the caste problem. Despite these warts, which tend to become extremely visible, it is also true that only in 10 percent of panchayat judgements have parties moved the regular courts and in most cases, these higher courts have upheld the judgements of nyaya panchayats.29 The nyaya panchayats do not have the power to attach property or send parties to jail. 3.6: Gram Nyayalayas Given the varied experience with nyaya panchayats, it is a bit odd that one should now experiment with an idea of gram nyayalayas, which will render the dispute resolution function of panchayats obsolete. The two do not go together. In effect, gram nyayalayas undermine the panchayat system. The Gram Nyayalaya Bill of 2007 makes the gram nyayalaya the lowest court in a State and is broadly based on the recommendations of the 114th Law Commission report. The Bill has been placed in the Rajya Sabha in May 2007 and referred to the Standing Committee on Personnel, Public Grievances, Law and Justice. Gram nyayalayas have jurisdiction over both civil and criminal matters. But there is no provision for suo motu hearings. Nor do they have jurisdiction in cases that involve government or public servants acting in their official capacities. Each gram nyayalaya will be headed by a nyayadhikari, with the qualifications of a first class magistrate, and a cadre of a lower judicial service will be created by the State government. The standard procedural rigidities will be dispensed with and cases will be heard within 90 days, with judgements within a week from the date of last hearing. Parties can argue their own cases, but can also hire lawyers. Appeals will be with the District Court. 28 Balwantrai Mehta Report (1957), Asoka Mehta Committee (1978), the 14th Law Commission report (1959),
Rajagopaul Study Team (1962). 29 Mathur S.N., Nyaya Panchayats As Instruments Of Justice, 1st ed. (1997), p. 44.
28
3.7: Plea Bargaining Plea bargaining is relevant for criminal cases. The accused pleads guilty (this may mean reducing the original charge or charges) or no contest in exchange for a concession from the prosecutor. In its 142nd, 154th and 177th reports, the Law Commission recommended the incorporation of provisions on plea bargaining. In addition, the Malimath Committee (2000) on the reform of the criminal justice system and the commission set up to review the working of the Constitution (2002) also supported plea bargaining. Plea bargaining was not quite part of the criminal justice system in India. Section 30 of the Code of Criminal Procedure (1973) allowed certain forms of compounding with the permission of the court and there are a few other limited instances where compounding without the permission of the court is allowed. With safeguards, so that the provisions are not misused, plea bargaining has now become permissible through the insertion of Chapter XXI-A and Sections 265A-L in the Code of Criminal Procedure in 2005. Only certain crimes are permissible for plea bargaining, thereby excluding serious and habitual crimes.30 Plea bargaining is only possible when it has the consent of three parties – the victim, the prosecutor and the judge. It is too early to judge the success or the failure of plea bargaining in India. With differences in legal regimes, it will be incorrect to presume that it will be phenomenally successful in India, simply because it has worked in the United States.
3.8: Shift Systems in Subordinate Courts A shift system in courts allows courts to function with the same infrastructure, using the services of retired judges and judicial officers. This makes obvious sense because the establishment of additional courts and the appointment of full-time staff involves substantial amounts of capital and recurrent expenditure. If retired judges, judicial officers and administrative staff are used, all that needs to be paid as emoluments is the difference between salaries and pensions. Gujarat is one State that has introduced a shift system in subordinate courts from 14th November 2006. 60 evening courts have been held and 57,834 cases have been disposed of over four months. In addition to evening courts, it should be possible to introduce a shift in the morning too, before regular court hours. 3.9: People’s Courts and Women’s Courts Community-based dispute resolution has been experimented with in several States, as opposed to dispute resolution through panchayats. Saalishi or People’s Courts have been established in West Bengal. These have been used by agricultural labourers, marginal and small peasants, rural workers and women. However, it is also common for members of the panchayat to be part of the adjudicatory panel, which strictly speaking, arrives at a decision based on consensus, rather than delivering justice or a judgement. As such, they can be interpreted as conciliation or mediation. In States like Gujarat and Jharkhand, Women’s Courts (nari adalats) have been organised with the same objective in mind. They not only handle minor issues, but also cases involving rape, molestation, divorce and domestic violence. The Mahila Samakhya programme also helps in setting up nari adalats in instances of violence against women. 30 Such as, the offence against the accused should carry a maximum sentence of less than 7 years; the offence
should not have been committed by the accused against a woman or a child below the age of 14 years; the accused should not have been covered under Section 2(k) of the Juvenile Justice (Care and Protection of Children) Act, 2000; the accused should not have earlier been convicted for the same offence; and the offence should not affect the socio-economic condition of the country.
29
3.10: Other ADR mechanisms Alternative dispute resolution (ADR) can be interpreted as a demand-side measure, through conciliation, mediation and arbitration, to reduce the demand for adjudication through the formal court system. Section 89 of the Code of Civil Procedure was amended in 2000 to make attempts at conciliation and mediation mandatory, though there are costs involved, such as those on infrastructure for such centres. In a recent case, the Supreme Court has suggested that costs of conciliation and mediation should be borne by the government, so as to make ADR more attractive.31 There were problems with the Arbitration Act of 1940, since it never made an arbitral award final and was only a preliminary step towards adjudication. The Arbitration and Conciliation Act of 1996 has introduced greater finality to such awards. Where is there not greater resort to ADR? An obvious answer is the lack of credible and trained conciliators, mediators and arbitrators. But the Salem Advocates case may also prove to be a watershed, because it made a reference to mediation, conciliation and arbitration mandatory. Section 89 of the Code of Civil Procedure was not that clear. Section 4: The Use of Information and Communication Technology (ICT) Section 3 listed some recent attempts at reform, some ad hoc, others less so. In this section, we catalogue reform initiatives based on ICT. Such ICT tools can have several elements – video conferencing, publishing, word processing, storage management, regional languages, inter-communications, fingerprint recognition, internet and e-mail, encryption and recognition of digital signatures, voice recognition and recording, imaging and scanning, web-enabled technology, bar code technology, document management and database management. Ad hoc computerisation within the judiciary can be date to 1990. A more systematic attempt dates to the constitution of the E-Committee in January 2005, under the Chairmanship of Justice G.C. Bharuka. This led to a National Policy and Action Plan for Information and Communication Technology Enablement of the Indian Judiciary, approved in August 2005.32 The National Policy contemplates ICT implementation in three phases over a period of five years and, in June 2006, this was declared as one of the mission mode projects under the National E-Governance Plan. In February 2007, a budget of Rs 442 crores was sanctioned for the first phase.33 Table 11 shows the breakup of this budget.34
31 Salem Advocates Bar Association Case, Salem Advocates Bar Association, Tamil Nadu v. Union of India,
AIR 2002 SC 2096. 32 Bharuka G.C., Chairman, E-Committee, “Implementation of Information and Communication Technology
in Indian Judiciary”, from http://bharuka.com/E_Committee.htm. 33 1 crore is 10 million. These figures have deliberately been left in crores. 34 E-Committee and Information Technology in Supreme Court, http://www.supremecourtofindia.
nic.in/IT_SCI.htm.
30
Table 11: Phase I of the ICT Project
S.No Item Cost Rs. (in crores)
1 Creation of computer room at all the court complexes 36 2 Provision of laptops to judicial officers and judges 40 3 (a) ICT training for judges and court staff 12
5 (b) Technical manpower for 2 years 31 4 Computer Hardware (servers, clients, printers, scanners, projectors etc.) 123.71 5 System software, office tools etc. 13.2 6 Digital Signature 1.3 7 Smart Card Solutions 1.8 8 Communication & connectivity including LAN 50 9 Power backup (UPS, DG sets, Solar Power sets) 40
10 Development of Application Software 3 11 Upgrading ICT infrastructure of Supreme Court & High Courts. 43.8 12 Creation & Up-gradation of centralised facility for system administration. 6 13 Video Conferencing in approximately 500 locations 20 14 Wi-Fi facility in Supreme Court & High Courts 1.5 15 Process reengineering 2 16 Project Management consultancy, Monitoring & Change Management. 16.5
Total 441.8 Phase I of the three-phase project will extend over 2 years and incorporates the following:
Creation of computer rooms and Judicial Service Centers in all 2,500 court complexes;
Establishment of digital inter-connectivity between all Courts from the taluka level to the Apex Court;
State-of-the-art video-conferencing facilities in Supreme Court, High Courts and all District Courts;
Wi-Fi facilities in Supreme Court and High Courts; Around 15,000 judicial officers will be provided with laptops; Extensive ICT training to judicial officers and court staff; Arrangement of awareness programs and training modules for lawyers; Creation of well-structured databases, with user-friendly retrievable facilities; Digital archiving of Supreme Court and High Courts; Creation of e-filing facility in Supreme Court and High Courts; Upgradation of ICT infrastructure in Supreme Court and High Courts; Extensive process re-engineering and change management exercises; Development of comprehensive and integrated customised software applications
for the entire judicial system, with regional language support.
Other than capacity-building, especially for subordinate court judges, one positive externality will be a National Judicial Data Centre that can provide litigation trends. ICT modules will be available for assessing work performance and will facilitate case-flow management and on-line accessibility of orders, judgements and case-related data. Case status, judgements and orders will be instantly available through the Net, kiosks and judicial service centres. Lawyers, in and around court, will have wireless connectivity and there will
31
be facilities for e-filing in the Supreme Courts and High Courts. Under-trial prisoners can be digitally produced and examined through video-conferencing.35
Phase II will have a duration of 2 years and will extend ICT coverage of judicial processes from filing to execution, including administrative activities, through the following:
Complete automation of registry level processes; Digitisation of law libraries and court archives; Digital availability of case laws, statute laws and law literature through the Indian
Judiciary website; Availability of video conferencing facilities in all court complexes; Facilities for e-filing in all district and subordinate courts.
This will extend the coverage of the processes mentioned earlier, from the Supreme Court and High Courts to District and Subordinate Courts. Delays, discretion and corruption at these lower levels will accordingly be minimised.
Phase III will be for 1 year and will create information gateways between courts and public agencies and departments, such as police stations, prisons, land record and registration offices. Biometry will also be introduced in the third phase.
The National E-Courts project for computerisation of courts was formally launched on 9th July 2007. The Supreme Court’s daily orders, case status and cause lists are now available on the Net. The Supreme Court’s website is fairly useful and also provides information on the Supreme Court rules, in addition to provisions for e-filing. However, the quality of information available for High Courts is extremely variable. If ICT usage takes off, on-line dispute resolution may also become possible.
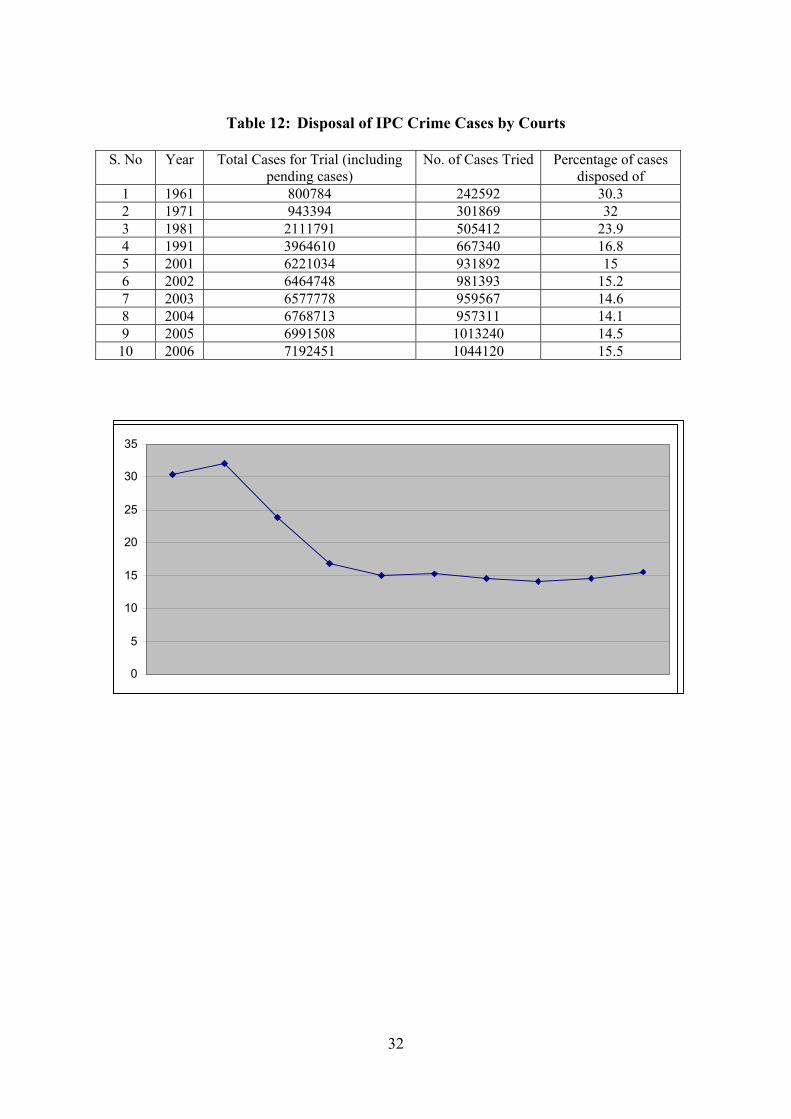
Section 5: Reforms in the Criminal Justice System We now turn to a relative neglected area of justice reform, that of criminal justice. In some ways, the right to a speedy trial is even more important in a criminal case than a civil one, since there are restraints imposed by arrest and consequent incarceration. Table 12 shows the trend in disposal of Indian Penal Code (IPC) crime cases.36 As is obvious from both the table and the accompanying graph, the percentage of cases tried and disposed of has been declining. Between 1991 and 2006, the percentage of cases tried and disposed of has been around 15-16 percent. The percentage used to be much higher in 1961 and an increase in the number of cases is only part of the answer. Tables 1337 and 1438 provide further details of IPC crime-related cases.
35 The Information Technology Act of 2000 recognizes electronic forms of documents and digital signatures.
In a recent case, State of Maharashtra v. Dr. Praful B. Desai, (2003) 4 SCC 601, the Supreme Court has held that video-conferencing is acceptable for recording evidence. This is in line with other Supreme Court decisions, Grid Corpn. Of Orissa Ltd. v. AES Corpn., 2002 A.I.R. (S.C.) 3435, or Basavaraj R. Patil v. State of Karnataka, (2000) 8 SCC 740. In the latter case, the court ruled that an accused need not physically be present in court.
36 Crime in India - 2006, National Crime Records Bureau, Ministry of Home Affairs, Chapter 4, p.4. 37 Crime in India - 2006, National Crime Records Bureau, Ministry of Home Affairs, Table 4.9. 38 Crime in India - 2006, National Crime Records Bureau, Ministry of Home Affairs, Table 4.11.
32
Table 12: Disposal of IPC Crime Cases by Courts
S. No Year Total Cases for Trial (including
pending cases) No. of Cases Tried Percentage of cases
At the end of 2006, 83.4 percent of IPC cases were pending for trial. The highest pendency was for criminal breach of trust (91 percent), cheating (89.6 percent), robbery (88.8 percent), burglary (87.8 percent), theft and importation of girls (87.7 percent each). The best disposal rates were recorded for sexual harassment, rape, dowry deaths, hurt, culpable homicide not amounting to murder and attempt to commit murder.
34
Table 14: Percentage of IPC Crime Cases Disposed, 2006, by head S. No Crime Head percent of Cases
Compounded or Withdrawn
percent of Cases disposed
of
percent of cases pending trial at the end
of the year 1 Murder 0.1 15.8 84.1 2 Attempt to Commit
21 Importation of Girls 0 12.3 87.7 22 Causing death by
Negligence 0.8 15.3 84
23 Other IPC Crimes 2.4 16.4 81.3 24 TOTAL 2.1 14.5 83.4
These tables do not bring out the region-wise spread and that is shown in Table 15.39
The highest pendency was reported by Andaman and Nicobar Islands (95.2 percent), followed by Arunachal Pradesh (94.2 percent), Maharashtra (93.8 percent), Gujarat, Manipur and Meghalaya (92.3 percent each). The States with the lowest pendency were Mizoram (32.4 percent), Tamil Nadu (57.5 percent), Pondicherry (59.5 percent), Nagaland (68.1 percent) and Karnataka (68.5 percent). However, it needs to be reiterated that these are only IPC crime figures.
39 Crime in India - 2006, National Crime Records Bureau, Ministry of Home Affairs, Table 4.10.
35
Table 15: Region-wise Disposal of IPC Cases, 2006 S. No State/Union
Territory Total Cases for Trial (including pending cases)
40 Crime in India - 2006, National Crime Records Bureau, Ministry of Home Affairs, Table 4.13.
37
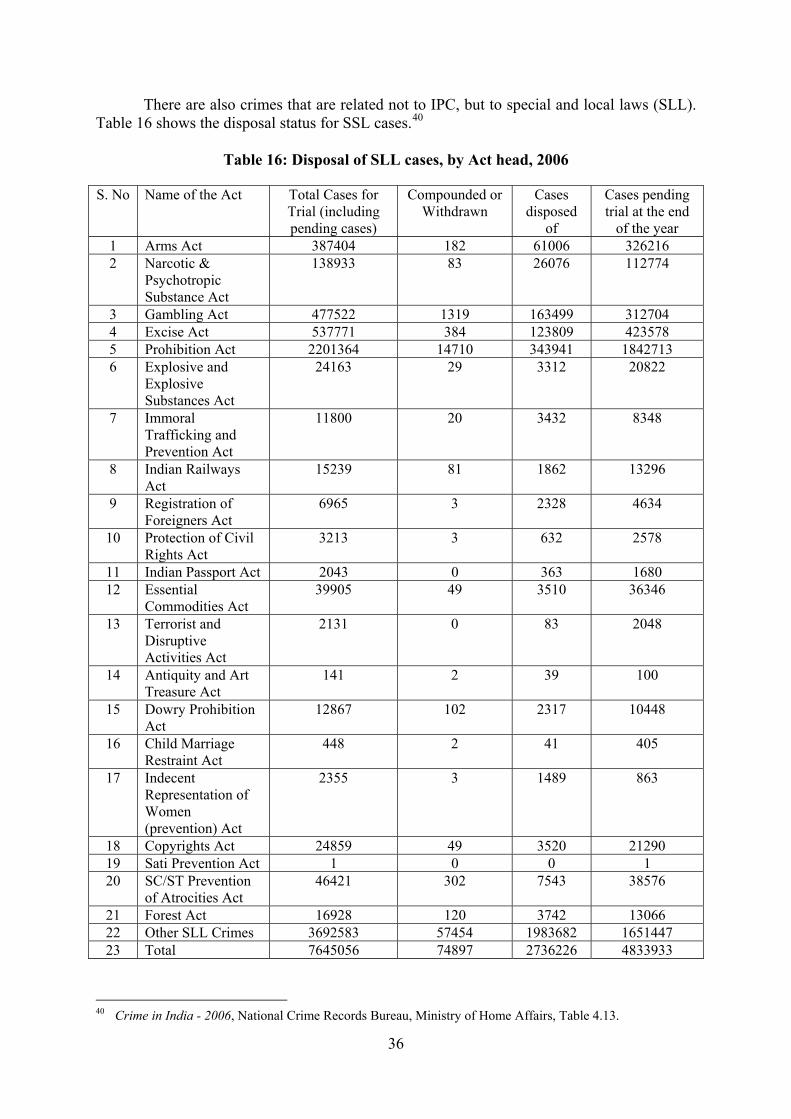
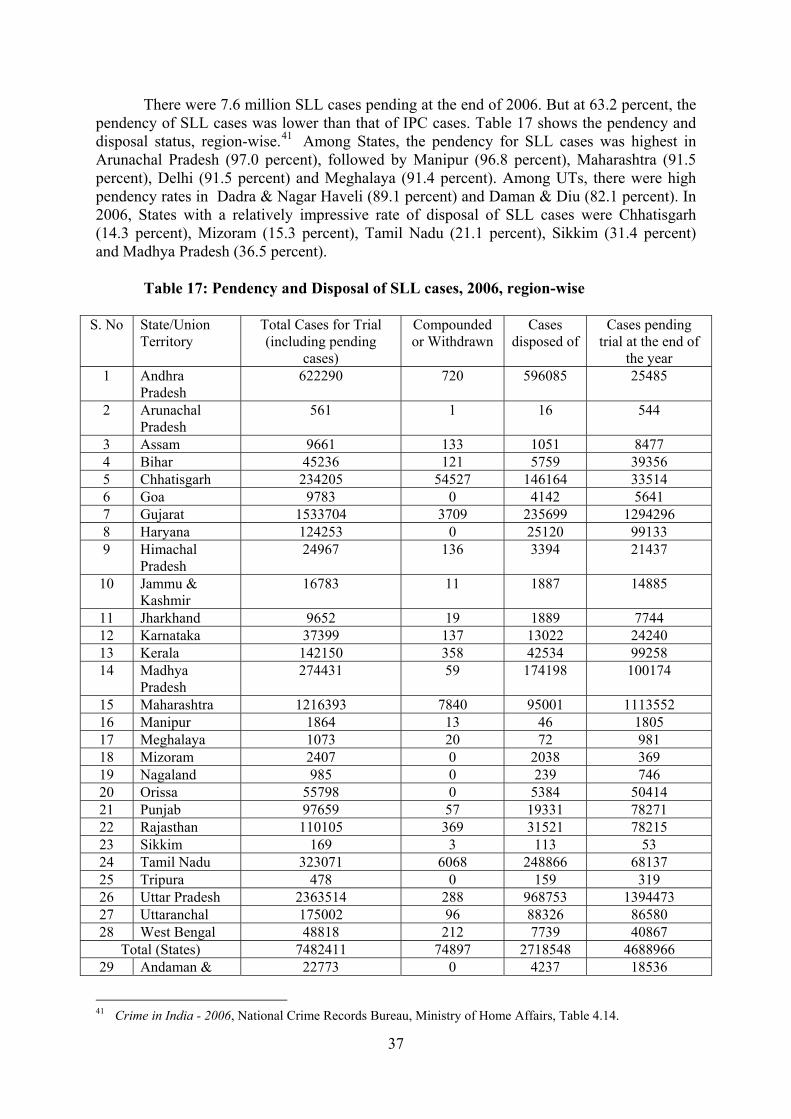
There were 7.6 million SLL cases pending at the end of 2006. But at 63.2 percent, the pendency of SLL cases was lower than that of IPC cases. Table 17 shows the pendency and disposal status, region-wise.41 Among States, the pendency for SLL cases was highest in Arunachal Pradesh (97.0 percent), followed by Manipur (96.8 percent), Maharashtra (91.5 percent), Delhi (91.5 percent) and Meghalaya (91.4 percent). Among UTs, there were high pendency rates in Dadra & Nagar Haveli (89.1 percent) and Daman & Diu (82.1 percent). In 2006, States with a relatively impressive rate of disposal of SLL cases were Chhatisgarh (14.3 percent), Mizoram (15.3 percent), Tamil Nadu (21.1 percent), Sikkim (31.4 percent) and Madhya Pradesh (36.5 percent). Table 17: Pendency and Disposal of SLL cases, 2006, region-wise
Total (UTs) 162645 0 17678 144967 Total (All India) 7645056 74897 2736226 4833933
Information is also available on the time taken to dispose of criminal cases, both IPC and SLL. This includes cases heard by District/Sessions Judges, Additional Sessions Judges, Chief Judicial Magistrates, Special Judicial Magistrates, Judicial Magistrates (I), Judicial Magistrates (II) and other courts.42 These figures are given in Table 18. 35,870 trials (3.4 percent) out of 10,44,120 completed trials, were completed after 10 years. 11.3 percent took between 5 to 10 years, 22.6 percent between 3 to 5 years, 31.9 percent between 1 to 3 years, 18.2 percent between 6 months to a year and 12.5 percent were completed within 6 months. The modal value was between 1 to 3 years, followed by 3-5 years. This mode is lower than what one would assume a priori, suggesting that it is some outliers that cause delays in delivering criminal justice. The data are of course only for completed trials.
Total (UTs) 6844 8101 9484 5169 4545 1268 35411 Total (All India) 130922 189817 333110 236423 117978 35870 1044120
As has been mentioned earlier, criminal cases remain the bane of the Indian judicial
system. This is despite statutory provisions that permit speedy trial of criminal cases. For instance, Section 309 of the Code of Criminal Procedure gives considerable powers to courts. In a succession of judgements, the Supreme Court has reaffirmed the importance of speedy trials, interpreting it as a right enshrined in Article 21 (right to life).43 This is not to deny that the accused is often responsible for delaying the proceedings, since the onus of proving the guilt vests on the prosecution. It is not always practical to prescribe a time limit across all criminal cases. However, it is somewhat bizarre if there are under-trials in prison who have been awaiting trial for more than the maximum stipulated sentences for petty crimes. “It is a matter of common experience that in many cases where the persons are accused of minor offences punishable not more than three years - or even less - with or without fine, the proceedings are kept pending for years together. If they are poor and helpless, they languish in jails for long periods either because there is no one to bail them out or because there is no one, to think of them. The very pendency of criminal proceedings for long periods by itself operates as an engine of oppression. Quite often, the private complainants institute these proceedings out of oblique motives. Even in case of offences punishable for seven years of less - with or without fine - the prosecutions are kept pending for years and years together in criminal courts. In a majority of these cases, whether instituted by police or private complainants, the accused belong to poorer sections of the society, who are unable to afford competent legal advice. Instances have also come before courts where the accused, who are in jail, are not brought to the court on every date of hearing and for that reason also the cases undergo several adjournments.”44 In this instance, the Supreme Court also provided some directions for the speedy disposal of cases.
Several committees and commissions have examined the issue of speedy disposal of
criminal cases, some of which have been mentioned earlier, such as the Rankin Committee (1924), the High Court Arrears Committee (1949), the Shah Committee (1969), the Trevor
43 Abdul Rehman Antulay v. R.S. Nayak, (1992), 1 SCC 25. 44 Common Cause, a Registered Society through its Director v. Union of India 1995 (6) SCALE 45.
40
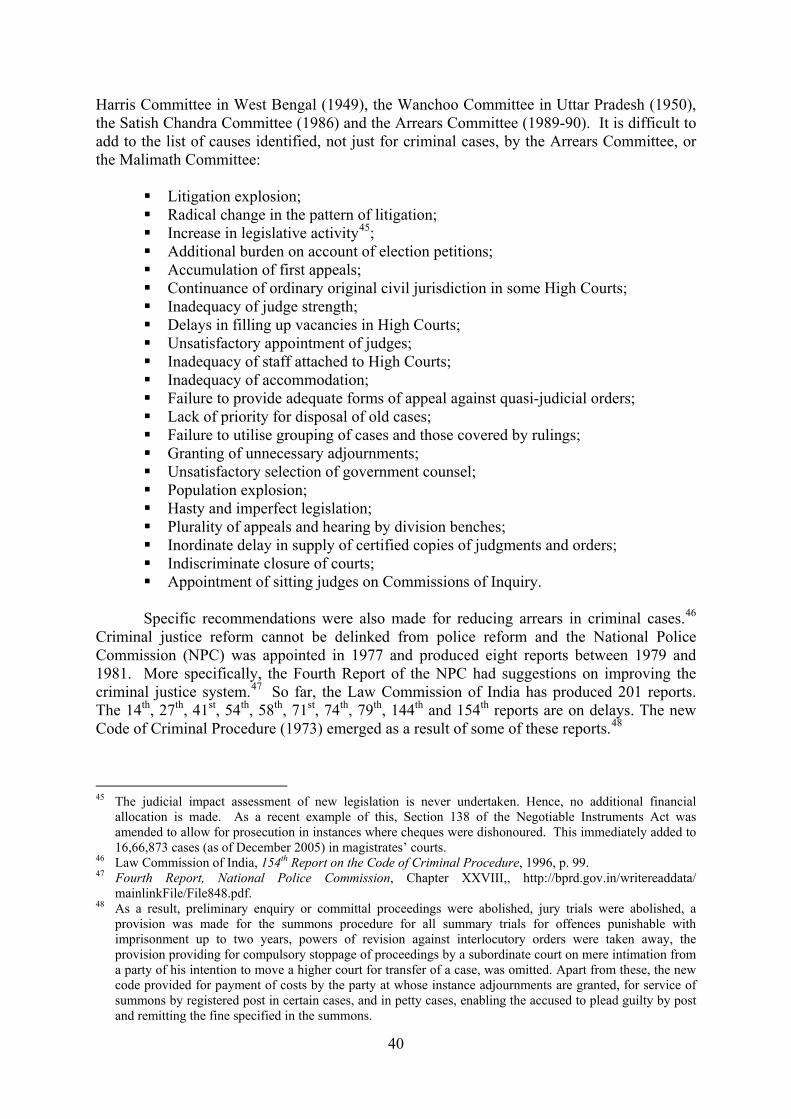
Harris Committee in West Bengal (1949), the Wanchoo Committee in Uttar Pradesh (1950), the Satish Chandra Committee (1986) and the Arrears Committee (1989-90). It is difficult to add to the list of causes identified, not just for criminal cases, by the Arrears Committee, or the Malimath Committee:
Litigation explosion; Radical change in the pattern of litigation; Increase in legislative activity45; Additional burden on account of election petitions; Accumulation of first appeals; Continuance of ordinary original civil jurisdiction in some High Courts; Inadequacy of judge strength; Delays in filling up vacancies in High Courts; Unsatisfactory appointment of judges; Inadequacy of staff attached to High Courts; Inadequacy of accommodation; Failure to provide adequate forms of appeal against quasi-judicial orders; Lack of priority for disposal of old cases; Failure to utilise grouping of cases and those covered by rulings; Granting of unnecessary adjournments; Unsatisfactory selection of government counsel; Population explosion; Hasty and imperfect legislation; Plurality of appeals and hearing by division benches; Inordinate delay in supply of certified copies of judgments and orders; Indiscriminate closure of courts; Appointment of sitting judges on Commissions of Inquiry.
Specific recommendations were also made for reducing arrears in criminal cases.46
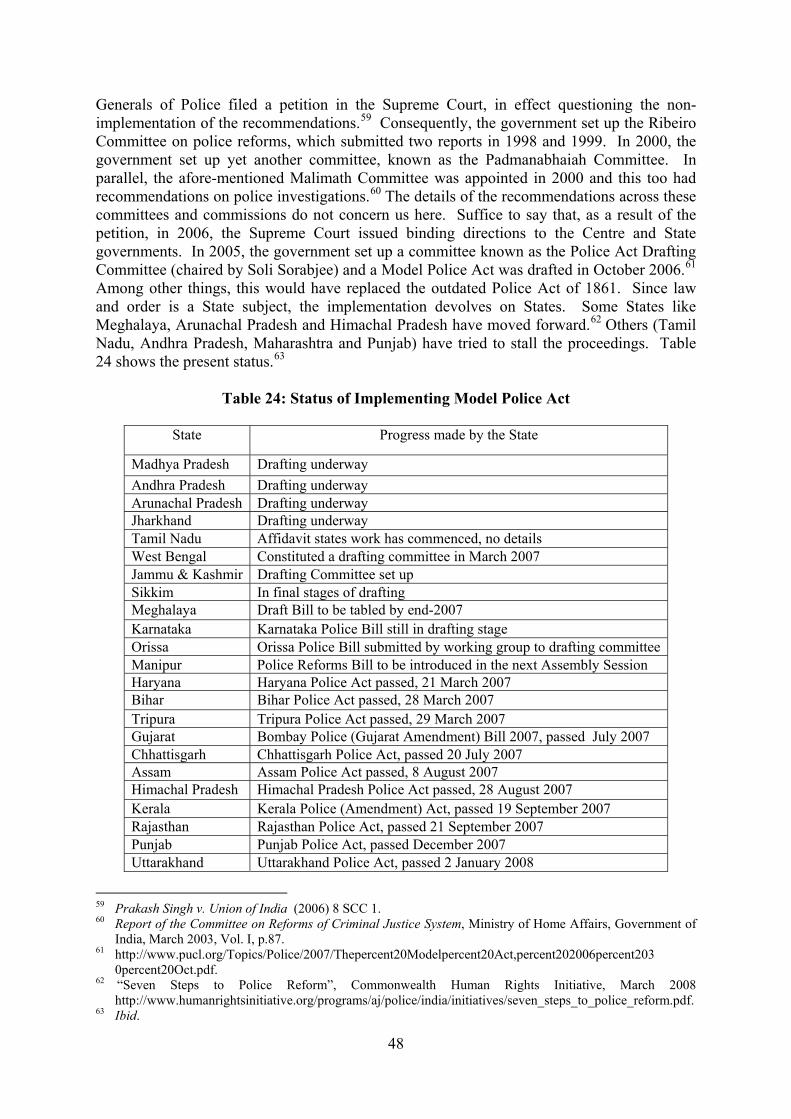
Criminal justice reform cannot be delinked from police reform and the National Police Commission (NPC) was appointed in 1977 and produced eight reports between 1979 and 1981. More specifically, the Fourth Report of the NPC had suggestions on improving the criminal justice system.47 So far, the Law Commission of India has produced 201 reports. The 14th, 27th, 41st, 54th, 58th, 71st, 74th, 79th, 144th and 154th reports are on delays. The new Code of Criminal Procedure (1973) emerged as a result of some of these reports.48
45 The judicial impact assessment of new legislation is never undertaken. Hence, no additional financial
allocation is made. As a recent example of this, Section 138 of the Negotiable Instruments Act was amended to allow for prosecution in instances where cheques were dishonoured. This immediately added to 16,66,873 cases (as of December 2005) in magistrates’ courts.
46 Law Commission of India, 154th Report on the Code of Criminal Procedure, 1996, p. 99. 47 Fourth Report, National Police Commission, Chapter XXVIII,, http://bprd.gov.in/writereaddata/
mainlinkFile/File848.pdf. 48 As a result, preliminary enquiry or committal proceedings were abolished, jury trials were abolished, a
provision was made for the summons procedure for all summary trials for offences punishable with imprisonment up to two years, powers of revision against interlocutory orders were taken away, the provision providing for compulsory stoppage of proceedings by a subordinate court on mere intimation from a party of his intention to move a higher court for transfer of a case, was omitted. Apart from these, the new code provided for payment of costs by the party at whose instance adjournments are granted, for service of summons by registered post in certain cases, and in petty cases, enabling the accused to plead guilty by post and remitting the fine specified in the summons.
41
Since then, the 154th Report of the Law Commission was produced in 1996 and specifically addressed the Code of Criminal Procedure. The nitty-gritty of the details need not be recapitulated. In 2000, a Malimath Committee (Committee on Reforms of the Criminal Justice System) was set up. This was given the task of reviewing the fundamental principles of the criminal justice system, including the Constitution, the Indian Penal Code, the Code of Criminal Procedure and the Indian Evidence Act. A comprehensive report was submitted in March 200349, including proposals about an increase in the number of offences that could be considered for compounding. More interestingly, there was an “Arrears Eradication Scheme”. 50 Some, but not all, of the recommendations of this Malimath Committee were incorporated in a Bill to amend the Code of Criminal Procedure, introduced in Rajya Sabha in August 2006 and since referred to the Parliamentary Standing Committee on Home Affairs. Section 6: Police Reforms The police are a key element in ensuring criminal justice reform, since investigations are a police subject. Investigations, under norms stipulated by the Code of Criminal Procedure, lead to a final report that can either lead to a no-offence situation or a charge-sheet. As mentioned earlier, crimes can be IPC or SLL. Table 19 shows the police record in IPC cases.51 As the table shows, reinforced by the graph, the percentage of cases where the police have completed investigations has declined temporally and consistently. Table 2052 reinforces the picture by providing a breakdown of cases for 2006, status-wise and offence-wise. Including pending cases, there were 2.45 million cases for investigation. Investigations were refused in 0.14 percent of cases and 73.8 percent were investigated. 26.03 percent remained pending.
Table 19: IPC case track record
S. No Year Total cases for investigation (including
49 Criminal Justice Reform in India: ICJ Position Paper Review of the Recommendations made by the Justice
Malimath Committee from an international human rights perspective, http://www.icj.org/ IMG/pdf/India_crim_justice_reform.pdf.
50 Report of the Committee on Reforms of Criminal Justice System, Ministry of Home Affairs, Government of India, March 2003, Vol. I, p.164-66.
51 Crime in India - 2006, National Crime Records Bureau, Ministry of Home Affairs, Chapter 4, p.1. 52 Crime in India – 2006, National Crime Records Bureau, Ministry of Home Affairs, Table 4.1.
42
Table 20: Disposal of IPC cases, 2006 S. No Crime Head Total Cases for
The regional variations are brought out in Table 21.53 States with a high percentage of cases pending for investigation are Manipur (76.1 percent), Meghalaya (66.7 percent), Sikkim (58.7 percent), Assam (55.5 percent), Nagaland (54.9 percent) and Bihar (49.3 percent), with high percentages among Union Territories like Lakshadweep (71.9 percent) and Daman and Diu (54.9 percent). States with low rates were Chhatisgarh (7.6 percent), Madhya Pradesh (3.8 percent), Uttar Pradesh (9.3 percent) and Rajasthan (2.9 percent).
Total (UTs) 116862 196 64498 52038 Total (All India) 2447063 3458 1806174 637014
Tables 20 and 21 are for IPC crimes. Table 22 shows the disposal of SLL cases in 2006.54 The percentage of cases pending investigation was 6.3 percent and the investigation record was better for SLL crimes than for IPC crimes. The pendency is high for statutes like the Antiquity and Art Treasure Act (57.6 percent), the Indian Passport Act (56.3 percent), TADA cases and the Dowry Prohibition Act (43.6 percent each). Two fundamental questions arise about SLL cases in the context of broader criminal justice reform. First, given the thrust of economic liberalisation, do some SLL statutes continue to be relevant? The Excise At, the Essential Commodities Act and the Prohibition Act are cases in point. Second, to the extent that several SLL statutes concern economic crimes, should there be a segregation of such crimes into major and minor ones, with the latter leading to monetary penalties alone (where the costs are borne by the convicted), instead of imprisonment (where the costs are collectively borne by society)?
54 Crime in India - 2006, National Crime Records Bureau, Ministry of Home42 Affairs, Table 4.5.
45
Table 22: Disposal of SLL Cases, 2006
S. No Name of the Act Total Cases for Investigation
Table 23 shows a region-wise distribution of disposal of SLL cases during 2006.55 86.5 percent of cases were pending investigation in Manipur, followed by Meghalaya (68.5 percent), Assam (58 percent), Arunachal Pradesh (57.7 percent) and Bihar (57.2 percent). States and Union Territories which had appreciable police disposal percentages for SLL cases were Chhatisgarh, Dadra & Nagar Haveli and Daman & Diu (100 percent each), Andhra Pradesh, Madhya Pradesh and Uttaranchal (99.9 percent each), Andaman & Nicobar Islands (99.8 percent), Gujarat, Mizoram and Delhi (99.7 percent each), Uttar Pradesh (99.5 percent), Rajasthan (99.4 percent), Orissa , Sikkim and Pondicherry (99.3 percent each), Goa and Chandigarh (99 percent each).
Total (UTs) 55245 11 36035 19197 Total (All India) 3439063 54640 3167268 212390
Proposals for police reforms began surfacing when the government of United Provinces (Uttar Pradesh after Independence) appointed a Police Reorganisation Committee on 23 January 1947. Even then, there were recommendations on corruption, misuse of authority, brutality, non-registration of First Information Report, poor investigation and fabrication of evidence. However, a serious discourse on police reform began in the 1960s, when several States appointed Police Commissions – Bihar (set up in 1958, report in 1961), Uttar Pradesh (set up in 1960, report in 1961),56 West Bengal (set up in 1960, report in 1961), Punjab (set up in 1961, report in 1962), Maharashtra (set up in 1962, report in 1964), Delhi (set up in 1966, report in 1968), Assam (set up in 1969) and Tamil Nadu (set up in 1969, report in 1971). While the terms of reference varied across States, they all focused on the need to examine the adequacy of strength, equipment and other resources of the police; recruitment, training and disciplinary standards; the working of rural police; separation of investigation and law and order functions; powers and duties of the police; maintenance of records; morale and efficiency; corruption and measures to deal with it; and police community relations.57
A Gore Committee on police training was set up in 1971.58 Subsequently, the NPC was appointed in 1977 and eight reports were produced between 1979 and 1981. To this can be added initiatives emanating from the National Human Rights Commission. The report of the Vohra Committee was submitted in 1993. However, the history of police reform remained one of non-implementation of recommendations. In 1996, two former Director 56 A second commission was set up by the UP government in 1970, with a report in 1971. 57 http://www.humanrightsinitiative.org/programs/aj/police/india/initiatives/state_police_commissions.h tm. 58 http://bprd.nic.in/writereaddata/mainlinkfile/File692.pdf.
48
Generals of Police filed a petition in the Supreme Court, in effect questioning the non-implementation of the recommendations.59 Consequently, the government set up the Ribeiro Committee on police reforms, which submitted two reports in 1998 and 1999. In 2000, the government set up yet another committee, known as the Padmanabhaiah Committee. In parallel, the afore-mentioned Malimath Committee was appointed in 2000 and this too had recommendations on police investigations.60 The details of the recommendations across these committees and commissions do not concern us here. Suffice to say that, as a result of the petition, in 2006, the Supreme Court issued binding directions to the Centre and State governments. In 2005, the government set up a committee known as the Police Act Drafting Committee (chaired by Soli Sorabjee) and a Model Police Act was drafted in October 2006.61 Among other things, this would have replaced the outdated Police Act of 1861. Since law and order is a State subject, the implementation devolves on States. Some States like Meghalaya, Arunachal Pradesh and Himachal Pradesh have moved forward.62 Others (Tamil Nadu, Andhra Pradesh, Maharashtra and Punjab) have tried to stall the proceedings. Table 24 shows the present status.63
Table 24: Status of Implementing Model Police Act
State Progress made by the State
Madhya Pradesh Drafting underway Andhra Pradesh Drafting underway Arunachal Pradesh Drafting underway Jharkhand Drafting underway Tamil Nadu Affidavit states work has commenced, no details West Bengal Constituted a drafting committee in March 2007 Jammu & Kashmir Drafting Committee set up Sikkim In final stages of drafting Meghalaya Draft Bill to be tabled by end-2007 Karnataka Karnataka Police Bill still in drafting stage Orissa Orissa Police Bill submitted by working group to drafting committeeManipur Police Reforms Bill to be introduced in the next Assembly Session Haryana Haryana Police Act passed, 21 March 2007 Bihar Bihar Police Act passed, 28 March 2007 Tripura Tripura Police Act passed, 29 March 2007 Gujarat Bombay Police (Gujarat Amendment) Bill 2007, passed July 2007 Chhattisgarh Chhattisgarh Police Act, passed 20 July 2007 Assam Assam Police Act passed, 8 August 2007 Himachal Pradesh Himachal Pradesh Police Act passed, 28 August 2007 Kerala Kerala Police (Amendment) Act, passed 19 September 2007 Rajasthan Rajasthan Police Act, passed 21 September 2007 Punjab Punjab Police Act, passed December 2007 Uttarakhand Uttarakhand Police Act, passed 2 January 2008
59 Prakash Singh v. Union of India (2006) 8 SCC 1. 60 Report of the Committee on Reforms of Criminal Justice System, Ministry of Home Affairs, Government of
India, March 2003, Vol. I, p.87. 61 http://www.pucl.org/Topics/Police/2007/Thepercent20Modelpercent20Act,percent202006percent203
0percent20Oct.pdf. 62 “Seven Steps to Police Reform”, Commonwealth Human Rights Initiative, March 2008
Section 7: In Conclusion – Where do we go from here?
That the present state of dispute resolution is unsatisfactory is obvious and Sections 2 through 6 have reinforced this proposition. There are some generic solutions that one should mention first. First, there is the natural conclusion that the number of judges and courts needs to be increased. At a Chief Justices’ conference in 2004, a committee was constituted to get a fix on the recommended judge/case ratio64 and a figure of 500 to 600 was suggested for district and subordinate courts.65 Working with the pendency figures, this translates into an additional 35,000 courts or so, depending on how one derives the number. As mentioned earlier, the total number of courts right now is 12,148. Alternatively, one can work with the judge/population ratio. In its 120th report (1987), the Law Commission stated that the number of judges per million population should increase from 10.5 to 50.66 These targets were repeated by the Supreme Court.67 That figure of 10.5 is often quoted, but is somewhat suspect. On 31st December 2007, the sanctioned strength in district and subordinate courts was 15,917. Because of a large number of vacancies (with large numbers in UP, Andhra, Maharashtra, West Bengal and A& N Islands, Gujarat, Karnataka, MP, Bihar and Uttarakhand), the working strength was only 12,549. However, even if one works with the sanctioned strength, the judge/million population ratio is a shade lower than 7, not 10.5. If the 50 target is accepted, this works out to an additional 98,000 judges. On 22nd April 2008, the High Courts had a sanctioned strength of 876 judges and a working strength of 594. Vacancies were concentrated in Allahabad (with a very high number of 92), Bombay and Punjab & Haryana. In similar vein, one requires additional High Court judges. One might argue that the judge load can be higher than 500 to 600 and fewer courts and judges will suffice. However, a judge load of more than 3000 is unlikely to be realistic. Working with working strengths rather than sanctioned strengths, the point is that every High Court except Delhi, Karnataka, Gujarat and Sikkim has a judge load higher than 3000. Orissa has a staggering figure of 13,568 and Madhya Pradesh, Allahabad and Chattisgarh also have numbers more than 9000. For lower courts, the number is more than 3000 in Gujarat, Calcutta and Allahabad. The upshot is that even if one does not require 98,000 judges, one probably requires around 50,000. Per new judge/court that amounts to fixed investments of Rs 2 crore and running expenses of Rs 1 crore a year.68 Hence, there is a colossal figure of Rs 150,000 crores, with annual recurrent expenditure of Rs 50,000 crores.
Second, this raises the issue69 of financial autonomy for the judiciary. The point about planning and budgetary exercises being undertaken without consulting the judiciary is a valid one, though since 1993, the expenditure on judicial administration has become a Plan subject. 70 Since 1993, there has also been a centrally sponsored scheme (CSS) for improvement of infrastructure. Fifty percent of the expenditure is met by the Centre and there has to be a 50 percent matching grant from States. These funds are made available by the Planning Commission. It is a separate matter that many State governments have been 64 “Contemporary Views on Access to Justice in India,” Justice G.C. Bharuka, in Arnab Kumar Hazra and
Bibek Debroy edited, Judicial Reforms in India, Issues and Aspects, Rajiv Gandhi Institute for Contemporary Studies and Academic Foundation, 2007.
65 This is actually not a judge/case ratio, but its inverse. It is the case/judge ratio, or the judge load. 66 The world average is around 64. 67 All India Judges Association v. Union of India, 2002(4)SCC 247. 68 1 crore is Rs 10 million. 69 There is also the matter of infrastructure in courts. 70 Earlier, it used to be classified as non-Plan expenditure. An argument that court fees should be earmarked
for judicial expenditure is not quite acceptable, because that undermines the Constitutional structure of the consolidated fund.
50
reluctant to provide the matching grants. The National Commission set up to review the Constitution also flagged paucity of funds, both through the Planning Commission and the Finance Commission, and recommended planning and budgetary exercises through a national and State-level Judicial Councils. However, accepting that there is a financial problem is one thing. Arguing that there should be complete financial autonomy is another. Without firm evidence that the judiciary has sought to reduce pendency, the argument for financial autonomy will have few takers. For instance, the judicial appointment and promotion process is de facto in the hands of the judiciary. What then explains the high vacancy rates? Alternatively, one can quibble about the precise indicator used to measure judicial productivity, but why is the judiciary reluctant to accept disposal targets? Indeed, this was largely the problem with fast track courts set up through the Eleventh Finance Commission. However, one should also acknowledge that with greater ICT usage, there have been attempts to improve case-flow management.
Third, there are procedural improvements required. While the Code of Civil Procedure was amended in 2001 and 2002, there is still scope for improving orders issued under the code for issues like written statements, costs, examination of parties, framing of issues, evidence on affidavits and ex-parte injunctions. More importantly, these orders grant discretion to judges and there is scope for better use of this discretion. Since two-thirds of the backlog consists of criminal cases, amendments to the Code of Criminal Procedure and the Indian Evidence Act are long overdue. Consequently, there are problems with lack of pre-trial hearings, service of summons, delays in supplying copies to the accused, exempting the accused from personal appearances, delays in framing charges, repeated adjournments, non-availability of witnesses and compounding, not to speak of lack of public prosecutors and problems with the police. But it is necessary to mention that the average conviction rate is not six percent, as is commonly believed to be the case. It is between 80 and 82 percent for SLL laws and around 41 percent for IPC crimes.
Fourth, while the three points made above are generic, there is a case for focusing on certain types of cases. For instance, the government litigation policy for civil cases crowds out citizens from using the court system, though Section 80 of the Code of Civil Procedure allows for out-of-court settlements. That apart, specific focus on the Negotiable Instruments Act, Motor Accidents Claims Tribunal (MACT) cases, petty cases, old cases and cases related to excise is possible.
Fifth, generic improvements require large sums of money. Experiments like Lok Adalats, fast track courts, Family Courts, mobile courts, Nyaya Panchayats, Gram Nyayalayas, People’s Courts and Women’s Courts can accordingly be perceived as driven by the motive of getting a bigger bang for the buck. This has been described as load shedding and a hollowing out of the Indian State.71 That may amount to stating it a bit too strongly. However, there is no getting away from the fundamental constraints with the justice delivery system, with these solutions being no more than add-ons and quick fixes. As mentioned, the Eleventh Finance Commission provided a grant for setting up fast track courts. With the Thirteenth Finance Commission now constituted, States will no doubt submit proposals once again. If one scrutinises proposals received from States for the Eleventh Finance Commission, those covered items like buildings, new courts, record rooms, libraries, lock-ups, computers, furniture, salaries, vehicles, toilets and the like. History is certain to be repeated. But that’s not the purpose of a Finance Commission at all. Such demands should
71 Marc Galanter, Debased Informalism: Lok Adalats and Legal Rights in Modern India, 2002.
51
be routed through State budgets to the Planning Commission. The Finance Commission should do no more than provide add-ons.
To recapitulate from Section 2, the High Court problem is in Allahabad (criminal and civil), Madras (criminal and civil), Bombay (civil), Calcutta (civil), Patna (criminal), Punjab & Haryana (civil), Rajasthan (criminal and civil), Delhi (criminal and civil), Jharkhand (criminal), MP (criminal) and Orissa (civil). The Lower Court problem is in Tamil Nadu (civil and criminal), UP (civil and criminal), Rajasthan (civil and criminal), Punjab (civil), Haryana (civil), Orissa (criminal), West Bengal (criminal), Kerala (civil), Bihar (civil and criminal), Gujarat (civil), Delhi (criminal) and Maharashtra (criminal). To recapitulate from Section 3, the Lok Adalat success has been in Bihar, Gujarat, Haryana, Jammu & Kashmir, Jharkhand, Karnataka, Madhya Pradesh, Maharashtra, Orissa, Punjab, Rajasthan and Uttar Pradesh. The FTC success has been in Andhra Pradesh, Gujarat, Maharashtra, Tamil Nadu and Uttar Pradesh. The Family Court success has been most evident in Kerala, Maharashtra and UP. This raises a very simple point. With or without Finance Commission funds, reforms require a buy-in from States. Clearly, different States have different priorities. Why should there be a Central scheme that is uniform and standard for all States? Why should States not be asked to determine what they would like to focus on? For instance, Bihar might want to build on the Lok Adalat success, while Kerala might want to build on the Family Court success. This is also likely to increase the probability of linking expenditure with tangible improvements in outcome indicators, something that the Eleventh Finance Commission should have done, but failed to accomplish. Even if the quantum of expenditure is not much, funds must trigger and incentivise reforms.