Isle of WightUnitary authority This profile was published on 4th July 2017
Health in summaryThe health of people in Isle of Wight is varied comparedwith the England average. About 21% (4,500) of childrenlive in low income families. Life expectancy for women ishigher than the England average.
Health inequalitiesLife expectancy is 4.8 years lower for men and 3.0 yearslower for women in the most deprived areas of Isle ofWight than in the least deprived areas.
Child healthIn Year 6, 17.6% (215) of children are classified asobese, better than the average for England. The rate ofalcohol-specific hospital stays among those under 18 is63*, worse than the average for England. This represents16 stays per year. Levels of GCSE attainment andsmoking at time of delivery are worse than the Englandaverage.
Adult healthThe rate of alcohol-related harm hospital stays is 472*,better than the average for England. This represents 687stays per year. The rate of self-harm hospital stays is223*, worse than the average for England. Thisrepresents 280 stays per year. The rate of smokingrelated deaths is 268*. This represents 292 deaths peryear. Estimated levels of adult excess weight are worsethan the England average. The rate of people killed andseriously injured on roads is worse than average. Ratesof sexually transmitted infections and TB are better thanaverage. Rates of statutory homelessness and violentcrime are worse than average.
Local prioritiesPriorities in Isle of Wight include the STP & whole systemintegration especially health & social care, communitydevelopment and lifestyle risk factor managementincluding workplace health, sexual health, substancemisuse and children's public health nursing. For moreinformation see www.iwight.com/factsandfigures
This profile gives a picture of people’s health in Isleof Wight. It is designed to help local governmentand health services understand their community’sneeds, so that they can work together to improvepeople’s health and reduce health inequalities.
Visit www.healthprofiles.info for more profiles, moreinformation and interactive maps and tools.
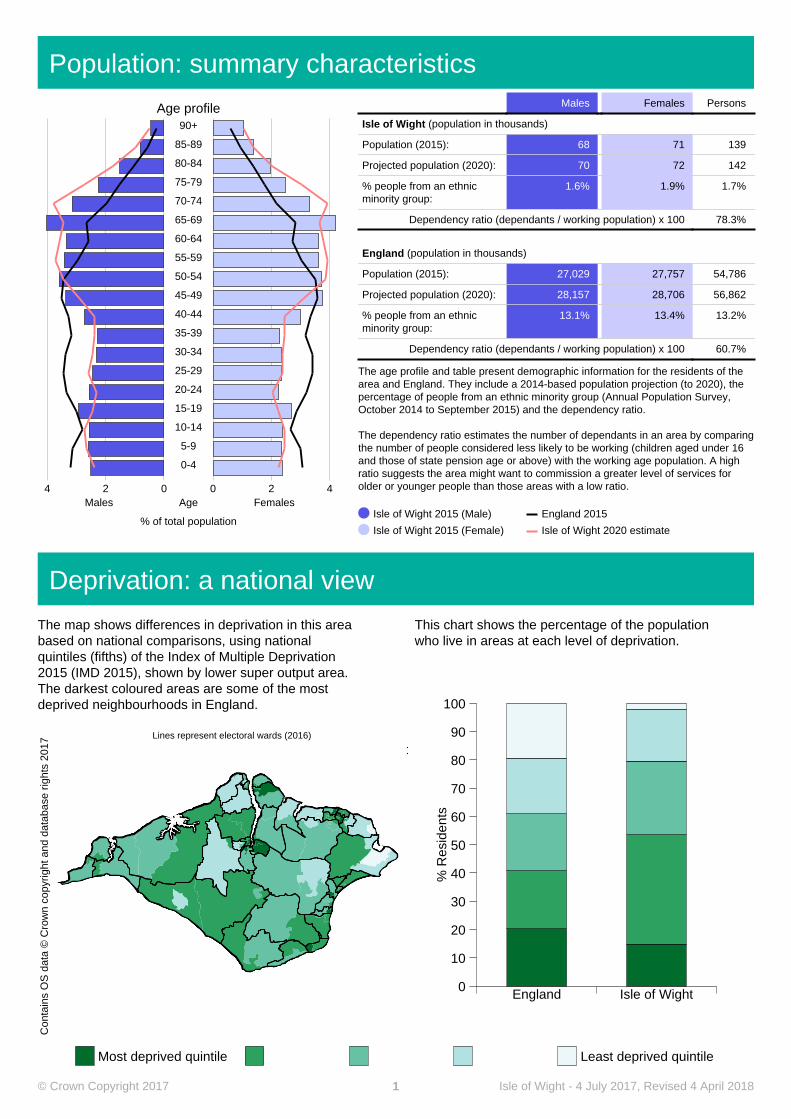
Dependency ratio (dependants / working population) x 100 78.3%
England (population in thousands)
Population (2015): 27,029 27,757 54,786
Projected population (2020): 28,157 28,706 56,862
% people from an ethnicminority group:
13.1% 13.4% 13.2%
Dependency ratio (dependants / working population) x 100 60.7%
The age profile and table present demographic information for the residents of thearea and England. They include a 2014-based population projection (to 2020), thepercentage of people from an ethnic minority group (Annual Population Survey,October 2014 to September 2015) and the dependency ratio.
The dependency ratio estimates the number of dependants in an area by comparingthe number of people considered less likely to be working (children aged under 16and those of state pension age or above) with the working age population. A highratio suggests the area might want to commission a greater level of services forolder or younger people than those areas with a low ratio.
Lines represent electoral wards (2016)
The map shows differences in deprivation in this areabased on national comparisons, using nationalquintiles (fifths) of the Index of Multiple Deprivation2015 (IMD 2015), shown by lower super output area.The darkest coloured areas are some of the mostdeprived neighbourhoods in England.
This chart shows the percentage of the populationwho live in areas at each level of deprivation.
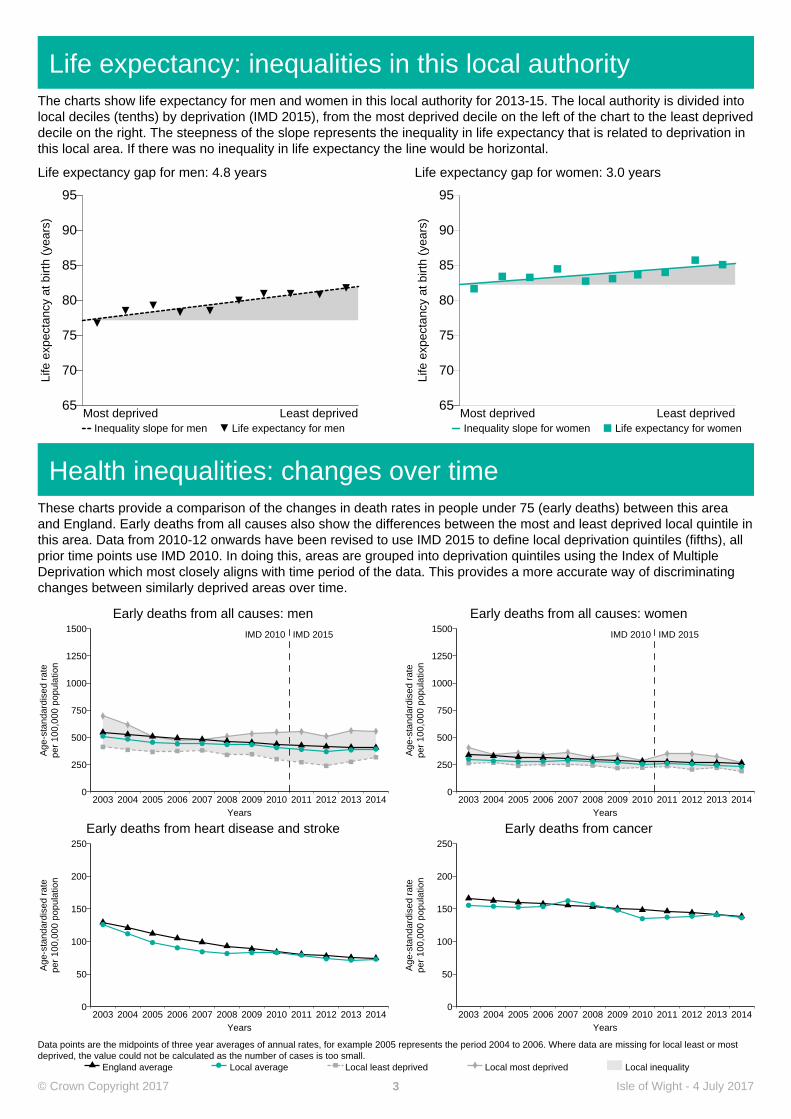
The charts show life expectancy for men and women in this local authority for 2013-15. The local authority is divided intolocal deciles (tenths) by deprivation (IMD 2015), from the most deprived decile on the left of the chart to the least depriveddecile on the right. The steepness of the slope represents the inequality in life expectancy that is related to deprivation inthis local area. If there was no inequality in life expectancy the line would be horizontal.
Life expectancy gap for men: 4.8 years
Life
exp
ecta
ncy
at b
irth
(yea
rs)
65
70
75
80
85
90
95
Most deprived Least deprivedInequality slope for men Life expectancy for men
Life expectancy gap for women: 3.0 years
Life
exp
ecta
ncy
at b
irth
(yea
rs)
65
70
75
80
85
90
95
Most deprived Least deprivedInequality slope for women Life expectancy for women
Life expectancy: inequalities in this local authority
England average Local average Local least deprived Local most deprived Local inequality
Data points are the midpoints of three year averages of annual rates, for example 2005 represents the period 2004 to 2006. Where data are missing for local least or mostdeprived, the value could not be calculated as the number of cases is too small.
These charts provide a comparison of the changes in death rates in people under 75 (early deaths) between this areaand England. Early deaths from all causes also show the differences between the most and least deprived local quintile inthis area. Data from 2010-12 onwards have been revised to use IMD 2015 to define local deprivation quintiles (fifths), allprior time points use IMD 2010. In doing this, areas are grouped into deprivation quintiles using the Index of MultipleDeprivation which most closely aligns with time period of the data. This provides a more accurate way of discriminatingchanges between similarly deprived areas over time.
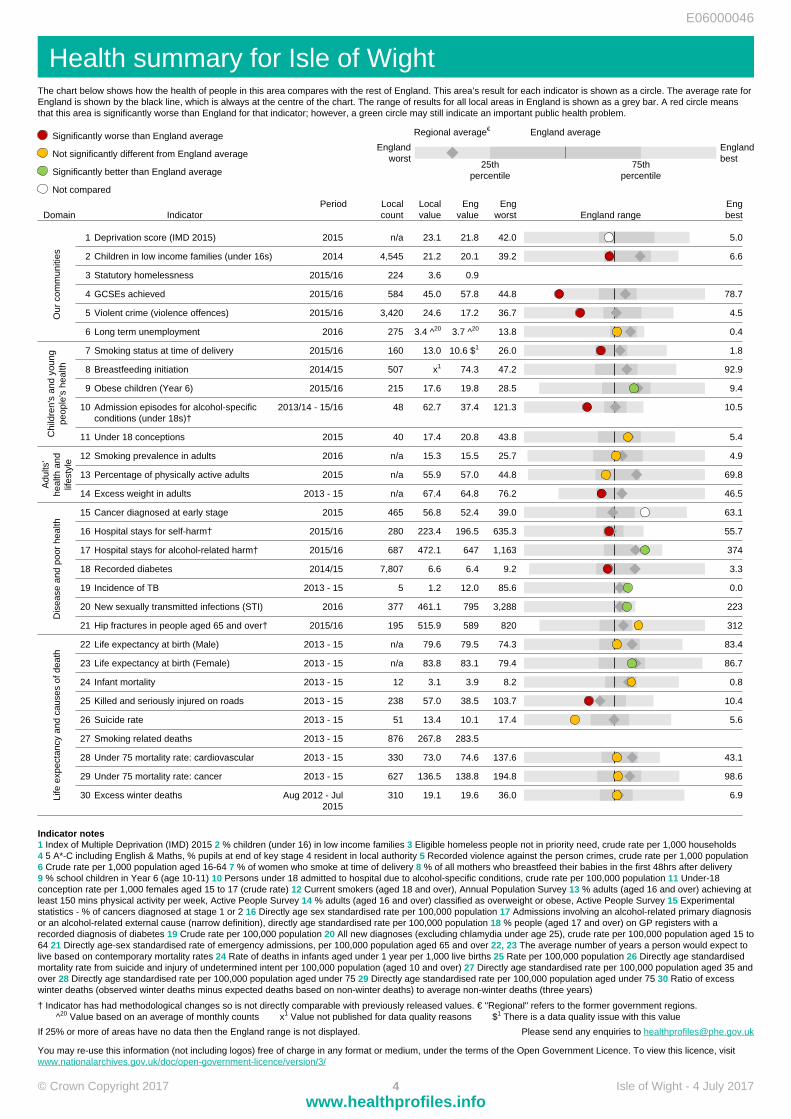
Health summary for Isle of WightThe chart below shows how the health of people in this area compares with the rest of England. This area’s result for each indicator is shown as a circle. The average rate forEngland is shown by the black line, which is always at the centre of the chart. The range of results for all local areas in England is shown as a grey bar. A red circle meansthat this area is significantly worse than England for that indicator; however, a green circle may still indicate an important public health problem.
29 Under 75 mortality rate: cancer 2013 - 15 627 136.5 138.8 194.8 98.6
30 Excess winter deaths Aug 2012 - Jul2015
310 19.1 19.6 36.0 6.9Life
exp
ecta
ncy
and
caus
es o
f dea
th
Indicator notes1 Index of Multiple Deprivation (IMD) 2015 2 % children (under 16) in low income families 3 Eligible homeless people not in priority need, crude rate per 1,000 households4 5 A*-C including English & Maths, % pupils at end of key stage 4 resident in local authority 5 Recorded violence against the person crimes, crude rate per 1,000 population6 Crude rate per 1,000 population aged 16-64 7 % of women who smoke at time of delivery 8 % of all mothers who breastfeed their babies in the first 48hrs after delivery9 % school children in Year 6 (age 10-11) 10 Persons under 18 admitted to hospital due to alcohol-specific conditions, crude rate per 100,000 population 11 Under-18conception rate per 1,000 females aged 15 to 17 (crude rate) 12 Current smokers (aged 18 and over), Annual Population Survey 13 % adults (aged 16 and over) achieving atleast 150 mins physical activity per week, Active People Survey 14 % adults (aged 16 and over) classified as overweight or obese, Active People Survey 15 Experimentalstatistics - % of cancers diagnosed at stage 1 or 2 16 Directly age sex standardised rate per 100,000 population 17 Admissions involving an alcohol-related primary diagnosisor an alcohol-related external cause (narrow definition), directly age standardised rate per 100,000 population 18 % people (aged 17 and over) on GP registers with arecorded diagnosis of diabetes 19 Crude rate per 100,000 population 20 All new diagnoses (excluding chlamydia under age 25), crude rate per 100,000 population aged 15 to64 21 Directly age-sex standardised rate of emergency admissions, per 100,000 population aged 65 and over 22, 23 The average number of years a person would expect tolive based on contemporary mortality rates 24 Rate of deaths in infants aged under 1 year per 1,000 live births 25 Rate per 100,000 population 26 Directly age standardisedmortality rate from suicide and injury of undetermined intent per 100,000 population (aged 10 and over) 27 Directly age standardised rate per 100,000 population aged 35 andover 28 Directly age standardised rate per 100,000 population aged under 75 29 Directly age standardised rate per 100,000 population aged under 75 30 Ratio of excesswinter deaths (observed winter deaths minus expected deaths based on non-winter deaths) to average non-winter deaths (three years)
† Indicator has had methodological changes so is not directly comparable with previously released values. € "Regional" refers to the former government regions. ^20 Value based on an average of monthly counts x1 Value not published for data quality reasons $1 There is a data quality issue with this value
If 25% or more of areas have no data then the England range is not displayed. Please send any enquiries to [email protected]
You may re-use this information (not including logos) free of charge in any format or medium, under the terms of the Open Government Licence. To view this licence, visit www.nationalarchives.gov.uk/doc/open-government-licence/version/3/