Isomer-specific cryogenic ion vibrationalspectroscopy of the D2 tagged Cs+(HNO3)(H2O)n=0–2complexes: ion-driven enhancement of the acidicH-bond to water†
Sayoni Mitra, a Chinh H. Duong, a Laura M. McCaslin, bc
R. Benny Gerber *bc and Mark A. Johnson *a
We report how the binary HNO3(H2O) interaction is modified upon complexation with a nearby Cs+ ion.
Isomer-selective IR photodissociation spectra of the D2-tagged, ternary Cs+(HNO3)H2O cation confirms
that two structural isomers are generated in the cryogenic ion source. In one of these, both HNO3 and
H2O are directly coordinated to the ion, while in the other, the water molecule is attached to the OH
group of the acid, which in turn binds to Cs+ with its –NO2 group. The acidic OH stretching fundamental
in the latter isomer displays a B300 cm�1 red-shift relative to that in the neutral H-bonded van der Waals
complex, HNO3(H2O). This behavior is analyzed with the aid of electronic structure calculations and
discussed in the context of the increased effective acidity of HNO3 in the presence of the cation.
I. Introduction
Nitric acid (HNO3) plays an important role in the chemistryof the atmosphere,1,2 ranging from ozone depletion in polarregions3,4 to the regeneration of pollutants in the tropospherethrough reactions mediated by sea spray aerosol (SSA) particles.5–8
Accurately describing the behavior of HNO3 in such complexenvironments is challenging because it involves the molecularlevel treatment of a strong acid at the air–water interface in thepresence of aqueous inorganic ions (alkali and alkaline earthmetals, halides, carboxylates, etc.).9–23 In this report, we adopt abottom up approach to establish key paradigms driving the HNO3
response to the local environment, and in particular explore howthe fundamental interaction betweenHNO3 and one watermoleculeis modified by the presence of a bare Cs+ cation as well as by theCs+(H2O) monohydrate. This information is obtained by analyzingthe vibrational spectra of the isolated Cs+(HNO3)(H2O)n=0–2 clusterions, obtained using infrared, cryogenic photofragmentation massspectrometry. Our specific focus is to determine the distortions inthe intrinsic HNO3/H2O binary interaction induced by attachmentto a Cs+ cation.
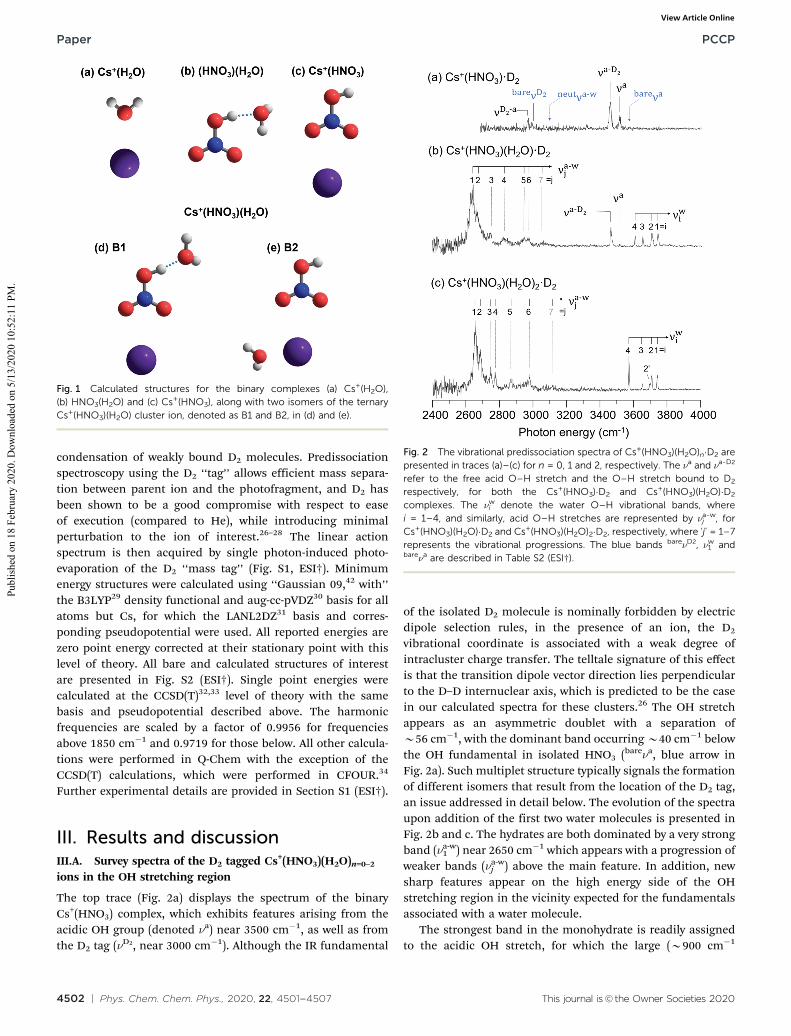
The high resolution microwave spectrum of the neutral (vander Waals) HNO3(H2O) complex24 has been analyzed to yieldthe structure indicated in Fig. 1b. In this arrangement, the acid OHgroup is attached to a lone pair of electrons on the water moleculein the entrance channel of the endoergic (B8.7 kcal mol�1) acid–base reaction (refer to Table S1, ESI†). Electronic structure calcula-tions predict that attachment of a Cs+ ion to the neutral complexoccurs in the two isomeric forms denoted B1 and B2 in Fig. 1dand e, respectively. In the B1 structure, the binary HNO3/H2Ointeraction is enhanced, while in the other (isomer B2), the twoneutral constituents are broken apart and attach directly onto theion in its first solvation shell. In this report, we capture both ofthese forms in the laboratory and report the resulting spectralresponses of both the water molecule and the nitric acid in eachform. It is of particular interest to assess the degree to which theacidity of the OH group on the acid is enhanced by electrostaticstabilization of the incipient –(NO3)
d� group by a proximal cation instructure B1, as well as the effects of H2O and its binding location.
II. Experimental and computationalmethods
Vibrational spectra of the size-selected Cs+(HNO3)(H2O)n=0–2complexes were obtained in an action mode with IR photo-dissociation (IRPD) of weakly bound D2 adducts. This wascarried out using the Yale cryogenic photofragmentation massspectrometer.25 Briefly, this method involves cooling the ionof interest in a cryogenic ion trap held at B30 K to enable
a Sterling Chemistry Laboratory, Yale University, New Haven, CT, USA.
condensation of weakly bound D2 molecules. Predissociationspectroscopy using the D2 ‘‘tag’’ allows efficient mass separa-tion between parent ion and the photofragment, and D2 hasbeen shown to be a good compromise with respect to easeof execution (compared to He), while introducing minimalperturbation to the ion of interest.26–28 The linear actionspectrum is then acquired by single photon-induced photo-evaporation of the D2 ‘‘mass tag’’ (Fig. S1, ESI†). Minimumenergy structures were calculated using ‘‘Gaussian 09,42 with’’the B3LYP29 density functional and aug-cc-pVDZ30 basis for allatoms but Cs, for which the LANL2DZ31 basis and corres-ponding pseudopotential were used. All reported energies arezero point energy corrected at their stationary point with thislevel of theory. All bare and calculated structures of interestare presented in Fig. S2 (ESI†). Single point energies werecalculated at the CCSD(T)32,33 level of theory with the samebasis and pseudopotential described above. The harmonicfrequencies are scaled by a factor of 0.9956 for frequenciesabove 1850 cm�1 and 0.9719 for those below. All other calcula-tions were performed in Q-Chem with the exception of theCCSD(T) calculations, which were performed in CFOUR.34
Further experimental details are provided in Section S1 (ESI†).
III. Results and discussionIII.A. Survey spectra of the D2 tagged Cs+(HNO3)(H2O)n=0–2ions in the OH stretching region
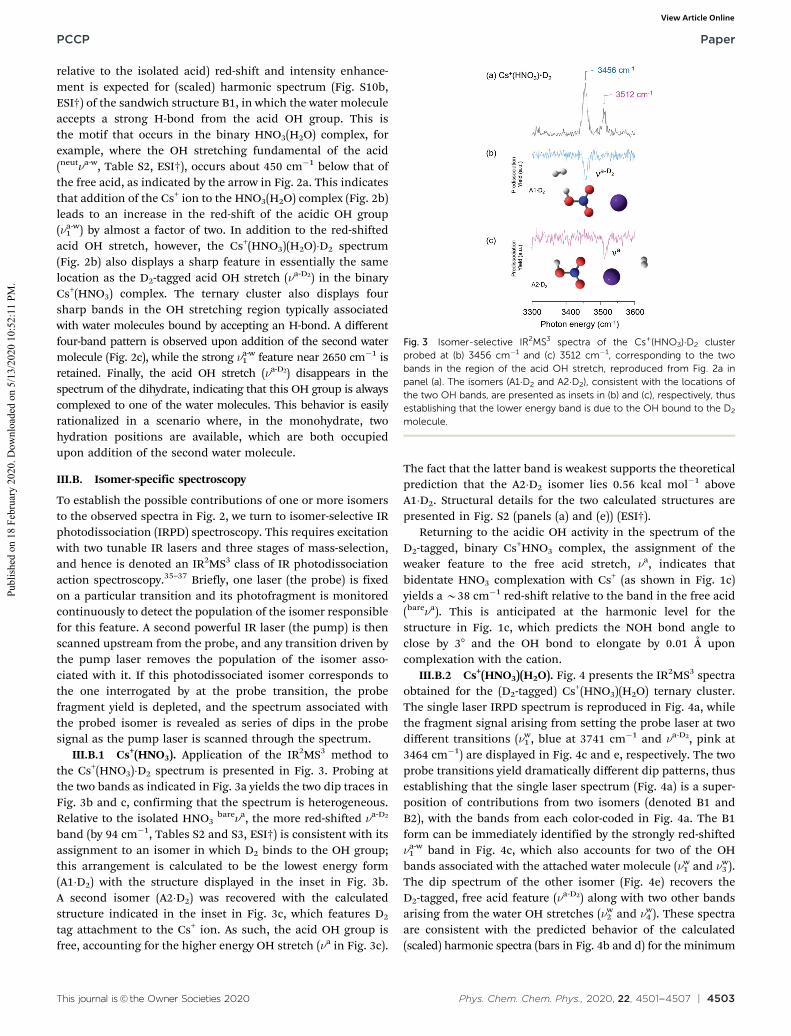
The top trace (Fig. 2a) displays the spectrum of the binaryCs+(HNO3) complex, which exhibits features arising from theacidic OH group (denoted na) near 3500 cm�1, as well as fromthe D2 tag (nD2, near 3000 cm�1). Although the IR fundamental
of the isolated D2 molecule is nominally forbidden by electricdipole selection rules, in the presence of an ion, the D2
vibrational coordinate is associated with a weak degree ofintracluster charge transfer. The telltale signature of this effectis that the transition dipole vector direction lies perpendicularto the D–D internuclear axis, which is predicted to be the casein our calculated spectra for these clusters.26 The OH stretchappears as an asymmetric doublet with a separation ofB56 cm�1, with the dominant band occurringB40 cm�1 belowthe OH fundamental in isolated HNO3 (barena, blue arrow inFig. 2a). Such multiplet structure typically signals the formationof different isomers that result from the location of the D2 tag,an issue addressed in detail below. The evolution of the spectraupon addition of the first two water molecules is presented inFig. 2b and c. The hydrates are both dominated by a very strongband (na-w1 ) near 2650 cm�1 which appears with a progression ofweaker bands (na-wj ) above the main feature. In addition, newsharp features appear on the high energy side of the OHstretching region in the vicinity expected for the fundamentalsassociated with a water molecule.
The strongest band in the monohydrate is readily assignedto the acidic OH stretch, for which the large (B900 cm�1
Fig. 1 Calculated structures for the binary complexes (a) Cs+(H2O),(b) HNO3(H2O) and (c) Cs+(HNO3), along with two isomers of the ternaryCs+(HNO3)(H2O) cluster ion, denoted as B1 and B2, in (d) and (e).
Fig. 2 The vibrational predissociation spectra of Cs+(HNO3)(H2O)n�D2 arepresented in traces (a)–(c) for n = 0, 1 and 2, respectively. The na and na-D2
refer to the free acid O–H stretch and the O–H stretch bound to D2
respectively, for both the Cs+(HNO3)�D2 and Cs+(HNO3)(H2O)�D2
complexes. The nwi denote the water O–H vibrational bands, wherei = 1–4, and similarly, acid O–H stretches are represented by na-wj , forCs+(HNO3)(H2O)�D2 and Cs+(HNO3)(H2O)2�D2, respectively, where ‘j’ = 1–7represents the vibrational progressions. The blue bands barenD2, nw1 andbarena are described in Table S2 (ESI†).
relative to the isolated acid) red-shift and intensity enhance-ment is expected for (scaled) harmonic spectrum (Fig. S10b,ESI†) of the sandwich structure B1, in which the water moleculeaccepts a strong H-bond from the acid OH group. This isthe motif that occurs in the binary HNO3(H2O) complex, forexample, where the OH stretching fundamental of the acid(neutna-w, Table S2, ESI†), occurs about 450 cm�1 below that ofthe free acid, as indicated by the arrow in Fig. 2a. This indicatesthat addition of the Cs+ ion to the HNO3(H2O) complex (Fig. 2b)leads to an increase in the red-shift of the acidic OH group(na-w1 ) by almost a factor of two. In addition to the red-shiftedacid OH stretch, however, the Cs+(HNO3)(H2O)�D2 spectrum(Fig. 2b) also displays a sharp feature in essentially the samelocation as the D2-tagged acid OH stretch (na-D2) in the binaryCs+(HNO3) complex. The ternary cluster also displays foursharp bands in the OH stretching region typically associatedwith water molecules bound by accepting an H-bond. A differentfour-band pattern is observed upon addition of the second watermolecule (Fig. 2c), while the strong na-w1 feature near 2650 cm�1 isretained. Finally, the acid OH stretch (na-D2) disappears in thespectrum of the dihydrate, indicating that this OH group is alwayscomplexed to one of the water molecules. This behavior is easilyrationalized in a scenario where, in the monohydrate, twohydration positions are available, which are both occupiedupon addition of the second water molecule.
III.B. Isomer-specific spectroscopy
To establish the possible contributions of one or more isomersto the observed spectra in Fig. 2, we turn to isomer-selective IRphotodissociation (IRPD) spectroscopy. This requires excitationwith two tunable IR lasers and three stages of mass-selection,and hence is denoted an IR2MS3 class of IR photodissociationaction spectroscopy.35–37 Briefly, one laser (the probe) is fixedon a particular transition and its photofragment is monitoredcontinuously to detect the population of the isomer responsiblefor this feature. A second powerful IR laser (the pump) is thenscanned upstream from the probe, and any transition driven bythe pump laser removes the population of the isomer asso-ciated with it. If this photodissociated isomer corresponds tothe one interrogated by at the probe transition, the probefragment yield is depleted, and the spectrum associated withthe probed isomer is revealed as series of dips in the probesignal as the pump laser is scanned through the spectrum.
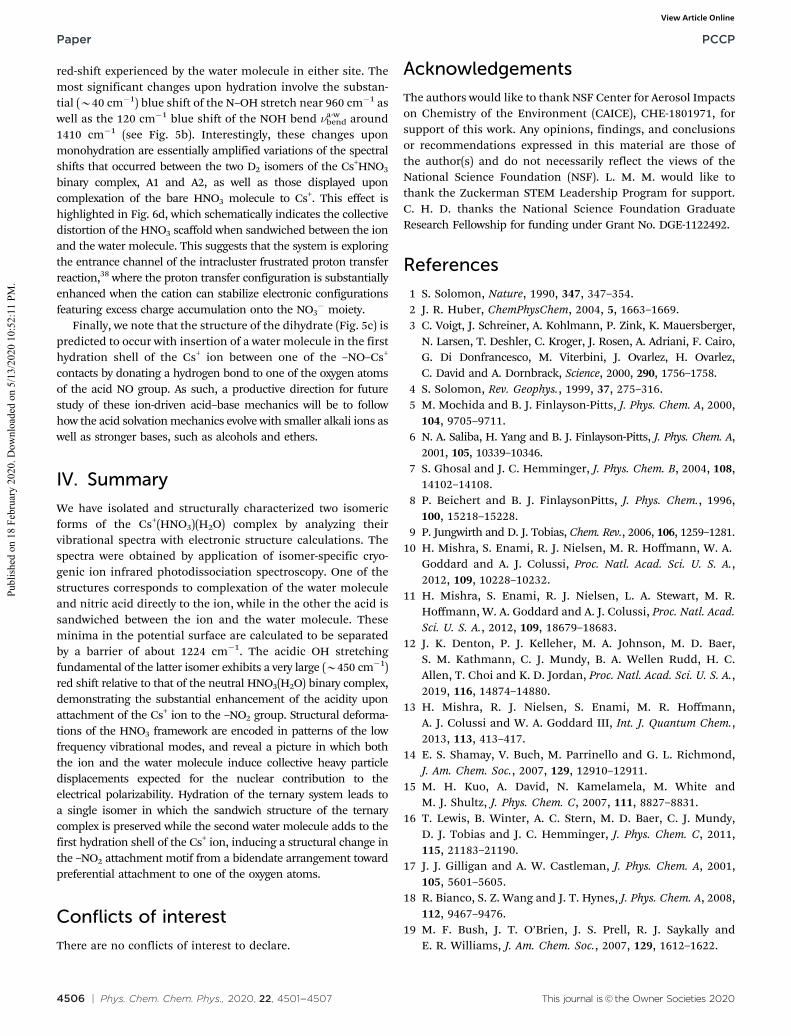
III.B.1 Cs+(HNO3). Application of the IR2MS3 method tothe Cs+(HNO3)�D2 spectrum is presented in Fig. 3. Probing atthe two bands as indicated in Fig. 3a yields the two dip traces inFig. 3b and c, confirming that the spectrum is heterogeneous.Relative to the isolated HNO3
barena, the more red-shifted na-D2
band (by 94 cm�1, Tables S2 and S3, ESI†) is consistent with itsassignment to an isomer in which D2 binds to the OH group;this arrangement is calculated to be the lowest energy form(A1�D2) with the structure displayed in the inset in Fig. 3b.A second isomer (A2�D2) was recovered with the calculatedstructure indicated in the inset in Fig. 3c, which features D2
tag attachment to the Cs+ ion. As such, the acid OH group isfree, accounting for the higher energy OH stretch (na in Fig. 3c).
The fact that the latter band is weakest supports the theoreticalprediction that the A2�D2 isomer lies 0.56 kcal mol�1 aboveA1�D2. Structural details for the two calculated structures arepresented in Fig. S2 (panels (a) and (e)) (ESI†).
Returning to the acidic OH activity in the spectrum of theD2-tagged, binary Cs+HNO3 complex, the assignment of theweaker feature to the free acid stretch, na, indicates thatbidentate HNO3 complexation with Cs+ (as shown in Fig. 1c)yields a B38 cm�1 red-shift relative to the band in the free acid(barena). This is anticipated at the harmonic level for thestructure in Fig. 1c, which predicts the NOH bond angle toclose by 38 and the OH bond to elongate by 0.01 Å uponcomplexation with the cation.
III.B.2 Cs+(HNO3)(H2O). Fig. 4 presents the IR2MS3 spectraobtained for the (D2-tagged) Cs+(HNO3)(H2O) ternary cluster.The single laser IRPD spectrum is reproduced in Fig. 4a, whilethe fragment signal arising from setting the probe laser at twodifferent transitions (nw1 , blue at 3741 cm�1 and na-D2, pink at3464 cm�1) are displayed in Fig. 4c and e, respectively. The twoprobe transitions yield dramatically different dip patterns, thusestablishing that the single laser spectrum (Fig. 4a) is a super-position of contributions from two isomers (denoted B1 andB2), with the bands from each color-coded in Fig. 4a. The B1form can be immediately identified by the strongly red-shiftedna-w1 band in Fig. 4c, which also accounts for two of the OHbands associated with the attached water molecule (nw1 and nw3 ).The dip spectrum of the other isomer (Fig. 4e) recovers theD2-tagged, free acid feature (na-D2) along with two other bandsarising from the water OH stretches (nw2 and nw4 ). These spectraare consistent with the predicted behavior of the calculated(scaled) harmonic spectra (bars in Fig. 4b and d) for the minimum
Fig. 3 Isomer-selective IR2MS3 spectra of the Cs+(HNO3)�D2 clusterprobed at (b) 3456 cm�1 and (c) 3512 cm�1, corresponding to the twobands in the region of the acid OH stretch, reproduced from Fig. 2a inpanel (a). The isomers (A1�D2 and A2�D2), consistent with the locations ofthe two OH bands, are presented as insets in (b) and (c), respectively, thusestablishing that the lower energy band is due to the OH bound to the D2
energy structures displayed in the insets of Fig. 4 and presented inmore detail in Fig. S2 (ESI†) in the panels (b), (c), (f) and (g).
The OH stretch of the acidic OH group bound to the watermolecule in the isomer B1 spectrum (na-w1 in Fig. 4c) is inter-esting in that this represents a B450 cm�1 red-shift comparedto (neutna-w) displayed by the neutral binary complex (Fig. S3,ESI†). This shift thus provides a direct measurement of theenhancement in the effective HNO3 acidity by the presenceof the positively charged Cs+ attached to the –NO2 group.We discuss this effect further in Section III.C.
The appearance of a weaker progression of peaks above thedominant na-w1 band (na-wi in Fig. 2b) is often encountered inthe spectra of strong H-bonds.38,39 This occurs when the OHfrequency is strongly modulated by displacements along thesoft modes associated with frustrated rotation and translationof the tethered water molecule. The (B100 cm�1) spacing ofthe na-wi bands (see values in Table S4, ESI†) is consistent withthe calculated frequencies of various soft modes at theharmonic level.
In both isomers of the monohydrate (B1 and B2), the bandsassociated with the water molecule in the OH stretching regionare unambiguously assigned to fundamentals of the symmetric(nw3 ,n
w4 ) and antisymmetric (nw1 ,n
w2 ) stretching normal modes of
the two OH groups in each isomer, respectively. In the isomerB1 structure, the H2O molecule hydrogen bonds with the acidO–H group, whereas in B2, the water molecule resides in the firstsolvation shell around the Cs+ ion along with HNO3, leaving theacid OH group free. The red-shifts in the O–H stretches of the H2Omolecule bound to the ion in isomer B2 place these bandsconsiderably below those of both bare water (broken arrows inFig. 4b) and those of the more distant H2O molecule in isomer B1.This red-shift is typical for O–H oscillators in the strong positiveelectric field close to the Cs+ ion, and largely reflects the fact thatthe magnitude of the dipole moment along the OH bond increaseswith bond length.40 A complete picture of the H2O O–H oscillatorshifts is seen in Fig. S4 (ESI†). We remark that the two isomers areformed by water attachment to either the acid OH group or to theCs+ ion, which are the same two locations adopted by the moreweakly bound D2 molecule.
The fact that the two Cs+(HNO3)(H2O) isomers in the mono-hydrate are prepared with about equal abundance indicatesthat there must be a substantial barrier to interconversion.Interestingly, our calculations indicate that B1, in which thewater molecule resides in the second solvation shell, is lowestin energy, with the B2 form predicted to lie B3.1 kcal mol�1
above it. Note that the relative abundance of the isomers is notone that is expected for an equilibrium distribution at lowtemperature, indicating the populations are ‘‘locked in’’ atrelatively high energy during the cooling process. The calculatedstructure of the transition state is presented in Fig. S5 (ESI†), withenergy 3.5 kcal mol�1 above that of B2.
III.B.3 Cs+(HNO3)(H2O)2. Double resonance spectra werealso recorded for the dihydrate (Fig. S6, ESI†), which estab-lished that this cluster only occurs in one isomeric form. Thisbehavior is readily explained by the structure depicted inFig. S2, panels (d) and (h) (ESI†), where the two water moleculesoccupy both positions established as preferred docking sites bythe two isomers from the monohydrate. Interestingly, however,the spectrum is not a simple superposition of those associatedwith the two isomers. In particular, the lowest member of thequartet (nw4 ) is clearly both red-shifted (by B30 cm�1) andenhanced relative to the pattern displayed in Fig. 2a. Theimplications of this discrepancy will be discussed in the contextof the calculated structures in Section III.C. All band assignmentsfor the mid-IR region are presented in Tables S2–S5 (ESI†).
III.C. Structural deformation of the acid upon ioncomplexation and microhydration
To address how the heavy atoms of the acid respond tocomplexation, we turn to the low frequency region of the spec-trum with the results for the three ions displayed in Fig. 5. The D2
tagged Cs+(HNO3) system (Fig. 5a) is dominated by bands readilyassigned to the HO–N stretch (naHO–N) near 950 cm�1 and those atB1350 and 1660 cm�1 are derived from the symmetric symnaNO2
and antisymmetric asymnaNO2collective modes of the –NO2 group,
Fig. 4 Isomer-specific spectra of the Cs+(HNO3)(H2O)�D2 cluster using two-color, IR–IR hole-burning. Predissociation spectrum of Cs+(HNO3)(H2O)�D2 isshown in (a), with the depletion traces (c) and (e) obtained by probing at thepositions indicated by arrows in (a). The calculated harmonic spectra of theisomers B1 and B2 are (b) and (d), as described in the Experimental andcomputational methods section. In (c), bands nw1 and nw3 correspond to acid-bound H2O O–H symmetric and asymmetric stretches, while na-w1 is thewater-bound acid O–H stretch. In (e), bands nw2 and nw4 correspond to Cs+
ion bound H2O O–H symmetric and asymmetric stretches, while na-D2 is theD2-bound acid O–H stretch.
anchored to the ion in a bidentate manner. The latter twofundamentals are split apart by about 350 cm�1, which is about50 cm�1 smaller than those in the free acid.41 The breadth andmultiplet structures of these features is expected in light of thesimilar contributions from the two isomers (A1 and A2) identifiedabove arising from the location of the D2 tag. The only exception isthe OH bending mode, nabend, which is calculated to yield asubstantial (B50 cm�1) blueshift in the A1�D2 isomer in whichD2 attaches to the acidic OH group and accounts for the band
na-D2bend near 1300 cm�1. The predicted contributions from the two
isomers are indicated in red and blue highlights in the calculatedspectra presented by the vertical bars in Fig. 5a, and providecompelling assignments of all features in the observed spectrum(inverted trace in Fig. 5a).
These spectral changes in the HNO3 fundamentals upon ioncomplexation are summarized in Fig. 6c, and point to ascenario where partial negative charge is accumulated on the–NO2 moiety. This leads to a B31 contraction of the ONO bondangle as well as a 0.03 Å shortening of the N–OH bond length,
which brings the core structure of the O–NO2 scaffold closer tothat of the NO3
� anion (Fig. 6e). Nominal charges on the atomsand the detailed structural deformation of the acid moleculeupon complexation with the cation are included in Fig. S7 and S8(ESI†) to further explore this interplay between the electronicand structural contributions to the electric polarizability of theacid in response to the strong electric field of the ion.
With the behavior of the binary Cs+HNO3 complex in mind,we consider the additional deformation in the acid constituentupon hydration to yield the B1 isomer of the ternary complex.The contributions from both isomers are readily assigned fromthe predicted (scaled) harmonic spectra, and are highlighted bythe blue (B1) and red (B2) inverted bars in Fig. 5b. Theintramolecular bends of the water molecule are clearly splitapart in the two spectra with the water closest to the ion (B2)yielding the higher energy member of the doublet near1650 cm�1. We note that the scaling factor which was derivedfrom the Cs+HNO3 behavior substantially overestimates the
Fig. 5 The vibrational predissociation spectra of Cs+(HNO3)(H2O)n�D2 inthe fingerprint region are presented in traces (a)–(c) for n = 0, 1 and 2,respectively, along with the stick spectra for the isomer (or isomers)associated with each, as elucidated before. The naHO–N band is theHO–N stretch and nabend is the acid NO–H bend of the HNO3 moleculein the A2�D2 isomer of the Cs+(HNO3)�D2 complex, while na-D2
bend band is the
acid NO–H bend of the HNO3 molecule in A1�D2 isomer. Bands na-D2HO�N and
na-D2bend are the HO–N stretch and acid NO–H bend of the HNO3 molecule in
B2�D2 isomer of Cs+(HNO3)(H2O)�D2 complex, while bands na-wHO–N andna-wbend are the HO–N stretch and acid NO–H bend of the HNO3 molecule inB1�D2 isomer. Calculated stick spectra are obtained as described inthe Experimental and computational methods section, and all bandsassignments are presented in Tables S6–S9 (ESI†).
Fig. 6 The distortion in the geometry (exaggerated for illustrationpurposes) of (a) an isolated HNO3 molecule is studied under the influenceof H2O in (b), Cs+ ion in (c), and the combined effect of Cs+ ion and H2Omolecule in (d), while (e) presents the structure of the isolated NO3
� anion.All shifts are denoted relative to the HNO3 molecule. Note that the –NO2
angle (denoted +NO2) and the NO–H bond distance (d(NO–H)) decreasesuch that they become more similar to those in nitrate in structure (d). Thenet distortion of the acid is a combination of the independent effects fromthe ion and the water molecule, revealing the cooperative mechanicsunderlying ion-assisted proton transfer.
red-shift experienced by the water molecule in either site. Themost significant changes upon hydration involve the substan-tial (B40 cm�1) blue shift of the N–OH stretch near 960 cm�1 aswell as the 120 cm�1 blue shift of the NOH bend na-wbend around1410 cm�1 (see Fig. 5b). Interestingly, these changes uponmonohydration are essentially amplified variations of the spectralshifts that occurred between the two D2 isomers of the Cs+HNO3
binary complex, A1 and A2, as well as those displayed uponcomplexation of the bare HNO3 molecule to Cs+. This effect ishighlighted in Fig. 6d, which schematically indicates the collectivedistortion of the HNO3 scaffold when sandwiched between the ionand the water molecule. This suggests that the system is exploringthe entrance channel of the intracluster frustrated proton transferreaction,38 where the proton transfer configuration is substantiallyenhanced when the cation can stabilize electronic configurationsfeaturing excess charge accumulation onto the NO3
� moiety.Finally, we note that the structure of the dihydrate (Fig. 5c) is
predicted to occur with insertion of a water molecule in the firsthydration shell of the Cs+ ion between one of the –NO–Cs+
contacts by donating a hydrogen bond to one of the oxygen atomsof the acid NO group. As such, a productive direction for futurestudy of these ion-driven acid–base mechanics will be to followhow the acid solvationmechanics evolve with smaller alkali ions aswell as stronger bases, such as alcohols and ethers.
IV. Summary
We have isolated and structurally characterized two isomericforms of the Cs+(HNO3)(H2O) complex by analyzing theirvibrational spectra with electronic structure calculations. Thespectra were obtained by application of isomer-specific cryo-genic ion infrared photodissociation spectroscopy. One of thestructures corresponds to complexation of the water moleculeand nitric acid directly to the ion, while in the other the acid issandwiched between the ion and the water molecule. Theseminima in the potential surface are calculated to be separatedby a barrier of about 1224 cm�1. The acidic OH stretchingfundamental of the latter isomer exhibits a very large (B450 cm�1)red shift relative to that of the neutral HNO3(H2O) binary complex,demonstrating the substantial enhancement of the acidity uponattachment of the Cs+ ion to the –NO2 group. Structural deforma-tions of the HNO3 framework are encoded in patterns of the lowfrequency vibrational modes, and reveal a picture in which boththe ion and the water molecule induce collective heavy particledisplacements expected for the nuclear contribution to theelectrical polarizability. Hydration of the ternary system leads toa single isomer in which the sandwich structure of the ternarycomplex is preserved while the second water molecule adds to thefirst hydration shell of the Cs+ ion, inducing a structural change inthe –NO2 attachment motif from a bidendate arrangement towardpreferential attachment to one of the oxygen atoms.
Conflicts of interest
There are no conflicts of interest to declare.
Acknowledgements
The authors would like to thank NSF Center for Aerosol Impactson Chemistry of the Environment (CAICE), CHE-1801971, forsupport of this work. Any opinions, findings, and conclusionsor recommendations expressed in this material are those ofthe author(s) and do not necessarily reflect the views of theNational Science Foundation (NSF). L. M. M. would like tothank the Zuckerman STEM Leadership Program for support.C. H. D. thanks the National Science Foundation GraduateResearch Fellowship for funding under Grant No. DGE-1122492.
References
1 S. Solomon, Nature, 1990, 347, 347–354.2 J. R. Huber, ChemPhysChem, 2004, 5, 1663–1669.3 C. Voigt, J. Schreiner, A. Kohlmann, P. Zink, K. Mauersberger,
N. Larsen, T. Deshler, C. Kroger, J. Rosen, A. Adriani, F. Cairo,G. Di Donfrancesco, M. Viterbini, J. Ovarlez, H. Ovarlez,C. David and A. Dornbrack, Science, 2000, 290, 1756–1758.
4 S. Solomon, Rev. Geophys., 1999, 37, 275–316.5 M. Mochida and B. J. Finlayson-Pitts, J. Phys. Chem. A, 2000,
104, 9705–9711.6 N. A. Saliba, H. Yang and B. J. Finlayson-Pitts, J. Phys. Chem. A,
2001, 105, 10339–10346.7 S. Ghosal and J. C. Hemminger, J. Phys. Chem. B, 2004, 108,
14102–14108.8 P. Beichert and B. J. FinlaysonPitts, J. Phys. Chem., 1996,
100, 15218–15228.9 P. Jungwirth and D. J. Tobias, Chem. Rev., 2006, 106, 1259–1281.10 H. Mishra, S. Enami, R. J. Nielsen, M. R. Hoffmann, W. A.
Goddard and A. J. Colussi, Proc. Natl. Acad. Sci. U. S. A.,2012, 109, 10228–10232.
11 H. Mishra, S. Enami, R. J. Nielsen, L. A. Stewart, M. R.Hoffmann, W. A. Goddard and A. J. Colussi, Proc. Natl. Acad.Sci. U. S. A., 2012, 109, 18679–18683.
12 J. K. Denton, P. J. Kelleher, M. A. Johnson, M. D. Baer,S. M. Kathmann, C. J. Mundy, B. A. Wellen Rudd, H. C.Allen, T. Choi and K. D. Jordan, Proc. Natl. Acad. Sci. U. S. A.,2019, 116, 14874–14880.
13 H. Mishra, R. J. Nielsen, S. Enami, M. R. Hoffmann,A. J. Colussi and W. A. Goddard III, Int. J. Quantum Chem.,2013, 113, 413–417.
14 E. S. Shamay, V. Buch, M. Parrinello and G. L. Richmond,J. Am. Chem. Soc., 2007, 129, 12910–12911.
15 M. H. Kuo, A. David, N. Kamelamela, M. White andM. J. Shultz, J. Phys. Chem. C, 2007, 111, 8827–8831.
16 T. Lewis, B. Winter, A. C. Stern, M. D. Baer, C. J. Mundy,D. J. Tobias and J. C. Hemminger, J. Phys. Chem. C, 2011,115, 21183–21190.
17 J. J. Gilligan and A. W. Castleman, J. Phys. Chem. A, 2001,105, 5601–5605.
18 R. Bianco, S. Z. Wang and J. T. Hynes, J. Phys. Chem. A, 2008,112, 9467–9476.
19 M. F. Bush, J. T. O’Brien, J. S. Prell, R. J. Saykally andE. R. Williams, J. Am. Chem. Soc., 2007, 129, 1612–1622.
20 S. Z. Wang, R. Bianco and J. T. Hynes, Comput. Theor. Chem.,2011, 965, 340–345.
21 S. Z. Wang, R. Bianco and J. T. Hynes, J. Phys. Chem. A, 2009,113, 1295–1307.
22 N. Heine, E. G. Kratz, R. Bergmann, D. Schofield, K. R.Asmis, K. D. Jordan and A. B. McCoy, J. Phys. Chem. A, 2014,118, 8188–8197.
23 N. Heine, T. I. Yacovitch, F. Schubert, C. Brieger,D. M. Neumark and K. R. Asmis, J. Phys. Chem. A, 2014,118, 7613–7622.
24 M. Canagaratna, J. A. Phillips, M. E. Ott and K. R. Leopold,J. Phys. Chem. A, 1998, 102, 1489–1497.
25 A. B. Wolk, C. M. Leavitt, E. Garand and M. A. Johnson,Acc. Chem. Res., 2014, 47, 202–210.
26 M. Z. Kamrath, E. Garand, P. A. Jordan, C. M. Leavitt, A. B.Wolk, M. J. Van Stipdonk, S. J. Miller and M. A. Johnson,J. Am. Chem. Soc., 2011, 133, 6440–6448.
27 J. W. DePalma, P. J. Kelleher, L. C. Tavares and M. A.Johnson, J. Phys. Chem. Lett., 2017, 8, 484–488.
28 M. Z. Kamrath, R. A. Relph, T. L. Guasco, C. M. Leavitt andM. A. Johnson, Int. J. Mass Spectrom., 2011, 300, 91–98.
29 A. D. Becke, J. Chem. Phys., 1993, 98, 1372–1377.30 R. A. Kendall, T. H. Dunning, Jr. and R. J. Harrison, J. Chem.
Phys., 1992, 96, 6796–6806.31 P. J. Hay and W. R. Wadt, J. Chem. Phys., 1985, 82, 299–310.32 K. Raghavachari, G. W. Trucks, J. A. Pople and M. Head-
Gordon, Chem. Phys. Lett., 1989, 157, 479–483.33 R. J. Bartlett, J. D. Watts, S. A. Kucharski and J. Noga, Chem.
Phys. Lett., 1990, 165, 513–522.34 J. G. J. F. Stanton, L. Cheng, M. E. Harding, D. A. Matthews,
P. G. Szalay, w. c. from, R. J. B. A. A. Auer, U. Benedikt,C. Berger, D. E. Bernholdt, Y. J. Bomble, F. E. O. Christiansen,R. Faber, M. Heckert, O. Heun, M. Hilgenberg,T.-C. J. C. Huber, D. Jonsson, J. Juselius, T. Kirsch, K. Klein,F. L. W. J. Lauderdale, T. Metzroth, L. A. Muck, D. P. O’Neill,E. P. D. R. Price, C. Puzzarini, K. Ruud, F. Schiffmann,W. Schwalbach, S. S. C. Simmons, A. Tajti, J. Vazquez,F. Wang, J. D. Watts, a. t. i. packages, MOLECULE (J. Almlofand P.R. Taylor), PROPS (P.R. Taylor), H. J. A. J. ABACUS
(T. Helgaker, P. Jørgensen, and J. Olsen), and a. E. r. b. A. V.M. a. C. v. Wullen.
35 N. Yang, C. H. Duong, P. J. Kelleher, M. A. Johnson andA. B. McCoy, Chem. Phys. Lett., 2017, 690, 159–171.
36 C. H. Duong, O. Gorlova, N. Yang, P. J. Kelleher, M. A.Johnson, A. B. McCoy, Q. Yu and J. M. Bowman, J. Phys.Chem. Lett., 2017, 8, 3782–3789.
37 C. H. Duong, N. Yang, P. J. Kelleher, M. A. Johnson, R. J.DiRisio, A. B. McCoy, Q. Yu, J. M. Bowman, B. V. Hendersonand K. D. Jordan, J. Phys. Chem. A, 2018, 122, 9275–9284.
38 S. M. Craig, F. S. Menges, C. H. Duong, J. K. Denton,L. R. Madison, A. B. McCoy and M. A. Johnson, Proc. Natl.Acad. Sci. U. S. A., 2017, 114, E4706–E4713.
39 C. J. Johnson, L. C. Dzugan, A. B. Wolk, C. M. Leavitt, J. A.Fournier, A. B. McCoy and M. A. Johnson, J. Phys. Chem. A,2014, 118, 7590–7597.
40 G. G. Kebede, P. D. Mitev, W. J. Briels and K. Hermansson,Phys. Chem. Chem. Phys., 2018, 20, 12678–12687.
41 G. E. Mcgraw, D. L. Bernitt and I. C. Hisatsune, J. Chem.Phys., 1965, 42, 237–244.
42 M. J. Frisch, G. W. Trucks, H. B. Schlegel, G. E. Scuseria,M. A. Robb, J. R. Cheeseman, G. Scalmani, V. Barone,G. A. Petersson, H. Nakatsuji, X. Li, M. Caricato,A. Marenich, J. Bloino, B. G. Janesko, R. Gomperts,B. Mennucci, H. P. Hratchian, J. V. Ortiz, A. F. Izmaylov,J. L. Sonnenberg, D. Williams-Young, F. Ding, F. Lipparini,F. Egidi, J. Goings, B. Peng, A. Petrone, T. Henderson,D. Ranasinghe, V. G. Zakrzewski, J. Gao, N. Rega, G. Zheng,W. Liang, M. Hada, M. Ehara, K. Toyota, R. Fukuda,J. Hasegawa, M. Ishida, T. Nakajima, Y. Honda, O. Kitao,H. Nakai, T. Vreven, K. Throssell, J. A. Montgomery, Jr.,J. E. Peralta, F. Ogliaro, M. Bearpark, J. J. Heyd, E. Brothers,K. N. Kudin, V. N. Staroverov, T. Keith, R. Kobayashi,J. Normand, K. Raghavachari, A. Rendell, J. C. Burant,S. S. Iyengar, J. Tomasi, M. Cossi, J. M. Millam, M. Klene,C. Adamo, R. Cammi, J. W. Ochterski, R. L. Martin,K. Morokuma, O. Farkas, J. B. Foresman and D. J. Fox,Gaussian 09, Revision A.02, Gaussian, Inc., Wallingford CT,2016.