The comparison of two classes of bifunctional SBA-15 supported platinum-heteropolyacid catalysts for the isomerization of n-hexane
Teresa Pinto,a Philippe Arquillière,a Gerald P. Niccolai,b Frédéric Lefebvre*,a and Véronique Dufaud*,a
Supporting Information for New Journal of Chemistry
List of contents
Table S1. Platinum atomic content of Pt/SBA-15 determined by EDX.
Table S2. Apparent activation energy for bifunctional catalytic systems.
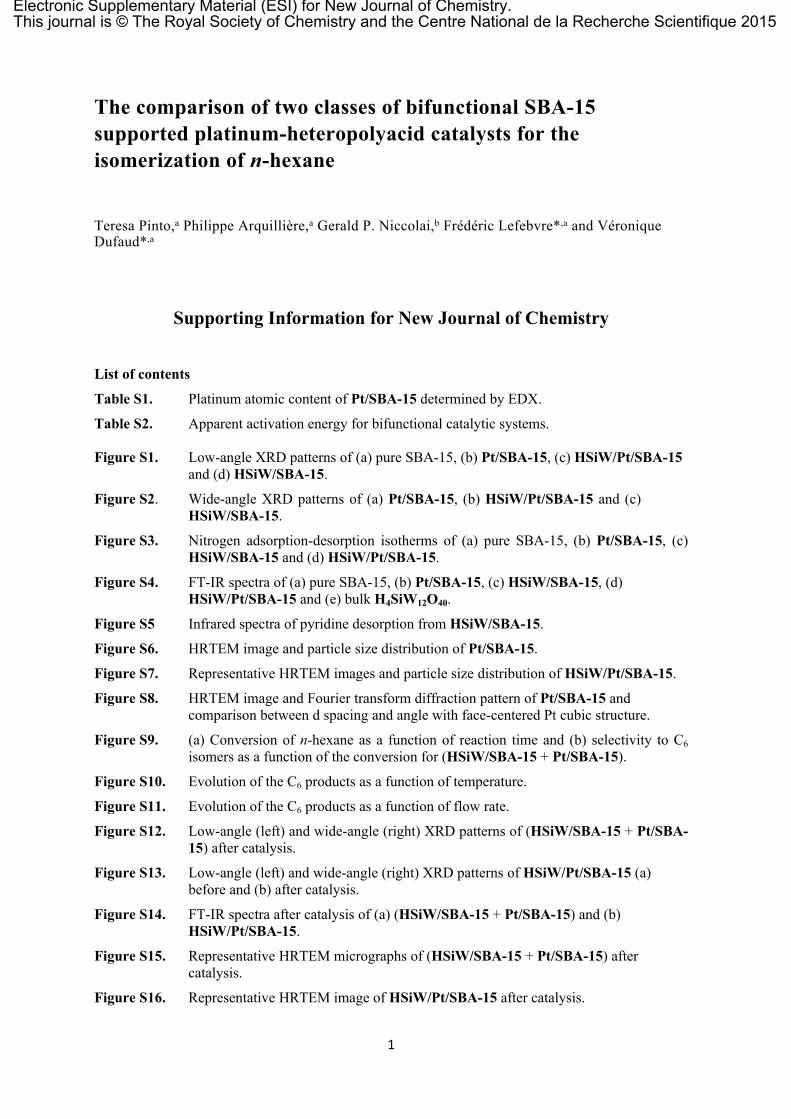
Figure S1. Low-angle XRD patterns of (a) pure SBA-15, (b) Pt/SBA-15, (c) HSiW/Pt/SBA-15 and (d) HSiW/SBA-15.
Figure S2. Wide-angle XRD patterns of (a) Pt/SBA-15, (b) HSiW/Pt/SBA-15 and (c) HSiW/SBA-15.
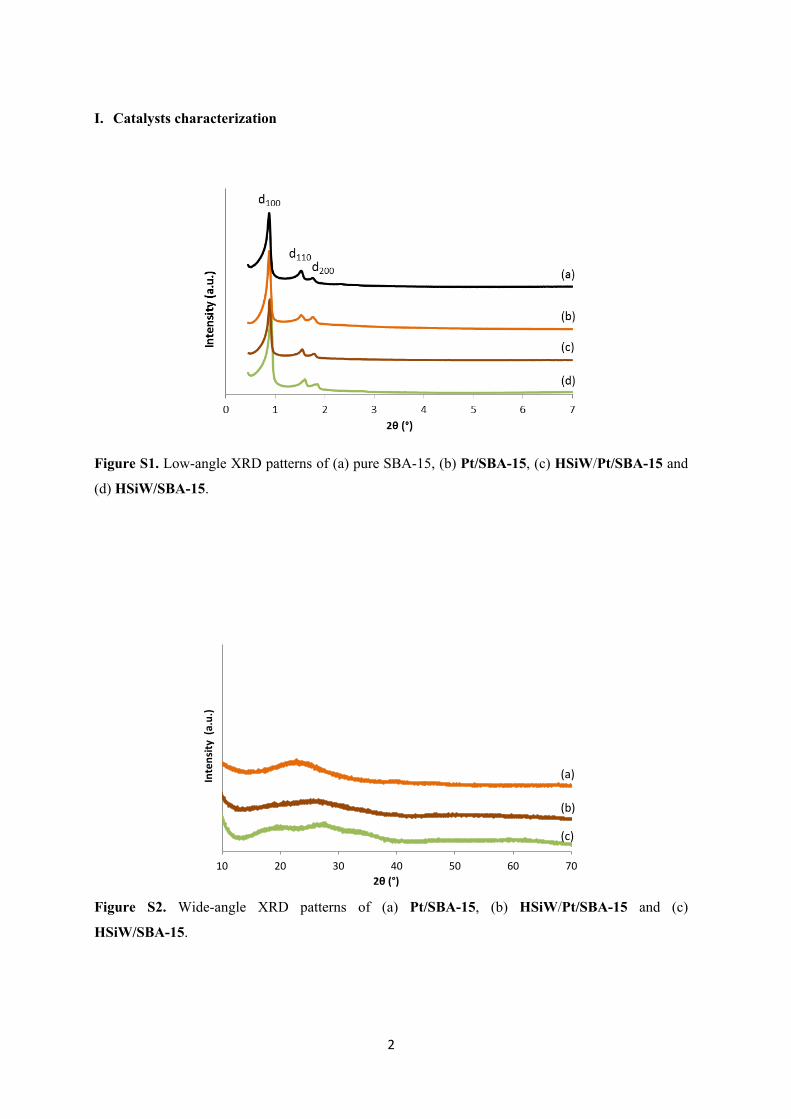
Figure S3. Nitrogen adsorption-desorption isotherms of (a) pure SBA-15, (b) Pt/SBA-15, (c) HSiW/SBA-15 and (d) HSiW/Pt/SBA-15.
Figure S4. FT-IR spectra of (a) pure SBA-15, (b) Pt/SBA-15, (c) HSiW/SBA-15, (d) HSiW/Pt/SBA-15 and (e) bulk H4SiW12O40.
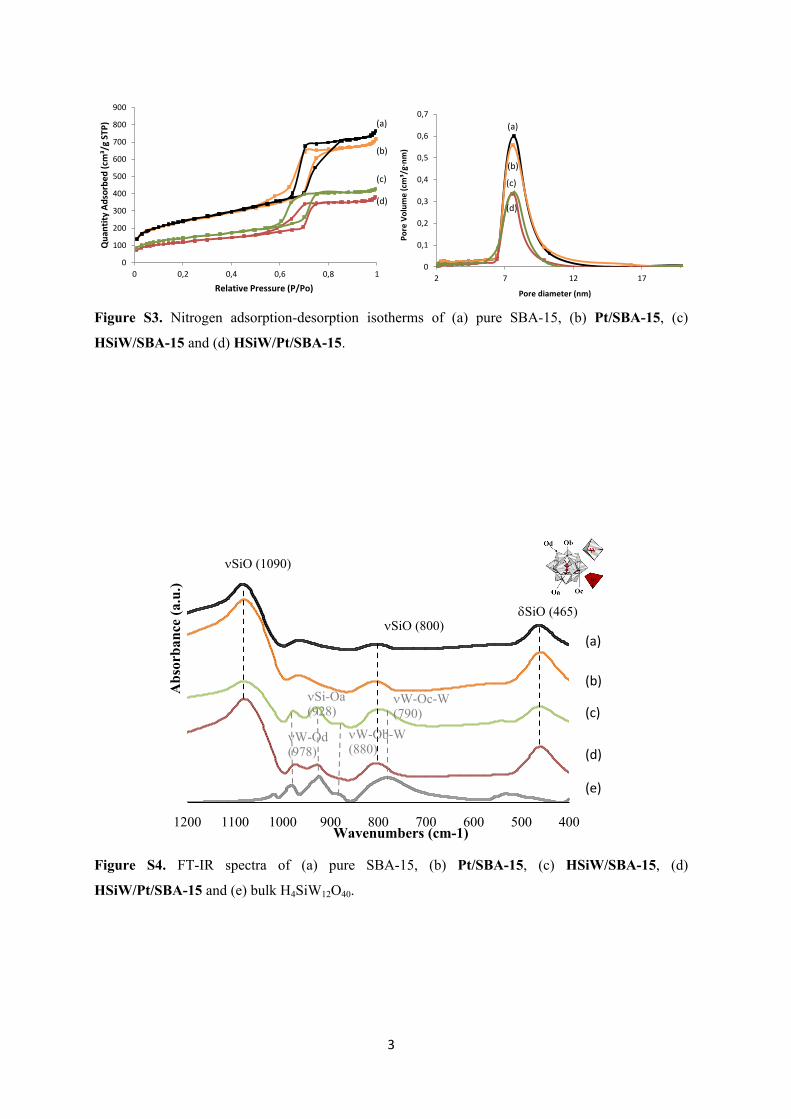
Figure S5 Infrared spectra of pyridine desorption from HSiW/SBA-15.
Figure S6. HRTEM image and particle size distribution of Pt/SBA-15.
Figure S7. Representative HRTEM images and particle size distribution of HSiW/Pt/SBA-15.
Figure S8. HRTEM image and Fourier transform diffraction pattern of Pt/SBA-15 and comparison between d spacing and angle with face-centered Pt cubic structure.
Figure S9. (a) Conversion of n-hexane as a function of reaction time and (b) selectivity to C6 isomers as a function of the conversion for (HSiW/SBA-15 + Pt/SBA-15).
Figure S10. Evolution of the C6 products as a function of temperature.
Figure S11. Evolution of the C6 products as a function of flow rate.
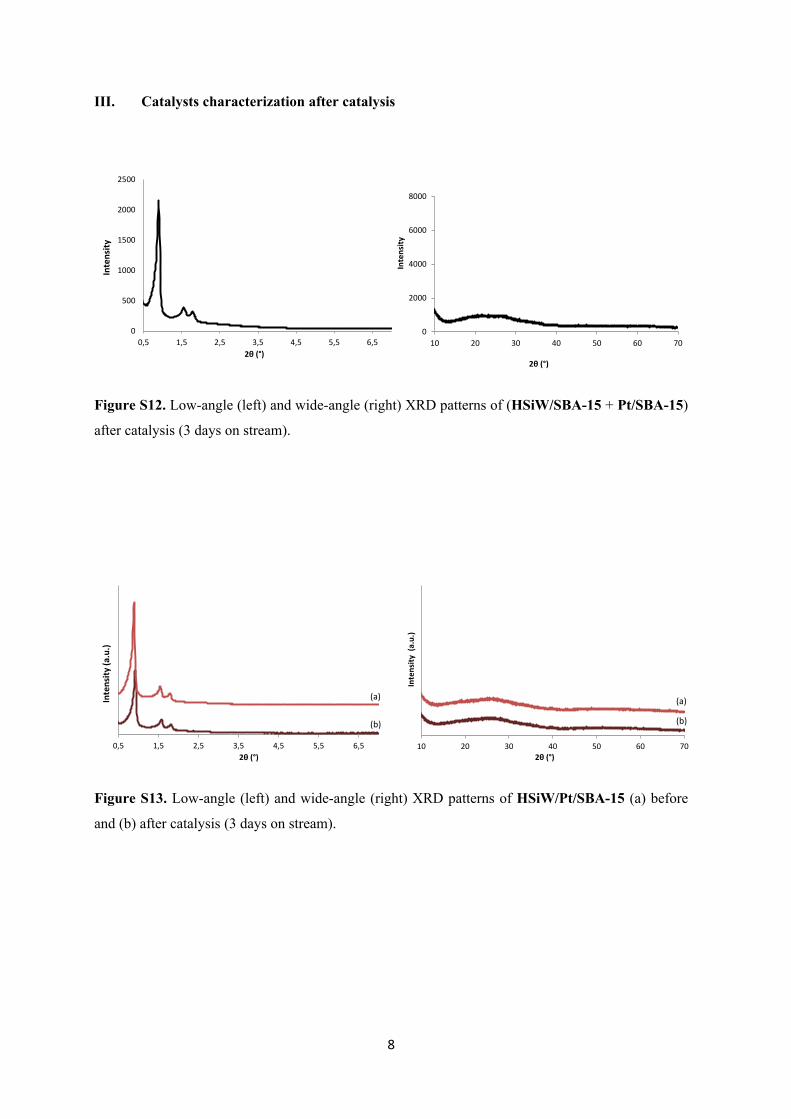
Figure S12. Low-angle (left) and wide-angle (right) XRD patterns of (HSiW/SBA-15 + Pt/SBA-15) after catalysis.
Figure S13. Low-angle (left) and wide-angle (right) XRD patterns of HSiW/Pt/SBA-15 (a) before and (b) after catalysis.
Figure S14. FT-IR spectra after catalysis of (a) (HSiW/SBA-15 + Pt/SBA-15) and (b) HSiW/Pt/SBA-15.
Figure S15. Representative HRTEM micrographs of (HSiW/SBA-15 + Pt/SBA-15) after catalysis.
Figure S16. Representative HRTEM image of HSiW/Pt/SBA-15 after catalysis.
Figure S1. Low-angle XRD patterns of (a) pure SBA-15, (b) Pt/SBA-15, (c) HSiW/Pt/SBA-15 and
(d) HSiW/SBA-15.
10 20 30 40 50 60 70
Inte
nsity
(a.
u.)
2θ (°)
(a)
(b)
(c)
Figure S2. Wide-angle XRD patterns of (a) Pt/SBA-15, (b) HSiW/Pt/SBA-15 and (c)
HSiW/SBA-15.
3
0
0,1
0,2
0,3
0,4
0,5
0,6
0,7
2 7 12 17
Pore
Vol
ume
(cm
³/g·
nm)
Pore diameter (nm)
(c)
(b)
(a)
(d)
0
100
200
300
400
500
600
700
800
900
0 0,2 0,4 0,6 0,8 1
Qua
ntity
Ads
orbe
d (c
m³/
g ST
P)
Relative Pressure (P/Po)
(a)
(b)
(c)
(d)
Figure S3. Nitrogen adsorption-desorption isotherms of (a) pure SBA-15, (b) Pt/SBA-15, (c)
HSiW/SBA-15 and (d) HSiW/Pt/SBA-15.
400500600700800900100011001200Wavenumbers (cm-1)
Abs
orba
nce
(a.u
.)
(a)
(b)
(c)
(d)
(e)
SiO(1090)
SiO (800)SiO (465)
W-Oc-W(790)
Si-Oa(928)
W-Od(978)
W-Ob-W(880)
Figure S4. FT-IR spectra of (a) pure SBA-15, (b) Pt/SBA-15, (c) HSiW/SBA-15, (d)
HSiW/Pt/SBA-15 and (e) bulk H4SiW12O40.
4
Figure S5. Infrared spectra of pyridine on HSiW/SBA-15, (a) adsorption at room temperature and as a function of the desorption temperature (b) room temperature, (c) 50 °C, (d) 100 °C, (e) 150 °C and (f) 200 °C.
Figure S6. HRTEM image and particle size distribution of Pt/SBA-15. The number-average Pt particle size was obtained by counting 200 particles.
5
Table S1. Platinum atomic content of Pt/SBA-15 determined by EDX (0.8 %wt Pt 0.25 atom Pt per 100 atom Si).
Sampling Si Pt
1 100 0.30
2 100 0.36
3 100 0.21
4 100 0.24
Figure S7. Representative HRTEM images and particle size distribution of HSiW/Pt/SBA-15. The number-average Pt particle size was obtained by counting 200 particles.
Figure S8. HRTEM image and Fourier transform diffraction pattern of Pt/SBA-15 and comparison between d spacing and angle with face-centered Pt cubic structure.
6
II. n-Hexane isomerization
0
10
20
30
40
50
60
70
80
0 20 40 60 80
Con
vers
ion
(%)
Reaction time (h)
0102030405060708090
100
0 20 40 60 80
Sele
ctiv
ityto
C6
isom
ers(
%)
Conversion (%)
Figure S9. Conversion of n-hexane as a function of reaction time (left) and selectivity to C6 isomers as a function of the conversion (right) for (HSiW/SBA-15 + Pt/SBA-15). Conditions: 1 bar, 200 °C, 5 mL.min-1 hydrogen flow, hexane/hydrogen ratio = 0.25, 1 g catalyst (0.5 g of each monofunctional catalyst).
Table S2. Apparent activation energy for bifunctional catalytic systems.
Catalyst Activation energy [kJmol-1] R2
HSiW/SBA-15 + Pt/SBA-15 66 0.99
HSiW/Pt/SBA-15 72 0.98
7
Figure S10. Evolution of the C6 products as a function of temperature for the multiphase (HSiW/SBA-15 + Pt/SBA-15, dashed lines) and monophase (HSiW/Pt/SBA-15, dotted lines) bifunctional catalysts and comparison with the theoretical thermodynamic values (solid lines).1 Products are color coded in the graph: n-hexane, green; 2-methyl pentane, dark blue; 3-methyl pentane, light blue; 2,2-dimethybutane, brown; 2,3-dimethybutane, red.
Figure S11. Evolution of the C6 products as a function of flow rate for the multiphase bifunctional catalyst (HSiW/SBA-15 + Pt/SBA-15).