Page 1
Isotope effects in liquid water probed by transmission mode x-ray absorption spectroscopy at the oxygen K-edge
Simon Schreck,1,2,a) Philippe Wernet1,b)
1 Institute for Methods and Instrumentation for Synchrotron Radiation Research, Helmholtz-Zentrum Berlin für
Materialien und Energie GmbH, Albert-Einstein-Str. 15, 12489 Berlin, Germany
2 Institut für Physik und Astronomie, Universität Potsdam, Karl-Liebknecht-Strasse 24/25, 14476 Potsdam, Germany
The effects of isotope substitution in liquid water are probed by x-ray absorption spectroscopy at the O K-edge as measured
in transmission mode. Confirming earlier x-ray Raman scattering experiments, the D2O spectrum is found to be blue shifted
with respect to H2O and the D2O spectrum to be less broadened. Following the earlier interpretations of UV and x-ray Raman
spectra, the shift is related to the difference in ground-state zero-point energies between D2O and H2O while the difference in
broadening is related to the difference in ground-state vibrational zero-point distributions. We demonstrate that the
transmission-mode measurements allow for determining the spectral shapes with unprecedented accuracy. Owing in addition
to the increased spectral resolution and signal to noise ratio compared to the earlier measurements, the new data enable the
stringent determination of blue shift and broadening in the O K-edge x-ray absorption spectrum of liquid water upon isotope
substitution. The results are compared to UV absorption data and it is discussed to which extent they reflect the differences in
zero-point energies and vibrational zero-point distributions in the ground-states of the liquids. The influence of the shape of
the final-state potential, inclusion of the Franck-Condon structure and differences between liquid H2O and D2O resulting
from different hydrogen-bond environments in the liquids are addressed. The differences between the O K-edge absorption
spectra of water from our transmission-mode measurements and from the state-of-the-art x-ray Raman scattering experiments
are discussed in addition. The experimentally extracted values of blue shift and broadening are proposed to serve as a test for
calculations of ground-state zero-point energies and vibrational zero-point distributions in liquid H2O and D2O. This clearly
motivates the need for new calculations of the O K-edge x-ray absorption spectrum of liquid water.
I. INTRODUCTION
The differences between light and heavy water H2O and D2O have ever since been addressed experimentally to study
the effect of the quantum nature of hydrogen on various properties of water. In particular, the bulk structure of the liquid [1,
2], the structure of water at interfaces [3], the thermodynamical properties of water [4], the translational and rotational
motions in liquid water [5] and the hydrogen-bond (H-bond) environment [6, 7] and its ultrafast dynamics [8] were
investigated in light of these quantum effects.
___________________________
a) Current Address: Department of Physics, AlbaNova University Center, Stockholm University, SE-10691 Stockholm, Sweden.
b) Author to whom correspondence should be addressed. Electronic mail: [email protected] .
Page 2
2
Such experimental results can serve as benchmark tests for theoretical treatments of quantum effects in hydrogen bonding (H-
bonding) in water [9, 10] and H-bonds in general [11]. Quantum effects are expressed in the electronic and geometric
structure of the liquid and may be related to the structure and the properties of liquid water in general [12, 13].
One of the earliest experimental investigations addressing the manifestation of nuclear quantum effects in the electronic
structure of water was performed by Franck and Wood where the ultraviolet (UV) absorption spectra of gaseous light and
heavy water were measured [14]. This investigation also set the stage for the interpretation of the spectral differences: The
blue shift of the UV absorption bands in heavy compared to light water were explained by the difference in the vibrational
zero point energies which we refer to in here as the ground-state zero point energy (ZPE) difference (ΔZPE). The lower ZPE
in D2O compared to H2O is expressed in a larger transition energy in D2O and the measured shift [15, 16] can be directly
related to the ΔZPE when assuming a transition from a bound to a dissociative state and a flat potential energy curve in the
excited dissociative state [14]. Another representative manifestation of the isotope difference in the electronic structure of
water was detected by Compton et al. in the energy-loss function or the electron-impact threshold excitation spectrum where
the broader peaks in H2O were related to the broader square of the vibrational ground-state wavefunction [17]. This
broadening effect was verified later [18] and is referred to here as the difference in ground-state zero point spatial probability
distribution (ΔZPD) where the ZPD is more confined in D2O compared to H2O and the line width is correspondingly smaller
[17]. To date, the ΔZPE shift and the ΔZPD broadening in the UV absorption spectrum of liquid water are investigated
experimentally [19] and theoretically [20]. This shows the importance to accurately quantify these effects to enable a correct
interpretation of the fundamental processes upon photoionization of water and the related hydrated electron [21-24].
Over the last years, x-ray spectroscopy and x-ray scattering have been used increasingly to study liquid water [1, 6, 25-37].
The questions occur about how nuclear quantum effects are expressed in the x-ray spectroscopic observable and, in
particular, how the effects of ΔZPE and ΔZPD can be transferred from the UV to the x-ray regime. This clearly motivates
addressing isotope effects in liquid water with x-ray absorption spectroscopy (XAS) at the oxygen (O) K-edge. It was found
indeed that the lowest-energy resonance in the O K-edge absorption spectrum (the so called pre-edge peak) at 535 eV shifts
to higher absorption energies in D2O and that this resonance is sharper in D2O compared to H2O [1, 6, 36]. Following the
interpretation of the UV absorption spectra, these observations were readily attributed to the effects of ΔZPE and ΔZPD [1,
6]. In order to test the limits of this concept in the x-ray regime it is highly desirable to determine as accurately as possible
shift and broadening of the pre-edge peak in the O K-edge absorption spectrum of liquid water. This could further help
scrutinizing XAS as a method for probing H-bonded liquids, it could help validating theoretical approaches for calculating
Page 3
3
the O K-edge absorption spectrum of liquid water [38-45] and it could allow for relating the x-ray spectroscopic observables
to the properties of liquid H2O and D2O by, in particular, potentially enabling to correlate quantum effects, structure and
density of states in the liquids.
The O K-edge absorption spectrum of liquid water was measured before by x-ray Raman scattering (XRS), fluorescence-
yield XAS (FY-XAS) and by XAS in transmission mode. The so far most accurate determination of the shift and broadening
of the pre-edge peak in the spectrum related to ΔZPE and ΔZPD were achieved with XRS [1, 6, 36]. FY-XAS of liquid H2O
and D2O [26, 29, 37] was often analyzed alongside with investigating the x-ray emission spectrum at the O K-edge of light
and heavy liquid water [1, 26, 27, 29, 34, 35, 37]. FY-XAS, however, suffers from well-known saturation effects which result
in inaccurate determination of the spectral shape and, hence, the pre-edge peak shift and broadening cannot be accurately
determined with FY-XAS. Transmission-mode XAS is the most direct way to determine the O K-edge absorption spectrum
of water [46-53] but liquid H2O and D2O have not been addressed yet. Compared to FY-XAS we can expect the pre-edge
peak shift and broadening to be determined more accurately with transmission-mode XAS as the spectral shape can be
determined reliably. Compared to XRS we can expect better spectral resolution and, potentially, a better signal to noise ratio
due to the higher cross section of XAS compared to XRS. In this work we show and discuss new transmission-mode XAS
data for liquid H2O and D2O. The higher spectral resolution and the better signal to noise ratio compared to the state-of-the-
art XRS spectra [1, 6, 36] enable a more accurate determination of the zero-point effects relating ΔZPE and ΔZPD and the
pre-edge peak shift and broadening in the O K-edge x-ray absorption spectra. We furthermore compare in detail the
respective XAS and XRS spectra and discuss possible reasons for their differences.
II. EXPERIMENTAL
We utilized a specialized sample holder to prepare ultra-thin liquid films of H2O and D2O of a few hundred nanometer
thickness between two x-ray transparent silicon nitride membranes. To record the x-ray absorption spectra we measured the
x-ray intensity transmitted through the liquid film and the silicon nitride membranes as a function of the incident photon
energy. For a correct measure of the incident photon flux we measured the intensity transmitted through a pair of silicon
nitride membranes with no liquid in between. The specialized sample holder, its performance as well as the data treatment are
described and demonstrated in detail in Schreck et. al. [52].
The measurements were performed at the dipole beamline PM3 at the synchrotron radiation source BESSY II of the
Helmholtz-Zentrum Berlin. Since we recorded spectra of H2O and D2O back to back at the same beamline using identical
Page 4
4
monochromator settings, the relative energy scale of the H2O and D2O spectra is very accurate and the uncertainty can be
regarded more than an order of magnitude smaller than the spectral shifts discussed in this work. The absolute energy scale
was calibrated by setting the pre-edge peak in the H2O spectrum to 535 eV [1, 54]. The bandwidth of the incident photon
energy and thus the spectral resolution was about 250 meV at 535 eV.
We used D2O purchased from Sigma Aldrich as received and deionized H2O. Special care was taken to minimize the
exposure to air and humidity for D2O.
III. RESULTS AND DISCUSSION
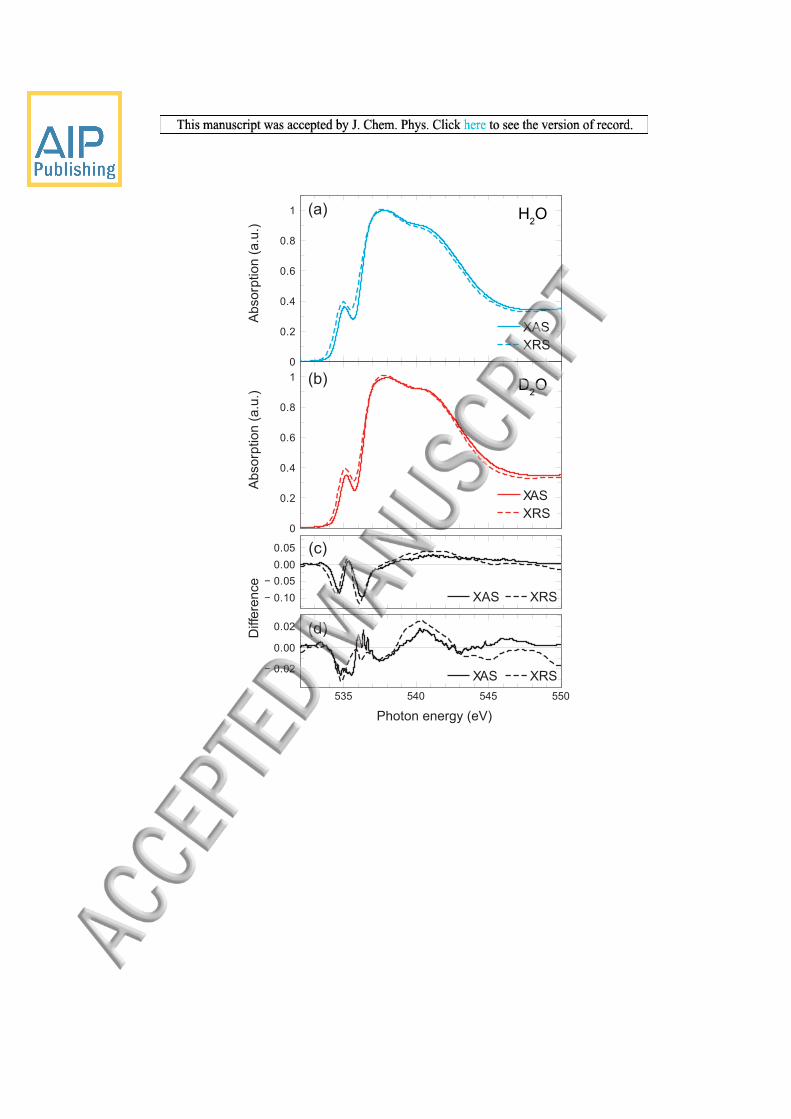
The spectra of liquid H2O and D2O as measured in transmission mode are displayed in Figure 1. To the best of our
knowledge this represents the first direct comparison of light and heavy liquid water spectra measured with XAS at the O K-
edge. The spectra are shown on an extended incident photon energy range of up to 600 eV in Figure 1 (a) with their
difference in Figure 1 (b). Because it is virtually impossible to prepare liquid water samples with the exact same thickness
down to the nm range with our membrane-based sample holder, and because the measured transmission (not the absorption
cross section) depends on the sample thickness, the absorption spectra need to be normalized in order to make them
comparable. The normalized absorption that is calculated from the measured transmission is then plotted as relative
intensities in arbitrary units. In principle, two ways of normalizing the spectra are viable: Normalized to the area of the near-
edge region between 530 eV and 550 eV (area normalization) or normalization to the edge-jump at a photon energy far above
the near edge, hence at 580-600 eV e.g. (edge-jump normalization, where the intensity oscillations due to the extended x-ray
absorption fine structure, EXAFS, are small compared to our experimental accuracy) [48, 52]. We note that normalization is
crucial to accurately determine small effects like those induced by isotope substitution in water. Determination of such small
effects is facilitated here with the membrane-based sample holder that allows preparation of thin liquid water films with
stable thickness over hours. We found that our spectra do not depend considerably on whether normalized at the edge jump
or by area. Still, because a priori we could not exclude that the near-edge area is changed by isotope substitution we decided
for edge-jump normalization.
With the difference spectrum (D2O-H2O) in Figure 1 (b) we show that isotope substitution effects are clearly concentrated to
the near-edge region and, more specifically, to photon energies of 534-540 eV. Indeed, the near edge area in the spectrum is
changed as evidenced by the exclusively negative difference. The zoom into the near-edge of the spectra in Figure 1 (c) and
their difference in Figure 1 (d) now illustrates the high quality of our XAS data and motivates analyzing the effects of ΔZPE
Page 5
5
and ΔZPD in more detail. For this we first concentrate on the ΔZPE shift of the pre-edge peak at 535 eV and analyze the
ΔZPD broadening later. As expected from the simple consideration of the ΔZPE shift effect [14] in the UV absorption spectra
and as measured before with XRS [1, 6] we observe the pre-edge peak to blue shift when going from liquid H2O to D2O.
However, we also note that this is not simply a blue shift as in this case a difference spectrum with equally intense negative
and positive intensities below and above 535 eV, respectively, was to be measured. The expected positive difference intensity
at above 535 eV could be compensated for by the apparent blue shift of the main edge (main peak in the spectrum at around
537-538 eV) and the corresponding negative difference intensity at 536 eV. However, also at the main edge we do not
observe the negative/positive differential spectrum as expected from a simple blue shift. This already points to limitations of
the simple concept of relating ΔZPE to these blue shifts in the O K-edge x-ray absorption spectra. This is further illustrated
by comparing the blue shift extracted from UV absorption to the shift in XAS. Before this we note that UV absorption
experiments resulted in different values of 110 to 200 meV. Franck and Wood determined a shift of between 110 and 150
meV in gaseous water [14] while in the liquid at ambient conditions the early studies resulted in values of 120 meV [16], 160
meV [15], 140-160 meV [18] while a more recent study gave 200 meV [19]. Recent calculations of the joint density of states
serving as an approximation to the UV absorption spectrum confirmed the 200 meV shift [20]. With the earlier XRS data an
independent determination of the shift of the O K-edge XAS was not possible but the order of magnitude of the XAS pre-
edge shift was found to agree with the UV absorption results. Here we aim at independently determine the shift in the O K-
edge absorption spectrum and this is demonstrated with Figure 2. We plot in Figure 2 (a) the first derivatives of the liquid
H2O and D2O spectra in the near edge region. As expected, they pass through zero at 535, 538 and 540 eV corresponding to
the aforementioned pre-edge and main-edge peaks and the previously discussed post-edge peak at 540 eV [1, 54, 55]. The
blue-shift of the liquid D2O spectrum with respect to the liquid H2O spectrum is clearly apparent and can be easily
determined for the pre-edge by shifting the derivative of D2O such that the root coincides with H2O (Figure 2 (b)). We find
for the so determined shift at the pre-edge peak a value of 117 meV and, taking into account uncertainties related to
normalization of the spectra and to fitting the energy regions around the roots with linear functions, we arrive at a blue shift
of 120±20 meV for the pre-edge shift. This value is somewhat smaller than the 200 meV shift based on recent UV absorption
spectra. Our data however also show that the shift determined with the main edge peak is not 120 meV: The root of the D2O
derivative shifted by 117 meV at the main edge does not coincide with the root of the H2O derivative as illustrated in Figure 2
(c). Linear fits of the H2O and D2O derivatives in the energy region displayed in Figure 2 (c) result in a blue shift of the main
edge in D2O with respect to H2O of 200±20 meV now in perfect agreement with the UV absorption data. These results
represent the first stringent determination of the ΔZPE related blue shift in the liquid water x-ray absorption spectrum at the
Page 6
6
O K-edge upon isotope substitution. Within our experimental uncertainties we find no shift at the post edge at 540 eV. We
also note that the ΔZPD related broadening effect for the pre-edge peak is already visible in Figure 2 (b): The derivative of
the D2O spectrum is steeper than that of the H2O spectrum as a result of the narrower square of the vibrational ground-state
wavefunction in D2O or, correspondingly, the broadening of the H2O pre-edge peak. This is analyzed in greater detail later
and we stay for the moment with the ΔZPE related blue shift. The shift at the pre-edge peak apparently is considerably
different from the shift at the main edge and the shift determined from UV absorption and we attempt to give a qualitative
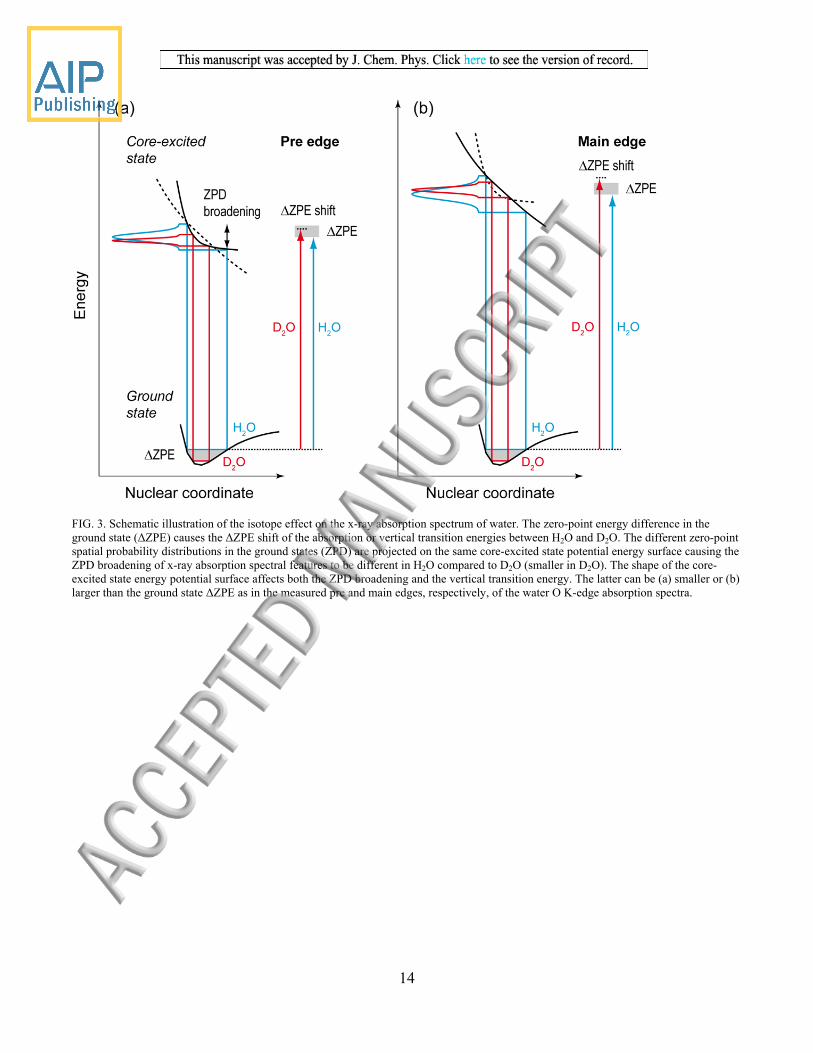
explanation with Figure 3 by considering the very basic approximations in relating ΔZPE and the spectral shift [14].
Following the graphical depiction for explaining the ΔZPE related blue shift in the O K-edge x-ray absorption spectrum of
water by Nilsson et al. [1] we plot qualitative potential energy curves for the pre and main edges of liquid water in Figures 3
(a) and (b), respectively. XAS measures the energy difference (the vertical transition energy or the “Franck-Condon vertical
transition”) between the electronic ground state (initial state) and the final (core-excited) state of the x-ray absorption process.
Although the nature of the reaction coordinate in the core-excited XAS final states is not precisely known as exact potential
energy curves are missing for liquid water, it can be concluded from previous discussions [1] and from a detailed study of the
water dimer [44] that all core-excited XAS final states are dissociative or only weakly bound. Hence the reaction coordinate
in Figure 3 for both the pre- and the main edge peak most likely is the intramolecular O-H/O-D distance. We concentrate our
analysis here on this coordinate but note that a discussion of ground-state fluctuations of structures in liquid water would
have to account for other distances and angles such as the H-O-H (D-O-D) angle in bending modes as well [9]. Following the
reasoning in [1] we note that there is no ΔZPE in the core excited states because they are dissociative for both the pre and the
main edge. A shift between the H2O and D2O spectra can thus be related to ground-state ΔZPE as illustrated in Figure 3. The
fact that the final state potentials in UV absorption are dissociative as well makes the values from XAS and UV absorption
comparable [1]. We believe, however, that the observed differences of the shifts at the pre and main edges points to the
limitations of this concept. First, and as noted before [1, 14, 18], the exact shape of the final state (core-excited in our case)
matters and, second, a more detailed description should take into account a calculation of the Franck-Condon factors of the
transition. We start by elaborating the first aspect.
Depending on the shape of the core-excited state potential energy curve, we can qualitatively predict that the XAS transition
energy can be smaller than the ground-state ΔZPE (for a particularly steep or steeply curved potential, Figure 3(a)) or larger
(or, equally possible, identical for a less steep potential, Figure 3(b)). Note that for both scenarios the XAS transition energy
in D2O is still larger than in H2O. What seems to matter for the line shift is the shape of the final state potential energy curve
Page 7
7
while the slope (without changing the shape) leaves the shift largely unaffected on the 100-200 meV scale discussed here.
This can be easily confirmed by evaluating the line shift with the potential from Figure 3 (b) and varying its slope. This
qualitative depiction of the shapes of the core-excited state potentials could explain the different shifts at pre and main edges
in the O K-edge x-ray absorption spectrum of water with a steeper (less steep) potential at the pre (main) edge. Indeed there is
experimental and theoretical indication for this qualitative difference of the potential curves. O K-edge XAS of liquid water
and ice measured by detecting the proton (H+) yield indicates how efficiently the water molecules are de-protonated for the
various photon energies in the spectrum. An increase of the proton-yield XAS intensity compared to the absorption cross
section could thus be interpreted to be an indirect measure of the dissociative nature of the pre- and main-edge core excited
states. In both liquid water and ice a much stronger pre-edge enhancement compared to the main-edge enhancement in
proton-yield XAS was found with respect to the absorption cross section [56-59]. Irrespective of the concrete H-bond
environment one could thus conclude that the core-excited states at the pre edge are more dissociative than at the main edge
in line with the interpretation of our findings. This is also in agreement with the assignment of the transitions at the pre-edge
peak to strongly antibonding molecular orbitals with 4a1 character [1, 54]. And it is in agreement with the theoretically
derived notion that the core-excited states at the main edge have Rydberg-like character with, correspondingly, spatially more
extended orbitals compared to the pre edge [43].
As noted before (second aspect to account for in a more detailed interpretation of the ΔZPE related blue shift), the vibrational
structure in the core-excited states and in particular the Franck-Condon factors are not accounted for in the so far used simple
conceptual depiction. Often, it already represents a challenge to theory to correctly describe the core-excited potentials. In
addition, usually it is not necessary to accurately treat the Franck-Condon structure in XAS and hence this is often omitted
for simplicity while first attempts have been realized for gaseous N2 [60] and the water dimer [44, 61] e.g..
Given the agreement of our main-edge shift of 200 meV with the recently calculated shift based on the joint density of states
of 200 meV the question occurs whether the agreement is coincidental or whether there may be a meaning to it. Concretely
the question is whether there is any reason to believe that the main-edge shift corresponds to the ground-state ΔZPE while the
pre-edge shift does not. Since the core-excited state potential at the pre edge is particularly dissociative and hence particularly
steeply curved in contrast to the main edge this could explain why the pre-edge shift does not correspond to ΔZPE while the
shift at the main edge does. This speculation could be further assessed by comparing the line shifts determined here with
calculations of the ground-state ΔZPE. The necessary link between the two properties could be made by accurate calculations
of the O K-edge x-ray absorption spectra of H2O and D2O with particular emphasize of accurately describing the core-excited
Page 8
8
state potentials at the pre and main edges including the Franck-Condon structure in the core-excited states. Evaluating the at
best qualitative agreement of state-of-the art calculations of the O K-edge x-ray absorption spectrum of liquid water with
experiment [38-45] shows that there is considerable improvement required in the theoretical descriptions to accurately
reproduce and explain the small but significant differences between light and heavy liquid water x-ray absorption spectra.
We now proceed with analyzing the ΔZPD related broadening in the O K-edge absorption spectra of liquid H2O and D2O
with Figures 4 and 5. In an attempt to analyze this effect separately from the ΔZPE related blue shift and following the
analysis of the earlier XRS spectra in [1, 6] we first shifted the D2O spectrum to lower energies to “correct” for the shift
(Figure 4 (a)) and then evaluated the broadening quantitatively by comparing shifted and broadened D2O spectra with the
H2O spectrum (Figure 4 (b)). The analysis aims at minimizing both the oscillation amplitudes and the integrated difference
between the shifted D2O and the H2O spectra in order to determine the broadening of the H2O spectrum with respect to D2O.
The first observation we make in the spectra shown in Figure 4 (b) is that the previously used broadening of the D2O
spectrum of 0.5 eV (throughout this paper Gaussian FWHM values are used) apparently is too large to explain the broadening
of the H2O spectrum compared to D2O: The oscillation amplitudes in the resulting difference spectrum are clearly larger than
for no broadening. A broadening of the D2O spectrum by 0.23 eV instead results in the smallest number of oscillations and
the smallest oscillation amplitudes hence a minimal integrated difference spectrum. The remaining spectral differences (lower
pre and main edge in D2O compared to H2O) could now be interpreted as reflecting differences in the geometric and
electronic structures between the two liquids due to isotope substitution. Indeed, they coincide with the generally accepted
notion that the H-bond environment in D2O is similar to H2O but for a temperature that is lower by approximately 5 degrees
[6]. This is evident when comparing the effects caused by isotope substitution (Figure 4 (a)) and caused by a change in
temperature [1, 48, 54]. Further discussion of this comparison goes beyond the scope of this paper. We note that the main
edge seems less affected by broadening than the pre edge while the post edge seems completely unaffected. This may be due
to larger inhomogeneous broadening at these edges compared to the pre edge. Due to the larger spatial extent of the related
orbitals structural fluctuations in the liquids could be picked up more effectively at the main and post edges compared to the
pre edge.
As noted before, the detailed intensity differences throughout the spectra of liquid H2O and D2O on the level of accuracy
discussed here may depend on how the spectra were normalized and we address this uncertainty with the data in Figure 5
with the aim to accurately determine the ΔZPD related broadening. The integrated D2O-H2O differences (difference spectra
of shifted and broadened D2O minus H2O and integrated over the indicated photon energy range) are shown for four different
Page 9
9
ways of area and intensity or edge-jump normalization and versus various broadenings of the D2O spectrum between 0 and
0.5 eV. Apparently the integrated difference strongly depends on the normalization as is evident by the fact that four curves
are strongly offset in the vertical. However, we also find that the dependence of the integrated difference with broadening of
the D2O spectrum follows the same trend irrespective of normalization with a minimal difference at broadening values of
between 0.2 and 0.26 eV (legend in Figure 5) with a slow increase to lower values and a steep increase for larger values. This
makes us confident that the broadening resulting in a minimal integrated difference can be meaningfully extracted from this
analysis. As a mean of the four values we find that the difference between the shifted and broadened D2O spectrum and the
H2O spectrum is minimal for a broadening of the D2O spectrum of 0.23±0.05 eV where the uncertainty stems from the
differences in minimal broadening for different ways of normalization. This represents the first stringent determination of the
ΔZPD related broadening of the O K-edge x-ray absorption spectrum of water and could be used to test forthcoming
calculations by relating the ground-state ΔZPD and the shape of the spectrum. The determination of this broadening value is
more accurate than in the earlier investigations based on the XRS spectra, we believe, due to the higher resolution achieved
here with transmission-mode XAS [1, 6]. Closer inspection of the transmission-mode XAS difference spectra in Figure 4
reveals that they are different from the XRS difference spectra. This motivates comparing in more detail the spectra of the
different methods in order to also conclude on the generality of the extracted values for the ΔZPE related shift and the ΔZPD
related broadening or whether they could depend on the experimental method used.
The O K-edge absorption spectra of light and heavy liquid water and their differences as measured here with transmission-
mode XAS are compared to the earlier XRS spectra in Figure 6. In order to facilitate the analysis we compare in Figures 6 (a)
and (b) the spectra of H2O and D2O for the same area normalization as in [1]. Deviations between the spectra from the
different methods are apparent throughout the displayed photon energy range with higher pre and main edges and a
somewhat reduced intensity at or above the post edge in the XRS spectra compared to the XAS spectra. In particular the
differences at the pre and main edges could be explained by the lower spectral resolution in XRS compared to XAS.
Furthermore, small remaining non-dipole contributions to the XRS spectrum could be the reason for the deviations although
non-dipole effects were minimized as described in [1, 6]. Related, or more generally, to first approximation XRS and XAS
coincide in what is probed and the deviations observed here may point to deviations from this approximation. Interestingly
though, the D2O-H2O difference spectra from XAS and XRS almost perfectly coincide as evidenced with Figure 6 (c) for the
raw D2O minus H2O difference and Figure 6 (d) for the difference of shifted and broadened D2O minus H2O. Note that the
difference spectrum in Figure 6 (d) is different from the difference spectrum in Figure 4 (b, red line) due to the difference in
normalization used. The ΔZPE related shift and the ΔZPD related broadening can be more reliably determined with
Page 10
10
transmission-mode XAS but, once spectra have been corrected for them, we find that the remaining differences between
liquid H2O and D2O O K-edge x-ray absorption spectra can be interpreted equally well with XRS or XAS in terms of
remaining structural differences or differences in H-bond environment between light and heavy liquid water. This is the case
in particular for the small intensity change upon isotope substitution in the post-edge region of the spectrum (Figure 6 (c) and
(d)), which is essential in terms of structural interpretation [1]. Based on our analysis here we can claim that any difference of
0.5 % or larger between shift- and broadening corrected and normalized spectra can be reliably related to these structural
differences. For that it will be interesting to test new calculations also in terms of these structural effects against the
difference spectra shown in Figure 6 (d) (for area normalized calculated spectra) or in Figure 4 (b, red line) (for edge-jump
normalized calculated spectra). We finally note in agreement with previous assessments from neutron scattering [2] and XAS
[1] that we believe it is adequate for the interpretation of the observed isotope effects to stay within the Born-Oppenheimer
approximation. In particular, the structural differences and the XAS differences between light and heavy liquid water can be
explained by the differences arising from the ZPE differences in the electronic ground states in the anharmonic O-H/D
potential (Figure 3) [9]. Still, it will be interesting in future calculations of XAS of light and heavy liquid water to quantify
the effect of isotope substitution in the core-excited states in particular through vibronic coupling.
IV. SUMMARY AND CONCLUSIONS
We applied X-ray absorption spectroscopy at the O K-edge in transmission mode to light and heavy liquid water to address
the spectral effects related to isotope substitution in the liquid. Confirming earlier results based on x-ray Raman scattering
experiments we find the D2O spectrum to be blue shifted with respect to H2O and the D2O spectrum to be less broadened than
the H2O spectrum. Following the conceptual explanation of the related shift and broadening effects in UV absorption spectra
the shift is related to the difference in ground-state zero-point energies between D2O and H2O while the difference in
broadening is related to the difference in ground-state vibrational zero-point distributions. The shift in the O K-edge
absorption spectrum is accurately determined separately for two absorption edges in the spectrum (the pre and the main edge)
and a significant difference is observed. This is discussed and qualitatively explained by addressing the limitations of the
conceptual explanation by, in particular, evoking the influence of the shape of the final-state potential. A more strongly
curved potential for the final states at the pre edge is thought to cause a shift smaller than the ground-state zero-point energy
difference while a less strongly curved potential for the main edge could result in a shift equal to or even larger than the
ground-state zero-point energy difference. We also accurately determine the broadening effect related to the difference in
ground-state vibrational zero-point distributions between liquid H2O and D2O. Both extracted values of the blue shift and the
Page 11
11
broadening could be used in the future to stringently test new calculations of ground-state zero-point energies and vibrational
zero-point distributions in H2O and D2O. As a link between the experimental observables of shift and broadening and the
ground-state properties, new calculations of the O K-edge x-ray absorption spectra of liquid H2O and D2O are deemed
necessary. Proper description of the final core-excited state potentials and inclusion of the Franck-Condon structure seems
necessary to reproduce the small spectral differences determined experimentally. In addition, we correct the O K-edge
absorption spectra for the shift and broadening effects. These benchmark spectra reflect the remaining structural differences
between liquid H2O and D2O resulting from different environments due to the different hydrogen-bond fluctuations in the
liquids and could serve to quantify the possible influence of nuclear quantum effects on the structures of light and heavy
liquid water.
Page 12
12
FIGURES
FIG. 1. (a) O K-edge x-ray absorption spectra of liquid H2O and D2O measured in transmission mode at room temperature. The spectra are normalized to the same intensity at 580-600 eV. (b) D2O-H2O difference of the spectra in (a). (c) and (d) Zooms into the near-edge regions of the spectra in (a) and (b).
Page 13
13
FIG. 2. (a) Derivatives of the liquid H2O (blue) and D2O (red) O K-edge x-ray absorption spectra from Figure 1. For comparison the derivative of the D2O spectrum shifted by -117 meV (green) is displayed. (b) Zoom into the pre-edge region around 535 eV. (c) Zoom into the main-edge region around 538 eV.
Page 14
14
FIG. 3. Schematic illustration of the isotope effect on the x-ray absorption spectrum of water. The zero-point energy difference in the ground state (ΔZPE) causes the ΔZPE shift of the absorption or vertical transition energies between H2O and D2O. The different zero-point spatial probability distributions in the ground states (ZPD) are projected on the same core-excited state potential energy surface causing the ZPD broadening of x-ray absorption spectral features to be different in H2O compared to D2O (smaller in D2O). The shape of the core-excited state energy potential surface affects both the ZPD broadening and the vertical transition energy. The latter can be (a) smaller or (b) larger than the ground state ΔZPE as in the measured pre and main edges, respectively, of the water O K-edge absorption spectra.
Page 15
15
FIG. 4. (a) O K-edge x-ray absorption spectra of liquid H2O and D2O where the D2O spectrum was shifted by -120 meV and broadened with a Gaussian of 0.23 eV FWHM compared to the spectrum in Figure 1. The spectra are normalized to the same intensity at 580-600 eV (see Figure 1). (b) D2O-H2O differences of the spectra in (a) for different broadenings of the D2O spectrum prior to performing the difference: FWHM of 0.23 eV (red), 0 eV (blue, unbroadened case) and 0.50 eV (green). In all cases the D2O spectrum was shifted by -120 meV prior to performing the difference.
.
Page 16
16
FIG. 5. Integrated D2O-H2O differences (absolute value) with integration over the photon energy range from 530 – 550 eV versus the Gaussian FWHM in eV used to broaden the D2O spectrum prior to performing the difference and integrating it. The four curves reflect four different normalization procedures for normalizing the H2O and D2O spectra prior to performing the difference and integrating it [the differences for 0, 0.23 and 0.5 eV broadening are shown for intensity normalization at 580-600 eV in Figure 4 (b)]. The minimum of each curve (broadening where the integrated difference is smallest) is given in the legend. The gray region marks the mean value of broadening at minimum integrated difference (0.23 eV) including uncertainties introduced by the different ways of normalizing the spectra (±0.05). The D2O spectrum was shifted by -120 meV in all cases prior to performing the differences and integrating them.
Page 17
17
FIG. 6. (a) Liquid H2O and (b) liquid D2O O K-edge x-ray absorption spectra measured with transmission-mode x-ray absorption spectroscopy (XAS, solid line, this work) and with x-ray Raman scattering (XRS, dashed line, ref. [1]). The spectra are normalized to the same area in the region from 530 eV to 550 eV as it was done in ref. [1]. (c) D2O-H2O difference of the spectra in (a) and (b) for XAS (solid line, this work) and with XRS (dashed line, ref. [1]). (d) D2O-H2O difference minimized by shifting and broadening the D2O spectrum prior to performing the difference for XAS (solid line, this work, -120 meV shift, 0.23 eV broadening) and with XRS (dashed line, ref. [1], 160 meV shift and 0.5 eV broadening). The XAS difference in (c) and the minimized XAS difference in (d) are different from the respective differences in Figure 1 (d) and Figure 4 (b) due to the different normalizations of the spectra prior to performing the differences.
Page 18
18
ACKNOWLEDGMENTS
We gratefully acknowledge the continuous support by the BESSY II staff and we thank HZB for the allocation of
synchrotron radiation beamtime. We are grateful in particular to Christian Weniger for providing the silicon nitride
membranes. We thank L. G. M. Pettersson and A. Nilsson for fruitful discussions.
REFERENCES
1. Nilsson, A., et al., X-ray absorption spectroscopy and X-ray Raman scattering of water and ice; an experimental
view. Journal of Electron Spectroscopy and Related Phenomena, 2010. 177(2-3): p. 99-129.
2. Soper, A.K. and C.J. Benmore, Quantum Differences between Heavy and Light Water. Phys Rev Lett, 2008. 101(6):
p. 065502.
3. Nagata, Y., et al., Nuclear quantum effects affect bond orientation of water at the water-vapor interface. Phys Rev
Lett, 2012. 109(22): p. 226101.
4. Gainarua, C., et al., Anomalously large isotope effect in the glass transition of water. Proceedings of the National
Academy of Sciences, 2014. 111(49): p. 17402-17407.
5. Hardy, E.H., et al., Isotope effect on the translational and rotational motion in liquid water and ammonia. The
Journal of Chemical Physics, 2001. 114(7): p. 3174.
6. Bergmann, U., et al., Isotope effects in liquid water probed by x-ray Raman spectroscopy. Physical Review B, 2007.
76(2).
7. Giuliani, A., et al., Quantum effects and the local environment of water hydrogen: Deep inelastic neutron scattering
study. Physical Review B, 2012. 86(10).
8. Nibbering, E.T.J. and T. Elsaesser, Ultrafast Vibrational Dynamics of Hydrogen Bonds in the Condensed Phase.
Chem Rev, 2004. 104: p. 1887-1914.
9. Ceriotti, M., et al., Nuclear Quantum Effects in Water and Aqueous Systems: Experiment, Theory, and Current
Challenges. Chem Rev, 2016.
Page 19
19
10. Giberti, F., et al., The role of quantum effects on structural and electronic fluctuations in neat and charged water. J
Phys Chem B, 2014. 118(46): p. 13226-35.
11. Li, X.Z., B. Walker, and A. Michaelides, Quantum nature of the hydrogen bond. Proceedings of the National
Academy of Sciences, 2011. 108(16): p. 6369-6373.
12. Nilsson, A. and L.G.M. Pettersson, The structural origin of anomalous properties of liquid water. Nat Commun,
2015. 6: p. 8998.
13. Nilsson, A. and L.G.M. Pettersson, Perspective on the structure of liquid water. Chemical Physics, 2011. 389(1-3):
p. 1-34.
14. Franck, J. and R.W. Wood, Ultraviolet Absorption of Heavy Water Vapor. Physical Review, 1934. 45(10): p. 667-
668.
15. Fox, M.F. and E. Hayon, Far-Ultraviolet Solvent Spectroscopy. J Phys Chem, 1972. 76(19): p. 2703-2750.
16. Verrall, R.E., Vacuum-Ultraviolet Study of Liquid H2O and D2O. The Journal of Chemical Physics, 1969. 50(6): p.
2746.
17. Compton, R.N., et al., Threshold Electron Impact Excitation of Atoms and Molecules: Detection of Triplet and
Temporary Negative Ion States. The Journal of Chemical Physics, 1968. 48(2): p. 901-909.
18. Heller, J.M., R.D. Birkhoff, and L.R. Painter, Isotopic effects on the electronic properties of H2O and D2O in the
vacuum uv. The Journal of Chemical Physics, 1977. 67(5): p. 1858.
19. Marin, T.W., K. Takahashi, and D.M. Bartels, Temperature and density dependence of the light and heavy water
ultraviolet absorption edge. J Chem Phys, 2006. 125(10): p. 104314.
20. Del Ben, M., J. Hutter, and J. VandeVondele, Probing the structural and dynamical properties of liquid water with
models including non-local electron correlation. J Chem Phys, 2015. 143: p. 054506.
21. Bartels, D.M. and R.A. Crowell, Photoionization Yield vs Energy in H2O and D2O. J Phys Chem A, 2000. 104: p.
3349-3355.
Page 20
20
22. Elles, C.G., et al., Excitation-energy dependence of the mechanism for two-photon ionization of liquid H(2)O and
D(2)O from 8.3 to 12.4 eV. J Chem Phys, 2006. 125(4): p. 44515.
23. Lian, R., R.A. Crowell, and I.A. Shkrob, Solvation and Thermalization of Electrons Generated by above-the-Gap
(12.4 eV) Two-Photon Ionization of Liquid H2O and D2O. J Phys Chem A, 2005. 109: p. 1510-1520.
24. Sander, M.U., et al., Liquid water ionization: mechanistic implications of the H/D isotope effect in the geminate
recombination of hydrated. Chemical Physics, 2000. 258: p. 257-265.
25. Fransson, T., et al., X-ray and Electron Spectroscopy of Water. Chem Rev, 2016.
26. Fuchs, O., et al., Isotope and temperature effects in liquid water probed by x-ray absorption and resonant x-ray
emission spectroscopy. Phys Rev Lett, 2008. 100(2): p. 027801.
27. Harada, Y., et al., Selective probing of the OH or OD stretch vibration in liquid water using resonant inelastic soft-
x-ray scattering. Phys Rev Lett, 2013. 111(19): p. 193001.
28. Huang, C., et al., Increasing correlation length in bulk supercooled H2O, D2O, and NaCl solution determined from
small angle x-ray scattering. J Chem Phys, 2010. 133(13): p. 134504.
29. Lange, K.M., et al., X-ray emission from pure and dilute H2O and D2O in a liquid microjet: Hydrogen bonds and
nuclear dynamics. Physical Review B, 2012. 85(15).
30. Nilsson, A., et al., Resonant inelastic X-ray scattering of liquid water. Journal of Electron Spectroscopy and Related
Phenomena, 2013. 188: p. 84-100.
31. Nishizawa, K., et al., High-resolution soft X-ray photoelectron spectroscopy of liquid water. Phys Chem Chem
Phys, 2011. 13(2): p. 413-7.
32. Nygard, K., et al., Isotope quantum effects in the electron momentum density of water. J Chem Phys, 2007. 126(15):
p. 154508.
33. Thurmer, S., et al., On the nature and origin of dicationic, charge-separated species formed in liquid water on X-ray
irradiation. Nat Chem, 2013. 5(7): p. 590-6.
Page 21
21
34. Tokushima, T., et al., High resolution X-ray emission spectroscopy of liquid water: The observation of two
structural motifs. Chemical Physics Letters, 2008. 460(4-6): p. 387-400.
35. Tokushima, T., et al., Polarization dependent resonant x-ray emission spectroscopy of D2O and H2O water:
assignment of the local molecular orbital symmetry. J Chem Phys, 2012. 136(4): p. 044517.
36. Tse, J.S., et al., X-ray Raman spectroscopic study of water in the condensed phases. Phys Rev Lett, 2008. 100(9): p.
095502.
37. Weinhardt, L., et al., Nuclear dynamics and spectator effects in resonant inelastic soft x-ray scattering of gas-phase
water molecules. J Chem Phys, 2012. 136(14): p. 144311.
38. Fransson, T., et al., Requirements of first-principles calculations of X-ray absorption spectra of liquid water. Phys
Chem Chem Phys, 2016. 18(1): p. 566-83.
39. Hetenyi, B., et al., Calculation of near-edge x-ray-absorption fine structure at finite temperatures: spectral
signatures of hydrogen bond breaking in liquid water. J Chem Phys, 2004. 120(18): p. 8632-7.
40. Iannuzzi, M., X-ray absorption spectra of hexagonal ice and liquid water by all-electron Gaussian and augmented
plane wave calculations. J Chem Phys, 2008. 128(20): p. 204506.
41. Kong, L., X. Wu, and R. Car, Roles of quantum nuclei and inhomogeneous screening in the x-ray absorption spectra
of water and ice. Physical Review B, 2012. 86(13).
42. Kuhne, T.D. and R.Z. Khaliullin, Electronic signature of the instantaneous asymmetry in the first coordination shell
of liquid water. Nat Commun, 2013. 4: p. 1450.
43. Leetmaa, M., et al., Theoretical approximations to X-ray absorption spectroscopy of liquid water and ice. Journal of
Electron Spectroscopy and Related Phenomena, 2010. 177(2-3): p. 135-157.
44. Ljungberg, M.P., L.G.M. Pettersson, and A. Nilsson, Vibrational interference effects in x-ray emission of a model
water dimer: implications for the interpretation of the liquid spectrum. J Chem Phys, 2011. 134(4): p. 044513.
Page 22
22
45. Prendergast, D. and G. Galli, X-ray absorption spectra of water from first principles calculations. Phys Rev Lett,
2006. 96(21): p. 215502.
46. Gavrila, G., et al., Time-resolved X-ray absorption spectroscopy of infrared-laser-induced temperature jumps in
liquid water. Applied Physics A, 2009. 96(1): p. 11-18.
47. Huse, N., et al., Probing the hydrogen-bond network of water via time-resolved soft X-ray spectroscopy. Phys Chem
Chem Phys, 2009. 11(20): p. 3951-7.
48. Meibohm, J., S. Schreck, and P. Wernet, Temperature dependent soft x-ray absorption spectroscopy of liquids. Rev
Sci Instrum, 2014. 85(10): p. 103102.
49. Nagasaka, M., et al., Development of a liquid flow cell to measure soft X-ray absorption in transmission mode: A
test for liquid water. Journal of Electron Spectroscopy and Related Phenomena, 2010. 177(2-3): p. 130-134.
50. Nagasaka, M., H. Yuzawa, and N. Kosugi, Development and application of in situ/operando soft X-ray transmission
cells to aqueous solutions and catalytic and electrochemical reactions. Journal of Electron Spectroscopy and Related
Phenomena, 2015. 200: p. 293-310.
51. Näslund, L.Å., et al., X-ray Absorption Spectroscopy Measurements of Liquid Water. J Phys Chem B, 2005. 109: p.
13835-13839.
52. Schreck, S., et al., A sample holder for soft x-ray absorption spectroscopy of liquids in transmission mode. Rev Sci
Instrum, 2011. 82(10): p. 103101.
53. Wernet, P., et al., Ultrafast temperature jump in liquid water studied by a novel infrared pump-x-ray probe
technique. Applied Physics A, 2008. 92(3): p. 511-516.
54. Wernet, P., et al., The structure of the First Coordination Shell in Liquid Water. Science, 2004. 304: p. 995-999.
55. Myneni, S., et al., Spectroscopic probing of local hydrogen-bonding structures in liquid water. J Phys Condens
Matter, 2002. 14: p. L213-L219.
Page 23
23
56. Coulman, D., et al., Excitation, deexcitation, and fragmentation in the core region of condensed and adsorbed
water. The Journal of Chemical Physics, 1990. 93(1): p. 58.
57. Parent, P., et al., Structure of the water ice surface studied by x-ray absorption spectroscopy at the O K-edge. The
Journal of Chemical Physics, 2002. 117(23): p. 10842.
58. Romberg, R., et al., Photon stimulated desorption of neutral hydrogen atoms from condensed water and ammonia
by resonant O1s and N1s excitation: search for the signature of ultrafast bond breaking. Surface Science, 2000. 451: p. 116-
123.
59. Wilson, K.R., et al., X-ray Spectroscopy of Liquid Water Microjets. J phys Chem B, 2001. 105: p. 3346-3349.
60. Fatehi, S., et al., Nuclear quantum effects in the structure and lineshapes of the N2 near-edge x-ray absorption fine
structure spectrum. J Chem Phys, 2010. 132(9): p. 094302.
61. Felicı́ssimo, V.C., et al., A theoretical study of the role of the hydrogen bond on core ionization of the water dimer.
Chemical Physics, 2005. 312(1-3): p. 311-318.
Page 24
0
0.2
0.4
0.6
0.8
1
Abs
orpt
ion
(a.u
.)
535 540 545 550
0.00− 0.05− 0.10
Photon energy (eV)
Diff
eren
ceA
bsor
ptio
n(a
.u.)
530 540 550 560 570 580 590Photon energy (eV)
Diff
eren
ce
0
0.2
0.4
0.6
0.8
1
0.00
− 0.05
− 0.10
H2OD2O
H2OD2O
(a)
(b)
(c)
(d)
Near edge
Edge jump
Pre
MainPost
Page 25
8x10⁻²
6
4
2
0
-2
Inte
nsity
(arb
. uni
ts)
550545540535Photon energy (eV)
Derivatives H2O D2O D2O shifted by -0.117 eV
535.3
4
2
0
-2Inte
nsity
(arb
. uni
ts)
535.0534.7
Photon energy (eV)
H2O D2O D2Oshifted-0.117 eV
x10-2
-4
-2
0
2
538.5538.0537.5Photon energy (eV)
H2O D2O D2Oshifted-0.117 eV
x10-3
(a)
(b) (c)
Pre
Main Post
Pre Main
Page 26
Nuclear coordinate
(b)
Nuclear coordinate
Ene
rgy
Groundstate
Core-excitedstate
ZPDbroadening
∆ZPE D2O
H2O
(a)
D2O
H2O
∆ZPE shift∆ZPE
∆ZPE shift∆ZPE
Pre edge Main edge
D2O H2O D2O H2O
Page 27
0
0.2
0.4
0.6
0.8
1
Abs
orpt
ion
(a.u
.)
535 540 545 550
0.00
− 0.05
Photon energy in eV
Diff
eren
ce
0 eV 0.50 eV0.23 eVBroadening
H2O
D2O (shifted, broadened)
(a)
(b)
Page 28
0.30
0.35
0.40
0.45
0.23 ± 0.05
FWHM (eV)
Inte
grat
ed d
iffer
ence
Area normalizationuntil 550 eVMinimum at 0.26 eV
Intensity normalizationat 580-600eVMinimum at 0.20 eV
Intensity normalizationat 550 eVMinimum at 0.23 eV
Area normalizationuntil 600 eVMinimum at 0.21 eV
0 0.25 0.5
Page 29
0
0.2
0.4
0.6
0.8
1 (a)
Abs
orpt
ion
(a.u
.)
XASXRS
0
0.2
0.4
0.6
0.8
1 (b)
Abs
orpt
ion
(a.u
.)
XASXRS
− 0.10− 0.05
0.000.05 (c)
XAS XRS
535 540 545 550
− 0.02
0.00
0.02 (d)
Photon energy (eV)
Diff
eren
ce
XAS XRS
H2O
D2O