1 Isotope Explorer Users Manual S.Y.F. Chu * , R.B. Firestone * , and L.P. Ekström *% * Isotopes Project, Lawrence Berkeley National Laboratory, Berkeley, CA % Department of Physics, Lund University, Sweden Isotope Explorer Version 2.2 December 1998 CONTENTS I. Introduction II. Installation of Isotope Explorer III. Getting Started A. Reading Nuclide Data B. Viewing Data IV. Accessing Data A. Internet Transfer B. Data from Local Disk or the Table of Isotopes CD-ROM C. Isotope Explorer as Helper Application to a Web Browser V. Level Scheme Mode A. The Menu Bar B. The Tool Bar C. Manipulation of Display Drawings D. Shortcuts E. Operation: Coincidence F. Operation: Set Energy Gate. G. Operation: Logical Operation H. Data: Select Band(s) I. Data: Selecting Levels VI. Table Mode A. The Menu Bar B. The Tool Bar C. Controlling Table Appearance VII. Plot Mode VIII. Editor Mode XI. The Chart Interface A. The Menu Bar B. The Tool Bar C. Chart Databases D. Creating a Chart E. Controlling Chart Color Scheme F. The Chart Files X. The Script Language A. General Rules B. Command Language C. Examples D. Predefined Functions 1. Rules 2. Examples E. Chart User-Interface F. The Data Files XI. Literature References XII. Preview and Printing XIII. Technical Issues A. Data Transfer B. Security C. The ISOEXPL.INI File XIV. Acknowledgements
Transcript
1
Isotope Explorer Users Manual
S.Y.F. Chu*, R.B. Firestone*, and L.P. Ekström*%
*Isotopes Project, Lawrence Berkeley National Laboratory, Berkeley, CA%Department of Physics, Lund University, Sweden
Isotope Explorer Version 2.2December 1998
CONTENTS
I. IntroductionII. Installation of Isotope ExplorerIII. Getting Started
A. Reading Nuclide DataB. Viewing Data
IV. Accessing DataA. Internet TransferB. Data from Local Disk or the
Table of Isotopes CD-ROMC. Isotope Explorer as Helper
Application to a Web BrowserV. Level Scheme Mode
A. The Menu BarB. The Tool BarC. Manipulation of Display
DrawingsD. ShortcutsE. Operation: CoincidenceF. Operation: Set Energy Gate.G. Operation: Logical OperationH. Data: Select Band(s)I. Data: Selecting Levels
VI. Table ModeA. The Menu BarB. The Tool BarC. Controlling Table Appearance
VII. Plot ModeVIII. Editor ModeXI. The Chart Interface
A. The Menu BarB. The Tool BarC. Chart DatabasesD. Creating a ChartE. Controlling Chart Color SchemeF. The Chart Files
X. The Script LanguageA. General RulesB. Command LanguageC. ExamplesD. Predefined Functions
1. Rules2. Examples
E. Chart User-InterfaceF. The Data Files
XI. Literature ReferencesXII. Preview and PrintingXIII. Technical Issues
A. Data TransferB. SecurityC. The ISOEXPL.INI File
XIV. Acknowledgements
2
I. Introduction
The Isotope Explorer (previously called VuENSDF) is a 32-bit Windows program for retrieving,displaying, listing, manipulating and searching nuclear structure and decay data. Informationfrom the Evaluated Nuclear Structure Data File (ENSDF) and the Nuclear Science Reference file(NSR) can be viewed with Isotope Explorer.
Data can be traced to the original publications through keynumbers contained in the ENSDF file.These keynumbers are decoded into complete references using the NSR file. The NSR file canbe searched by author, isotope, subject, keyword, and publication year.
Isotope Explorer also supports a chart data format with a chart interface that serves as analternative user interface for selecting nuclides, bands, etc., and a general tool for preparingnuclear charts. It is provided with a script language which makes the chart interface a verypowerful tool for displaying systematic trends of nuclear properties, for producing custom-madenuclear charts, and for selecting data for display by the program.
In addition to displaying ENSDF data, Isotope Explorer can also retrieve data by nuclearproperties from the ENSDF database with the script language. These properties can bedisplayed with color coding on a nuclear chart. Functions can also be defined with the scriptlanguage to perform calculations with the retrieved data.
Isotope Explorer supports a variety of data sources to
• Access the Table of Isotopes databases directly via the WWW Internet from the Berkeley or Lund (Sweden) servers.
• Use data from a local disk (e.g. from the Table of Isotopes CD-ROM). The ENSDF database on the 1999 update CD-ROM was retrieved from the National Nuclear Data Center (NNDC) at Brookhaven National Laboratory September, 1998, and the NSR database was retrieved from the NNDC December, 1998.
• Operate as a helper application for WWW browsers to access and display ENSDF format data directly from the WWW.
• Read chart data from standard experimental, theoretical, or user-generated databases and display horizontal properties by color-coding a nuclear chart.
II. Installation of Isotope Explorer
Isotope Explorer requires a Windows 95 or NT operating system. VuENSDF 1.0, available forWindows 3.1, has only limited capabilities. At least 8 MB of RAM and a Pentium processor arerecommended. To install Isotope Explorer copy the toi/www/isoexpl/IsoExpl.exe to a directory onyour hard disk and run this file. The file will automatically be decompressed and installedappropriately on your hard disk. Alternatively, Isotope Explorer can be installed directly from alink on the Table of Isotopes local Internet home page. Periodic updates of the Isotope Explorersoftware are posted at the WWW Table of Isotopes home page at
(http://ie.lbl.gov/toi.html).
2
III. Getting Started
Reading Nuclide DataWhen Isotope Explorer is launched, it displays an empty screen with most menus disabled.
If you have ENSDF files stored locally, you may open them with File, Open local file... on themenu bar, and the level scheme drawing of the first data set in the file will be displayed on thescreen. You can also choose to open a chart file; the program will display a nuclear chart insteadof a level scheme.
Alternatively, you may select a nuclide by clicking the Nucleus button. Depending on the settingin the Configuration menu, the program will then look for the data on the local disk or transferdata via the Internet. The latter requires an active connection to the Internet.
Viewing DataIsotope Explorer has many options that change the way data are displayed. You may selectsubsets of the data, e.g. rotational bands (Data, Band...), or you may choose to see the data intablular form (AddView..., Table).
Isotope Explorer can also display nuclear charts prepared either using existing chart files or chartfiles created by retrieving data from ENSDF using a script language.
IV. Accessing Data
There are three ways to access nuclear data for use with the Isotope Explorer:
• Transfer data via the Internet from a HTTP-server• Use data stored on a local disk or CD-ROM• Obtain data from the WWW, with Isotope Explorer working as a helper application for the browser
Internet TransferData can be transferred directly by Isotope Explorer from the LBNL Isotopes Project Web server.
If the file CATALOG0.LOG (see Isotope Explorer files) is available, the user can select anavailable nuclide from the File, Select Nucleus menu.
3
The user first selects a database by choosing from three options:
As decay parent − ENSDF decay data sets indexed by parent nucleus
As daughter or reaction product − ENSDF data sets indexed by daughter nucleus (final nucleus)
With superdeformed bands − A frequently updated database containing superdeformed band information
The user can then enter the nuclide specification (e.g. 60Co) in the text box. While the user iswriting the mass number of the nuclide, the program displays pre-existing entries in the list boxbelow. The intended nuclide may be selected by double-clicking the corresponding entry in thelist box.
Data from Local Disk or the Table of Isotopes CD-ROMA locally stored file in the ENSDF or ENSDF/2 format is opened using the File, Open local file…menu.
The entire ENSDF database is available in a convenient form on the Table of Isotopes CD-ROM.When this data structure is used, the nuclide can be selected with the command File, SelectNucleus.
Isotope Explorer as Helper Application to a Web BrowserNuclear data files can be distributed on the WWW in the ENSDF, ENSDF/2 format or as chartdatabases. The Web browser will recognize these file types, and launch Isotope Explorerprovided that
1. The server has been configured to transmit MIME type Application/ENSDF for ENSDF (extension .ENS), ENSDF/2 (extension .ENX) files and chart files (extension .CHR).
2. The browser has been configured to launch Isotope Explorer for the MIME type Application/ENSDF with extensions .ENS, .ENX and .CHR.
4
V. Level Scheme Mode
After selecting “Nucleus” and choosing a nuclide, that nuclide’s level scheme will be drawn as inthe following example.
The arrows at the bottom can be dragged horizontally by the arrow-cursor to adjust the width ofthe different areas of the level scheme-the spin/parity label, the gammas area, and the energylabel.
If the decay scheme contained many gammas, it would become too crowded to display themsimultaneously. Therefore, the program displays only one row or layer of gammas in thegammas area, and other transitions are indicated with an arrowhead at the initial level. Thefollowing tool bar buttons are provided to facilitate browsing through these layers.
The Menu BarThe Menu bar for the drawing mode has the following entries:
The menus and the equivalent item in the tool bar (if available) are described as follows.
File menu
Get Reference − Decode the NSR Keynumber(s) or search for NSR Authors
Select Nucleus − Get nuclide data
5
File menu (continued)
New chart − Not yet implementedOpen chart − Open an existing chartOpen local file − Open a local data fileSave as − Not yet implementedClose − Close the active windowPrint − Print the current viewPrint preview − Print preview the current viewPrinter setup − Change printer or properties of the current printer..... − Open recently used filesExit − Exit Isotope Explorer
Edit menu
Undo − Undo the last operation
Set Scale − Set the vertical scaleSet Layer − Set layer for gamma display
Operation menu
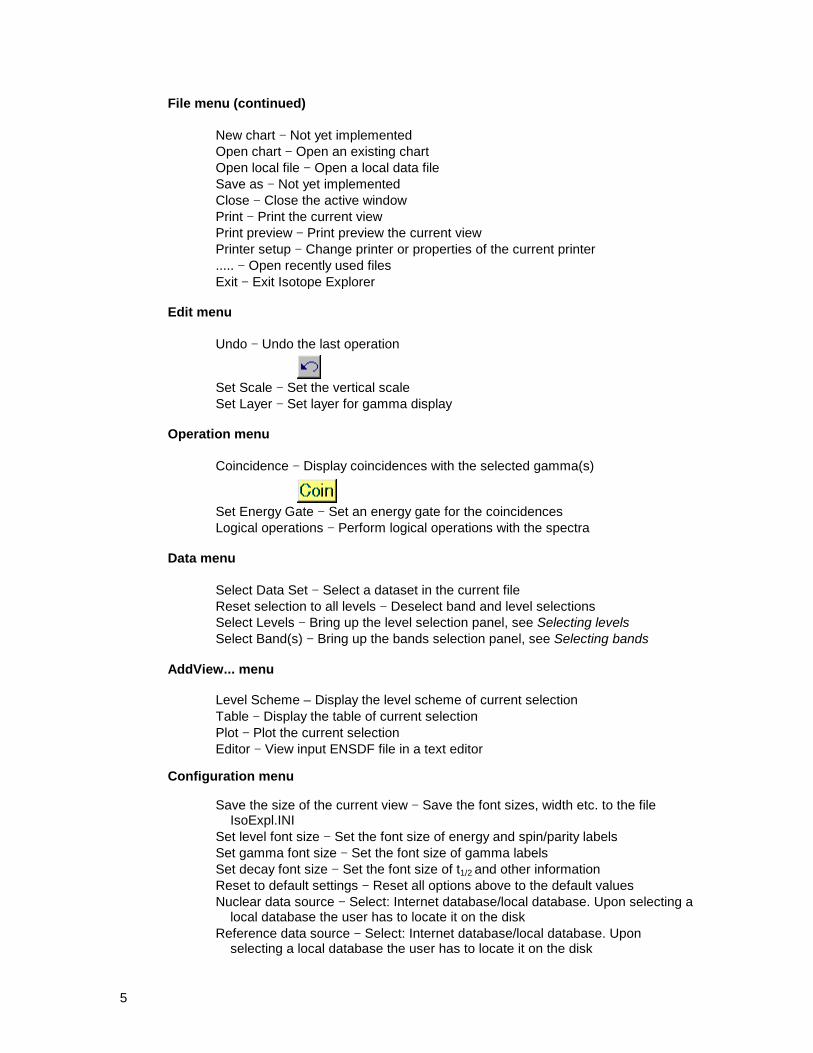
Coincidence − Display coincidences with the selected gamma(s)
Set Energy Gate − Set an energy gate for the coincidencesLogical operations − Perform logical operations with the spectra
Data menu
Select Data Set − Select a dataset in the current fileReset selection to all levels − Deselect band and level selectionsSelect Levels − Bring up the level selection panel, see Selecting levelsSelect Band(s) − Bring up the bands selection panel, see Selecting bands
AddView... menu
Level Scheme – Display the level scheme of current selectionTable − Display the table of current selectionPlot − Plot the current selectionEditor − View input ENSDF file in a text editor
Configuration menu
Save the size of the current view − Save the font sizes, width etc. to the file IsoExpl.INISet level font size − Set the font size of energy and spin/parity labelsSet gamma font size − Set the font size of gamma labelsSet decay font size − Set the font size of t1/2 and other informationReset to default settings − Reset all options above to the default valuesNuclear data source − Select: Internet database/local database. Upon selecting a local database the user has to locate it on the diskReference data source − Select: Internet database/local database. Upon selecting a local database the user has to locate it on the disk
6
Window menu
Cascade − Make the windows overlapTile − Tile all windows side-by-sideArrange Icons − Arrange icons of iconized windows at the bottom of the main windowClose All − Close all open windows..... − List of currently opened windows
Help menu
About − Isotope Explorer version, author information, etc.
Report problem − Requires a network connection. Allows the user to report problems with Isotope Explorer or the databases directly to the Berkeley serverIsotope Explorer news − Requires a network connection. Latest news about the program and databasesHelp − Isotope Explorer Help function
The Tool BarThe tool bar, providing access to the mostoften used commands, is a row of buttonswith symbols defined from left to right as
Open an existing chart file
Get nuclide data
Undo last operation
Show no gammas
Show all gammas
Show next higher layer of gammas
Show next lower layer of gammas
Automatic scaling (vertical)
Increase vertical scale
Decrease vertical scale
Select arrow cursor (for selecting objects)
Select hand cursor (for movingdisplay)
Show parent level data (for decaydata sets)
Show data legend (for decay datasets)
7
Tool Bar (continued)
Display coincidences with selectedgamma(s)
Get literature references for dataset
About Isotope Explorer (version information)
Isotope Explorer help
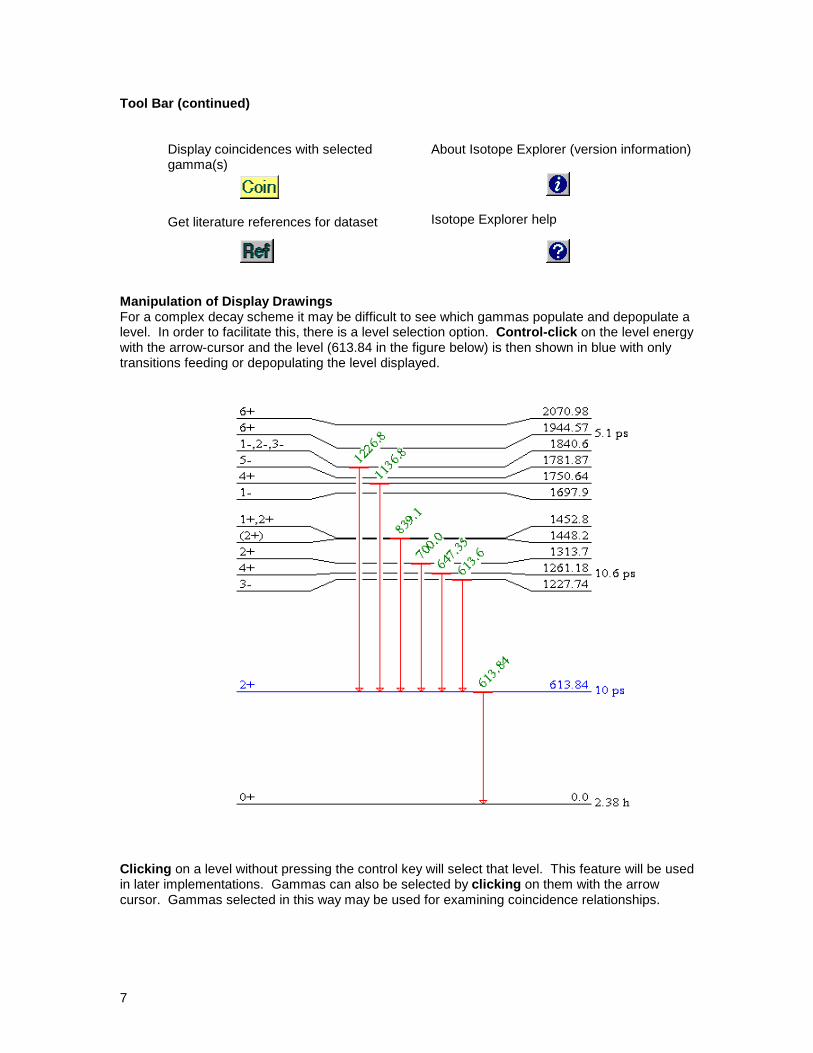
Manipulation of Display DrawingsFor a complex decay scheme it may be difficult to see which gammas populate and depopulate alevel. In order to facilitate this, there is a level selection option. Control-click on the level energywith the arrow-cursor and the level (613.84 in the figure below) is then shown in blue with onlytransitions feeding or depopulating the level displayed.
Clicking on a level without pressing the control key will select that level. This feature will be usedin later implementations. Gammas can also be selected by clicking on them with the arrowcursor. Gammas selected in this way may be used for examining coincidence relationships.
8
Selected gammas or levels are deselected by clicking on them again. Any selection is reset byclicking on an area of the level scheme drawing away from the levels and gammas. The previousstate can always be obtained with the Undo button.
ShortcutsAll supported commands are available as entries to the menu bar. Some of the most commonlyused commands are also available in the tool bar. In addition, there are useful mouse-shortcutsthat are described below.
Click on a gamma – The gamma is selected and shown in purpleClick on a level – The level is selected and shown in blueCtrl-click on a level − Highlight the level in blue and show only populating and depopulating gammasClick on selected gamma or level − Deselect gamma or levelClick on empty part of drawing area − Deselect all gammas and levelsClick anywhere with the right mouse button − Open the band/levels selection panel
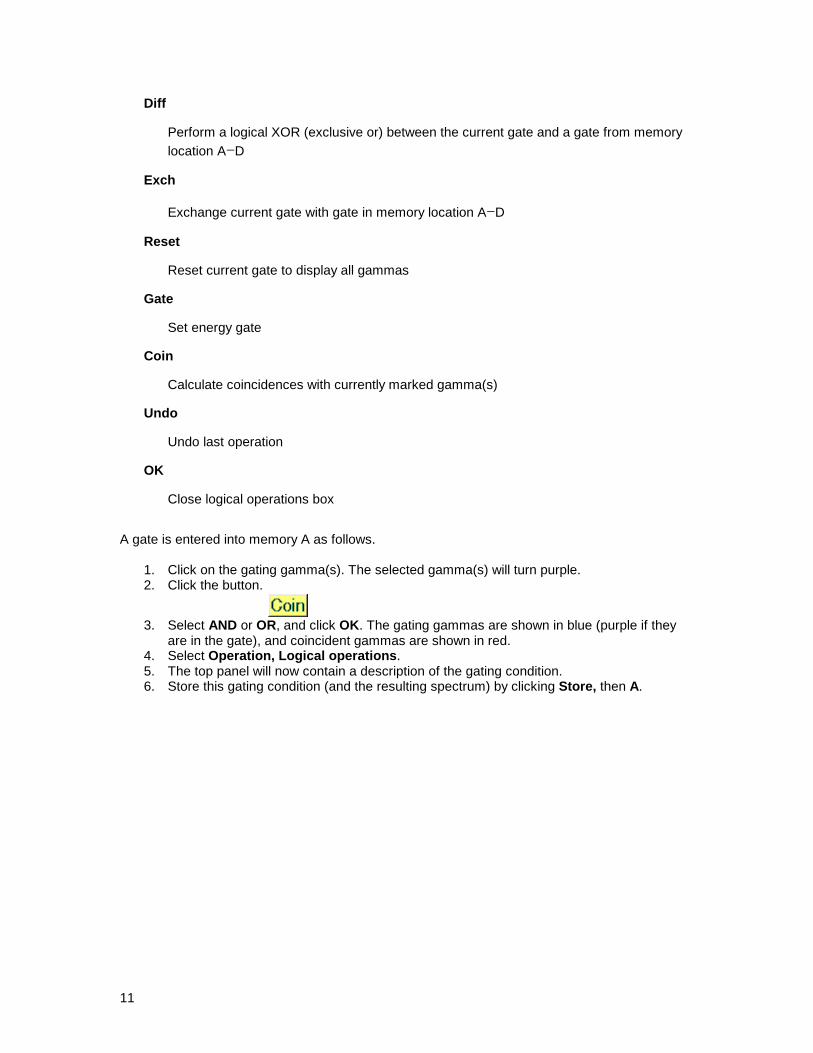
Operation: CoincidenceThe simplest way to show coincidences is to select one or more gating gammas with the arrowcursor and click the coincidence button.
The user is asked to specify the type of coincidence, And or Or, if more than one gamma hasbeen selected. The time window specifies the maximum level half-life for which gammas feedingfrom above are defined to be coincident with deexciting gammas.
Upon clicking OK, the program displays all gammas in the current decay scheme that are incoincidence with the selected gamma(s) within the specified time gate. Coincident gammas aredisplayed in red, and gating gammas in blue. If more than one gamma is selected, the displayedcoincidences correspond to Or or And operations with the gates. In the figure below, gates havebeen set on two transitions with the Or condition selected. Since the gating transitions are also incoincidence, they are shown in purple (1052.4 and 1156.9) rather than blue as shown in thefigure below:
9
Operation: Set Energy Gate.The user may alternatively specify gates either as an energy interval or as an energy with a widthas shown below.
10
In the example above the gate G1 is set between 122 and 125 keV. The gate G5 is set as 150±1keV (i.e. 149-151 keV). The user can set all the gates G1-G8, and perform Boolean operationson them (see below). The gates G1-G4 and G5-G8 are equivalent except that the gatingconditions are specified in different ways.
The user should note the difference between selecting a specific gamma with the cursor andsetting an energy gate. In the first case, only the selected gamma is used in the coincidencegate. In the second case, more than one gamma may occur within the energy gate. Then, thecoincidences result will correspond to all coincidences of the gammas in the selected energyrange. Advanced operations can be performed with the Logical Operation option described in thefollowing section.
Operation: Logical OperationLogical operation can be used for storing gated spectra to which more complicated coincidencerelations will be applied. It is important to recognize the difference between the effect ofcoincidence and logical operation on spectra. Double coincidences are always unambiguous,while the logical operations compare spectra using Boolean operations. When the gatingtransitions are in coincidence both methods are equivalent. When the Operations, Logicaloperation is selected, the following panel appears.
The panel contains a field describing the current gate and four memory locations A− D. The whitefields contain only labels, and entering text in them does not affect their properties. The buttonsdo the following:
Store
Store current gate and spectrum in a memory location (A− D)
Recall
Recall a gate/spectrum from a memory location (A− D)
And
Perform a logical AND between the current gate and a gate from memory location A− D
Or
Perform a logical OR between the current gate and a gate from memory location A-D
11
Diff
Perform a logical XOR (exclusive or) between the current gate and a gate from memorylocation A− D
Exch
Exchange current gate with gate in memory location A− D
Reset
Reset current gate to display all gammas
Gate
Set energy gate
Coin
Calculate coincidences with currently marked gamma(s)
Undo
Undo last operation
OK
Close logical operations box
A gate is entered into memory A as follows.
1. Click on the gating gamma(s). The selected gamma(s) will turn purple.2. Click the button.
3. Select AND or OR, and click OK. The gating gammas are shown in blue (purple if theyare in the gate), and coincident gammas are shown in red.
4. Select Operation, Logical operations.5. The top panel will now contain a description of the gating condition.6. Store this gating condition (and the resulting spectrum) by clicking Store, then A.
12
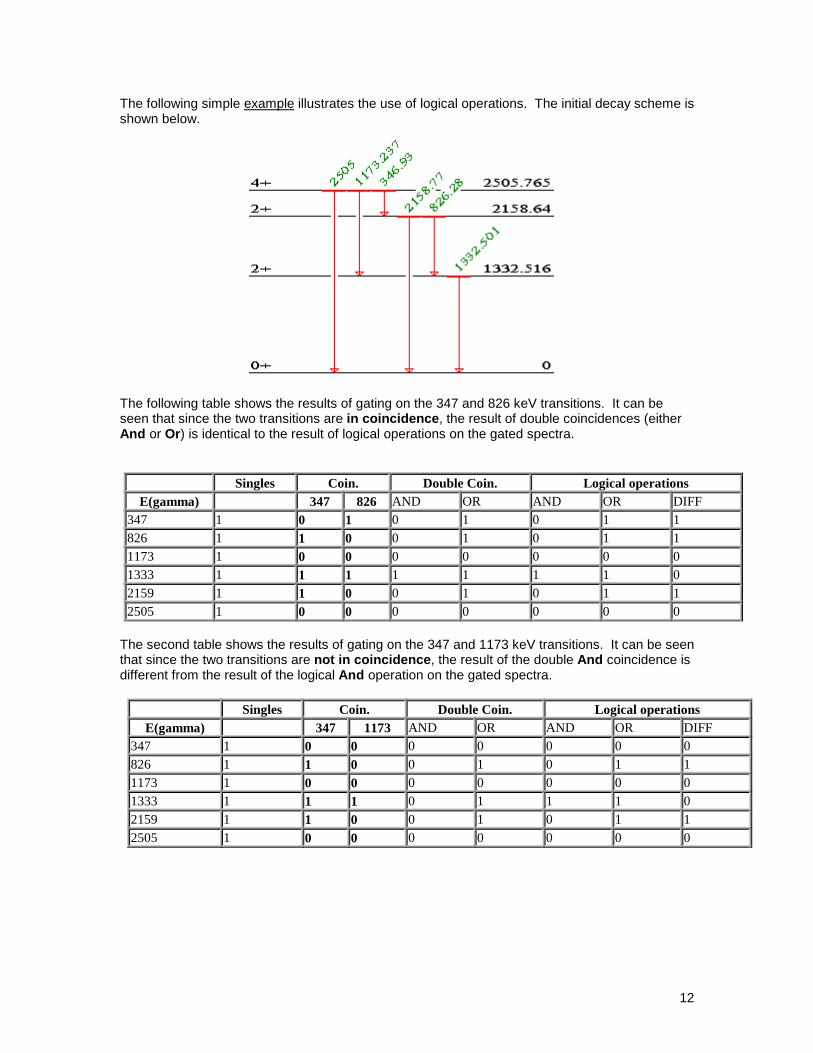
The following simple example illustrates the use of logical operations. The initial decay scheme isshown below.
The following table shows the results of gating on the 347 and 826 keV transitions. It can beseen that since the two transitions are in coincidence, the result of double coincidences (eitherAnd or Or) is identical to the result of logical operations on the gated spectra.
The second table shows the results of gating on the 347 and 1173 keV transitions. It can be seenthat since the two transitions are not in coincidence, the result of the double And coincidence isdifferent from the result of the logical And operation on the gated spectra.
Singles Coin. Double Coin. Logical operationsE(gamma) 347 826 AND OR AND OR DIFF
Data: Select Band(s)In level scheme mode, the band selection panel shown below is displayed.
The bands available in the current dataset will be displayed in the list. The user can select anyband(s) by clicking on the entries to the list. When the OK button is selected, a level scheme inthe band mode will display the chosen bands.
14
The order of the bands is determined by optimizing the drawing of out-of-band transitions. Whenthere are gammas connecting levels in nonadjacent bands, the daughter level is extendedhorizontally as a gray line. Levels from unselected bands or non-band members which are fed bygammas from selected bands are shown as horizontal gray lines the full width of the display.
Levels and gammas cannot be selected in band mode. However, the properties of any gamma(energy, initial/final level energy and spin-parity, relative intensity and multipolarity) are displayedin the status bar at the bottom of the screen when the mouse pointer is placed over that gamma.
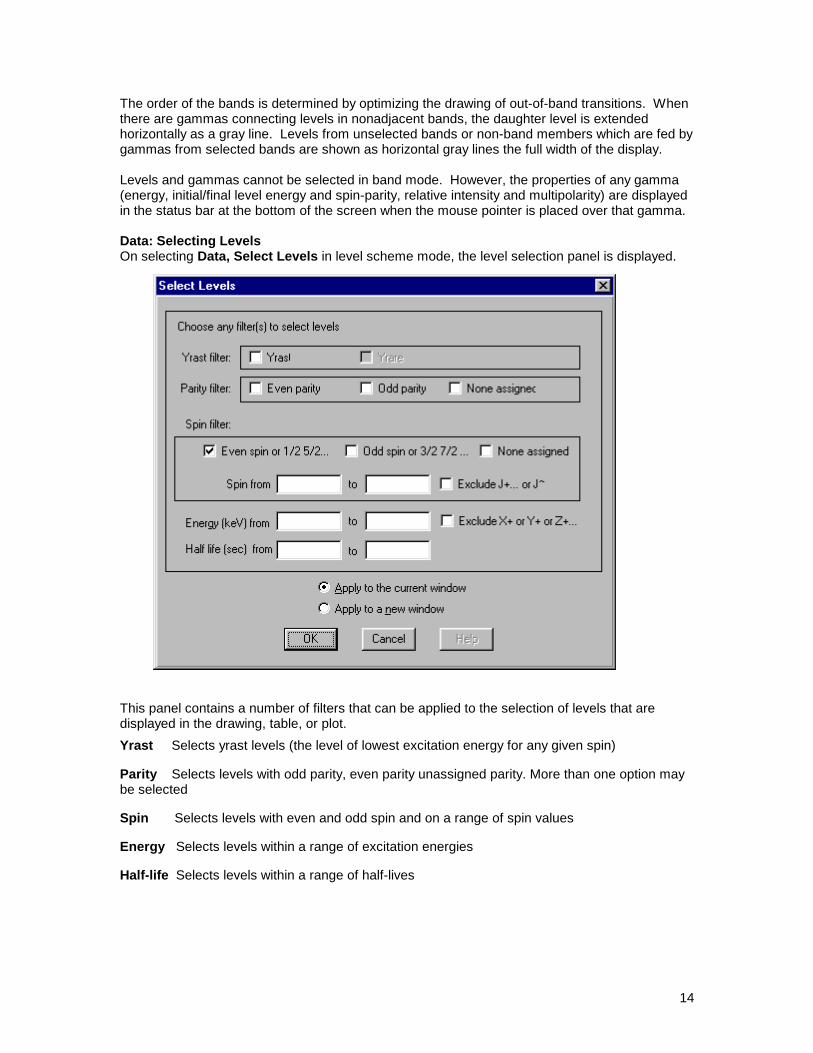
Data: Selecting LevelsOn selecting Data, Select Levels in level scheme mode, the level selection panel is displayed.
This panel contains a number of filters that can be applied to the selection of levels that aredisplayed in the drawing, table, or plot.
Yrast Selects yrast levels (the level of lowest excitation energy for any given spin)
Parity Selects levels with odd parity, even parity unassigned parity. More than one option maybe selected
Spin Selects levels with even and odd spin and on a range of spin values
Energy Selects levels within a range of excitation energies
Half-life Selects levels within a range of half-lives
15
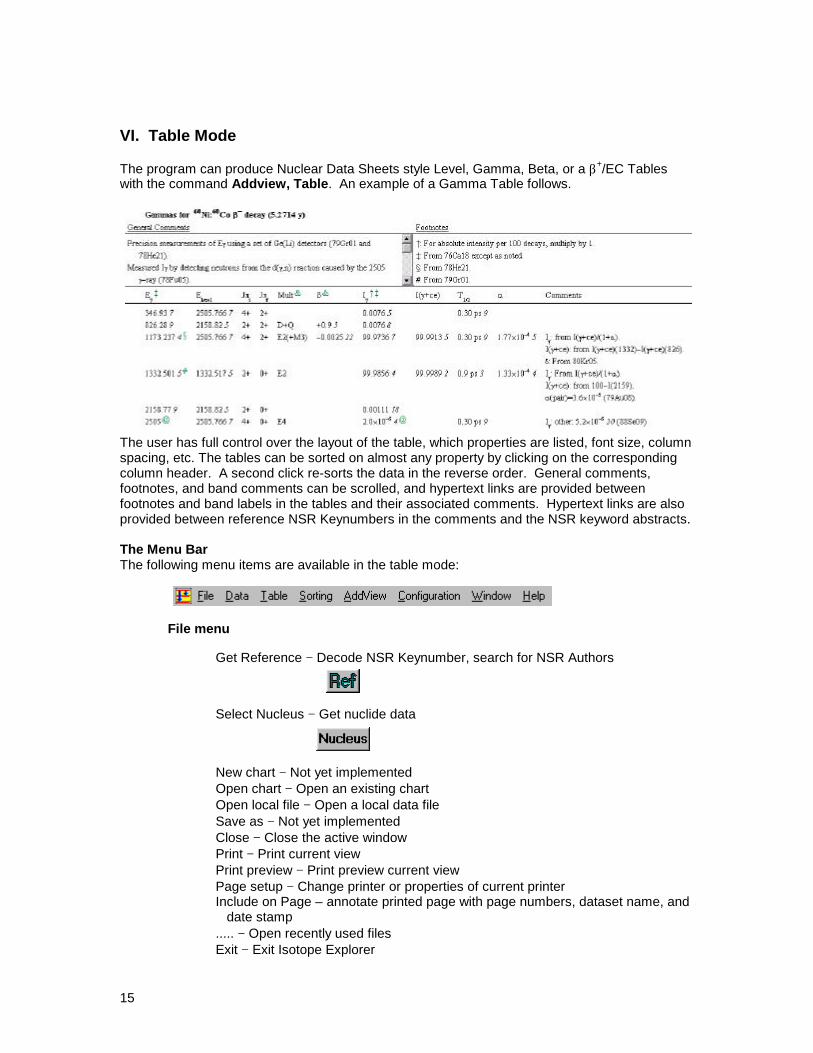
VI. Table Mode
The program can produce Nuclear Data Sheets style Level, Gamma, Beta, or a β+/EC Tableswith the command Addview, Table. An example of a Gamma Table follows.
The user has full control over the layout of the table, which properties are listed, font size, columnspacing, etc. The tables can be sorted on almost any property by clicking on the correspondingcolumn header. A second click re-sorts the data in the reverse order. General comments,footnotes, and band comments can be scrolled, and hypertext links are provided betweenfootnotes and band labels in the tables and their associated comments. Hypertext links are alsoprovided between reference NSR Keynumbers in the comments and the NSR keyword abstracts.
The Menu BarThe following menu items are available in the table mode:
File menu
Get Reference − Decode NSR Keynumber, search for NSR Authors
Select Nucleus − Get nuclide data
New chart − Not yet implementedOpen chart − Open an existing chartOpen local file − Open a local data fileSave as − Not yet implementedClose − Close the active windowPrint − Print current viewPrint preview − Print preview current viewPage setup − Change printer or properties of current printerInclude on Page – annotate printed page with page numbers, dataset name, and date stamp..... − Open recently used filesExit − Exit Isotope Explorer
16
Data menu
Select Data Set − Select data set in the current fileReset selection to all levels − Deselect band and level selectionsSelect Levels − Bring up the level selection panel, see Selecting levelsSelect Band(s) − Bring up the bands selection panel, see Selecting bands
Table menu
General comments – Toggle; activate to display general comments.Footnotes – Toggle; activate to display footnotes.Xreferences – Toggle, levels only; activate to display cross-index to reactions where the level is populated.Level − Display level tableGamma − Display gamma tableBeta − Display β− tableAlpha − Display α tableEC − Display EC/β+ tableColumn width mode – Toggle; activate to minimize spacing between columns.
Sorting menu
Select quantity on which the table should be sorted. Quantities not relevant forselection are grayed out.
AddView... menu
Level Scheme − Display level scheme of current selectionTable − Display table of current selectionPlot − Plot current selectionEditor − Not yet implemented
Configuration menu
Save the size of the current view − Save font sizes, width, etc. to the ISOEXPL.INI fileSet table font size − Set font size for tableSet table column width − Set column width for table in points (72 points/inch)Reset to default settings − Reset all options above to the default valuesNuclear data source − Select Internet database or local database; on selecting local database the user has to locate it on the diskReference data source − Select Internet database or local database; on selecting local database the user has to locate it on the diskDebug Mode − Debug mode on/off (in debug mode all operations performed are logged in the file LOG)
Window menu
Cascade − Overlap windowsTile − Tile all windows side by sideArrange Icons − Arrange icons of iconized windows at the bottom of the main windowClose All − Close all open windows..... − List of currently opened windows
17
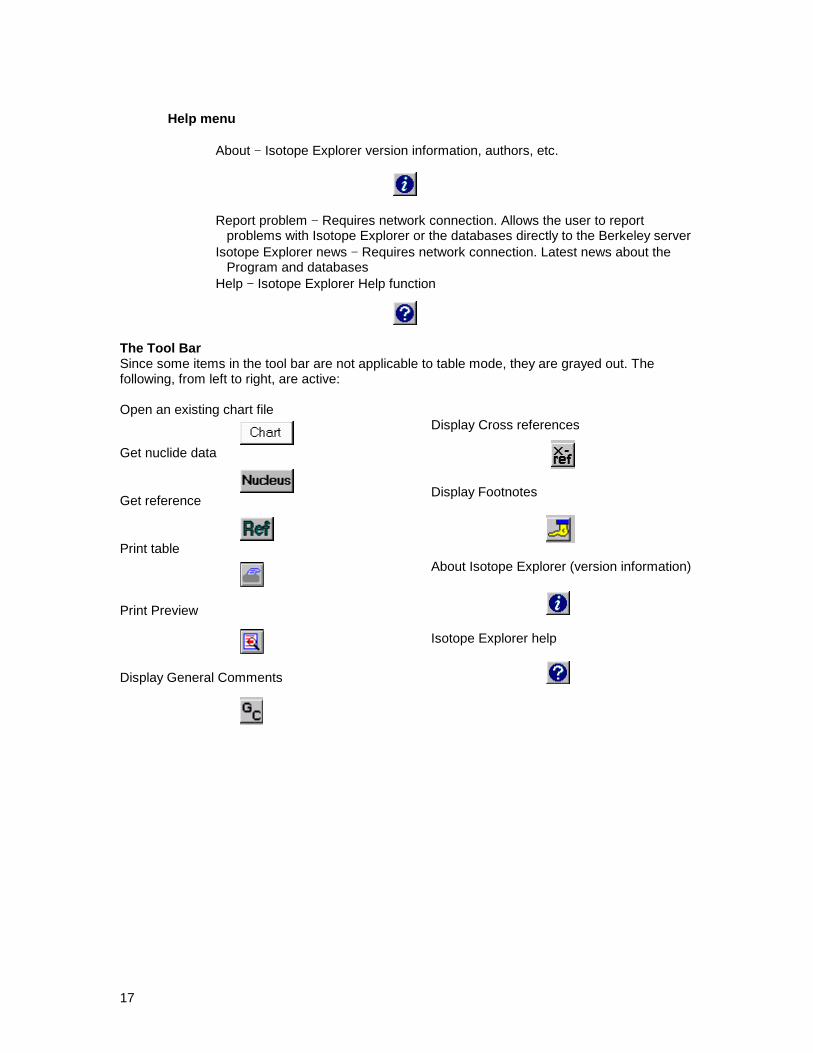
Help menu
About − Isotope Explorer version information, authors, etc.
Report problem − Requires network connection. Allows the user to report problems with Isotope Explorer or the databases directly to the Berkeley serverIsotope Explorer news − Requires network connection. Latest news about the Program and databasesHelp − Isotope Explorer Help function
The Tool BarSince some items in the tool bar are not applicable to table mode, they are grayed out. Thefollowing, from left to right, are active:
Open an existing chart file
Get nuclide data
Get reference
Print table
Print Preview
Display General Comments
Display Cross references
Display Footnotes
About Isotope Explorer (version information)
Isotope Explorer help
18
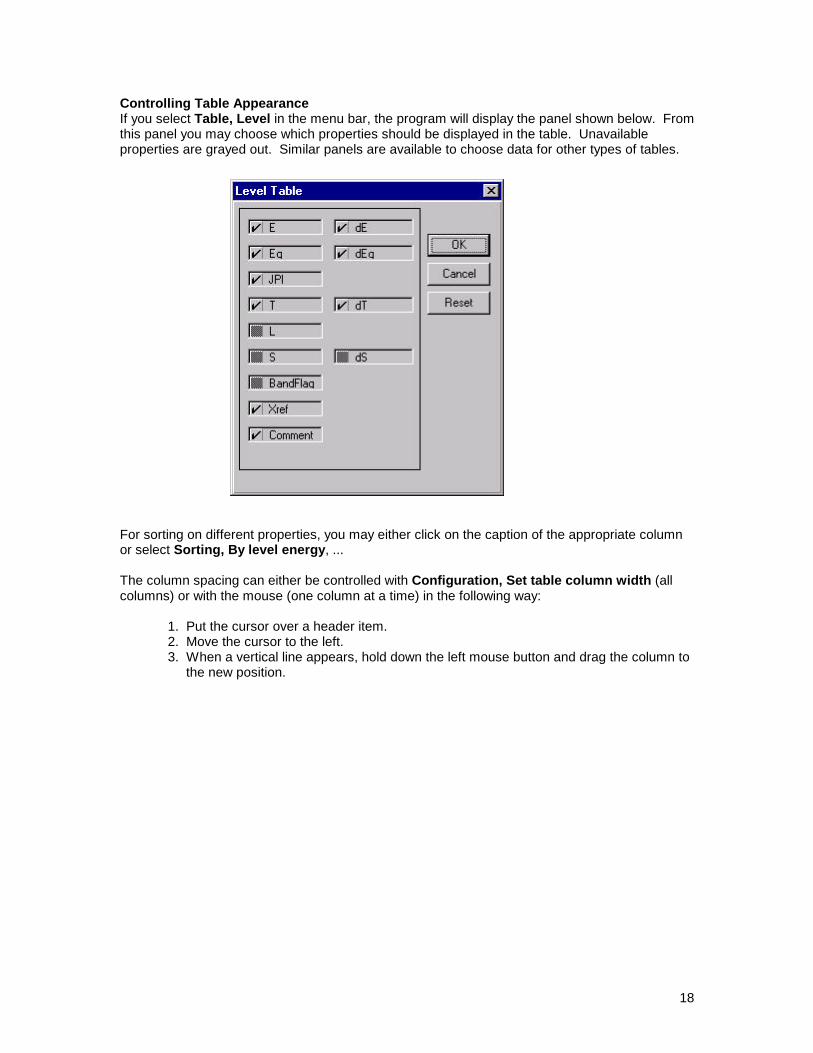
Controlling Table AppearanceIf you select Table, Level in the menu bar, the program will display the panel shown below. Fromthis panel you may choose which properties should be displayed in the table. Unavailableproperties are grayed out. Similar panels are available to choose data for other types of tables.
For sorting on different properties, you may either click on the caption of the appropriate columnor select Sorting, By level energy, ...
The column spacing can either be controlled with Configuration, Set table column width (allcolumns) or with the mouse (one column at a time) in the following way:
1. Put the cursor over a header item.2. Move the cursor to the left.3. When a vertical line appears, hold down the left mouse button and drag the column to the new position.
19
VII. Plot Mode
The program can produce two-dimensional plots of selected quantities with the commandAddView, Plot. The quantities plotted will depend on the current level selection.
If no levels are selected, a plot showing the distribution of level energies versus spin will bedrawn:
By clicking the I on the horizontal axis and selecting I(I+1), the distribution is plotted againstI(I+1). The scale on any axis can be manually selected with a dialog box which appears whenyou click on any of the axes.
If bands have been selected, a band plot will be generated:
Here, two bands (the G band and the S band) were selected. For band plots the following axisvariables are available:
Horizontal axis: I, I(I+1), the frequency ω and ω 2
Vertical axis: Excitation energy, first moment of inertia I 1, second moment of inertia I 2 , I 12
and I 22.
20
VIII. Editor Mode
Displays the selected ENSDF database file in a text editor. FIND command available to locatespecific text strings.
XI. The Chart Interface
The chart interface serves a dual purpose as
1. An alternative user interface for selecting nuclides, bands, etc.2. A general tool for generating nuclear charts
Combined with the script language described in Section X it provides a very powerful tool fordisplaying systematic trends of nuclear properties, producing custom-made nuclear charts,and selecting data to be displayed by the program.
A part of the chart may look like this:
In this case the chart is color-coded according to the isotope abundance. The small navigationwindow is used for moving about in the chart. This is achieved in two ways:
• Click and drag the small rectangle to the required position
• Click anywhere on the small chart, and the selected point becomes the center of the display
If the view is expanded, the selected data are displayed in the nuclide box:
21
One data item (in this case the abundance) is chosen for the color coding, and the other selecteddata items are displayed in the nuclide boxes together with the nuclide identification.
In addition to displaying ENSDF or chart data, Isotope Explorer can retrieve nuclear propertiesfrom the ENSDF database using the script language. These properties can then be used to colorcode the nuclear chart. Functions defined by the script language allow calculations to beperformed using the data that are retrieved.
Nuclear chart data can also be stored in separate files using the Files, Save as… command.
Currently, many options are controlled in data files that must be edited to change them. In thefuture, these options will be controlled by menus, tool bars, and panels provided by the IsotopeExplorer.
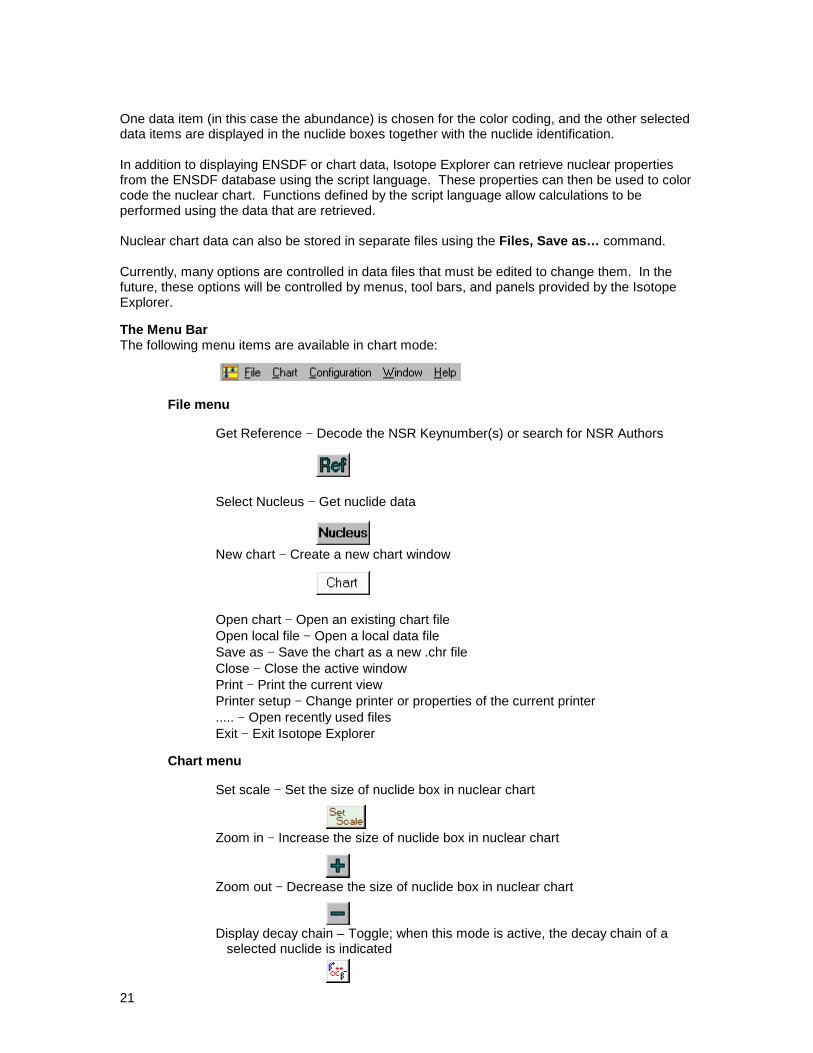
The Menu BarThe following menu items are available in chart mode:
File menu
Get Reference − Decode the NSR Keynumber(s) or search for NSR Authors
Select Nucleus − Get nuclide data
New chart − Create a new chart window
Open chart − Open an existing chart fileOpen local file − Open a local data fileSave as − Save the chart as a new .chr fileClose − Close the active windowPrint − Print the current viewPrinter setup − Change printer or properties of the current printer..... − Open recently used filesExit − Exit Isotope Explorer
Chart menu
Set scale − Set the size of nuclide box in nuclear chart
Zoom in − Increase the size of nuclide box in nuclear chart
Zoom out − Decrease the size of nuclide box in nuclear chart
Display decay chain – Toggle; when this mode is active, the decay chain of a selected nuclide is indicated
22
Chart menu (continued)
Design chart − Not yet implementedSelect color scheme − Brings up a menu to determine which field to color the chart by, the number of data bins and their interval limits, and the associated color scheme.
Hide data in nuclide box − Toggle; selected data are not shown in nuclide boxesSelect field − Brings up a menu for selecting which data should be loaded into the chart; when selection panel is closed with OK, the chart is rebuilt
Build chart − Rebuilds chart (used when a new chart has been opened)
Cancel building chart − Stop the chart-building process
Set nuclide ID font size − Set the font size of nuclide identification labelSet title font size − Set the font size of chart titleSet data font size − Set the font size of data in nuclide boxesSet legend title font size − Set the font size of legend titleSet legend font size − Set the font size for labels in color legendPrint/Print preview – Chart or Navigator window
Display navigation window − Toggle; display the navigation window
Open editor − Open the editor with the current chartAdd view − Copies the current chart file into a new window
Configuration menu
Save the size of the current view − Save font sizes, width, etc. to the ISOEXPL.INI fileNuclear data source − Select: Internet database or local database; on selecting a local database, the user has to locate it on the diskReference data source − Select: Internet database or local database; on selecting a local database, the user has to locate it on the diskDebug mode − Debug mode on/off (in debug mode all operations performed are logged in the file LOG)
Window menu
Cascade − Make windows overlappingTile − Tile all windows side-by-sideArrange Icons − Arrange icons of iconized windows at the bottom of the main windowClose All − Close all open windows..... − List of currently opened windows
23
Help menu
About − Isotope Explorer version and author information, etc.
Report problem − Requires network connection. Allows the user to report problems with Isotope Explorer or databases directly to the LBNL serverIsotope Explorer news − Requires network connection. Latest news about the program and databases
Help − Isotope Explorer Help function
The Tool BarThe following items, from left to right, are active:
Open an existing chart file
Get nuclide data
Get reference (not yet available)
Print/Print preview
Rebuilds chart (used when a new chart has been opened)
Set size of the nuclide box in nuclear chart
Increase size of the nuclide box in the nuclear chart
Decrease size of the nuclide box in the nuclear chart
Brings up a menu for selecting which data should be loaded into the chart. When selection panel is closed with OK, the chart is rebuilt
Brings up a menu to determine the color scheme and bin intervals.
Toggle. When this mode is on, the decay chain of a selected nuclide is displayed
Toggle. Display the navigation window
24
Tool bar (continued)
About Isotope Explorer (version information)
Isotope Explorer help
Chart Databases
An experimental database (TOI) containing ground state and isomer properties from the Table ofIsotopes, and a theoretical database (Møller) containing calculated ground state properties forover 9000 isotopes (P. Møller, J.R. Nix, and K.-L. Kratz, LA-UR-94-3898(1994) ) are provided.
Users can also generate their own databases. Data definitions are defined at the beginning ofthe database (text) file, delimited by square brackets, and followed by the chart data as shownbelow.
The data field abbreviation and its full definition are given on opposite sides if the equalities. Theisotope display name and coordinate information, (Z=ZZ,n) or (Z,N) for each chart box areseparated by a colon from the chart data which are separated by semicolons as shown above.Here ZZ is the atomic number, n is the isomer number (0 for ground state), and (Z,N) contains theproton/neutron numbers. Users can define any desired quantities for display on the chart.
Creating a Chart
Selecting the Chart button opens a dialogue box shown below where you can select an existingchart script with the extension .CHR. The “file_saved” chart file names are “built” charts whichcontain data selected from the chart or ENSDF databases using chart “scripts” defined below.The other chart names are only chart scripts ready to be built and customized by the user.Blank.chr and Blankm.chr are generic chart scripts for the TOI and Møller chart databases,respectively.
25
For new charts, select Blank.chr or Blankm.chr and choose Chart, Select field to open thedialogue box shown below to select data for the chart.
Select the desired chart fields and isomer number as shown and click OK when done. Thenselect Build to construct the chart. When the chart has been constructed the color scheme menuwill automatically appear to facilitate customizing the data bins and chart colors.
Controlling Chart Color Scheme
If you select Chart, Select color scheme in the menu bar or click on the color scheme button,the program will display the panel shown below.
26
The chart is colored according to the field selected in the drop-down menu at the top. Automaticbin intervals can be selected to divide the data into equal value or population ranges. The datavalue range can also be constrained by user selected limits. The number of bins can be selected,with out-of-range values either displayed with the last bin or hidden. Legend labels can showeither the central value or interval limits for each bin.
A color scheme can be automatically assigned to each bin by partitioning ranges of Hue,Saturation, and Lumination, as shown in the panel. Conversely, data limits and colors can beselected interactively by clicking on the legend labels and color boxes respectively.
27
The Chart FilesChart files have the extension .CHR, and contain the following (optional) four sections:
1. TITLE: Ground state properties Contains only one line giving the title for the chart; if present, it must be the first line of chart file. Default: Untitled
2. INIT: .... END INIT Contains information concerning scaling, layout and coloring of the chart
3. BUILD: DataBase(Ensdf) Nucleus(a=80-200) .... END BUILD Contains the basic information concerning how to build the chart; see the section discussing the Script language.
4. CHART: .... 133La (Z=57): 133Ce (Z=58):3
SD-1 band (95HABB)SD-2 band (95HAAA)SD-3 band (95HAAA)
133Pr (Z=59):4SD-1 band (95WIAA)SD-2 band (95WIAA)SD-3 band (95WIAA)SD-4 band (95WIAA)
.... END CHART Contains the body of the chart with nuclide identification followed by data. The first line of data immediately follows the nuclide ID, and subsequent lines of data are preceded by tabs.
The user can begin with a blank chart and use the menu to customize the chart. Once the chartis constructed, it can be saved for later use with File, Save as... However, the design of themenu is not yet complete, and some of the commands must be edited manually into the Buildsection. The following section gives a summary of the available commands.
28
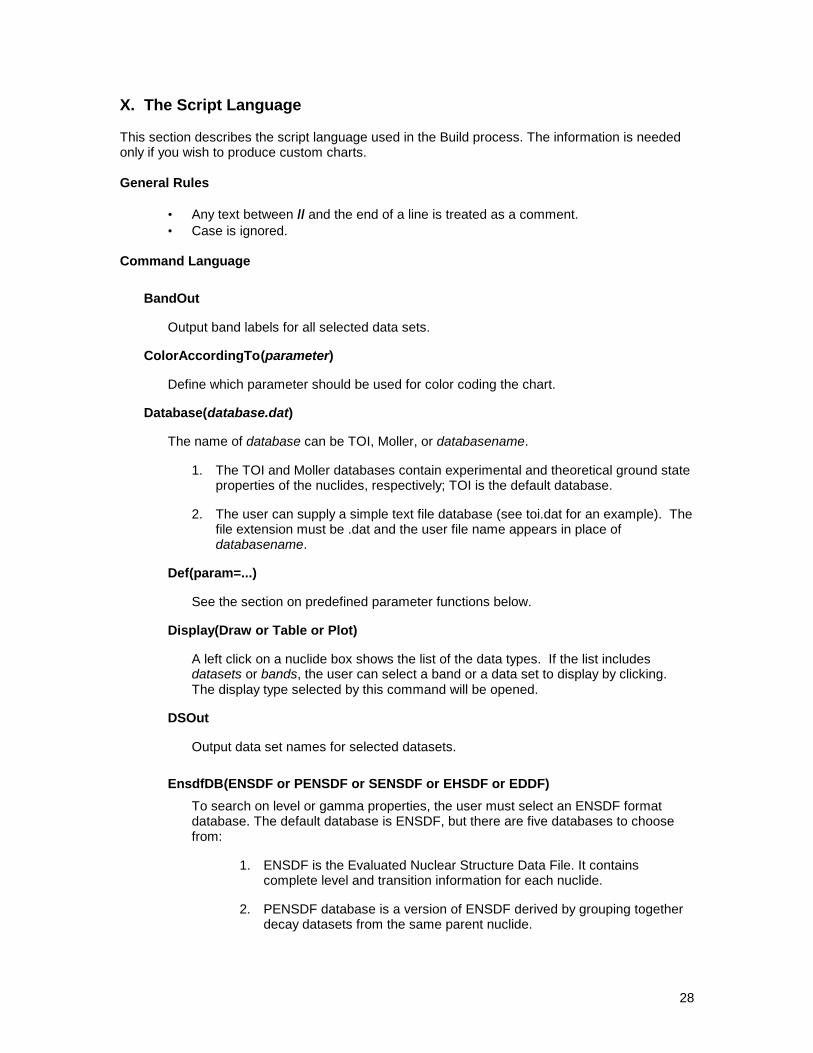
X. The Script Language
This section describes the script language used in the Build process. The information is neededonly if you wish to produce custom charts.
General Rules
• Any text between // and the end of a line is treated as a comment.• Case is ignored.
Command Language
BandOut
Output band labels for all selected data sets.
ColorAccordingTo(parameter)
Define which parameter should be used for color coding the chart.
Database(database.dat)
The name of database can be TOI, Moller, or databasename.
1. The TOI and Moller databases contain experimental and theoretical ground stateproperties of the nuclides, respectively; TOI is the default database.
2. The user can supply a simple text file database (see toi.dat for an example). Thefile extension must be .dat and the user file name appears in place ofdatabasename.
Def(param=...)
See the section on predefined parameter functions below.
Display(Draw or Table or Plot)
A left click on a nuclide box shows the list of the data types. If the list includesdatasets or bands, the user can select a band or a data set to display by clicking.The display type selected by this command will be opened.
DSOut
Output data set names for selected datasets.
EnsdfDB(ENSDF or PENSDF or SENSDF or EHSDF or EDDF)
To search on level or gamma properties, the user must select an ENSDF formatdatabase. The default database is ENSDF, but there are five databases to choosefrom:
1. ENSDF is the Evaluated Nuclear Structure Data File. It containscomplete level and transition information for each nuclide.
2. PENSDF database is a version of ENSDF derived by grouping togetherdecay datasets from the same parent nuclide.
29
3. SENSDF database contains data for nuclides with superdeformedbands.
4. EHSDF database contains only adopted datasets from ENSDF with mostof the comments removed to make the files smaller; some high-spin datanot in ENSDF has been added to this database.
5. EDDF database contains only decay datasets from ENSDF.
FindGamma(...)
Find gammas with selected properties. For example,
FindGamma(e=250-260) means find gammas with energy from 250− 260 keV.
Note: An accompanying GammaOut(quantity) command is required to generateoutput to the chart.
FindLevel(...)
Find levels with selected properties. Examples:
FindLevel(e=300-350) means find levels with an excitation energy between 300-350 keVFindLevel(t=1-1.e5) means find levels with half-life between 1 and 105 secondsFindLevel(spin={0+,2+,1-}) means find the lowest energy 1- level which liesabove a 2+ that in turn lies above a 0+ levelFindLevel(e=0,t=1-1e7) means find ground states with half lives between 1 and107 secondsNote: An accompanying LevelOut(quantity) command is needed to generateoutput
FindOut(quantity)
Extract quantity from a chart database (database.dat file) and store it in the chart.If the command OutToFile(filename) is given, the datum is also stored in the filefilename.
GammaOut(E,ELI,ELF,JPII,JPIF,RI)
Output the given quantities to the chart, whereE is the gamma-ray energyELI, ELF are the initial and final level energiesJPII, JPIF are the initial and final level spin/paritiesRI is the relative intensity; If uncertainty is required, add D to the key, e.g. ED,RID
KeepLines
Not implemented
LevelOut(E,JPI,J(J+1),T)
Output the given quantities to the chart, whereE is the level energyJPI is the spin/parity of the levelJ(J+1) is the spin squaredT is the half life; if uncertainty is required, add D to the key, e.g. ED, TD
30
Nucleus(filter1,filter2...)
A, Z, N, or isomer filter. For example a=50-, a=50-100, a=-50, z=102, even-a, odd-z, etc.For the isomer filter (isomer=n), n=0 (ground state), n=1, first excited state, etc. If thiscommand is absent, all nuclides in the Chart section (or Data file) will be processed.
OutToFile(FileName)
When a chart is built, the output can be redirected to a file with the name given inbrackets. If this command is missing, the output will be stored in the chart (memory) andcan be saved to a disk file by selecting Chart, Save as....
SelectBand(All or Yrast or GS or SD)
The default database is ENSDF; the default data set is the first data set for the nuclide.
SelectDS(All or Decay or B-Decay or EC-Decay or NGThermal)
Select data sets of the specified type; this command must be followed by a DSOutcommand.
Examples
1. For A=100-200, and the ENSDF database find, gammas with energy in the range 1200-1250 keV. Output the gamma-ray energy, initial level energy, and spin/parity of the initialand final levels to the chart and to the file test.out.
2. For the SENSDF database with A=80-200, select superdeformed bands and output theband labels to the chart. When a band is selected, a band plot is shown:
Returns 1 if value of parameter defined as '>', '<', '~', '='. Otherwise returns 0
IsDef(Parameter)
Returns 1 if parameter is defined for this nuclide. Otherwise returns 0
EQ(argument1,argument2)
If argument1 is equal to argument2, returns 1. Otherwise returns 0
GE(argument1,argument2)
If argument1 is greater than or equal to argument2 returns 1. Otherwise returns 0
LE(argument1,argument2)
If argument1 is smaller than or equal to argument2 returns 1. Otherwise returns 0
32
GT(argument1,argument2)
If argument1 is greater than argument2 returns 1. Otherwise returns 0
LT(argument1,argument2)
If argument1 is smaller than argument2 returns 1. Otherwise returns 0
Rules1. If a parameter's name contains nonalphanumeric characters it must be contained in
double quotes ("a parameter name","qb-").2. Optionally the parameter can be preceded by an N, Z offset or a database name so
that the value of the parameter is taken from a neighboring nuclide or anotherdatabase. For example, if the parameter mass is defined in the database Moller,
"[[moller]][-1,0]mass"
the result is the mass for the N-1,Z neighboring nuclide from the Moller database.3. Spaces between operators are ignored.4. If a line ends with the character '\', the line will be merged with the following line.
Chart User-InterfaceThe chart mode can be used as a user interface to select the data to be displayed. To activatethe chart user-interface, a section like the following should be included in the build section of thechart file (comments after //):
BUILD: DataBase(Ensdf) //define database SelectDS(decay) //select decay data sets dsout //output list of data sets to chart Display(level) //display level plot of selected data set END BUILD
The Data FilesChart data can also be made available to Isotope Explorer as data files with the extension .DAT.See the file toi.dat for the required format.
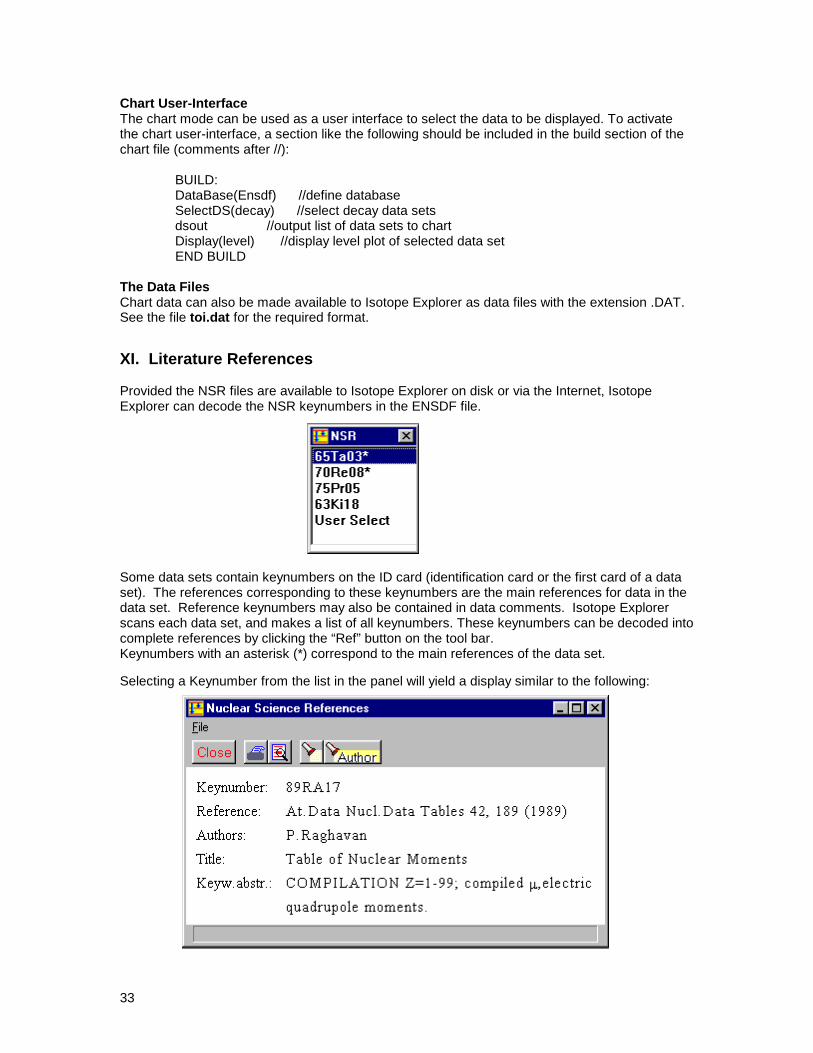
XI. Literature References
Provided the NSR files are available to Isotope Explorer on disk or via the Internet, IsotopeExplorer can decode the NSR keynumbers in the ENSDF file.
Some data sets contain keynumbers on the ID card (identification card or the first card of a dataset). The references corresponding to these keynumbers are the main references for data in thedata set. Reference keynumbers may also be contained in data comments. Isotope Explorerscans each data set, and makes a list of all keynumbers. These keynumbers can be decoded intocomplete references by clicking the “Ref” button on the tool bar.Keynumbers with an asterisk (*) correspond to the main references of the data set.
Selecting a Keynumber from the list in the panel will yield a display similar to the following:
34
The source (local or Internet) for the reference data can be changed with the main menu itemConfiguration, Reference data source.
By instead clicking User Select, a panel like this one will appear.
The first three icons enable the user to close the panel, print preview, and print references. Withthe next icon (torch), the user can enter any valid NSR Keynumber to be decoded. The last icon(torch with Author) provides access to the NSR references by author name provided that the NSRfiles are available on the local disk or Internet.
NSR DataIsotope Explorer can access NSR data in two ways: from local files or by transfer via the Internet.
Local files
The files AUTHORS.LIS, AUTHORS.DIC (for the author index), and NSRxx.DIC,NSRxx.REF (for the reference data where xx is the year between 10 and 96) are requiredfor decoding the key numbers.
These files are available on the TOI CD-ROM or by downloading them from the Internetaddress
http://isotopes.lbl.gov/isotopes/install.html.
Internet transfer
Individual key numbers can be decoded directly via the Internet. For searching theAuthor index, the files AUTHORS0.LIS, AUTHORS0.DIC are required (see Section XIII).
XII. Preview and Printing
Plots, tables, and drawings can be previewed and printed by choosing File, Print Preview andFile, Print, respectively. The font size for printing is determined from the viewing mode, and canbe changed under Options.
XIII. Technical Issues
This section deals with issues that are of most concern to the advanced user.
Data TransferWhen the Internet database is selected with the Configuration menu, Isotope Explorer transfersthe data with TCP/IP from a server.
35
Nuclear data
The transfer of a data set is performed with a GET command in HTTP from128.3.253.100 (csa5.lbl.gov) or 130.235.92.5 (outis.lucas.lu.se).
The file CATALOG0.LOG contains a list of the available data sets. This fileshould be deleted at regular intervals. It is automatically replaced by a new fileprovided by the server.
Reference data
Reference keynumbers are decoded with a database program running on128.3.252.64 (nsdssr.lbl.gov).
For author searches, the file AUTHORS0.DIC is required. This file is createdwhen it is needed from the file AUTHORS0.LIS, which is transferred from theserver. These files should be deleted at regular intervals. They areautomatically replaced by new files provided by the server.
SecuritySince Isotope Explorer can transfer files via the Internet, it is prudent to ask whether viruses canbe transferred this way. Although nothing can be absolutely certain, the Isotope Explorer is assafe as most Web browsers. Here are some facts that may allow you to judge the security.
• All files are transferred as ASCII files which cannot carry viruses.• No hidden information is sent from the client to a server.• All hardware/software information sent with a bug report (Help, Report problem) is visible to the user, and can be edited if the user desires.
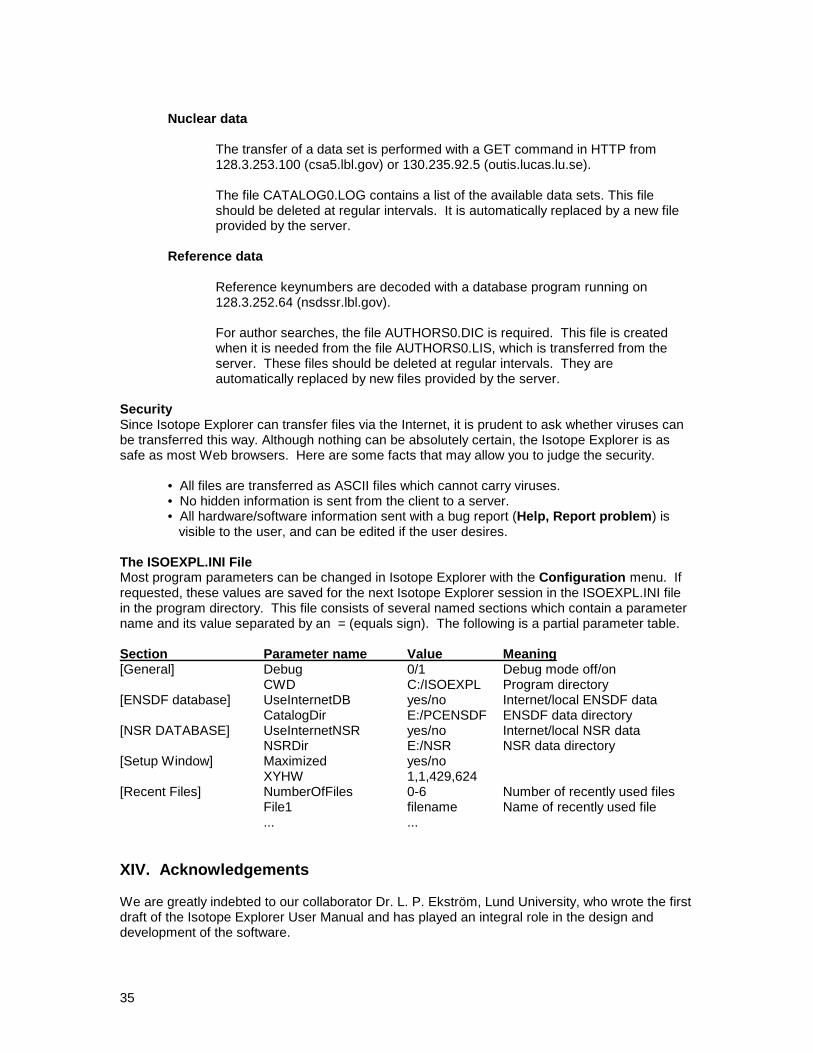
The ISOEXPL.INI FileMost program parameters can be changed in Isotope Explorer with the Configuration menu. Ifrequested, these values are saved for the next Isotope Explorer session in the ISOEXPL.INI filein the program directory. This file consists of several named sections which contain a parametername and its value separated by an = (equals sign). The following is a partial parameter table.
Section Parameter name Value Meaning[General] Debug 0/1 Debug mode off/on
CWD C:/ISOEXPL Program directory[ENSDF database] UseInternetDB yes/no Internet/local ENSDF data
CatalogDir E:/PCENSDF ENSDF data directory[NSR DATABASE] UseInternetNSR yes/no Internet/local NSR data
NSRDir E:/NSR NSR data directory[Setup Window] Maximized yes/no
XYHW 1,1,429,624[Recent Files] NumberOfFiles 0-6 Number of recently used files
File1 filename Name of recently used file... ...
XIV. Acknowledgements
We are greatly indebted to our collaborator Dr. L. P. Ekström, Lund University, who wrote the firstdraft of the Isotope Explorer User Manual and has played an integral role in the design anddevelopment of the software.