Isotope Hydrology Isotope Hydrology and Source and Source-Water Protection: Water Protection: and Source and Source-Water Protection: Water Protection: an Investigation from Lafayette Parish, an Investigation from Lafayette Parish, Louisiana Louisiana Louisiana Louisiana Bruce K. Darling, Ph.D. Bruce K. Darling, Ph.D. Geochemist/Hydrogeologist Geochemist/Hydrogeologist LBG LBG G t A it G t A it LBG LBG-Guyton Associates Guyton Associates Lafayette, Louisiana Lafayette, Louisiana
an Investigation from Lafayette Parish, an Investigation from Lafayette Parish, LouisianaLouisianaLouisianaLouisiana
Bruce K. Darling, Ph.D.Bruce K. Darling, Ph.D.Geochemist/HydrogeologistGeochemist/Hydrogeologist
LBGLBG G t A i tG t A i tLBGLBG--Guyton AssociatesGuyton AssociatesLafayette, LouisianaLafayette, Louisiana
What isWhat is ““Isotope HydrologyIsotope Hydrology””What is What is Isotope HydrologyIsotope Hydrology
Application of geochemical methods involvingApplication of geochemical methods involvingApplication of geochemical methods involving Application of geochemical methods involving analyses of environmental isotopes (naturally analyses of environmental isotopes (naturally occurring stable isotopes and unstable isotopes) and occurring stable isotopes and unstable isotopes) and unstable isotopes derived from anthropogenic sources unstable isotopes derived from anthropogenic sources to resolve questions related to the origin, flow, to resolve questions related to the origin, flow,
i i d f d t d f ti i d f d t d f tmixing, and age of ground waters and surface waters.mixing, and age of ground waters and surface waters.
Isotopic Methods in HydrologyIsotopic Methods in HydrologyIsotopic Methods in HydrologyIsotopic Methods in Hydrology
Widely used to differentiate between sources of waterWidely used to differentiate between sources of waterWidely used to differentiate between sources of waterWidely used to differentiate between sources of waterDelineate recharge areas and flow pathsDelineate recharge areas and flow pathsEstimate residence times of ground watersEstimate residence times of ground watersEstimate residence times of ground watersEstimate residence times of ground watersDifferentiate between potential sources of Differentiate between potential sources of contaminationcontaminationcontaminationcontamination
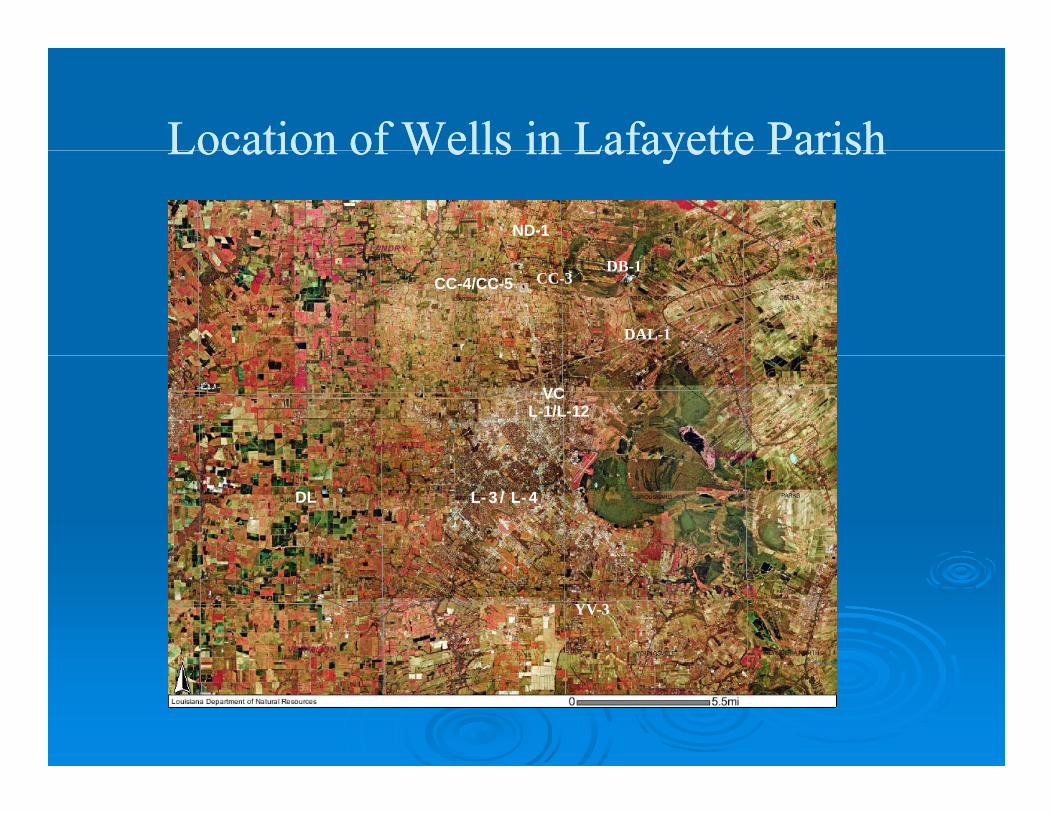
Lafayette Utilities System was interestedLafayette Utilities System was interestedLafayette Utilities System was interestedLafayette Utilities System was interestedin determining risk of contaminationin determining risk of contamination
f d f hi iff d f hi ifof sands of Upper Chicot aquiferof sands of Upper Chicot aquiferfrom landfills, storage tanks, pipelines,from landfills, storage tanks, pipelines,
agricultural activities, etc.agricultural activities, etc.
Questions Asked by LUSQuestions Asked by LUSQuestions Asked by LUSQuestions Asked by LUS
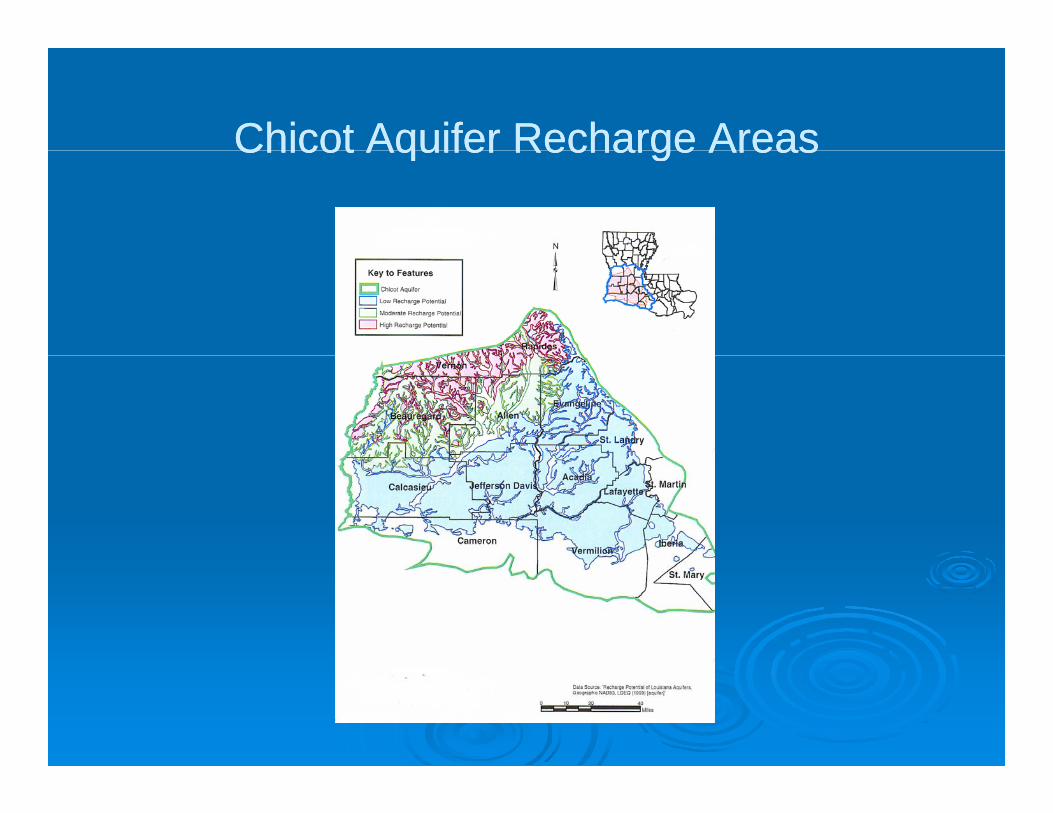
Is there evidence of modern recharge in LafayetteIs there evidence of modern recharge in LafayetteIs there evidence of modern recharge in Lafayette Is there evidence of modern recharge in Lafayette Parish?Parish?If so, how variable are recharge signatures?If so, how variable are recharge signatures?, g g, g gWhat do the isotopic signatures indicate with respect What do the isotopic signatures indicate with respect to the potential for contamination of major water to the potential for contamination of major water p jp jproducing sands of the Chicot aquifer?producing sands of the Chicot aquifer?
Collection of ground water samples for analysis ofCollection of ground water samples for analysis ofCollection of ground water samples for analysis of Collection of ground water samples for analysis of two radionuclides:two radionuclides:
And two stable isotopes:And two stable isotopes:OxygenOxygen--18 (18 (δδ1818O)O)Deuterium (Deuterium (δδ22H)H)
Sampling ProgramSampling ProgramSampling ProgramSampling Program
13 wells13 wellsNine public supply wellsNine public supply wellsOne municipal well not used for public supplyOne municipal well not used for public supplyThree private supply wellsThree private supply wellsp pp yp pp yThree upper Chicot, 10 lower ChicotThree upper Chicot, 10 lower ChicotUpper Chicot Upper Chicot –– 65 to 270 ft65 to 270 ftLower ChicotLower Chicot –– 452 to 567 ft452 to 567 ftLower Chicot Lower Chicot 452 to 567 ft452 to 567 ft
Samples analyzed forSamples analyzed forMajor cations and anionsMajor cations and anionsTritium (Tritium (33H)H)Tritium (Tritium (33H)H)CarbonCarbon--14 (14 (1414C) and CarbonC) and Carbon--13 (13 (δδ1313C)C)δδ1818O and O and δδ22HH
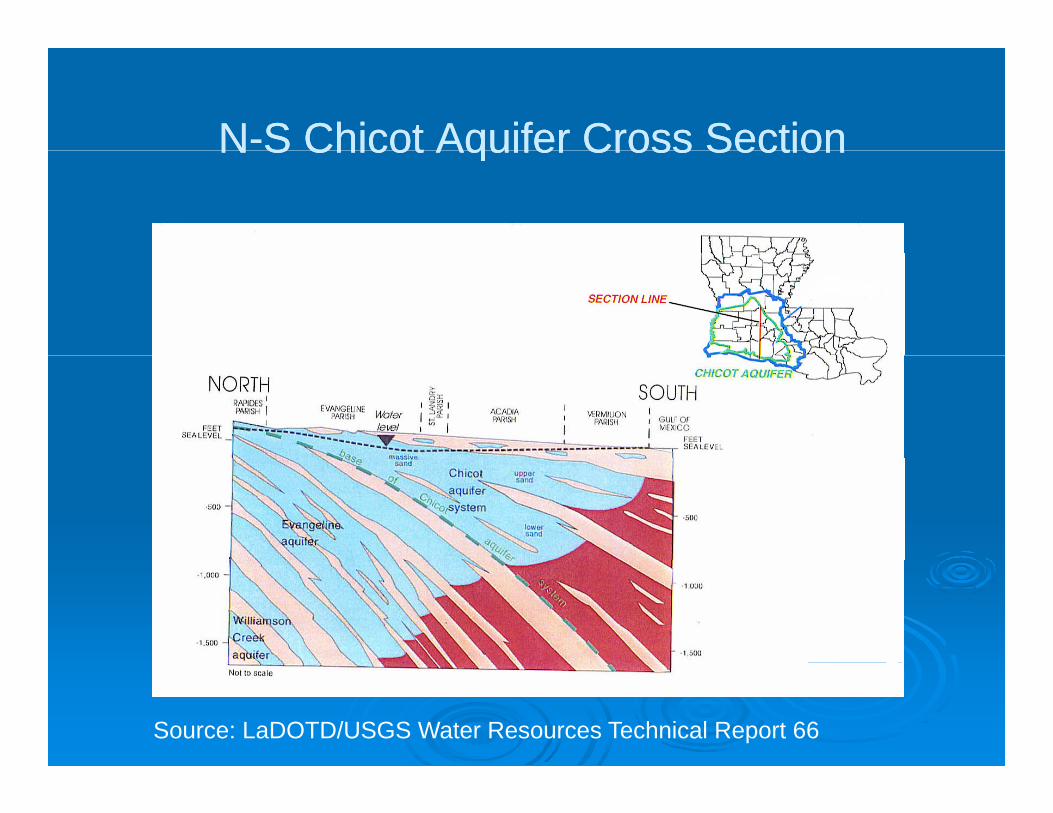
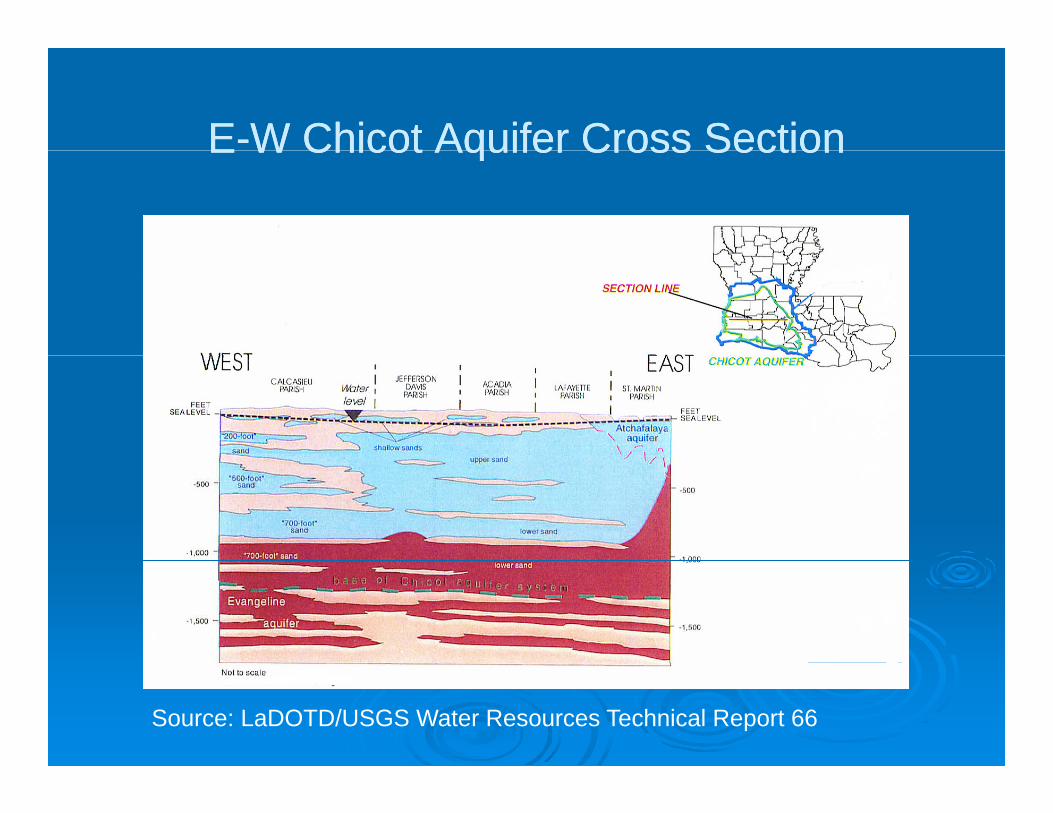
Source: LaDOTD/USGS Water Resources Technical Report 66
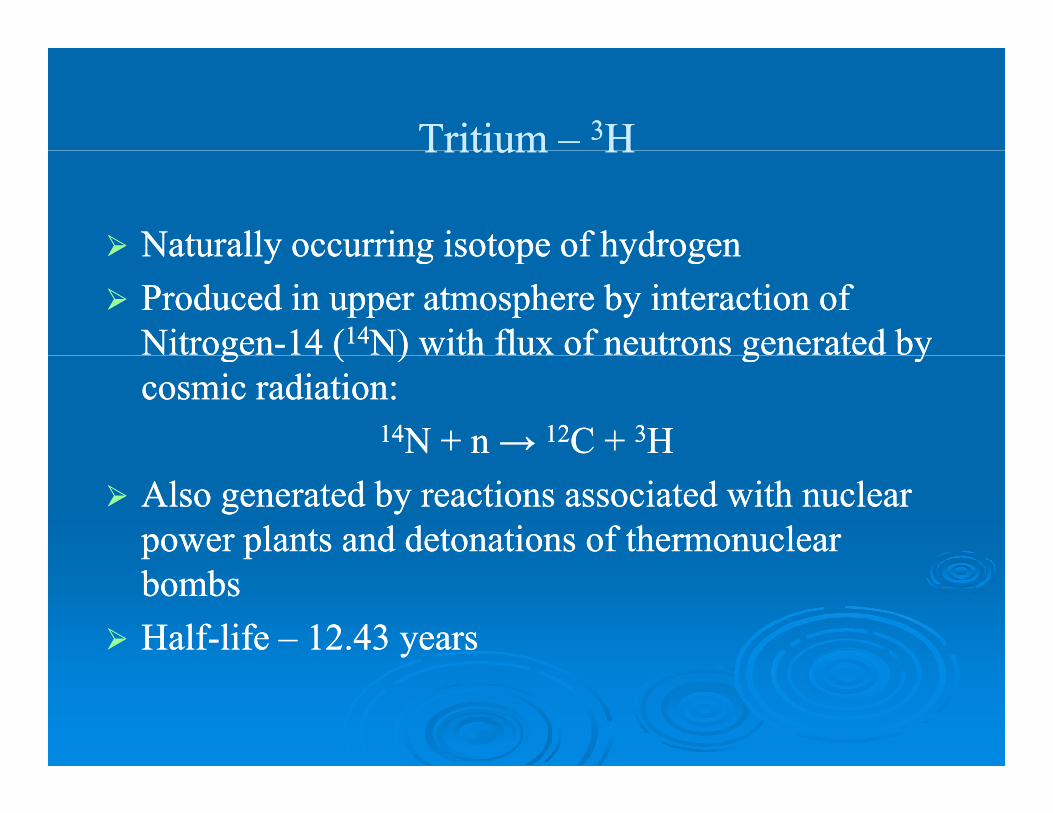
TritiumTritium –– 33HHTritium Tritium HH
Naturally occurring isotope of hydrogenNaturally occurring isotope of hydrogenNaturally occurring isotope of hydrogenNaturally occurring isotope of hydrogenProduced in upper atmosphere by interaction of Produced in upper atmosphere by interaction of NitrogenNitrogen--14 (14 (1414N) with flux of neutrons generated byN) with flux of neutrons generated bygg (( ) g y) g ycosmic radiation:cosmic radiation:
1414N + n N + n → → 1212C + C + 33HHAlso generated by reactions associated with nuclear Also generated by reactions associated with nuclear power plants and detonations of thermonuclear power plants and detonations of thermonuclear bombsbombsHalfHalf--life life –– 12.43 years12.43 years
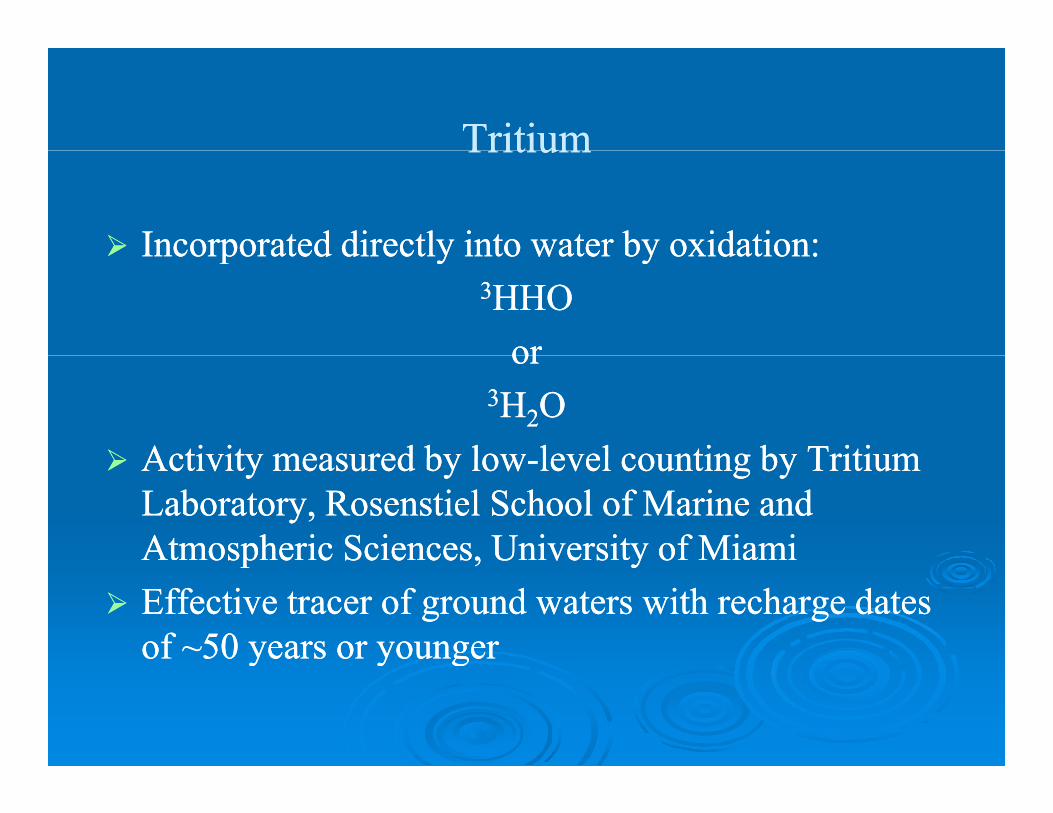
TritiumTritiumTritiumTritium
Incorporated directly into water by oxidation:Incorporated directly into water by oxidation:Incorporated directly into water by oxidation:Incorporated directly into water by oxidation:33HHOHHO
orororor33HH22OO
Activity measured by lowActivity measured by low level counting by Tritiumlevel counting by TritiumActivity measured by lowActivity measured by low--level counting by Tritium level counting by Tritium Laboratory, Rosenstiel School of Marine and Laboratory, Rosenstiel School of Marine and Atmospheric Sciences, University of MiamiAtmospheric Sciences, University of Miamiosp e c Sc e ces, U ve s y oosp e c Sc e ces, U ve s y oEffective tracer of ground waters with recharge dates Effective tracer of ground waters with recharge dates of ~50 years or youngerof ~50 years or youngery y gy y g
TritiumTritium –– 33HHTritium Tritium HH
““ConcentrationConcentration”” measured inmeasured in ““Tritium UnitsTritium Units””ConcentrationConcentration measured in measured in Tritium UnitsTritium UnitsA Tritium Unit is:A Tritium Unit is:
One atom ofOne atom of 33H per 10H per 101818 atoms of Hatoms of HOne atom of One atom of H per 10H per 10 atoms of Hatoms of H
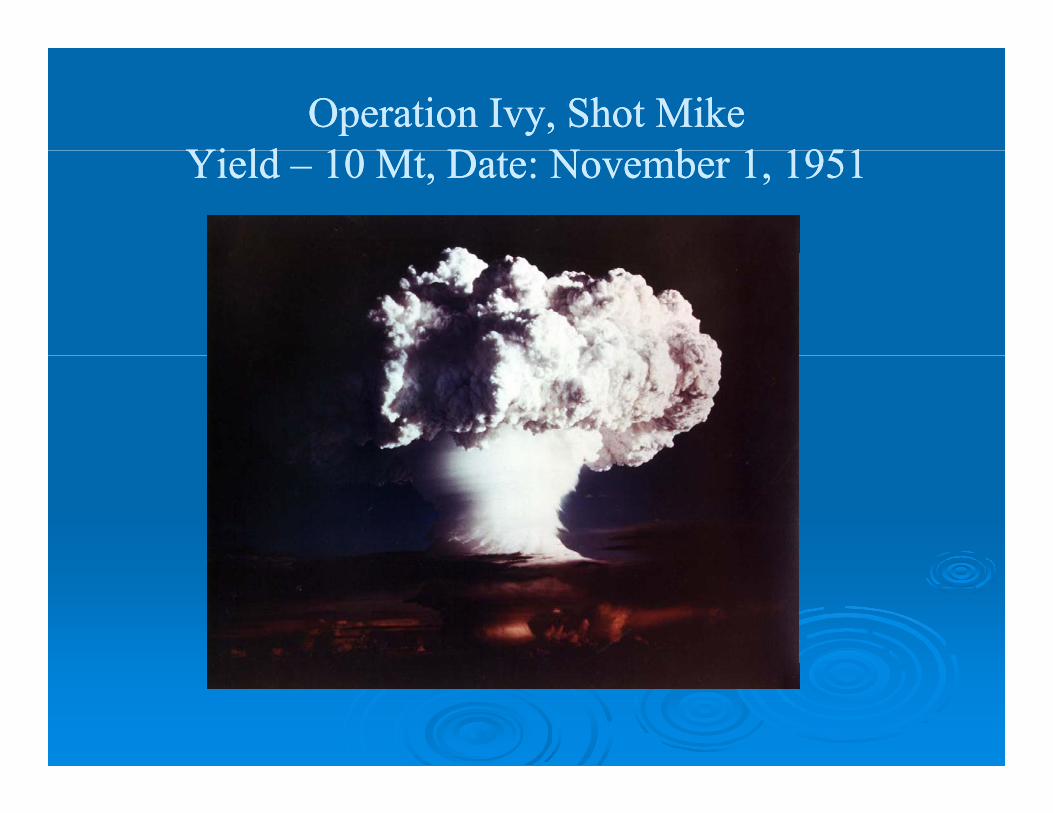
Thermonuclear Bombs Thermonuclear Bombs --Principal Anthropogenic Sources of TritiumPrincipal Anthropogenic Sources of Tritiump p gp p g
Operation Ivy, Shot MikeOperation Ivy, Shot MikeYi ldYi ld 10 M D N b 1 195110 M D N b 1 1951Yield Yield –– 10 Mt, Date: November 1, 195110 Mt, Date: November 1, 1951
D t ti f At i B b d E i llD t ti f At i B b d E i llDetonations of Atomic Bombs and Especially Detonations of Atomic Bombs and Especially Thermonuclear Bombs Generated TritiumThermonuclear Bombs Generated Tritium
f i E f T iti f N t l Pf i E f T iti f N t l Pfar in Excess of Tritium from Natural Processesfar in Excess of Tritium from Natural Processes
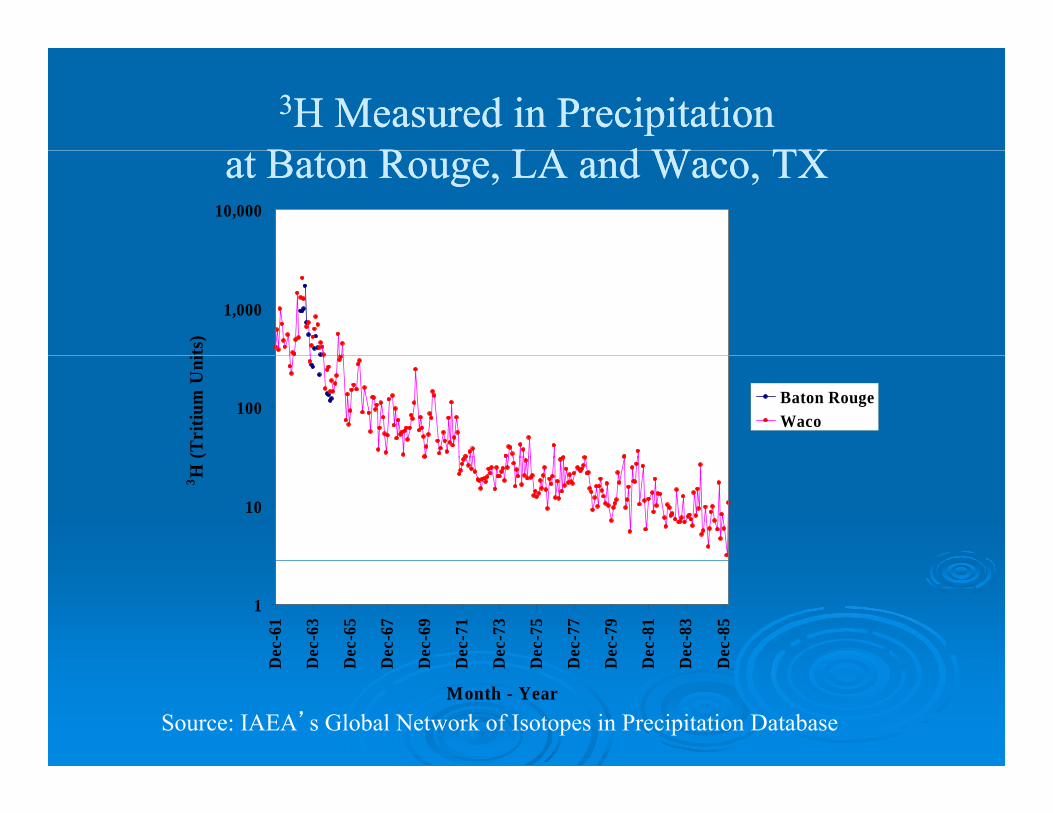
“Pre-bomb” levels of 3H in North Hemispherewere estimated to be 5 TU per yearwere estimated to be 5 TU per year.
Generation of 3H during period of above groundGeneration of H during period of above-groundtesting of thermonuclear bombs rose
to more than 2 000 TU by 1963to more than 2,000 TU by 1963.
Since 1963 the amount of 3H has decreasedSince 1963, the amount of H has decreasedto nearly pre-bomb levels.
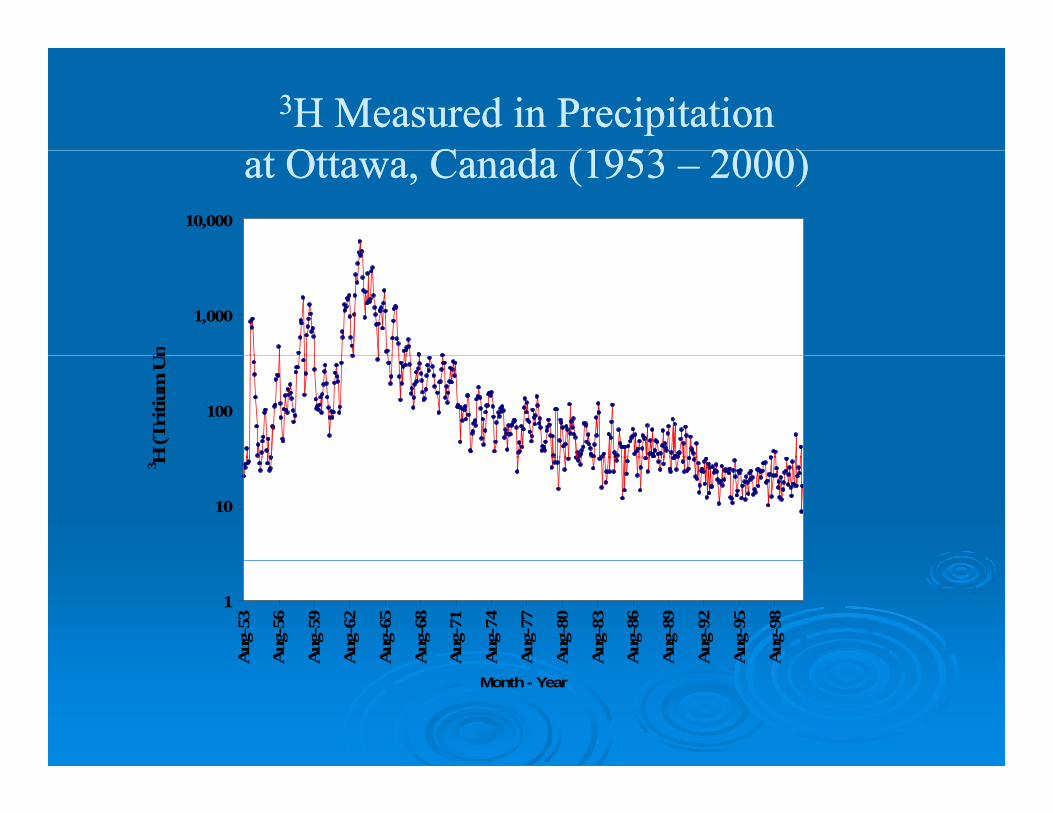
33H Measured in PrecipitationH Measured in PrecipitationO C d (1953O C d (1953 2000)2000)at Ottawa, Canada (1953 at Ottawa, Canada (1953 –– 2000)2000)
10,000
1,000
Un
100
H (T
ritiu
m U
n
10
3 H
1
Aug
-53
Aug
-56
Aug
-59
Aug
-62
Aug
-65
Aug
-68
Aug
-71
Aug
-74
Aug
-77
Aug
-80
Aug
-83
Aug
-86
Aug
-89
Aug
-92
Aug
-95
Aug
-98
A A A A A A A A A A A A A A A A
Month - Year
33H Measured in PrecipitationH Measured in PrecipitationB R LA d W TXB R LA d W TXat Baton Rouge, LA and Waco, TXat Baton Rouge, LA and Waco, TX
10,000
1,000
its)
100
(Tri
tium
Uni
Baton RougeWaco
10
3 H
1
Dec
-61
Dec
-63
Dec
-65
Dec
-67
Dec
-69
Dec
-71
Dec
-73
Dec
-75
Dec
-77
Dec
-79
Dec
-81
Dec
-83
Dec
-85
D D D D D D D D D D D D D
Month - Year
Source: IAEA’s Global Network of Isotopes in Precipitation Database
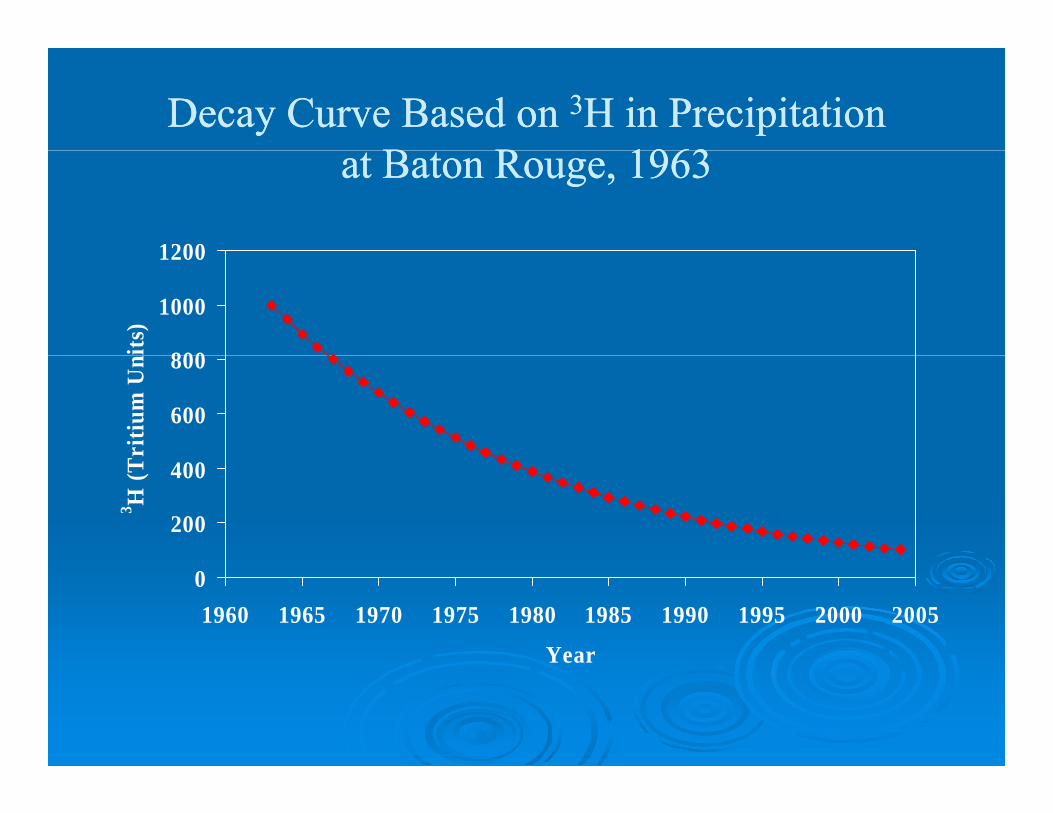
Decay Curve Based on Decay Curve Based on 33H in PrecipitationH in PrecipitationB R 1963B R 1963at Baton Rouge, 1963at Baton Rouge, 1963
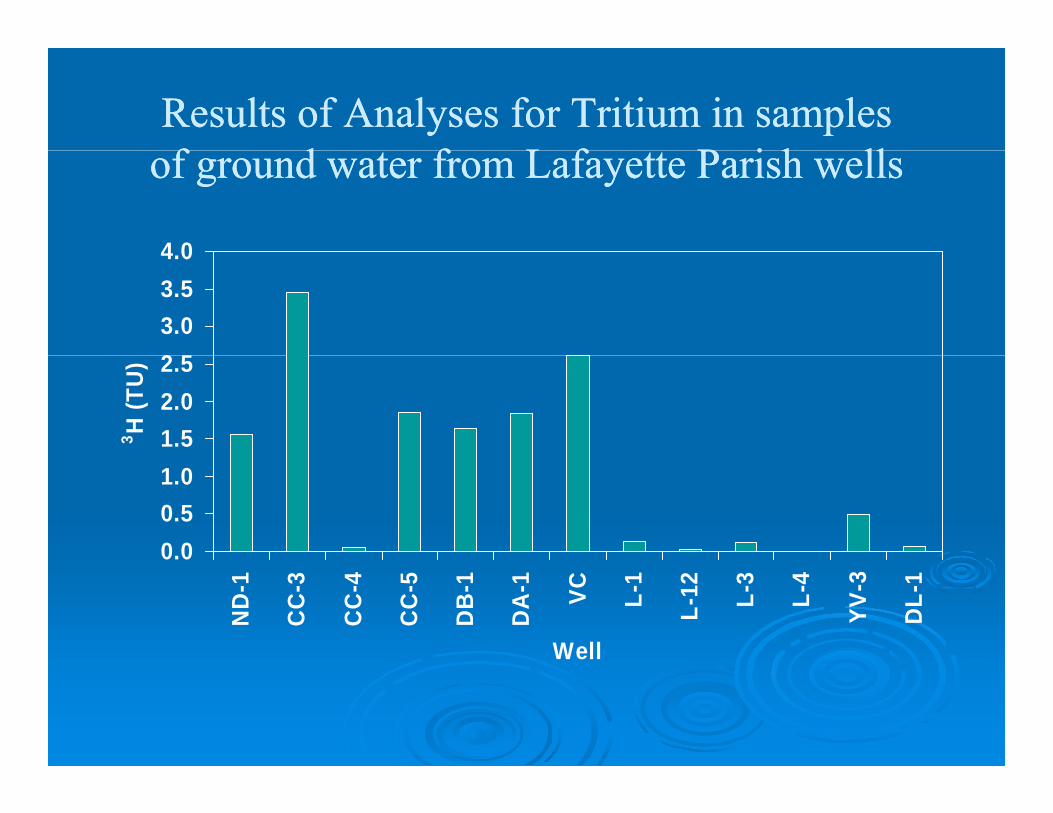
Results of Analyses for Tritium in samplesResults of Analyses for Tritium in samplesf d f L f P i h llf d f L f P i h llof ground water from Lafayette Parish wellsof ground water from Lafayette Parish wells
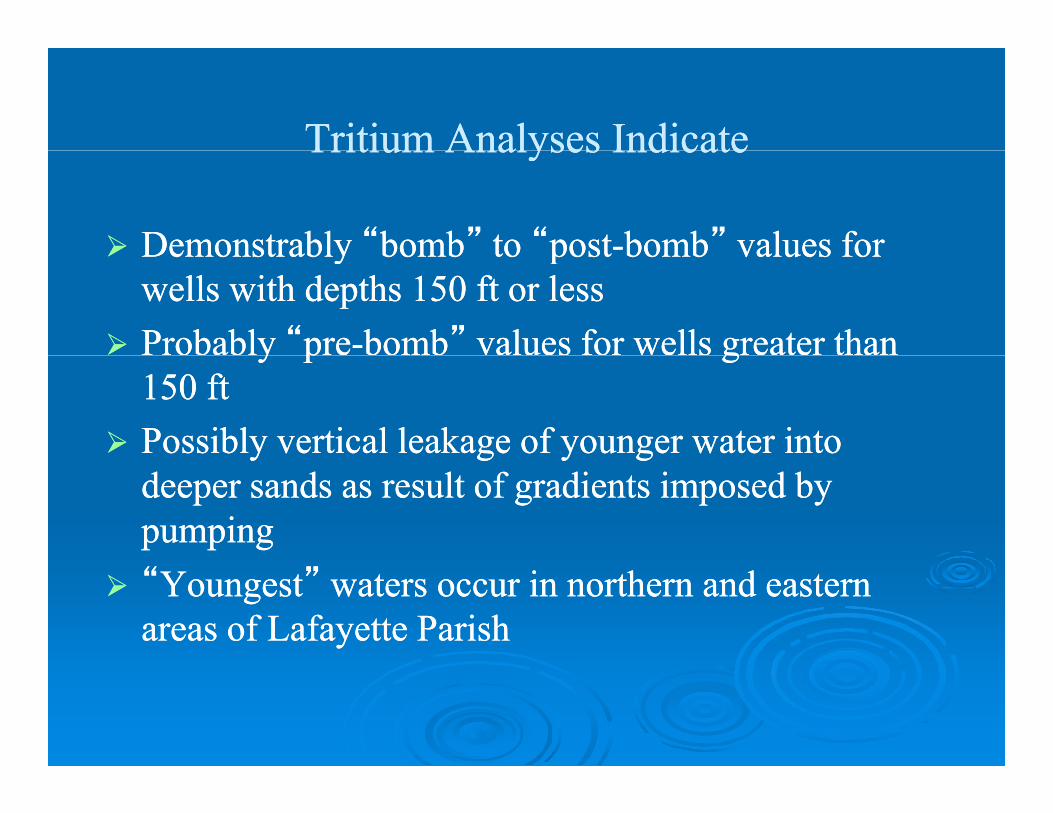
DemonstrablyDemonstrably ““bombbomb”” toto ““postpost--bombbomb”” values forvalues forDemonstrably Demonstrably bombbomb to to postpost bombbomb values for values for wells with depths 150 ft or lesswells with depths 150 ft or lessProbably Probably ““prepre--bombbomb”” values for wells greater than values for wells greater than yy pp gg150 ft150 ftPossibly vertical leakage of younger water into Possibly vertical leakage of younger water into y g y gy g y gdeeper sands as result of gradients imposed by deeper sands as result of gradients imposed by pumpingpumping““YoungestYoungest”” waters occur in northern and eastern waters occur in northern and eastern areas of Lafayette Parishareas of Lafayette Parish
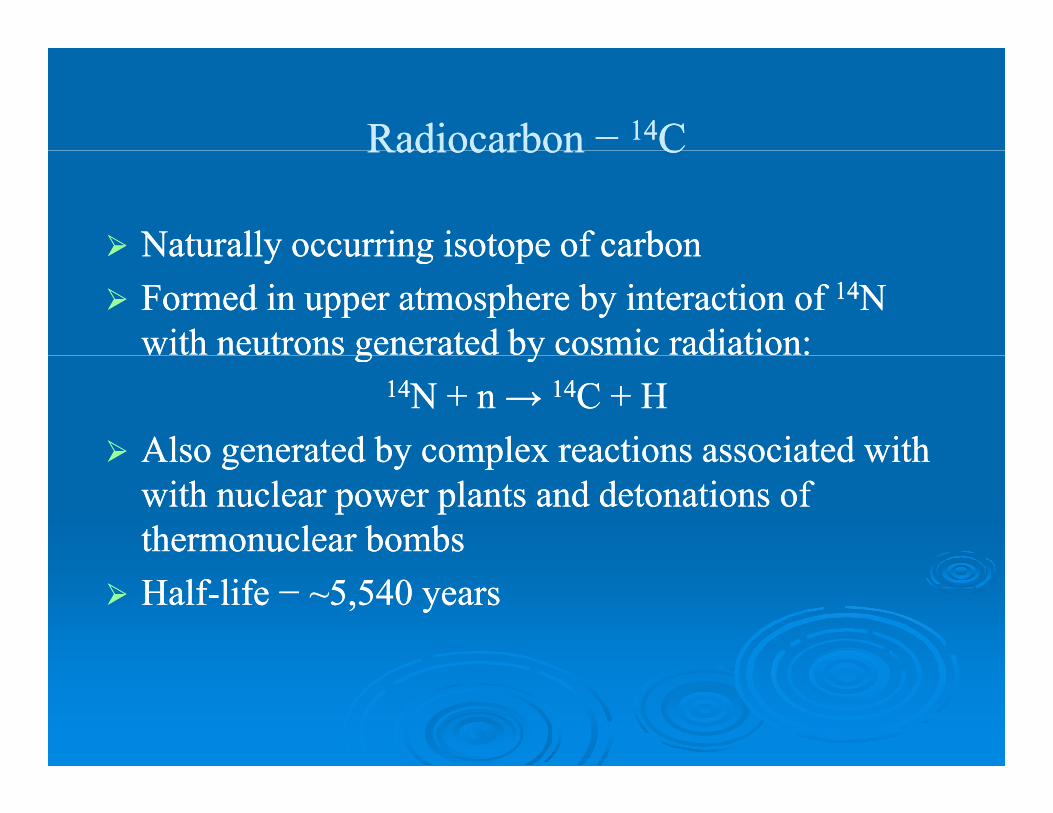
RadiocarbonRadiocarbon −− 1414CCRadiocarbon Radiocarbon CC
Naturally occurring isotope of carbonNaturally occurring isotope of carbonNaturally occurring isotope of carbonNaturally occurring isotope of carbonFormed in upper atmosphere by interaction of Formed in upper atmosphere by interaction of 1414NNwith neutrons generated by cosmic radiation:with neutrons generated by cosmic radiation:g yg y
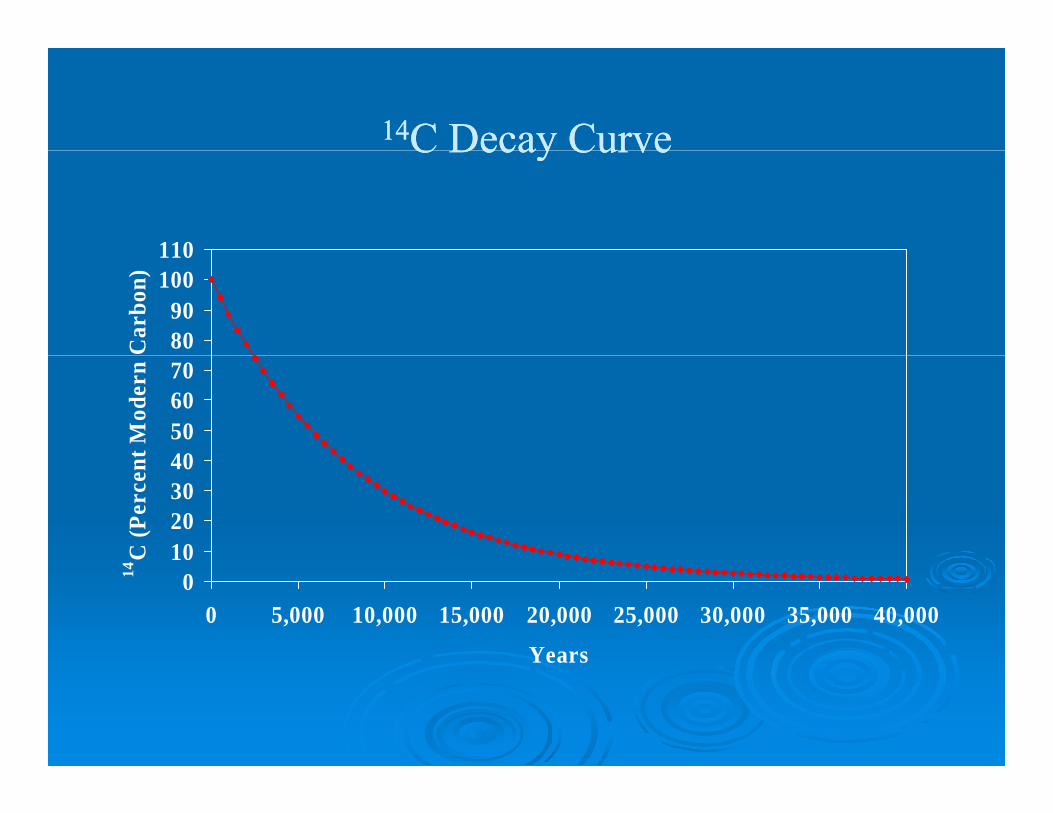
1414N + n N + n → → 1414C + HC + HAlso generated by complex reactions associated withAlso generated by complex reactions associated withAlso generated by complex reactions associated with Also generated by complex reactions associated with with nuclear power plants and detonations of with nuclear power plants and detonations of thermonuclear bombsthermonuclear bombsHalfHalf--life life − ~5,540 years− ~5,540 years
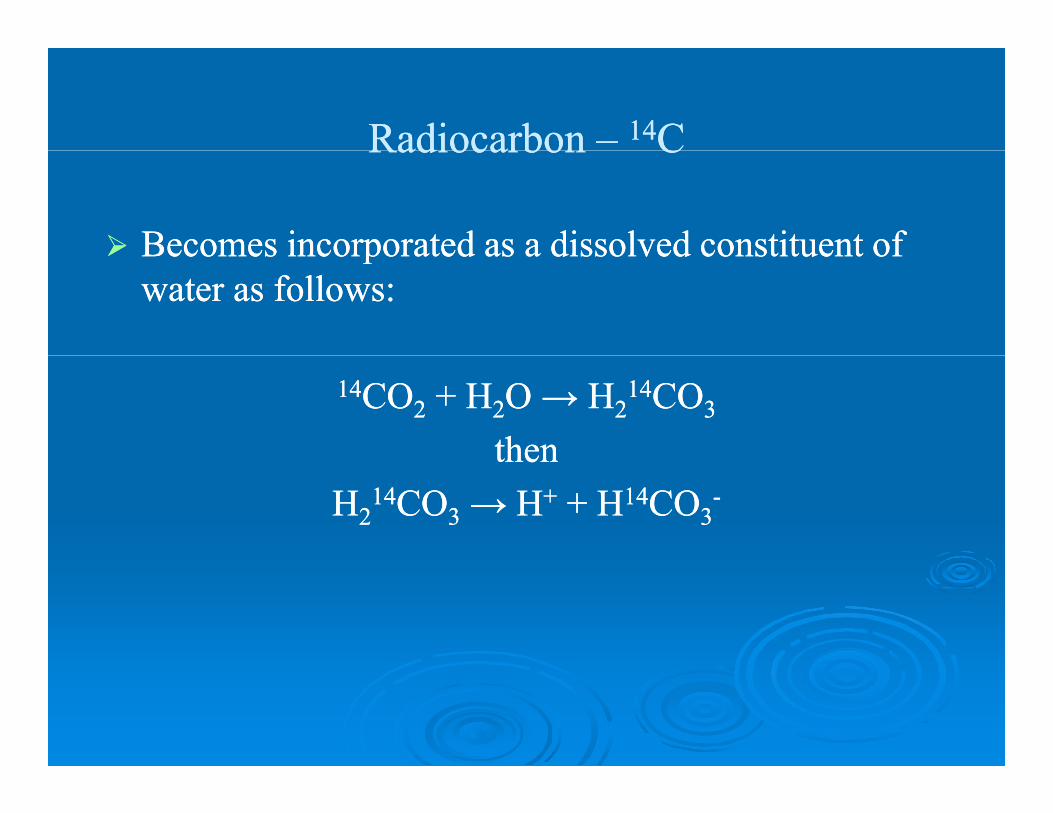
RadiocarbonRadiocarbon –– 1414CCRadiocarbon Radiocarbon CC
Becomes incorporated as a dissolved constituent ofBecomes incorporated as a dissolved constituent ofBecomes incorporated as a dissolved constituent of Becomes incorporated as a dissolved constituent of water as follows:water as follows:
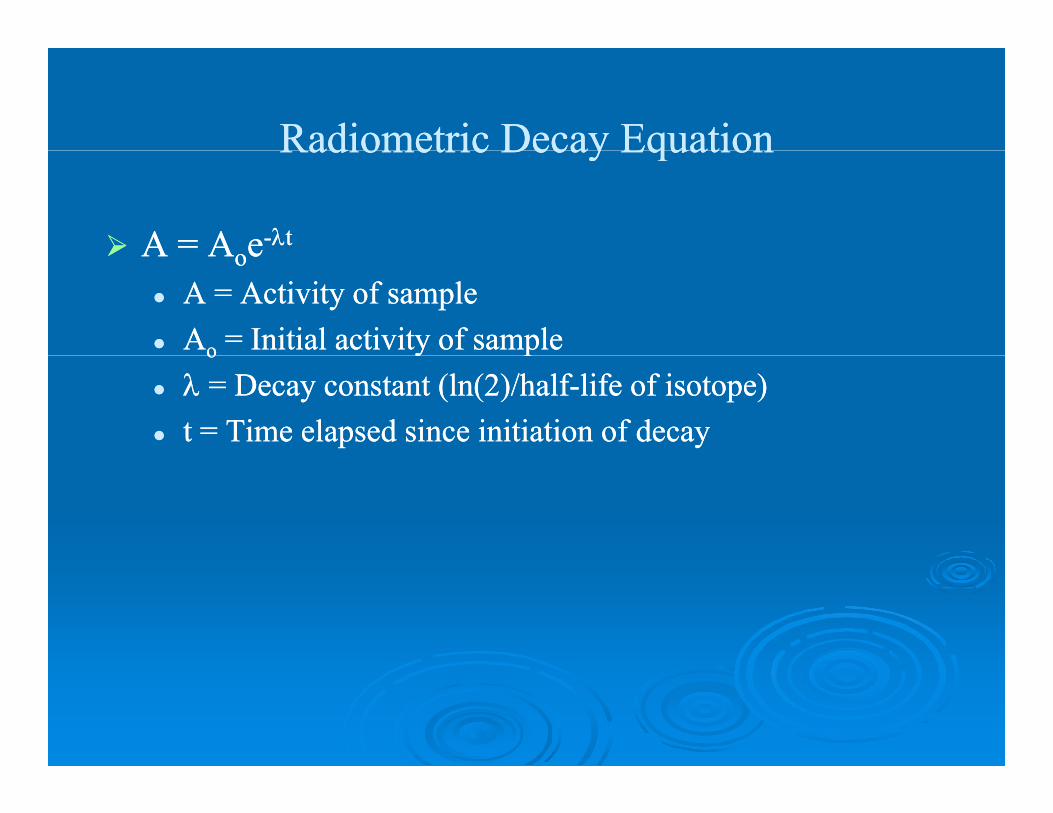
A = AA = A ee--λλttA AA AooeeA = Activity of sampleA = Activity of sampleAAoo = Initial activity of sample= Initial activity of sampleoo y py pλλ = Decay constant (ln(2)/half= Decay constant (ln(2)/half--life of isotope)life of isotope)t = Time elapsed since initiation of decayt = Time elapsed since initiation of decay
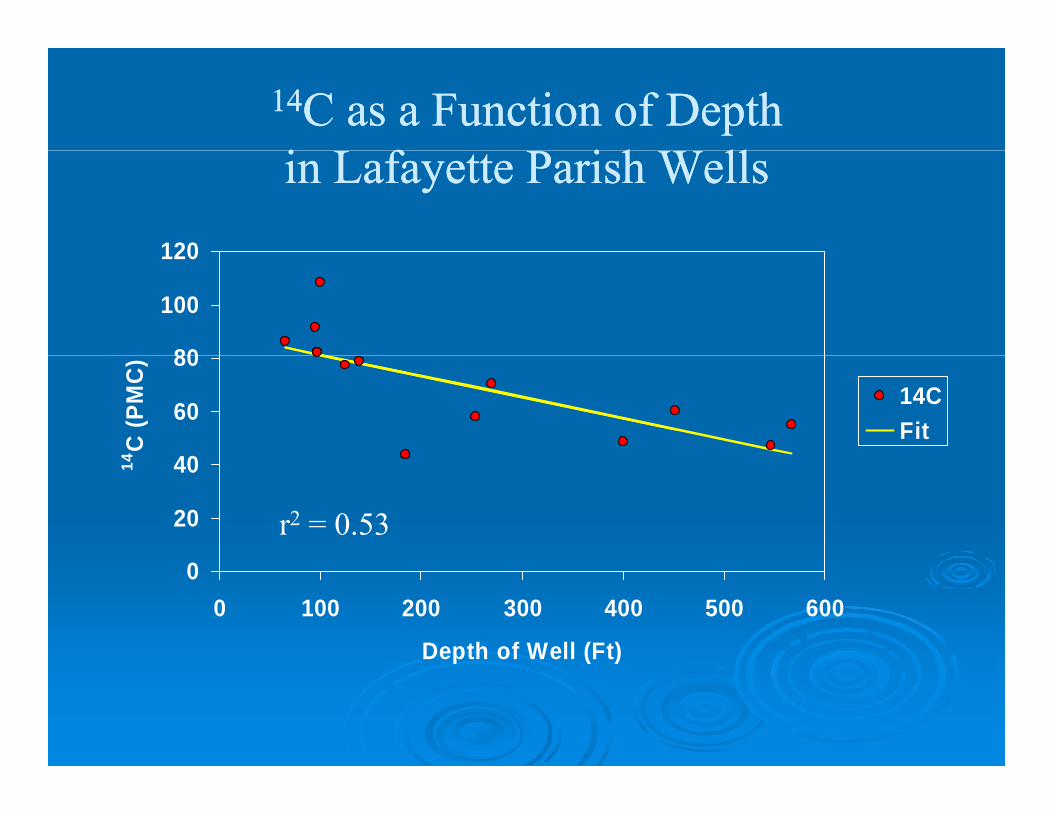
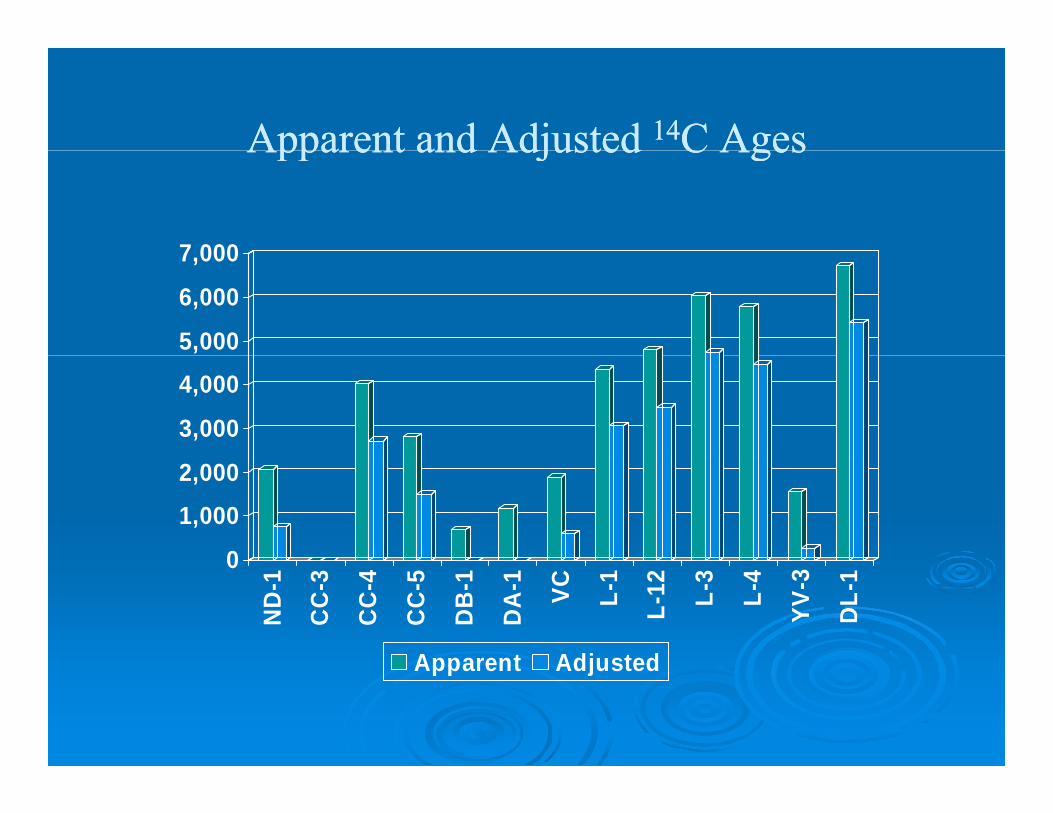
Ages ranging from modern to between 4,000 andAges ranging from modern to between 4,000 andAges ranging from modern to between 4,000 and Ages ranging from modern to between 4,000 and 6,000 years6,000 yearsYoungest Youngest 1414C ages associated with bomb/postC ages associated with bomb/post--bomb bomb gg g pg p33HHOldest Oldest 1414C ages associated with deeper wellsC ages associated with deeper wellsg pg p
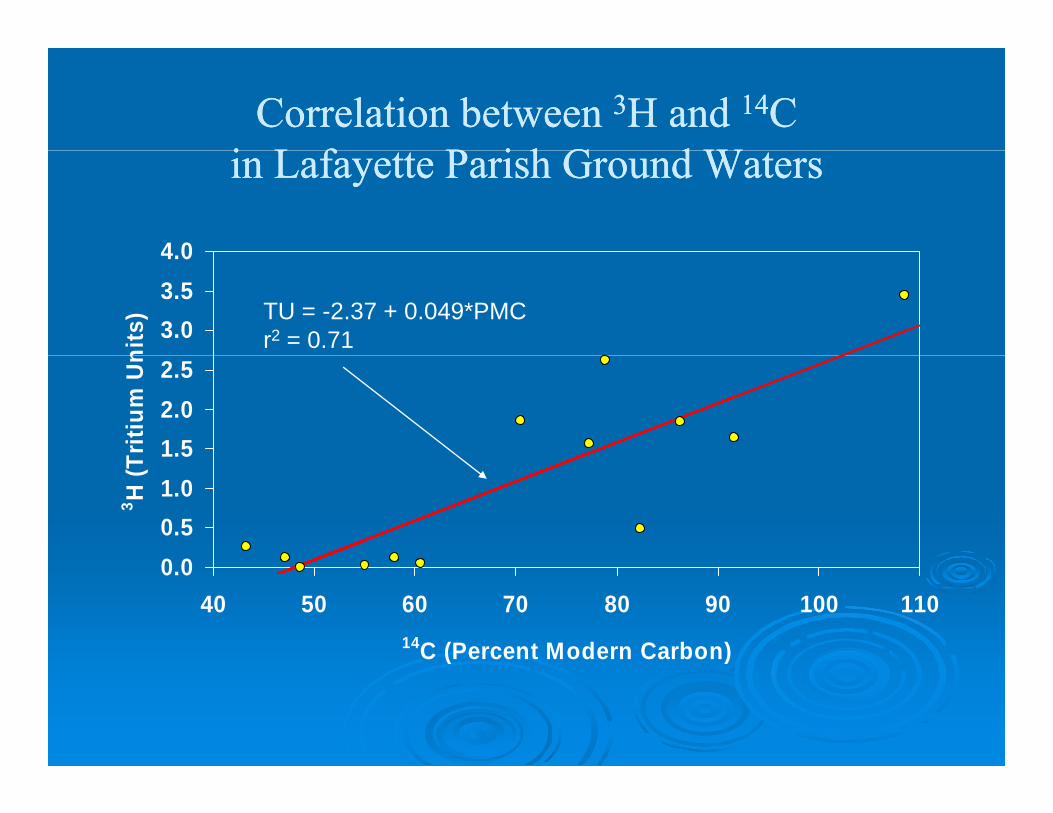
Correlation between Correlation between 33H and H and 1414CCi L f P i h G d Wi L f P i h G d Win Lafayette Parish Ground Watersin Lafayette Parish Ground Waters
4 0
3.03.54.0
nits
) TU = -2.37 + 0.049*PMCr2 = 0.71
1.52.02.5
Triti
um U
n
0 00.51.0
3 H (T
0.040 50 60 70 80 90 100 110
14C (Percent Modern Carbon)( )
CombinedCombined 33H andH and 1414C Analyses IndicateC Analyses IndicateCombined Combined H and H and C Analyses Indicate C Analyses Indicate
Reasonable correlation betweenReasonable correlation between 33H andH and 1414CCReasonable correlation between Reasonable correlation between H and H and CCProbable mixing between bomb/preProbable mixing between bomb/pre--bomb and postbomb and post--bomb watersbomb watersYoungest waters typically occur in shallow sands of Youngest waters typically occur in shallow sands of northern and eastern areas of Lafayette Parishnorthern and eastern areas of Lafayette ParishyyOldest waters tapped by deeper supply wellsOldest waters tapped by deeper supply wellsBest strategy to minimize threat of contamination is Best strategy to minimize threat of contamination is es s egy o e e o co o ses s egy o e e o co o sto drill municipal supply wells to sands of lower to drill municipal supply wells to sands of lower Chicot aquifer Chicot aquifer
Stable Isotopes of Oxygen and HydrogenStable Isotopes of Oxygen and HydrogenStable Isotopes of Oxygen and HydrogenStable Isotopes of Oxygen and Hydrogen
OxygenOxygen--18 (18 (1818O)O)OxygenOxygen 18 (18 ( O)O)Abundance reported as Abundance reported as δδ1818O O –– Standard Mean Ocean Water Standard Mean Ocean Water (SMOW)(SMOW)
Deuterium (Deuterium (22H)H)Abundance reported as Abundance reported as δδ1818O O –– SMOWSMOW
Abundances vary according to fractionation processes Abundances vary according to fractionation processes associated with temperature of precipitation, amount associated with temperature of precipitation, amount
f i i i i l i d dif i i i i l i d diof precipitation, evaporation, elevation, and distance of precipitation, evaporation, elevation, and distance from sourcefrom source
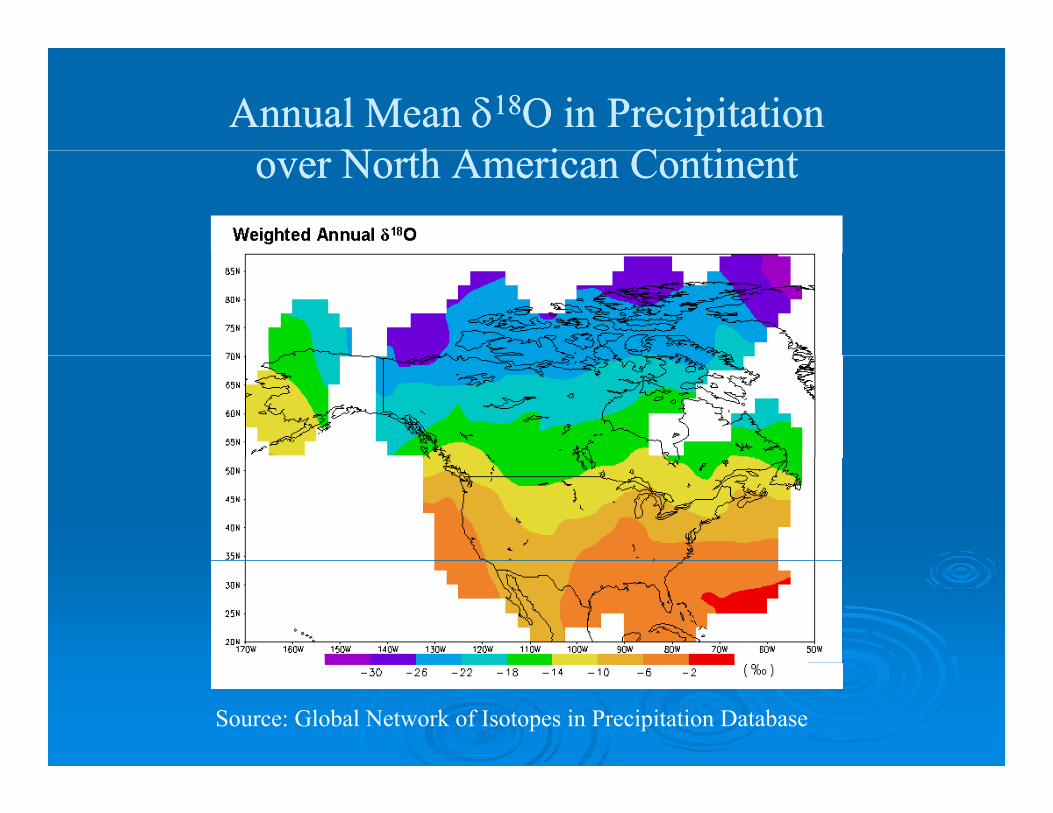
Annual Mean Annual Mean δδ1818O in PrecipitationO in PrecipitationN h A i C iN h A i C iover North American Continentover North American Continent
Source: Global Network of Isotopes in Precipitation Database
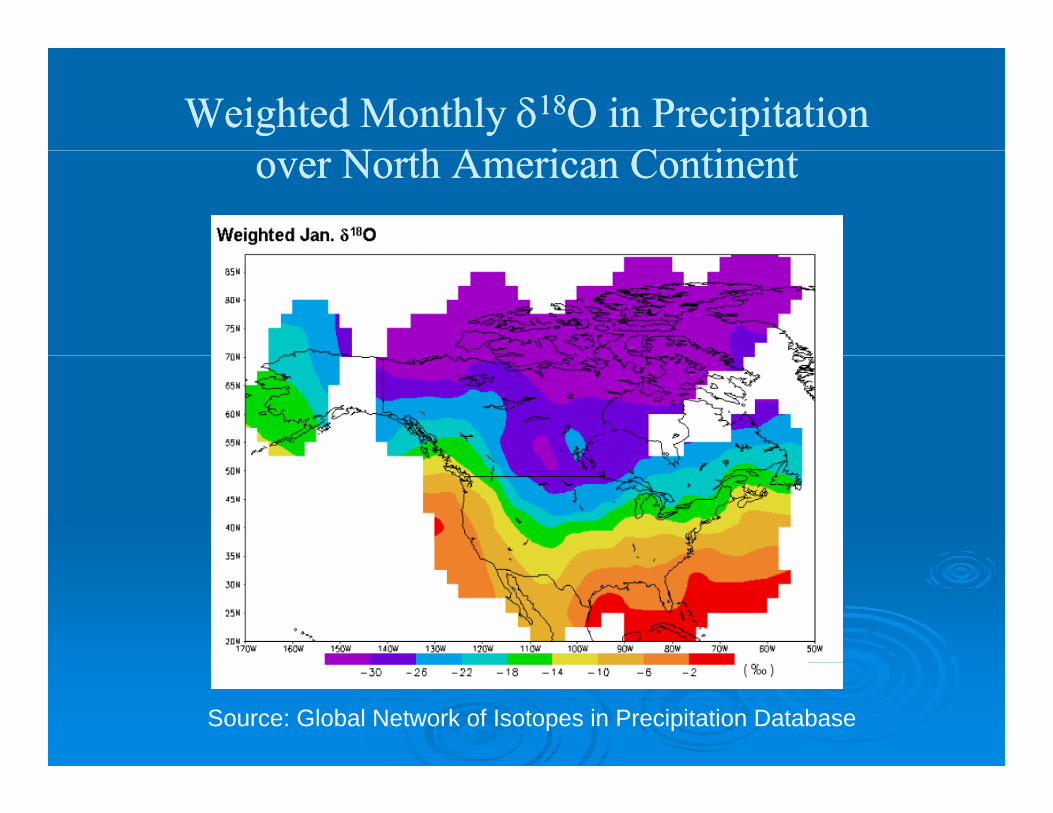
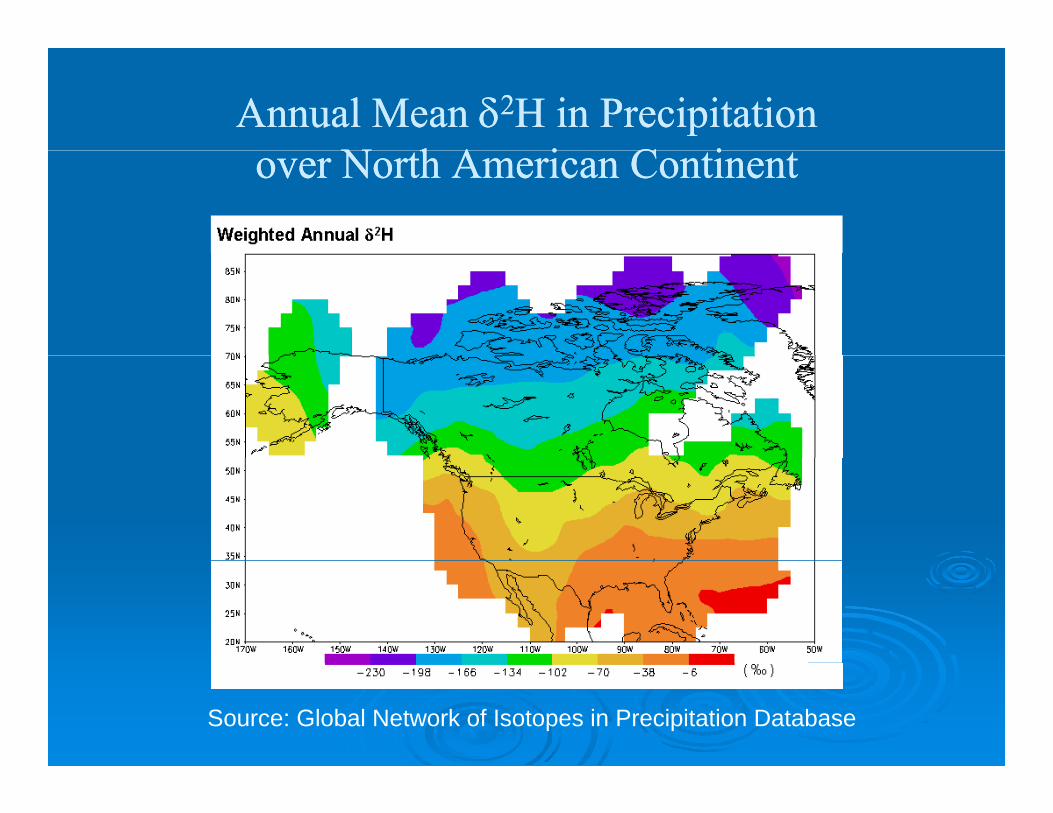
For For 1818O and O and 22HH
Precipitation becomes increasingly depleted inPrecipitation becomes increasingly depleted inPrecipitation becomes increasingly depleted in Precipitation becomes increasingly depleted in both isotopes toward the higher latitudes in the both isotopes toward the higher latitudes in the northern hemispherenorthern hemispherenorthern hemispherenorthern hemisphereWeighted means vary from month to monthWeighted means vary from month to monthD i l i l h i i iD i l i l h i i iDuring glacial epochs, precipitation was more During glacial epochs, precipitation was more depleteddepleted
Weighted Monthly Weighted Monthly δδ1818O in PrecipitationO in PrecipitationN h A i C iN h A i C iover North American Continentover North American Continent
Source: Global Network of Isotopes in Precipitation Database
Annual Mean Annual Mean δδ22H in PrecipitationH in PrecipitationN h A i C iN h A i C iover North American Continentover North American Continent
Source: Global Network of Isotopes in Precipitation Database
Weighted Monthly Weighted Monthly δδ22H in PrecipitationH in PrecipitationN h A i C iN h A i C iover North American Continentover North American Continent
Source: Global Network of Isotopes in Precipitation Database
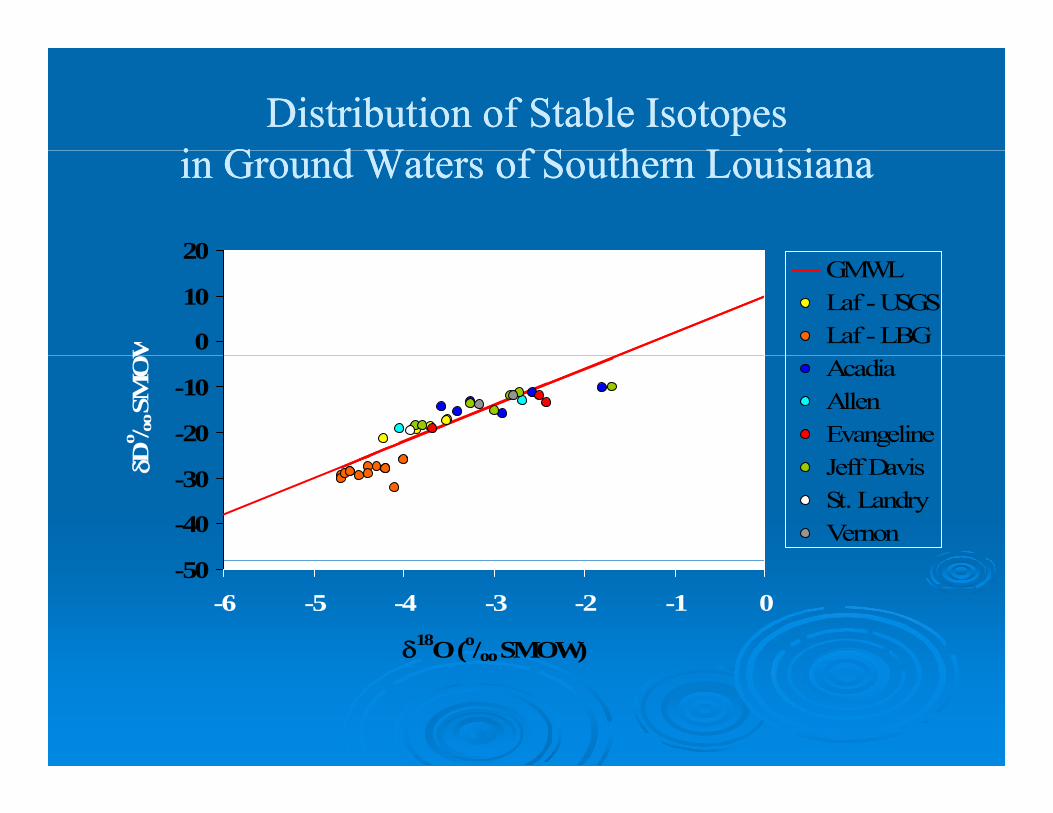
Distribution of Stable IsotopesDistribution of Stable Isotopesi G d W f S h L i ii G d W f S h L i iin Ground Waters of Southern Louisianain Ground Waters of Southern Louisiana
20
0
10
20
W
GMWLLaf - USGSLaf - LBG
-20
-10
D o / oo
SM
OW
AcadiaAllenEvangeline
-40
-30δD Jeff DavisSt. LandryVernon
-50-6 -5 -4 -3 -2 -1 0
δ18O (o/oo SMOW)
δδ1818O and O and δδ22H of Chicot Aquifer WatersH of Chicot Aquifer Watersδδ OO δδ C q WC q W
Are consistent with normal abundances for the regionAre consistent with normal abundances for the regionAre consistent with normal abundances for the regionAre consistent with normal abundances for the regionAre not indicative of precipitation in colder and Are not indicative of precipitation in colder and wetter climatic regimewetter climatic regimeggDo not manifest patterns indicative of evaporative Do not manifest patterns indicative of evaporative enrichmentenrichment
ConclusionsConclusionsConclusionsConclusions
Shallow ground waters are demonstrably modernShallow ground waters are demonstrably modernShallow ground waters are demonstrably modernShallow ground waters are demonstrably modernAges increase (often sharply) with depthAges increase (often sharply) with depthFranFrançois coulee area of northern Lafayette Parishçois coulee area of northern Lafayette ParishFranFrançois coulee area of northern Lafayette Parish çois coulee area of northern Lafayette Parish appears to have greatest potential for rechargeappears to have greatest potential for rechargeSafest strategy for LUS and other suppliers of publicSafest strategy for LUS and other suppliers of publicSafest strategy for LUS and other suppliers of public Safest strategy for LUS and other suppliers of public water is to complete wells in lower Chicot sandwater is to complete wells in lower Chicot sand