ISPARK: Interactive Visual Analytics for Fire Incidents and Station Placement Subhajit Das, Andrea McCarter, Joe Minieri, Nandita Damaraju, Sriram Padmanabhan, Duen Horng (Polo) Chau Georgia Tech Atlanta, GA, USA {das, andream, jminieri, nandita, sriramp, polo}@gatech.edu ABSTRACT In support of helping to reduce the response time of fire- fighters, and thus deaths, injuries, and property loss due to fires, we introduce ISPARK. The ISPARK system deter- mines where fire stations should be located, analyzes the primary causes of fires, the existing infrastructure, and re- sponse times, by using visualizations which show the GIS mapping of fire stations on a dashboard. Incidents and re- sponse times are shown as additional layers, with cluster- ing of fire incidents to determine predicted fire station loca- tions, forecasting of fire incidents using regression, causal, infrastructure, and personnel analysis, creating an interac- tive, multi-faceted method for locating fire stations. A com- parison of urban and rural fire incident response times is an- other dimension of this study. We demonstrate ISPARK’s usage and benefits using a publicly available dataset describ- ing 300,000 fire incidents in the states of Massachusetts and Maine. ISPARK is generalizable to other geographic areas and domains, such as police stations, schools, hospitals. Categories and Subject Descriptors H.1.2 [User/Machine Systems]: Human factors; H.5.2 [Information Interfaces and Presentation]: User In- terfaces General Terms Visual Analytics, Data Mining, Human-computer Interac- tion, Design, Human Factors Keywords Fire incidents, GIS, clustering, regression, response time, mapping, NFIRS, FEMA, GeoJSON, leaflet, D3 1. INTRODUCTION In 2013 [14], deaths, injuries, and property losses due to fire were extensive (Figure 2). If the response time can be Permission to make digital or hard copies of all or part of this work for personal or classroom use is granted without fee provided that copies are not made or distributed for profit or commercial advantage and that copies bear this notice and the full citation on the first page. To copy otherwise, to republish, to post on servers or to redistribute to lists, requires prior specific permission and/or a fee. KDD 2015 Workshop on Interactive Data Exploration and Analytics (IDEA’15) August 10th, 2015, Sydney, Australia. Copyright is held by the owner/author(s). Figure 1: Screenshot of ISPARK showing actual (pink) and predicted (green) fire station locations in Maine determined by our approach, using coordi- nates with actual driving distances from fire stations to actual fire incidents. Fire incidents are shown as small yellow dots. ISPARK reduces the average driving distance between the fire stations and the fire incidents by about 1/3. reduced by just one minute, fewer injuries and deaths should occur, and the cost of reconstruction will be reduced. The goal is to reduce response time for fire stations to aid in a fire, thus reducing injuries, deaths, and property damage from fires. Determining where fire stations should be located to minimize driving distance and response time (Figure 1), analyzing the causes of fires, the existing infrastructure and personnel, and comparison of response times will be ben- eficial in reaching this goal. There are no federal laws on fire incident response time, but the National Fire Protec- tion Association (NFPA) has detailed standards which most communities use [3]. Response time includes: (1) Dispatch time: 1 min.; (2) Turnout time: 1 min.; (3) Travel time: 4 min.; (4) Setup time: 2 minutes. Since fire grows expo- nentially in the first 10 min, doubling every second, before flashover, response time is critical. Past approaches to the problem of fire station location have used GIS [8], optimization, classification, regression, and satellite imagery. GIS, primarily as an historical and descriptive tool, has been used in Oregon [10], Oklahoma City [22], Nevada [9], Moscow [16], and Turkey [18]. Bal- timore [7] and the Open Data Institute [12] went beyond 29
Transcript
ISPARK: Interactive Visual Analytics for Fire Incidents andStation Placement
Subhajit Das, Andrea McCarter, Joe Minieri, Nandita Damaraju, SriramPadmanabhan, Duen Horng (Polo) Chau
In support of helping to reduce the response time of fire-fighters, and thus deaths, injuries, and property loss dueto fires, we introduce ISPARK. The ISPARK system deter-mines where fire stations should be located, analyzes theprimary causes of fires, the existing infrastructure, and re-sponse times, by using visualizations which show the GISmapping of fire stations on a dashboard. Incidents and re-sponse times are shown as additional layers, with cluster-ing of fire incidents to determine predicted fire station loca-tions, forecasting of fire incidents using regression, causal,infrastructure, and personnel analysis, creating an interac-tive, multi-faceted method for locating fire stations. A com-parison of urban and rural fire incident response times is an-other dimension of this study. We demonstrate ISPARK’susage and benefits using a publicly available dataset describ-ing 300,000 fire incidents in the states of Massachusetts andMaine. ISPARK is generalizable to other geographic areasand domains, such as police stations, schools, hospitals.
Categories and Subject Descriptors
H.1.2 [User/Machine Systems]: Human factors; H.5.2[Information Interfaces and Presentation]: User In-terfaces
General Terms
Visual Analytics, Data Mining, Human-computer Interac-tion, Design, Human Factors
1. INTRODUCTIONIn 2013 [14], deaths, injuries, and property losses due to
fire were extensive (Figure 2). If the response time can be
Permission to make digital or hard copies of all or part of this work forpersonal or classroom use is granted without fee provided that copies arenot made or distributed for profit or commercial advantage and that copiesbear this notice and the full citation on the first page. To copy otherwise, torepublish, to post on servers or to redistribute to lists, requires prior specificpermission and/or a fee.KDD 2015 Workshop on Interactive Data Exploration and Analytics
(IDEA’15) August 10th, 2015, Sydney, Australia.Copyright is held by the owner/author(s).
Figure 1: Screenshot of ISPARK showing actual(pink) and predicted (green) fire station locationsin Maine determined by our approach, using coordi-nates with actual driving distances from fire stationsto actual fire incidents. Fire incidents are shownas small yellow dots. ISPARK reduces the averagedriving distance between the fire stations and thefire incidents by about 1/3.
reduced by just one minute, fewer injuries and deaths shouldoccur, and the cost of reconstruction will be reduced. Thegoal is to reduce response time for fire stations to aid ina fire, thus reducing injuries, deaths, and property damagefrom fires. Determining where fire stations should be locatedto minimize driving distance and response time (Figure 1),analyzing the causes of fires, the existing infrastructure andpersonnel, and comparison of response times will be ben-eficial in reaching this goal. There are no federal laws onfire incident response time, but the National Fire Protec-tion Association (NFPA) has detailed standards which mostcommunities use [3]. Response time includes: (1) Dispatchtime: 1 min.; (2) Turnout time: 1 min.; (3) Travel time:4 min.; (4) Setup time: 2 minutes. Since fire grows expo-nentially in the first 10 min, doubling every second, beforeflashover, response time is critical.Past approaches to the problem of fire station location
have used GIS [8], optimization, classification, regression,and satellite imagery. GIS, primarily as an historical anddescriptive tool, has been used in Oregon [10], OklahomaCity [22], Nevada [9], Moscow [16], and Turkey [18]. Bal-timore [7] and the Open Data Institute [12] went beyond
29
!"#$
!!"#$ %&'&(&)*+%&"&' ,&-.,&/01.-+2
&*34-.5
())*$+6&((&7*&*2(7++.+
,%&-$##+074+.+7*.2.'.-829:2+.%7*5
)-!"#-### ,&-.+27*.2.'.-82!$ +.%7*5
Figure 2: Impact of fire loss for the entire UnitedStates in 2013.
!"#$%&'#$()
*'#'
!"+&',#&-.#-&$)
'"()/$&,0""$1)
234567
38&$)!".8($"#)
*'#')293!:;7
<$0=;>9
?0-"#@)*'#')
2.$",-,A%0B7
Figure 3: Schematic diagram showing the ISPARKdata sources. County and state level detailed in-frastructure and personnel data were available fromFEMA, fire incident data from NFIRS, and geo-graphic coordinates and population data from theU.S. Census.
these studies to create interactive maps, so the user couldclick on a fire station, close it down, and see the impact toresponse times. Malik et al created a system to visualizethe impact of closing Coast Guard stations on search andrescue operations [1]. Interactive filtering and linked viewswere used by Maciejewski et al to visually detect hotspots[19]. Karafyllidis [13], Sen et al [24], and Liu [15] all usedoptimization combined with GIS to maximize map grid cov-erage and minimize cost. Sitanggang [20] studied physicaldata to classify 2693 objects using Naıve Bayes, relatingthem to fire incidence and location. Hernandez-Leal et al[11] developed a fire risk index for forest fires using regres-sion, combining variables such as satellite sensing data. Inthe city of Boston, Massachusetts (MA) an enterprise GISsystem (ESRI based) is available to all staff, but has not yetbeen applied to locating fire stations, other than showingthem on a map [6]. Maine (ME) also has an enterprise GISsystem (ESRI) which has not yet been applied to this area[21]. In regard to interactive word clouds, previous work inthis area has been done by Viegas [23].Maine, with a population density of only 43 people per
square mile, versus Massachusetts, with a population den-sity of 12,793 people per square mile, were selected [5] sothat an urban vs rural comparison could be made. BothMA and ME contribute data to the National Fire IncidentReporting System (NFIRS), a publicly available voluntarydatabase used in our project [17]. One of the members ofour project team is a volunteer firefighter in Maine, so hisdomain knowledge in this area is a significant help to us.The central theme of our visualization is a GIS-level view
of the data, followed by visualizations such as geographicpatterns, parallel coordinates for infrastructure, word cloudsexamining causes, recommended fire station location, re-sponse time comparisons in urban and rural areas, and pre-dictions of response times in the future. Previous worklacked interactivity, used expensive tools, was not easily ex-tensible to other areas, and used outdated methods. Weintroduce ISPARK, which provides the following contribu-tions:
• An interactive, integrated dashboard using open sourcetools, for implementation at low cost for fire depart-ments across the United States, using ME and MA asthe starting points.
• Prediction of the recommended location of fire stationsusing K-means clustering.
• Prediction of the response times for future years, andcomparison of the actual and predicted response timesof the firefighters.
• Determination of differences in urban and rural re-sponse times.
2. DATA SOURCES AND PREPARATIONThree data sources were used: (1) FEMA, for the infras-
tructure and personnel; (2) NFIRS for the fire incident data;and (3) the U.S. Census for the GeoJSON county level co-ordinates and population data (Figure 3). The U.S. FireAdministration collects data via the National Fire IncidentReporting System (NFIRS) system, which is the world’slargest national, annual database of fire incident informa-tion. NFIRS is a reporting standard that fire departmentsuse to uniformly report on the full range of their activities,from fire to emergency medical services (EMS) to equipmentinvolved in the response. The database comprises about 75percent of all reported fires that occur annually. Partici-pating fire departments report about 22,000,000 incidentsand 1,000,000 fires each year. For this study, approximately300,000 records and 50 fields were extracted and cleaned forMaine and Massachusetts for 2010 through 2012, which was500 MB. Two formats were created: csv (comma-separatedvalues) and JSON (JavaScript Object Notation). Most ofthe data analysis was performed using csv format files, ex-cept for shape files and GeoJSON files to overlay shape layerson top of the Leaflet Map.An additional data source was Microsoft Bing, which was
used for geocoding fire station, fire incidents, driving dis-tance (distance from the fire station to the fire incident), andpredicted driving duration (time to get from the fire stationto the fire incident). The latter was done both for the ex-isting and the recommended fire stations as the originatingpoint. We chose Bing due to their high query threshold, al-lowing us to issue as many API calls per day as were neededfor this project.
30
Figure 4: ISPARK’s dashboard when opening the application. Left: fire incidents by county in Maine andMassachusetts for 2012 shown as histograms. Right: showing the same fire incident distributions geographi-cally on a map (a darker county means having more fire incidents).
Perl scripts were written to refine the data for Maine andMassachusetts from the NFIRS national database for 2010,2011, and 2012 in both JSON and csv formats. The lati-tudes, longitudes, predicted duration and driving distancesfrom the fire station to the fire incident were also obtainedfrom Bing using Perl scripts.
3. ISPARK: DESIGN & CAPABILITIES
3.1 Overview of The ISPARK SystemOur approach includes integration of the data, visualiza-
tion of the data on a dashboard, and various analyses of thedata (Figure 4). The dashboard was divided into two sec-tions, an analytics and a geographic panel (Figure 5). Theanalytics panel, based on D3.js, a JavaScript library for ma-nipulating documents based on data [4], changes dependingon the selected mode of the geographic panel. The geo-graphic panel reveals the visual patterns of incidents, firestations, and recommended fire stations using GIS map-ping with Leaflet.js.[2] The analytics information includetrends and statistical regressions, infrastructure analyticsusing D3.js parallel coordinates, K-means clustering to de-termine the recommended fire station locations, comparisonof predicted with actual response times, and word cloudsbased on the causes of fires.
3.2 Dashboard SummaryThe two dashboard panels are: (1) the left analytic panel,
in which multiple histograms, word clouds, and other ana-lytics are displayed, including the default 2012 county leveldata for Maine first, and then Massachusetts underneath; (2)the right geographic panel, which allows the user to zoom toany level desired using the “+” and “-“ keys in the upper leftsection of the panel, with the default display shown as Maineand Massachusetts divided by county and shaded according
!"#$%&'()*+#",$
w !"#$%&'()*"
w +#",-.#/0&120$'"
w 30.-1#4$"5#6"&
701800$&#$9#'0$1&
.49-1#4$&-$'&:0-1,20"
w ;4.#"1#9&
,$'02"1-$'#$%
-,./0#12'(#$*3'4
+#",$
w <=>&7-"0'&?-66#$%&
4:&:#20&#$9#'0$1"&-$'&
"1-1#4$"
w @#15&.0-:.01)*"
w A-"B&C#",-.#/-1#4$
w D#"902$-7.0&6-1102$"
Figure 5: Schematic diagram showing the proposeddata visualization toolset UI.
to the 2012 density of fire incidents. The right panel alsooffers multiple check boxes for “Fire Station Mode”, “CountyMode Off’, “Predict Ideal Fire Station On”, and “DistanceMode On”. Additionally, prominent teardrop shape markerson each state can be clicked to show state level data. Theuser can also switch to another year through a menu optionoffering the years 2012, 2011, or 2010. These features will bedescribed in more depth as we proceed through the designdescription.The user will see the opening visualization with the map
of the United States on the right, and the defaults shown asindicated (Figure 4). By clicking the buttons for each year,the county incident histograms on the left panel and densityof shading in the counties in the right panel will change
31
Figure 6: (a) Screenshot showing the fire stations(red dots) mapped over the states of MA and MN;(b) Fire stations zoomed in over the state of MA,and pop-up of fire department name, Lunenberg,when hovering over fire station.
appropriately. Since the fire incidents are too numerous toshow individually, the counties are shaded according to thedensity of fire incidents, thus avoiding overplotting .One of the options on the right panel offered to the user
is to go into the “Fire Station Mode” (Figure 6a). Checkingthis box on the right panel will add the fire station locationoverlays on the states of MA and ME. By also checkingthe “County Mode Off” box, the fire station display will becleaner looking. By clicking the “+” sign in the upper left ofthe screen, the user can zoom in as far as desired, and then,by hovering over a fire station node (red), see the name ofany of the individual fire stations (Figure 6b). Note thatthe infrastructure, i.e., the number of various types of staffis shown (career, volunteer, paid per call, and so on) is alsoshown for that station.
3.3 Mapping Fire Incidents:Techniques & Design
Open source web technologies have been used, with a twopanel interface, the right panel containing the Leaflet mapwith layers, and the left panel containing a JavaScript en-abled interface, with multiple D3 visualizations. These twopanels are designed to communicate with each other, so that
Figure 7: (a) Fire stations (red discs) zoomed inwith left panel showing infrastructure for Winthropfire station being hovered over; (b) Fire incidents(yellow dots) within a certain response time interval(e.g., 5 min) for the Winthrop fire station.
the related charts show up as the user selects various sets ofinformation options on the visualization.This map showcases incident data from 2010, 2011 and
2012, and provides a basis for future fire station locationsfor the entire country. The longitude and latitude valuesare used to retrieve the counties for each incident, and thenshade them based on the number of incidents per year. Thedashboard includes popups which load up as soon as the userclicks on any of the fire incidents or fire stations, providingmore detailed information about the fire department, its ca-pacity, and average response time. For the fire incidents,popups provide the actual response time compared to thepredicted response time for that incident.Multiple modes are provided, including the fire station
and the incident modes. The fire station mode allows theuser to zoom in to see the locations of all of the fire stations,and to see the number of different types of personnel (profes-sional, volunteer, EMS staff) for each fire station. Selectionbuttons at the top by year provide the data for those timeframes. Markers on top of each state provide various typesof state level data when clicked.
3.4 Visualizing & Predicting Response TimesIn Figure 7a, one of the fire stations has been selected by
the user, and a response interval entered in the left panel,with the fire incidents served by that fire station within thespecified time interval (5 min.) shown as yellow nodes. Ifthe user now hovers over an incident, both the actual andthe predicted response time will be shown (Figure 7b). Mostoften, the actual response time will be faster than the pre-dicted response time, as in the example below, since the fire
32
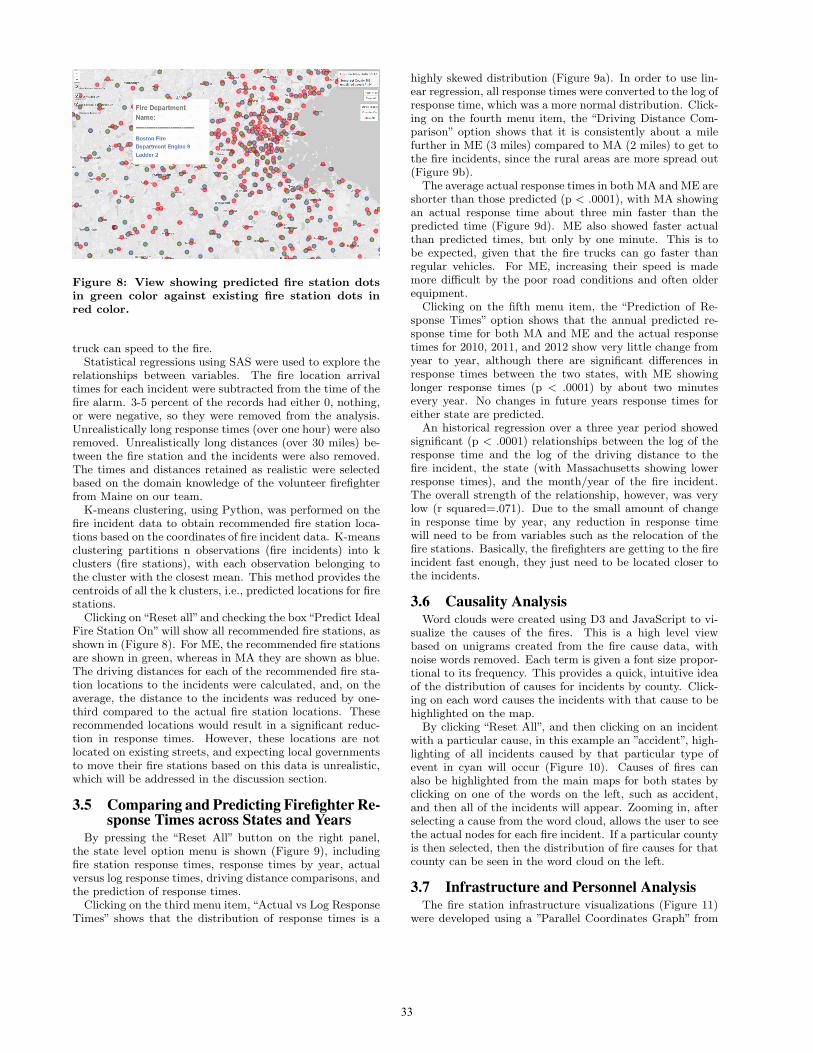
Figure 8: View showing predicted fire station dotsin green color against existing fire station dots inred color.
truck can speed to the fire.Statistical regressions using SAS were used to explore the
relationships between variables. The fire location arrivaltimes for each incident were subtracted from the time of thefire alarm. 3-5 percent of the records had either 0, nothing,or were negative, so they were removed from the analysis.Unrealistically long response times (over one hour) were alsoremoved. Unrealistically long distances (over 30 miles) be-tween the fire station and the incidents were also removed.The times and distances retained as realistic were selectedbased on the domain knowledge of the volunteer firefighterfrom Maine on our team.K-means clustering, using Python, was performed on the
fire incident data to obtain recommended fire station loca-tions based on the coordinates of fire incident data. K-meansclustering partitions n observations (fire incidents) into kclusters (fire stations), with each observation belonging tothe cluster with the closest mean. This method provides thecentroids of all the k clusters, i.e., predicted locations for firestations.Clicking on“Reset all”and checking the box“Predict Ideal
Fire Station On”will show all recommended fire stations, asshown in (Figure 8). For ME, the recommended fire stationsare shown in green, whereas in MA they are shown as blue.The driving distances for each of the recommended fire sta-tion locations to the incidents were calculated, and, on theaverage, the distance to the incidents was reduced by one-third compared to the actual fire station locations. Theserecommended locations would result in a significant reduc-tion in response times. However, these locations are notlocated on existing streets, and expecting local governmentsto move their fire stations based on this data is unrealistic,which will be addressed in the discussion section.
3.5 Comparing and Predicting Firefighter Re-sponse Times across States and Years
By pressing the “Reset All” button on the right panel,the state level option menu is shown (Figure 9), includingfire station response times, response times by year, actualversus log response times, driving distance comparisons, andthe prediction of response times.Clicking on the third menu item, “Actual vs Log Response
Times” shows that the distribution of response times is a
highly skewed distribution (Figure 9a). In order to use lin-ear regression, all response times were converted to the log ofresponse time, which was a more normal distribution. Click-ing on the fourth menu item, the “Driving Distance Com-parison” option shows that it is consistently about a milefurther in ME (3 miles) compared to MA (2 miles) to get tothe fire incidents, since the rural areas are more spread out(Figure 9b).The average actual response times in both MA and ME are
shorter than those predicted (p < .0001), with MA showingan actual response time about three min faster than thepredicted time (Figure 9d). ME also showed faster actualthan predicted times, but only by one minute. This is tobe expected, given that the fire trucks can go faster thanregular vehicles. For ME, increasing their speed is mademore difficult by the poor road conditions and often olderequipment.Clicking on the fifth menu item, the “Prediction of Re-
sponse Times” option shows that the annual predicted re-sponse time for both MA and ME and the actual responsetimes for 2010, 2011, and 2012 show very little change fromyear to year, although there are significant differences inresponse times between the two states, with ME showinglonger response times (p < .0001) by about two minutesevery year. No changes in future years response times foreither state are predicted.An historical regression over a three year period showed
significant (p < .0001) relationships between the log of theresponse time and the log of the driving distance to thefire incident, the state (with Massachusetts showing lowerresponse times), and the month/year of the fire incident.The overall strength of the relationship, however, was verylow (r squared=.071). Due to the small amount of changein response time by year, any reduction in response timewill need to be from variables such as the relocation of thefire stations. Basically, the firefighters are getting to the fireincident fast enough, they just need to be located closer tothe incidents.
3.6 Causality AnalysisWord clouds were created using D3 and JavaScript to vi-
sualize the causes of the fires. This is a high level viewbased on unigrams created from the fire cause data, withnoise words removed. Each term is given a font size propor-tional to its frequency. This provides a quick, intuitive ideaof the distribution of causes for incidents by county. Click-ing on each word causes the incidents with that cause to behighlighted on the map.By clicking “Reset All”, and then clicking on an incident
with a particular cause, in this example an ”accident”, high-lighting of all incidents caused by that particular type ofevent in cyan will occur (Figure 10). Causes of fires canalso be highlighted from the main maps for both states byclicking on one of the words on the left, such as accident,and then all of the incidents will appear. Zooming in, afterselecting a cause from the word cloud, allows the user to seethe actual nodes for each fire incident. If a particular countyis then selected, then the distribution of fire causes for thatcounty can be seen in the word cloud on the left.
3.7 Infrastructure and Personnel AnalysisThe fire station infrastructure visualizations (Figure 11)
were developed using a ”Parallel Coordinates Graph” from
33
Figure 9: State level menu : (a) Linear and log distributions of response times. (b) Actual driving distanceto fire incidents by year and state. (c) Actual Response Time to Fire Incidents Boxplot (d) Actual andpredicted response times.(e) Driving distance to fire incidents (f) Predicted Response Time to Fire Incident
the D3 Library. Clicking the “Infrastructure” button at topof screen reveals data obtained from US Census Data pro-vided though the Federal Emergency Management Agency(FEMA). For ME, career firefighters are the smallest group,followed by volunteer and paid on call firefighters. For MA,the biggest group is the career firefighters. Also we madethe parallel coordinates graph interactive by enabling blackboxes as brushes on top of each vertical axis. The user candrag them vertically and also can enlarge their sizes. Theirrole is to help the user to subset range of values to be dis-played in bold colors, while other feature values would beghosted on the back. This helps the user to selectively com-prehend the flow and direction of the data.
4. DISCUSSIONRegarding the prediction of the recommended location of
fire stations using K-means clustering, while the re-location
of the fire stations based on this plan would reduce the dis-tance to the fire stations to the fire incidents, such a plan isunrealistic. One improvement would be to treat the prob-lem as a facility location analysis, with a set of potentialrealistic locations, but still using a clustering methodology.Another approach would be to provide interactive openingand closure of selected fire stations to observe the impacton the response times of the remaining fire stations. Sinceregression showed that the response times are not expectedto increase in the future and the firefighters are either closeto meeting or exceeding the required response times, thisapproach would make even more sense.We observed that rural firefighters, on average, travel about
one mile further to get to the fire incidents than those in anurban area, and their response times are about two minutesslower than in urban areas. Possible explanations for thesefindings include: (1) rural firefighters may need to travel
34
Figure 10: View showing all those fire incident dotsin cyan related to a specific fire cause word (”acci-dent”) when clicked in the left panel.
Figure 11: Infrastructure distribution for a countyin Massachusetts in 2012.
on gravel and dirt roads, which slows them down; (2) fire-fighting equipment in rural areas is older, slower, and lessspecialized; (3) rural firefighters are more likely to be volun-teers than career firefighters, so they may need to first travelto the fire station (e.g., from home) before going to the in-cident location; (4) rural fire incidents are more spread outgeographically.ISPARK and our approaches may easily work with data
from any fire departments in the U.S. or other countries.However, the expertise to maintain the application will needto be available to the fire department. ISPARK may alsowork with data from other related domains, such as police,hospitals, and schools, so they could use similar technology.It is noteworthy to mention that the word cloud we pre-
sented as one of the core features of visual analytics, shows awide array of fire causes per county. Like wise to fit them ina restricted space, many of the words are overlapping. Butto make it easier to be able to select each and any of thosewords by the user, we implement opacity changing mecha-nism, when the user’s pointer hovers over them. This waythe user in real time gets to know which word tag he is goingto pick to see further analytics.Our future work includes revising the methodology for
determining recommended fire station locations, adding op-tions for interactively closing and opening existing fire sta-tions to observe the consequences on response times, ex-tending ISPARK to the rest of the United States, and ex-ploring more factors, including the spatiotemporal variablesthat would influence the fire station workload, such as time
of day, day of the week, and month of the year. Addi-tional studies should add traffic conditions to the predictedresponse time for increased accuracy. Also, wildland fireslikely have unique characteristics which should be explored.
5. CONCLUSIONSOur project has led us to the following four conclusions.
First, an interactive, integrated analytical and geographicdashboard can be developed using entirely open source tools.Second, geographic mapping of the recommended fire sta-tions, existing fire stations, and the fire incidents served bythe fire stations can be done, but the recommended locationmethodology needs to be further refined. Third, the inci-dent response times over the period 2010 through 2013 havebeen stable, and firefighters are either close to meeting orexceeding the standard response times now. Last, rural andurban areas do show differences in fire response times.
6. REFERENCES
[1] Malik A, Maciejewski R, Maule B, and Ebert D.S.2011. A visual analytics process for maritime resourceallocation and risk assessment. In Visual AnalyticsScience and Technology (VAST), 2011 IEEEConference on (23-28). VAST, 221–230.
[2] Vladimir Agafonkin. 2011. Leaflet: An open-sourceJavaScript library for mobile-friendly interactivemaps. (May 2011). http://leafletjs.com/
[3] National Fire Protection Association. 2015. NationalFire Protection Association Website.http://www.nfpa.org/. (March 2015).
[4] Michael Bostock. 2011. A JavaScript visualizationlibrary for HTML and SVG. (February 2011).http://d3js.org
[5] US Census Bureau. 2015. Quick Facts. U.S. CensusBureau, U.S. Department of Commerce. http://www.census.gov/quickfacts/table/PST045214/00.(February 2015).
[6] Fire Department City of Boston Official Website.2015. City of Boston, Official Website.http://www.cityofboston.gov/fire/. (February2015).
[7] ESRI. 2011. Baltimore City (MD) Fire DepartmentUses GIS Technology to Optimize Resources.(September 2011).
[8] ESRI. 2015. GIS for Fire Station Locations andResponse Protocol(2011). http://www.esri.com/library/whitepapers/pdfs/gis-for-fire.pdf.(March 2015).
[9] William Finley. 2007. Fire Station Location MasterPlan. (January 2007).http://www.usfa.fema.gov/pdf/efop/efo40119.pdf
[10] David K. Hard. 2006. Analysis of Factors andRecognized Standards Utilized to Determine FireStation Locations. Klamath County Fire District No1, Klamath Falls, Oregon (June 2006).
[11] Pedro A Hernandez-Leal, Alejandro Gonzalez-Calvo,Manuel Arbelo, Africa Barreto, and AlfonsoAlonso-Benito. 2008. Synergy of GIS and RemoteSensing Data in Forest Fire Danger Modeling.(December 2008).
35
[12] Open Data Institute. 2015. London Fire Stations.http://london-fire.labs.theodi.org. (March2015).
[13] Ioannis Karafyllidis and Adonios Thanailakis. 1997. Amodel for predicting forest fire spreading using cellularautomata, Vol. 99. Ecological Modelling, 87–97. Issue1.
[14] Michael J. Karter Jr. 2014. Fire Loss in the UnitedStates during 2013. http://www.nfpa.org/newsandpublications/nfpa-journal/2014/
[15] Nan Liu, Bo Huang, and Magesh Chandramouli. 2006.Optimal Siting of Fire Stations Using GIS and ANTAlgorithm, Vol. 20. Journal of Computing in CivilEngineering, 361–369. Issue 5.
[16] Sergey Mescherin, Igor Kirillov, and StanislavKlimenko. 2014. Optimizing and Visualizing FireDispatcher Activity. (October 2014).
[17] Federal Emergency Management Agency USFire Administration National Fire IncidentReporting System, Department of Homeland Security.2015. NFIRS 5.0 Reference Guide (2013). https://www.nfirs.fema.gov/documentation/reference/.(March 2015).
[18] Recep Nisanci, Volkan Yildirim, and Yasar SelcukErbas. 2007. Fire Analysis and Production of Fire RiskMaps: The Trabzon Experience, Risk Management for
the Future - Theory and Cases. Chapter 10.
[19] Maciejewski R, Rudolph S, Hafen R, Abusalah A,Yakout M, Ouzzani M, Cleveland W S, Grannis S J,and Ebert D S. 2010. A Visual Analytics Approach toUnderstanding Spatiotemporal Hotspots. InVisualization and Computer Graphics, IEEETransactions on (23-28). VAST, 205–220.
[20] Imas Sitanggang, Yaakob Sukaesih, Mustapha Razali,A N Norwati, and Ainuddin. 2012. Application ofClassification Algorithms in Data Mining for HotspotsOccurrence Prediction in Riau Province Indonesia,Vol. 43. Journal of Theoretical and AppliedInformation Technology, 361–369.
[21] Fire Marshall State of Maine Official Website. 2015.State of Maine Official Website.http://maine.gov/dps/fmo/index.html. (February2015).
[22] Division of System Planning Corporation TriData.2006. Oklahoma City Fire Department Fire StationLocation Study.
[23] Fernanda B Viegas, Martin Wattenberg, and JonathanFeinberg. 2009. Participatory Visualization withWordle. In IEEE Transactions on Visualization andComputer Graphics (23-28), Vol. 15. 1137–1144.
[24] A Sen, T Onden, C Gokgoza, and C Sen. 2011. A GISApproach to Fire Station Location Selection. Inter alSoceity for Photogrammetry and Remote Sensing.


![Creedo—Scalable and Repeatable Extrinsic Evaluation for ...poloclub.gatech.edu/idea2015/papers/p20-boley.pdf · survey framework like Survey Monkey [sur] or KwikSurveys [kwi]. However,](https://static.documents.pub/doc/80x56/5cd581c188c99300748c02e0/creedoscalable-and-repeatable-extrinsic-evaluation-for-survey-framework.jpg)


![Homework 2 D3 Graphs and Visualization Due: October …poloclub.gatech.edu/cse6242/2015fall/hw2/CSE6242-HW2.pdf · Homework 2 D3 Graphs and Visualization Due: ... [1 pts] Use this](https://static.documents.pub/doc/80x56/5b79c4127f8b9ae1328b72e2/homework-2-d3-graphs-and-visualization-due-october-homework-2-d3-graphs-and.jpg)


