Page 1
ROCKINGHAM
COUNTY REPORT
The North Carolina Alliance for Athletics, Health, Physical Education, Recreation,and Dance (NCAAHPERD), launched In-school Prevention of Obesity
andDisease (IsPOD) in 2007. The initiative began with a grant from the NC Healthand Wellness Trust Fund and was expanded with grants from the Blue
CrossBlue Shield of North Carolina Foundation. The expansion to a state-wide programis supported by a $3.6 million grant from the Kate B. Reynolds Charitable
Trust.NCAAHPERD is engaged with a large network of health and physical educationgroups seeking greater opportunities for a healthier and more creative
NorthCarolina.
IsPOD Data
Report
Fall 2010
Page 2
2011 NC IsPOD Evaluation
Conducted by NCAAHPERD/NC DPH All rights reserved.
Rockingham County
SPARK Training
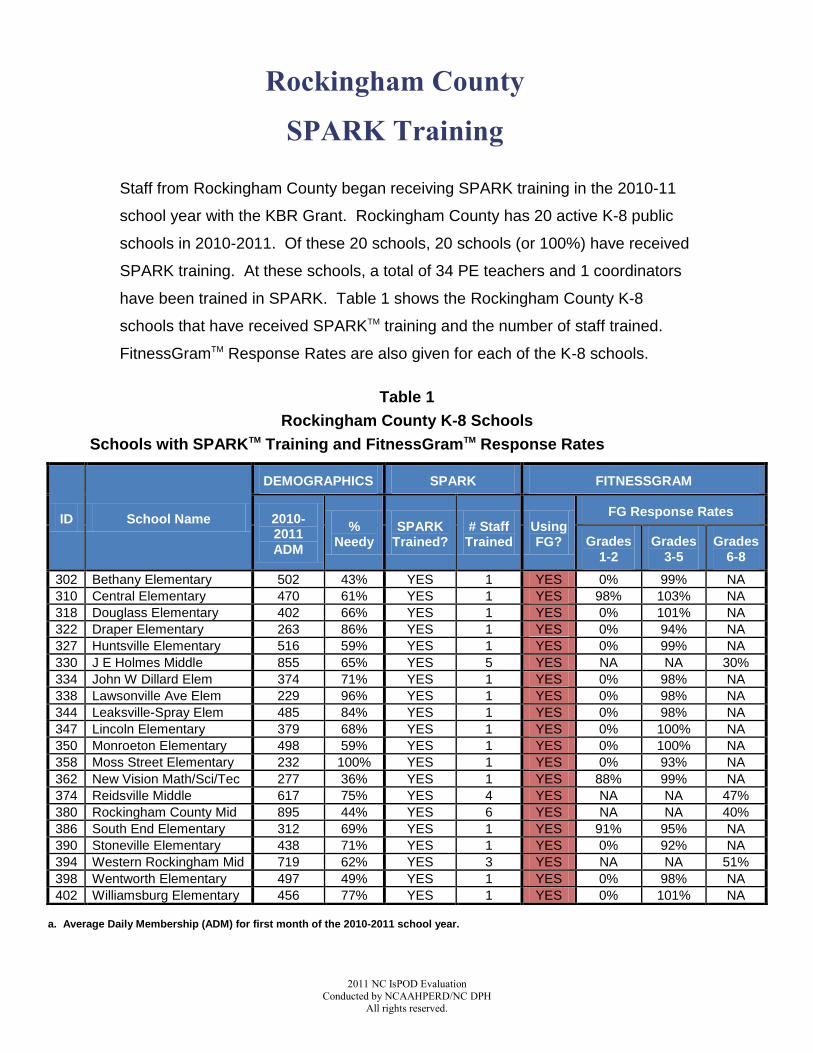
Staff from Rockingham County began receiving SPARK training in the 2010-11
school year with the KBR Grant. Rockingham County has 20 active K-8 public
schools in 2010-2011. Of these 20 schools, 20 schools (or 100%) have received
SPARK training. At these schools, a total of 34 PE teachers and 1 coordinators
have been trained in SPARK. Table 1 shows the Rockingham County K-8
schools that have received SPARKTM training and the number of staff trained.
FitnessGramTM Response Rates are also given for each of the K-8 schools.
Table 1
Rockingham County K-8 Schools
Schools with SPARKTM Training and FitnessGramTM Response Rates
a. Average Daily Membership (ADM) for first month of the 2010-2011 school year.
ID School Name
DEMOGRAPHICS SPARK FITNESSGRAM
2010-2011 ADM
% Needy
SPARK Trained?
# Staff Trained
Using FG?
FG Response Rates
Grades 1-2
Grades 3-5
Grades 6-8
302 Bethany Elementary 502 43% YES 1 YES 0% 99% NA
310 Central Elementary 470 61% YES 1 YES 98% 103% NA
318 Douglass Elementary 402 66% YES 1 YES 0% 101% NA
322 Draper Elementary 263 86% YES 1 YES 0% 94% NA
327 Huntsville Elementary 516 59% YES 1 YES 0% 99% NA
330 J E Holmes Middle 855 65% YES 5 YES NA NA 30%
334 John W Dillard Elem 374 71% YES 1 YES 0% 98% NA
338 Lawsonville Ave Elem 229 96% YES 1 YES 0% 98% NA
344 Leaksville-Spray Elem 485 84% YES 1 YES 0% 98% NA
347 Lincoln Elementary 379 68% YES 1 YES 0% 100% NA
350 Monroeton Elementary 498 59% YES 1 YES 0% 100% NA
358 Moss Street Elementary 232 100% YES 1 YES 0% 93% NA
362 New Vision Math/Sci/Tec 277 36% YES 1 YES 88% 99% NA
374 Reidsville Middle 617 75% YES 4 YES NA NA 47%
380 Rockingham County Mid 895 44% YES 6 YES NA NA 40%
386 South End Elementary 312 69% YES 1 YES 91% 95% NA
390 Stoneville Elementary 438 71% YES 1 YES 0% 92% NA
394 Western Rockingham Mid 719 62% YES 3 YES NA NA 51%
398 Wentworth Elementary 497 49% YES 1 YES 0% 98% NA
402 Williamsburg Elementary 456 77% YES 1 YES 0% 101% NA
Page 3
2011 NC IsPOD Evaluation Conducted by NCAAHPERD/NC DPH
All rights reserved.
2
Rockingham County
FitnessGramTM Response Rates
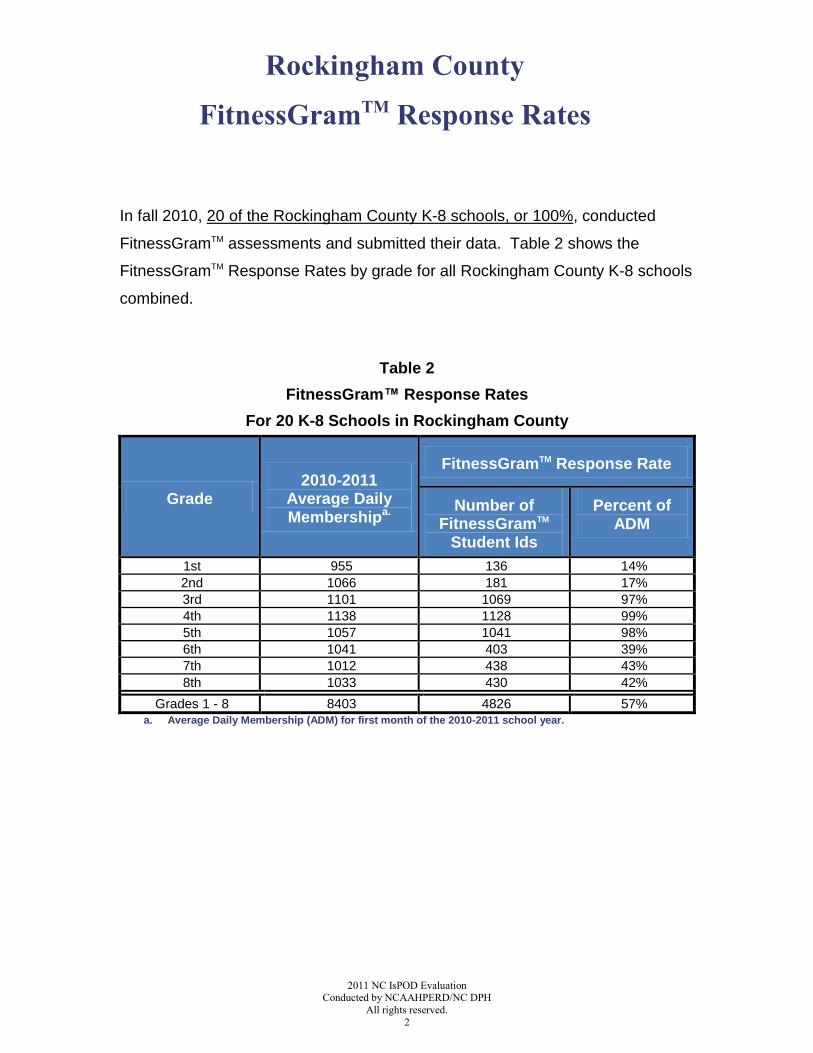
In fall 2010, 20 of the Rockingham County K-8 schools, or 100%, conducted
FitnessGramTM assessments and submitted their data. Table 2 shows the
FitnessGramTM Response Rates by grade for all Rockingham County K-8 schools
combined.
Table 2
FitnessGram™ Response Rates
For 20 K-8 Schools in Rockingham County
Grade 2010-2011
Average Daily Membershipa.
FitnessGramTM Response Rate
Number of FitnessGramTM
Student Ids
Percent of ADM
1st 955 136 14%
2nd 1066 181 17%
3rd 1101 1069 97%
4th 1138 1128 99%
5th 1057 1041 98%
6th 1041 403 39%
7th 1012 438 43%
8th 1033 430 42%
Grades 1 - 8 8403 4826 57% a. Average Daily Membership (ADM) for first month of the 2010-2011 school year.
Page 4
2011 NC IsPOD Evaluation Conducted by NCAAHPERD/NC DPH
All rights reserved.
3
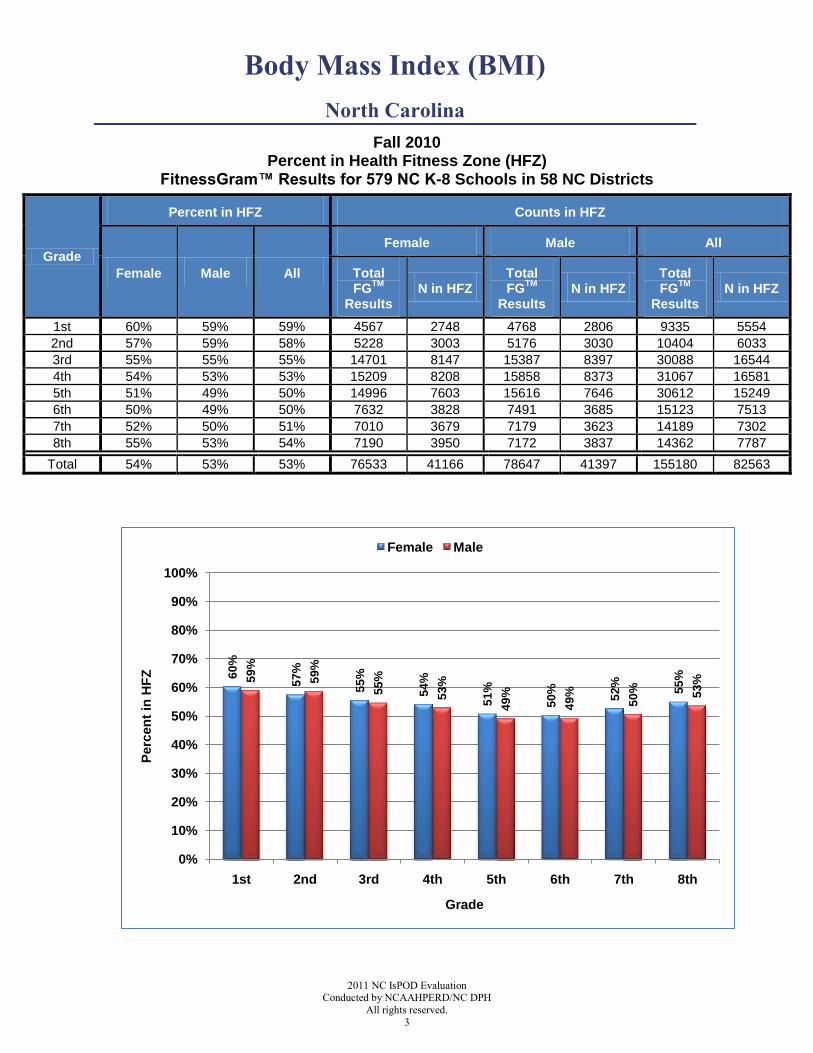
Body Mass Index (BMI)
North Carolina
Fall 2010 Percent in Health Fitness Zone (HFZ)
FitnessGram™ Results for 579 NC K-8 Schools in 58 NC Districts
Grade
Percent in HFZ Counts in HFZ
Female Male All
Female Male All
Total FG
TM
Results N in HFZ
Total FG
TM
Results N in HFZ
Total FG
TM
Results N in HFZ
1st 60% 59% 59% 4567 2748 4768 2806 9335 5554
2nd 57% 59% 58% 5228 3003 5176 3030 10404 6033
3rd 55% 55% 55% 14701 8147 15387 8397 30088 16544
4th 54% 53% 53% 15209 8208 15858 8373 31067 16581
5th 51% 49% 50% 14996 7603 15616 7646 30612 15249
6th 50% 49% 50% 7632 3828 7491 3685 15123 7513
7th 52% 50% 51% 7010 3679 7179 3623 14189 7302
8th 55% 53% 54% 7190 3950 7172 3837 14362 7787
Total 54% 53% 53% 76533 41166 78647 41397 155180 82563
60
%
57
%
55
%
54
%
51
%
50
%
52
%
55
%59
%
59
%
55
%
53
%
49
%
49
%
50
% 53
%
0%
10%
20%
30%
40%
50%
60%
70%
80%
90%
100%
1st 2nd 3rd 4th 5th 6th 7th 8th
Perc
en
t in
HF
Z
Grade
Female Male
Page 5
2011 NC IsPOD Evaluation Conducted by NCAAHPERD/NC DPH
All rights reserved.
4
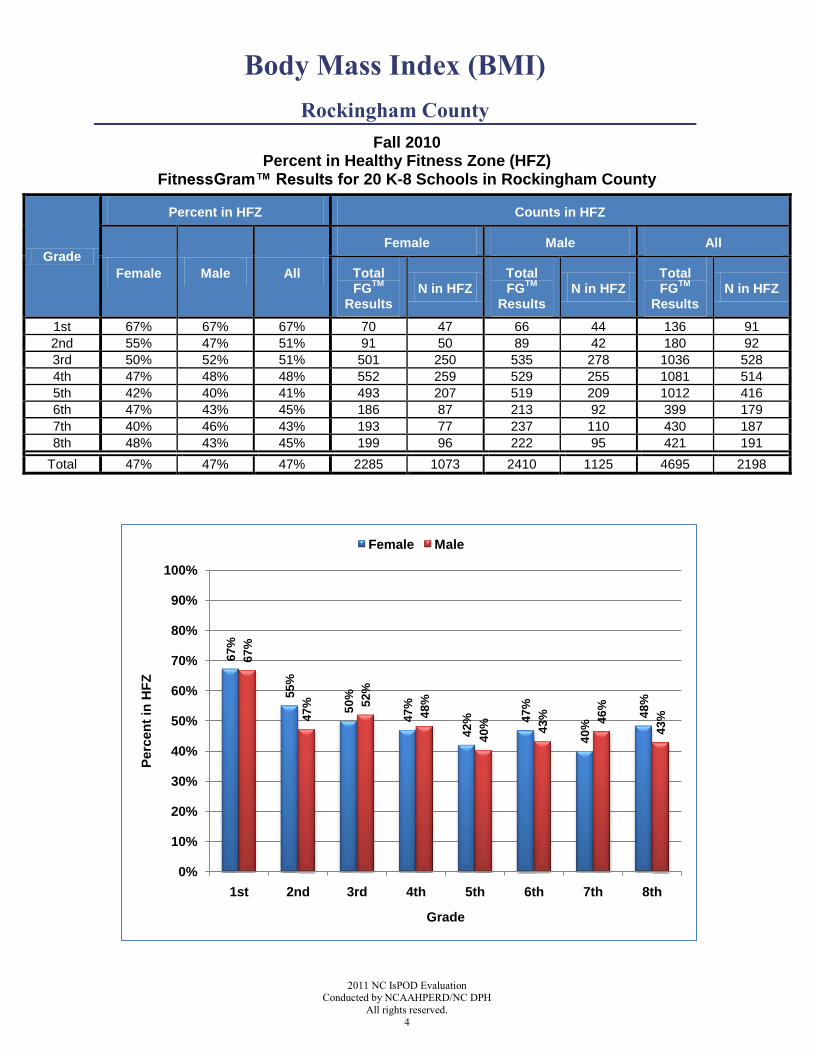
Body Mass Index (BMI)
Rockingham County
Fall 2010 Percent in Healthy Fitness Zone (HFZ)
FitnessGram™ Results for 20 K-8 Schools in Rockingham County
Grade
Percent in HFZ Counts in HFZ
Female Male All
Female Male All
Total FG
TM
Results N in HFZ
Total FG
TM
Results N in HFZ
Total FG
TM
Results N in HFZ
1st 67% 67% 67% 70 47 66 44 136 91
2nd 55% 47% 51% 91 50 89 42 180 92
3rd 50% 52% 51% 501 250 535 278 1036 528
4th 47% 48% 48% 552 259 529 255 1081 514
5th 42% 40% 41% 493 207 519 209 1012 416
6th 47% 43% 45% 186 87 213 92 399 179
7th 40% 46% 43% 193 77 237 110 430 187
8th 48% 43% 45% 199 96 222 95 421 191
Total 47% 47% 47% 2285 1073 2410 1125 4695 2198
67
%
55
%
50
%
47
%
42
% 47
%
40
%
48
%
67
%
47
% 52
%
48
%
40
% 43
% 46
%
43
%
0%
10%
20%
30%
40%
50%
60%
70%
80%
90%
100%
1st 2nd 3rd 4th 5th 6th 7th 8th
Perc
en
t in
HF
Z
Grade
Female Male
Page 6
2011 NC IsPOD Evaluation Conducted by NCAAHPERD/NC DPH
All rights reserved.
5
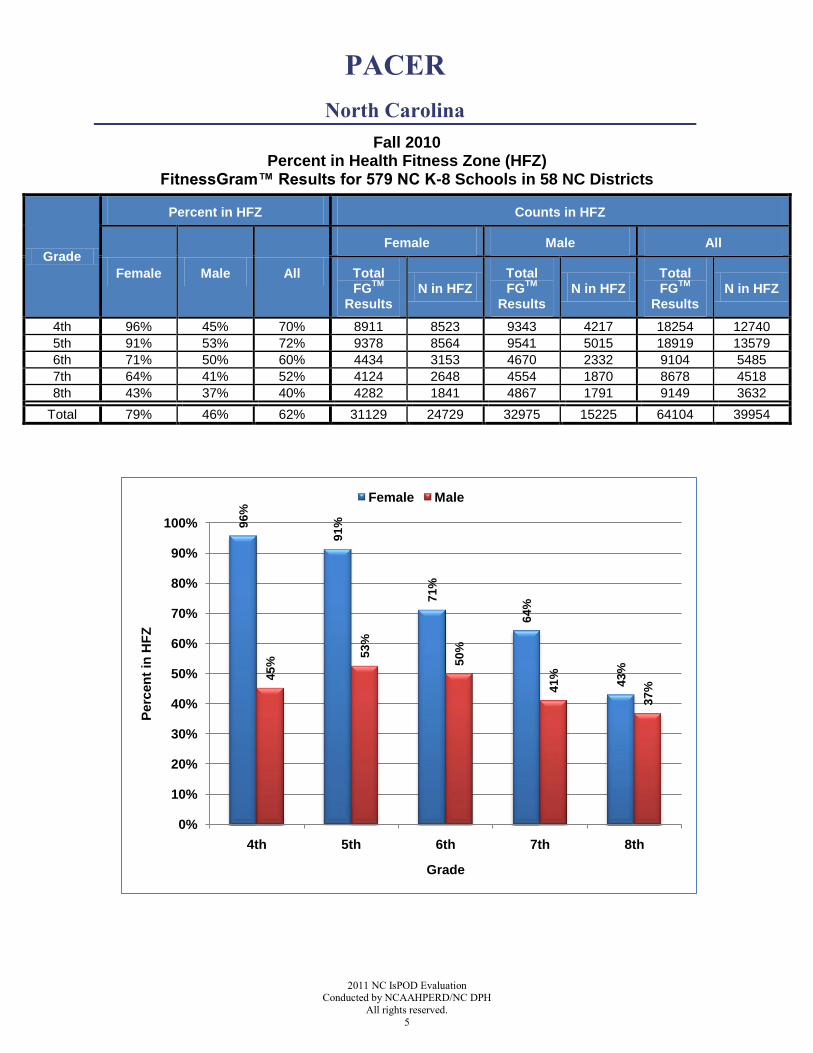
PACER
North Carolina
Fall 2010 Percent in Health Fitness Zone (HFZ)
FitnessGram™ Results for 579 NC K-8 Schools in 58 NC Districts
Grade
Percent in HFZ Counts in HFZ
Female Male All
Female Male All
Total FG
TM
Results N in HFZ
Total FG
TM
Results N in HFZ
Total FG
TM
Results N in HFZ
4th 96% 45% 70% 8911 8523 9343 4217 18254 12740
5th 91% 53% 72% 9378 8564 9541 5015 18919 13579
6th 71% 50% 60% 4434 3153 4670 2332 9104 5485
7th 64% 41% 52% 4124 2648 4554 1870 8678 4518
8th 43% 37% 40% 4282 1841 4867 1791 9149 3632
Total 79% 46% 62% 31129 24729 32975 15225 64104 39954
96
%
91
%
71
%
64
%
43
%
45
%
53
%
50
%
41
%
37
%
0%
10%
20%
30%
40%
50%
60%
70%
80%
90%
100%
4th 5th 6th 7th 8th
Perc
en
t in
HF
Z
Grade
Female Male
Page 7
2011 NC IsPOD Evaluation Conducted by NCAAHPERD/NC DPH
All rights reserved.
6
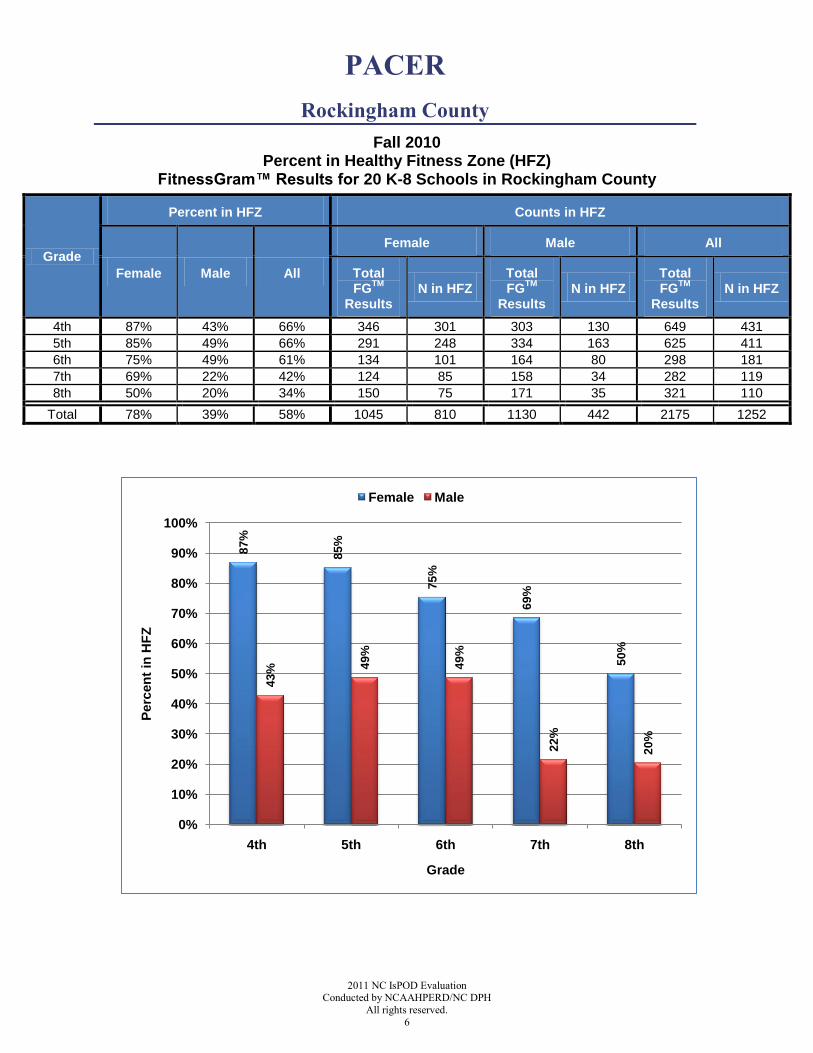
PACER
Rockingham County
Fall 2010 Percent in Healthy Fitness Zone (HFZ)
FitnessGram™ Results for 20 K-8 Schools in Rockingham County
Grade
Percent in HFZ Counts in HFZ
Female Male All
Female Male All
Total FG
TM
Results N in HFZ
Total FG
TM
Results N in HFZ
Total FG
TM
Results N in HFZ
4th 87% 43% 66% 346 301 303 130 649 431
5th 85% 49% 66% 291 248 334 163 625 411
6th 75% 49% 61% 134 101 164 80 298 181
7th 69% 22% 42% 124 85 158 34 282 119
8th 50% 20% 34% 150 75 171 35 321 110
Total 78% 39% 58% 1045 810 1130 442 2175 1252
87
%
85
%
75
%
69
%
50
%
43
% 49
%
49
%
22
%
20
%
0%
10%
20%
30%
40%
50%
60%
70%
80%
90%
100%
4th 5th 6th 7th 8th
Perc
en
t in
HF
Z
Grade
Female Male
Page 8
2011 NC IsPOD Evaluation Conducted by NCAAHPERD/NC DPH
All rights reserved.
7
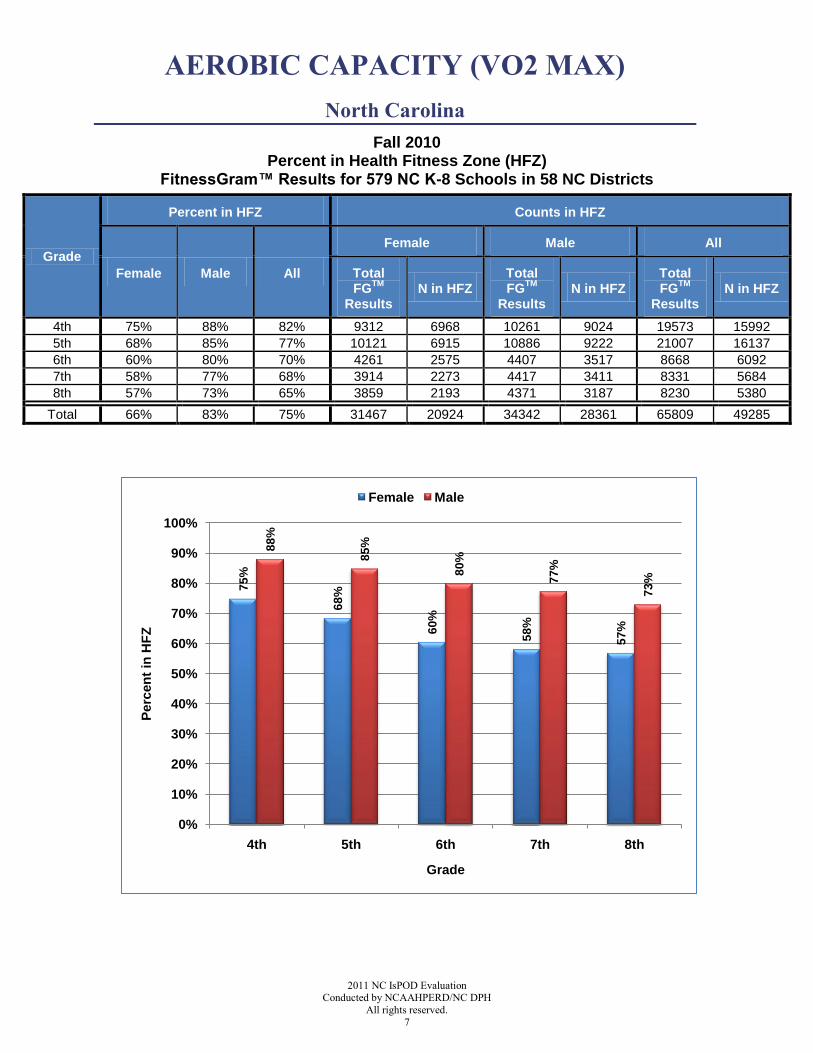
AEROBIC CAPACITY (VO2 MAX)
North Carolina
Fall 2010 Percent in Health Fitness Zone (HFZ)
FitnessGram™ Results for 579 NC K-8 Schools in 58 NC Districts
Grade
Percent in HFZ Counts in HFZ
Female Male All
Female Male All
Total FG
TM
Results N in HFZ
Total FG
TM
Results N in HFZ
Total FG
TM
Results N in HFZ
4th 75% 88% 82% 9312 6968 10261 9024 19573 15992
5th 68% 85% 77% 10121 6915 10886 9222 21007 16137
6th 60% 80% 70% 4261 2575 4407 3517 8668 6092
7th 58% 77% 68% 3914 2273 4417 3411 8331 5684
8th 57% 73% 65% 3859 2193 4371 3187 8230 5380
Total 66% 83% 75% 31467 20924 34342 28361 65809 49285
75
%
68
%
60
%
58
%
57
%
88
%
85
%
80
%
77
%
73
%
0%
10%
20%
30%
40%
50%
60%
70%
80%
90%
100%
4th 5th 6th 7th 8th
Perc
en
t in
HF
Z
Grade
Female Male
Page 9
2011 NC IsPOD Evaluation Conducted by NCAAHPERD/NC DPH
All rights reserved.
8
AEROBIC CAPACITY (VO2 MAX)
Rockingham County
Fall 2010 Percent in Healthy Fitness Zone (HFZ)
FitnessGram™ Results for 20 K-8 Schools in Rockingham County
Grade
Percent in HFZ Counts in HFZ
Female Male All
Female Male All
Total FG
TM
Results N in HFZ
Total FG
TM
Results N in HFZ
Total FG
TM
Results N in HFZ
4th 75% 85% 80% 359 270 353 301 712 571
5th 62% 81% 72% 332 207 360 292 692 499
6th 56% 72% 64% 126 70 141 102 267 172
7th 44% 67% 57% 110 48 148 99 258 147
8th 45% 65% 55% 136 61 155 100 291 161
Total 62% 77% 70% 1063 656 1157 894 2220 1550
75
%
62
%
56
%
44
%
45
%
85
%
81
%
72
%
67
%
65
%
0%
10%
20%
30%
40%
50%
60%
70%
80%
90%
100%
4th 5th 6th 7th 8th
Perc
en
t in
HF
Z
Grade
Female Male
Page 10
2011 NC IsPOD Evaluation Conducted by NCAAHPERD/NC DPH
All rights reserved.
9
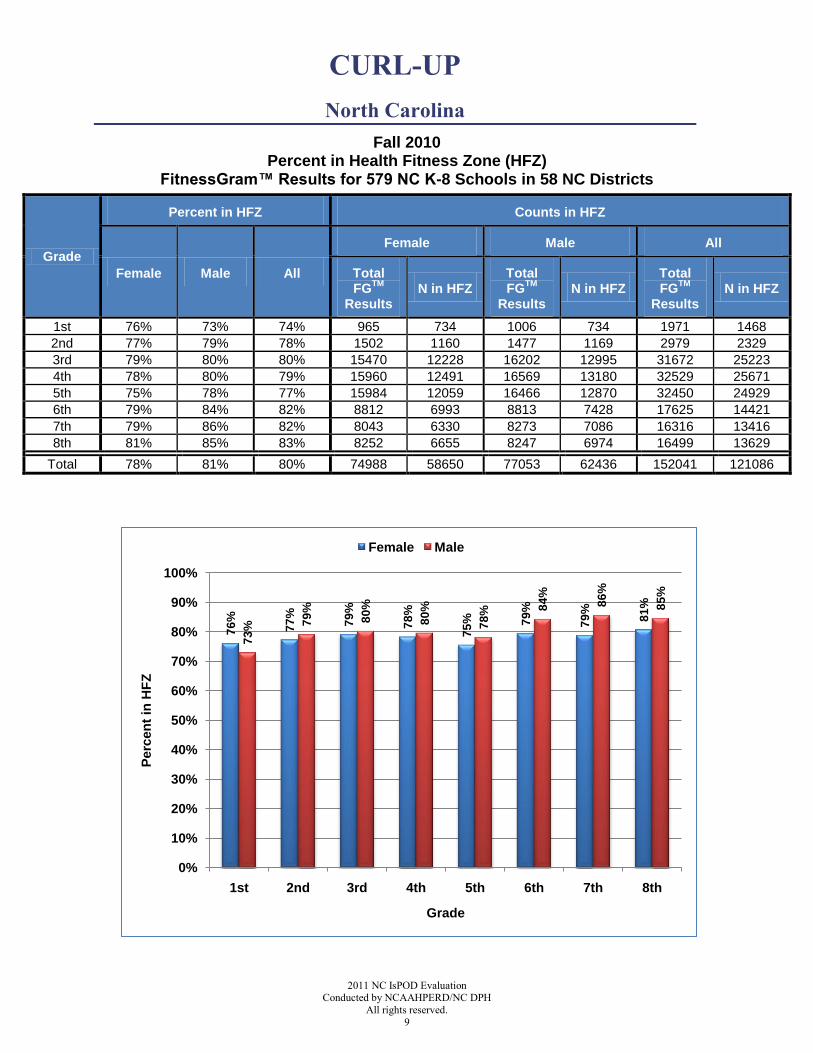
CURL-UP
North Carolina
Fall 2010 Percent in Health Fitness Zone (HFZ)
FitnessGram™ Results for 579 NC K-8 Schools in 58 NC Districts
Grade
Percent in HFZ Counts in HFZ
Female Male All
Female Male All
Total FG
TM
Results N in HFZ
Total FG
TM
Results N in HFZ
Total FG
TM
Results N in HFZ
1st 76% 73% 74% 965 734 1006 734 1971 1468
2nd 77% 79% 78% 1502 1160 1477 1169 2979 2329
3rd 79% 80% 80% 15470 12228 16202 12995 31672 25223
4th 78% 80% 79% 15960 12491 16569 13180 32529 25671
5th 75% 78% 77% 15984 12059 16466 12870 32450 24929
6th 79% 84% 82% 8812 6993 8813 7428 17625 14421
7th 79% 86% 82% 8043 6330 8273 7086 16316 13416
8th 81% 85% 83% 8252 6655 8247 6974 16499 13629
Total 78% 81% 80% 74988 58650 77053 62436 152041 121086
76
%
77
%
79
%
78
%
75
% 79
%
79
%
81
%
73
% 79
%
80
%
80
%
78
% 84
%
86
%
85
%
0%
10%
20%
30%
40%
50%
60%
70%
80%
90%
100%
1st 2nd 3rd 4th 5th 6th 7th 8th
Perc
en
t in
HF
Z
Grade
Female Male
Page 11
2011 NC IsPOD Evaluation Conducted by NCAAHPERD/NC DPH
All rights reserved.
10
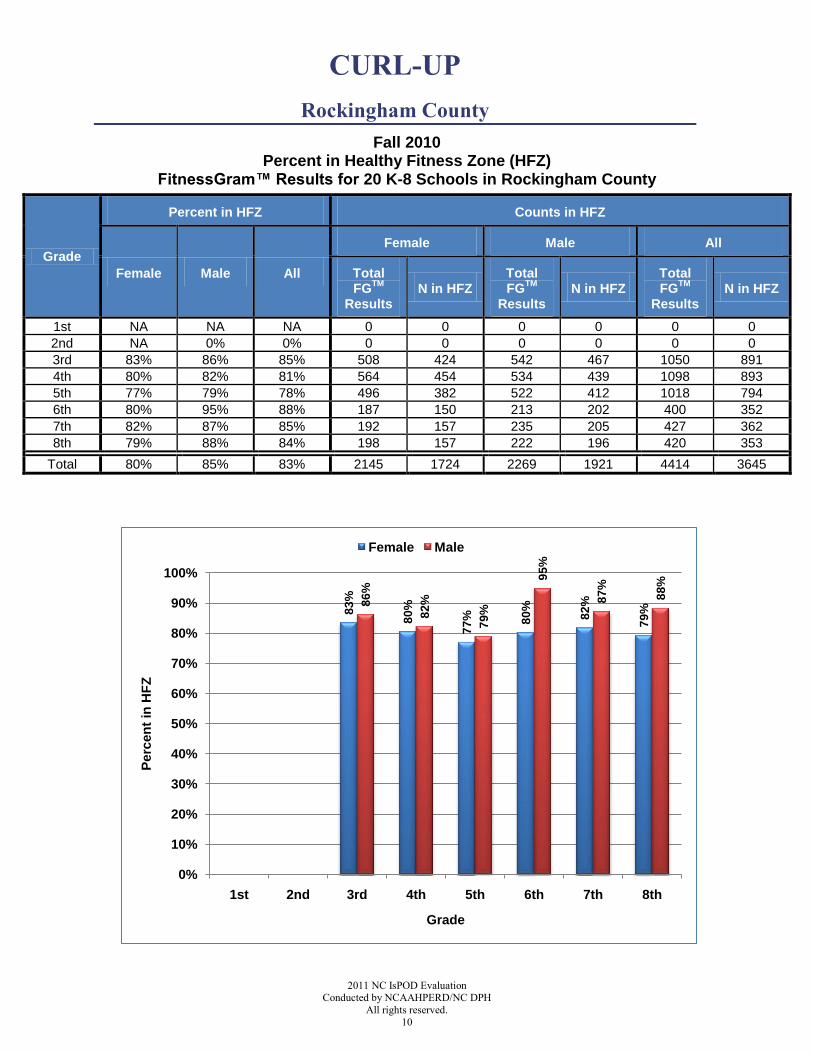
CURL-UP
Rockingham County
Fall 2010 Percent in Healthy Fitness Zone (HFZ)
FitnessGram™ Results for 20 K-8 Schools in Rockingham County
Grade
Percent in HFZ Counts in HFZ
Female Male All
Female Male All
Total FG
TM
Results N in HFZ
Total FG
TM
Results N in HFZ
Total FG
TM
Results N in HFZ
1st NA NA NA 0 0 0 0 0 0
2nd NA 0% 0% 0 0 0 0 0 0
3rd 83% 86% 85% 508 424 542 467 1050 891
4th 80% 82% 81% 564 454 534 439 1098 893
5th 77% 79% 78% 496 382 522 412 1018 794
6th 80% 95% 88% 187 150 213 202 400 352
7th 82% 87% 85% 192 157 235 205 427 362
8th 79% 88% 84% 198 157 222 196 420 353
Total 80% 85% 83% 2145 1724 2269 1921 4414 3645
83
%
80
%
77
% 80
%
82
%
79
%
86
%
82
%
79
%
95
%
87
%
88
%
0%
10%
20%
30%
40%
50%
60%
70%
80%
90%
100%
1st 2nd 3rd 4th 5th 6th 7th 8th
Perc
en
t in
HF
Z
Grade
Female Male
Page 12
2011 NC IsPOD Evaluation Conducted by NCAAHPERD/NC DPH
All rights reserved.
11
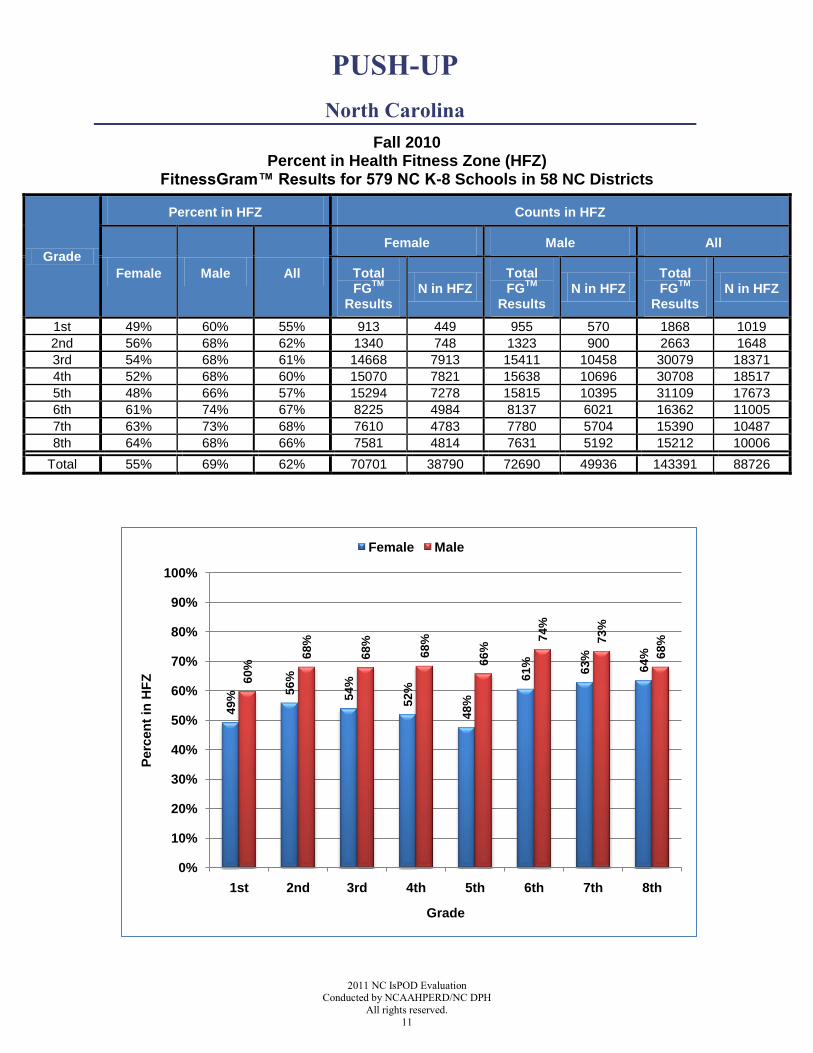
PUSH-UP
North Carolina
Fall 2010 Percent in Health Fitness Zone (HFZ)
FitnessGram™ Results for 579 NC K-8 Schools in 58 NC Districts
Grade
Percent in HFZ Counts in HFZ
Female Male All
Female Male All
Total FG
TM
Results N in HFZ
Total FG
TM
Results N in HFZ
Total FG
TM
Results N in HFZ
1st 49% 60% 55% 913 449 955 570 1868 1019
2nd 56% 68% 62% 1340 748 1323 900 2663 1648
3rd 54% 68% 61% 14668 7913 15411 10458 30079 18371
4th 52% 68% 60% 15070 7821 15638 10696 30708 18517
5th 48% 66% 57% 15294 7278 15815 10395 31109 17673
6th 61% 74% 67% 8225 4984 8137 6021 16362 11005
7th 63% 73% 68% 7610 4783 7780 5704 15390 10487
8th 64% 68% 66% 7581 4814 7631 5192 15212 10006
Total 55% 69% 62% 70701 38790 72690 49936 143391 88726
49
%
56
%
54
%
52
%
48
%
61
%
63
%
64
%
60
%
68
%
68
%
68
%
66
%
74
%
73
%
68
%
0%
10%
20%
30%
40%
50%
60%
70%
80%
90%
100%
1st 2nd 3rd 4th 5th 6th 7th 8th
Perc
en
t in
HF
Z
Grade
Female Male
Page 13
2011 NC IsPOD Evaluation Conducted by NCAAHPERD/NC DPH
All rights reserved.
12
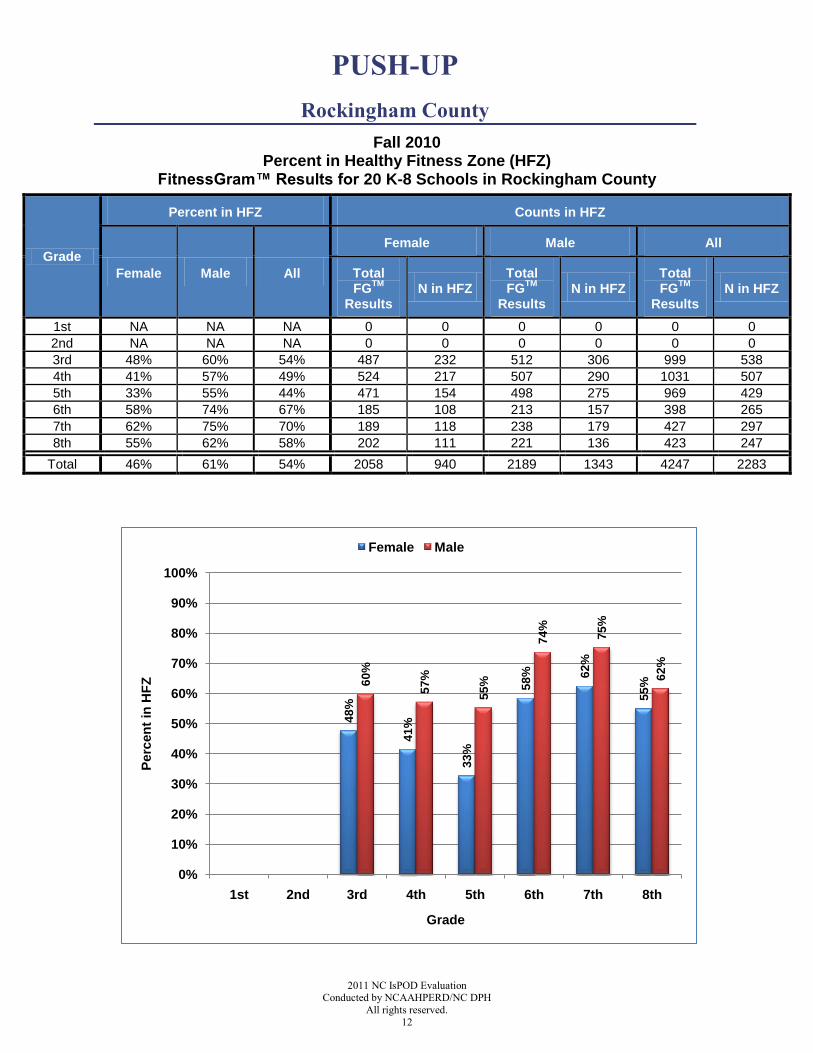
PUSH-UP
Rockingham County
Fall 2010 Percent in Healthy Fitness Zone (HFZ)
FitnessGram™ Results for 20 K-8 Schools in Rockingham County
Grade
Percent in HFZ Counts in HFZ
Female Male All
Female Male All
Total FG
TM
Results N in HFZ
Total FG
TM
Results N in HFZ
Total FG
TM
Results N in HFZ
1st NA NA NA 0 0 0 0 0 0
2nd NA NA NA 0 0 0 0 0 0
3rd 48% 60% 54% 487 232 512 306 999 538
4th 41% 57% 49% 524 217 507 290 1031 507
5th 33% 55% 44% 471 154 498 275 969 429
6th 58% 74% 67% 185 108 213 157 398 265
7th 62% 75% 70% 189 118 238 179 427 297
8th 55% 62% 58% 202 111 221 136 423 247
Total 46% 61% 54% 2058 940 2189 1343 4247 2283
48
%
41
%
33
%
58
% 62
%
55
%60
%
57
%
55
%
74
%
75
%
62
%
0%
10%
20%
30%
40%
50%
60%
70%
80%
90%
100%
1st 2nd 3rd 4th 5th 6th 7th 8th
Perc
en
t in
HF
Z
Grade
Female Male
Page 14
2011 NC IsPOD Evaluation Conducted by NCAAHPERD/NC DPH
All rights reserved.
13
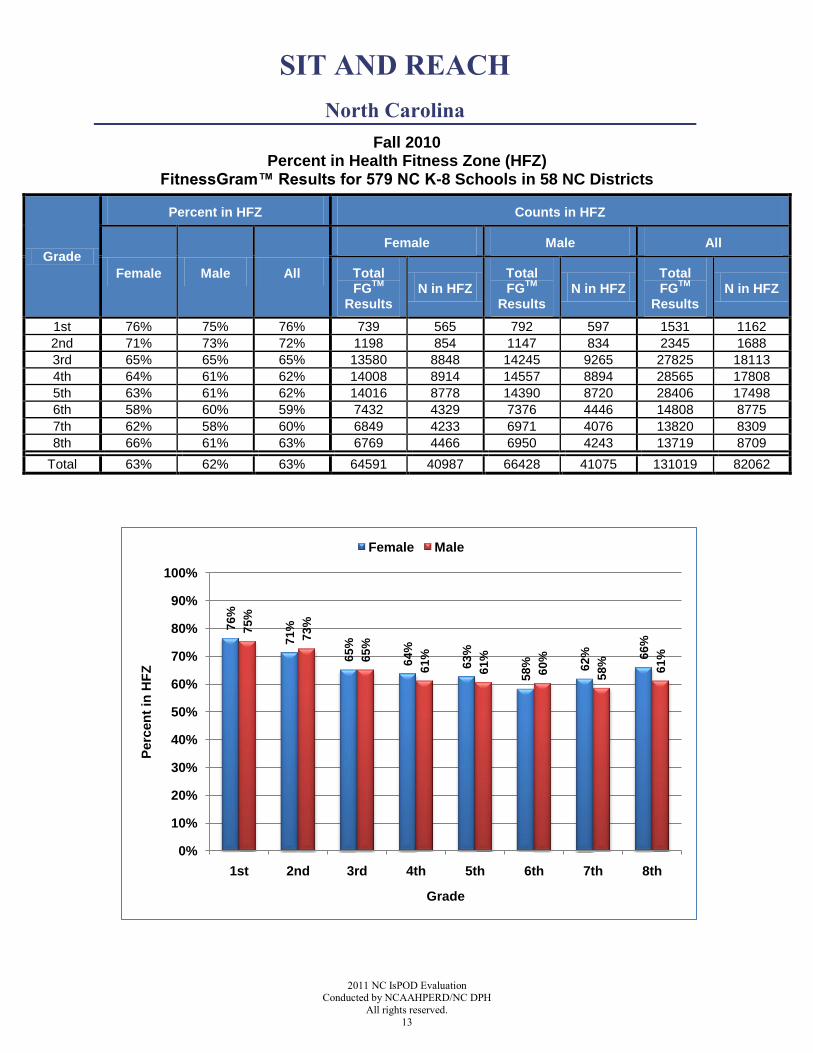
SIT AND REACH
North Carolina
Fall 2010 Percent in Health Fitness Zone (HFZ)
FitnessGram™ Results for 579 NC K-8 Schools in 58 NC Districts
Grade
Percent in HFZ Counts in HFZ
Female Male All
Female Male All
Total FG
TM
Results N in HFZ
Total FG
TM
Results N in HFZ
Total FG
TM
Results N in HFZ
1st 76% 75% 76% 739 565 792 597 1531 1162
2nd 71% 73% 72% 1198 854 1147 834 2345 1688
3rd 65% 65% 65% 13580 8848 14245 9265 27825 18113
4th 64% 61% 62% 14008 8914 14557 8894 28565 17808
5th 63% 61% 62% 14016 8778 14390 8720 28406 17498
6th 58% 60% 59% 7432 4329 7376 4446 14808 8775
7th 62% 58% 60% 6849 4233 6971 4076 13820 8309
8th 66% 61% 63% 6769 4466 6950 4243 13719 8709
Total 63% 62% 63% 64591 40987 66428 41075 131019 82062
76
%
71
%
65
%
64
%
63
%
58
% 62
% 66
%
75
%
73
%
65
%
61
%
61
%
60
%
58
%
61
%
0%
10%
20%
30%
40%
50%
60%
70%
80%
90%
100%
1st 2nd 3rd 4th 5th 6th 7th 8th
Perc
en
t in
HF
Z
Grade
Female Male
Page 15
2011 NC IsPOD Evaluation Conducted by NCAAHPERD/NC DPH
All rights reserved.
14
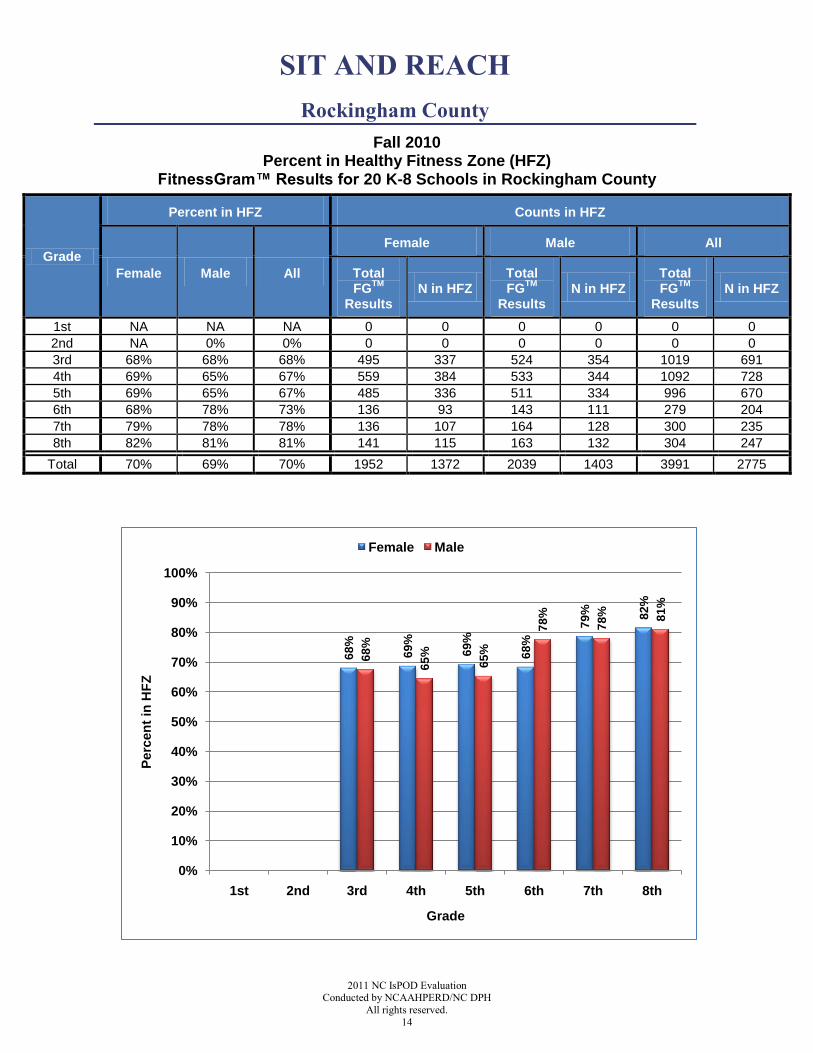
SIT AND REACH
Rockingham County
Fall 2010 Percent in Healthy Fitness Zone (HFZ)
FitnessGram™ Results for 20 K-8 Schools in Rockingham County
Grade
Percent in HFZ Counts in HFZ
Female Male All
Female Male All
Total FG
TM
Results N in HFZ
Total FG
TM
Results N in HFZ
Total FG
TM
Results N in HFZ
1st NA NA NA 0 0 0 0 0 0
2nd NA 0% 0% 0 0 0 0 0 0
3rd 68% 68% 68% 495 337 524 354 1019 691
4th 69% 65% 67% 559 384 533 344 1092 728
5th 69% 65% 67% 485 336 511 334 996 670
6th 68% 78% 73% 136 93 143 111 279 204
7th 79% 78% 78% 136 107 164 128 300 235
8th 82% 81% 81% 141 115 163 132 304 247
Total 70% 69% 70% 1952 1372 2039 1403 3991 2775
68
%
69
%
69
%
68
%
79
% 82
%
68
%
65
%
65
%
78
%
78
% 81
%
0%
10%
20%
30%
40%
50%
60%
70%
80%
90%
100%
1st 2nd 3rd 4th 5th 6th 7th 8th
Perc
en
t in
HF
Z
Grade
Female Male
Page 16
2011 NC IsPOD Evaluation Conducted by NCAAHPERD/NC DPH
All rights reserved.
15
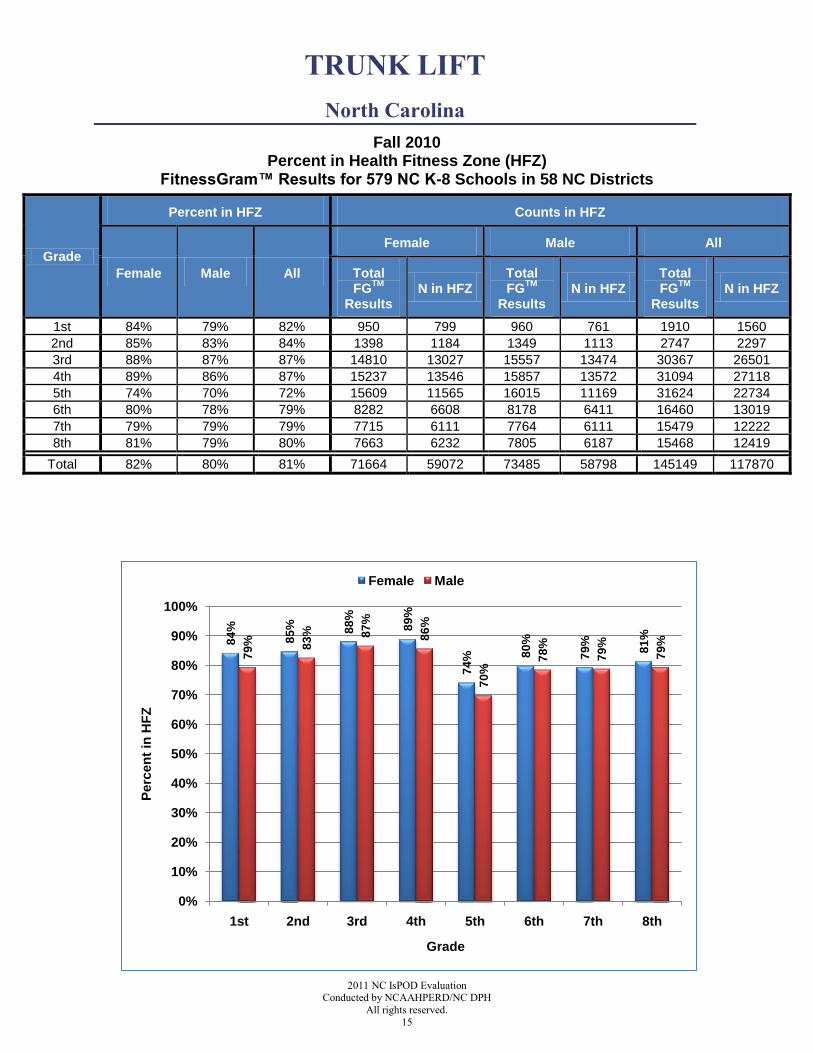
TRUNK LIFT
North Carolina
Fall 2010 Percent in Health Fitness Zone (HFZ)
FitnessGram™ Results for 579 NC K-8 Schools in 58 NC Districts
Grade
Percent in HFZ Counts in HFZ
Female Male All
Female Male All
Total FG
TM
Results N in HFZ
Total FG
TM
Results N in HFZ
Total FG
TM
Results N in HFZ
1st 84% 79% 82% 950 799 960 761 1910 1560
2nd 85% 83% 84% 1398 1184 1349 1113 2747 2297
3rd 88% 87% 87% 14810 13027 15557 13474 30367 26501
4th 89% 86% 87% 15237 13546 15857 13572 31094 27118
5th 74% 70% 72% 15609 11565 16015 11169 31624 22734
6th 80% 78% 79% 8282 6608 8178 6411 16460 13019
7th 79% 79% 79% 7715 6111 7764 6111 15479 12222
8th 81% 79% 80% 7663 6232 7805 6187 15468 12419
Total 82% 80% 81% 71664 59072 73485 58798 145149 117870
84
%
85
% 88
%
89
%
74
% 80
%
79
%
81
%
79
% 83
% 87
%
86
%
70
%
78
%
79
%
79
%
0%
10%
20%
30%
40%
50%
60%
70%
80%
90%
100%
1st 2nd 3rd 4th 5th 6th 7th 8th
Perc
en
t in
HF
Z
Grade
Female Male
Page 17
2011 NC IsPOD Evaluation Conducted by NCAAHPERD/NC DPH
All rights reserved.
16
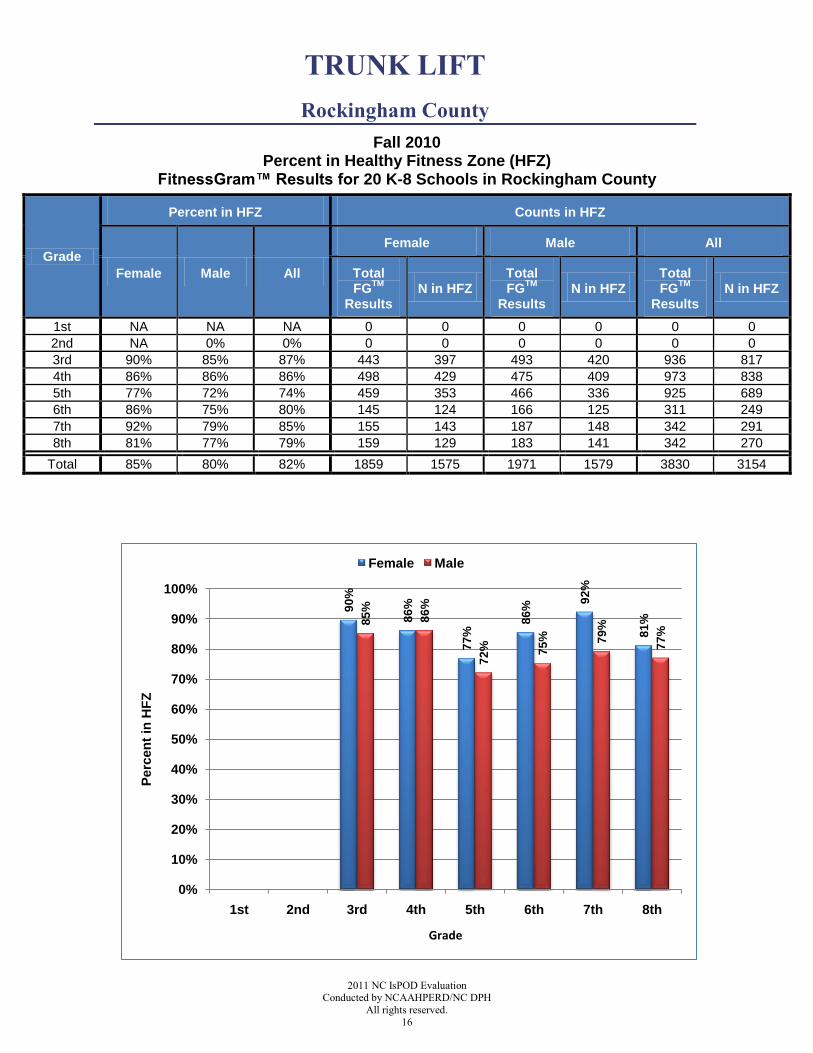
TRUNK LIFT
Rockingham County
Fall 2010 Percent in Healthy Fitness Zone (HFZ)
FitnessGram™ Results for 20 K-8 Schools in Rockingham County
Grade
Percent in HFZ Counts in HFZ
Female Male All
Female Male All
Total FG
TM
Results N in HFZ
Total FG
TM
Results N in HFZ
Total FG
TM
Results N in HFZ
1st NA NA NA 0 0 0 0 0 0
2nd NA 0% 0% 0 0 0 0 0 0
3rd 90% 85% 87% 443 397 493 420 936 817
4th 86% 86% 86% 498 429 475 409 973 838
5th 77% 72% 74% 459 353 466 336 925 689
6th 86% 75% 80% 145 124 166 125 311 249
7th 92% 79% 85% 155 143 187 148 342 291
8th 81% 77% 79% 159 129 183 141 342 270
Total 85% 80% 82% 1859 1575 1971 1579 3830 3154
90
%
86
%
77
%
86
%
92
%
81
%85
%
86
%
72
% 75
% 79
%
77
%
0%
10%
20%
30%
40%
50%
60%
70%
80%
90%
100%
1st 2nd 3rd 4th 5th 6th 7th 8th
Perc
en
t in
HF
Z
Grade
Female Male