Page 1
2010 NCAAHPERD/NCDPH IsPOD Evaluation
All rights reserved.
IIInnn---SSSccchhhoooooolll
PPPrrreeevvveeennntttiiiooonnn ooofff
OOObbbeeesssiiitttyyy aaannnddd DDDiiissseeeaaassseee
AAAdddoooppptttiiiooonnn,,, IIImmmpppllleeemmmeeennntttaaatttiiiooonnn,,, aaannnddd
“““RRReeeaaaccchhh”””
DDDeeeccceeemmmbbbeeerrr 222000111000
IIInnn---SSSccchhhoooooolll PPPrrreeevvveeennntttiiiooonnn
ooofff OOObbbeeesssiiitttyyy aaannnddd
DDDiiissseeeaaassseee
DDDeeeccceeemmmbbbeeerrr 222000111000
EEEvvvaaallluuuaaatttiiiooonnn RRReeepppooorrrttt
MMMaaarrryyy BBBiiissshhhoooppp HHHaaallllll
NNNCCCAAAAAAHHHPPPEEERRRDDD/// NNNCCC DDDPPPHHH EEEvvvaaallluuuaaatttooorrr
Page 2
2010 NCAAHPERD/ NC DPH IsPOD Evaluation
All rights reserved.
2
IIInnn---SSSccchhhoooooolll
PPPrrreeevvveeennntttiiiooonnn ooofff
OOObbbeeesssiiitttyyy aaannnddd DDDiiissseeeaaassseee
AAAdddoooppptttiiiooonnn,,, IIImmmpppllleeemmmeeennntttaaatttiiiooonnn,,, aaannnddd
“““RRReeeaaaccchhh”””
DDDeeeccceeemmmbbbeeerrr 222000111000
EXECUTIVE SUMMARY ........................................................................................................................................... 3
BACKGROUND ....................................................................................................................................................... 8
EVALUATION .......................................................................................................................................................... 9
ADOPTION ............................................................................................................................................................... 10 NC LEAs Adopting SPARK™ and Schools with SPARK™ Training ......................................................................... 10
NC LEAs ........................................................................................................................................................................... 10 NC K-8 Schools ................................................................................................................................................................ 12
IMPLEMENTATION .................................................................................................................................................. 15 NC Physical Education Teachers Implementing SPARK™ ................................................................................... 15
REACH ..................................................................................................................................................................... 17 NC K-8 Students “Reached” by SPARK™ ............................................................................................................. 17
OUTCOMES .......................................................................................................................................................... 22
SURVEY RESULTS ......................................................................................................................................................... 22 Teacher Surveys.................................................................................................................................................. 22 Student Surveys .................................................................................................................................................. 27
FITNESSGRAM™ RESULTS .............................................................................................................................................. 32 Body Composition .............................................................................................................................................. 32 Aerobic Fitness ................................................................................................................................................... 35 Muscular Strength, Endurance, and Flexibility ................................................................................................... 37
Lower Back ...................................................................................................................................................................... 37 Abdominal ....................................................................................................................................................................... 39 Upper Body ..................................................................................................................................................................... 40 Flexibility ......................................................................................................................................................................... 42
ANALYSIS OF COMBINED SURVEY AND FITNESSGRAM™ RESULTS .......................................................................................... 44 Physical Activity .................................................................................................................................................. 44 Nutrition ............................................................................................................................................................. 46 Screen Time ........................................................................................................................................................ 46 Analysis By Grade Levels .................................................................................................................................... 49
CHALLENGES/RECOMMENDATIONS .................................................................................................................... 53
FITNESSGRAM™ DATA.................................................................................................................................................. 53 SURVEY DATA ............................................................................................................................................................. 55 COMMUNICATIONS AND COLLABORATIONS ....................................................................................................................... 56
APPENDICES......................................................................................................................................................... 59
APPENDIX A PROGRAM GOAL AND OBEJECTIVES ................................................................................................................ 59 APPENDIX B TEACHER TRAINING RECORD ......................................................................................................................... 61 APPENDIX C NUMBER & PERCENT IF SCHOOLS & STAFF WITH SPARK™ TRAINING .................................................................. 69 APPENDIX D STUDENTS "REACHED" BY SPARK™ .............................................................................................................. 75 APPENDIX E FITNESSGRAM™ RESPONSE RATE................................................................................................................... 80 APPENDIX F COOPER INSTITUTE FITNESSGRAM™ STANDARDS .............................................................................................. 84 APPENDIX G ANALYSIS OF FITNESSGRAM™ AND STUDENT SURVEY RESULTS ........................................................................... 87
Page 3
2010 NCAAHPERD/NC DPH IsPOD Evaluation
All rights reserved.
3
Executive Summary In School Prevention of Obesity and Disease (IsPOD) is a program designed to improve
the health and fitness of K-8 public school students in North Carolina by providing
physical education (PE) teachers with specialized training and a mechanism for
assessing and tracking student fitness levels over time. The four-year program—
funded with a grant from the Kate B. Reynolds (KBR) Foundation in fall 2008—is a
statewide expansion of a program funded by the North Carolina Health and Wellness
Trust Fund (HWTF) from fall 2006 to spring 2008.
With IsPOD grant funds, the North Carolina Alliance for Athletics, Health, Physical
Education, Recreation and Dance (NCAAHPERD) is providing training in the SPARK™
(Sports, Play and Active Recreation for Kids) curriculum to PE teachers of students in
grades K through 8 in all 115 North Carolina school districts, or Local Educational
Agencies (LEAs). SPARK™ is a research-based PE program designed to increase
moderate-to-vigorous physical activity (MVPA), improve fitness levels and sport skills,
and enhance students’ enjoyment of physical education. As part of IsPOD, school
districts are expected to implement SPARK™ and assess student fitness levels for
students in grades 3-8. FitnessGram™ software—a program to record and track fitness
levels with respect to body composition (BMI), cardiovascular fitness, strength,
endurance, and flexibility—is provided during teacher training, along with manuals for its
use.
Evaluation of the adoption, implementation, and reach of IsPOD from fall 2008 through
fall 2010 indicates good progress with program implementation:
(1) 72% of all NC LEAs have adopted SPARK™. By the end of Year Three, the
adoption rate is expected to rise to 77%.
(2) PE teachers from 85% of K-8 schools in LEAs that have adopted SPARK™ and
72% of all NC K-8 schools have received training in SPARK™. In addition, 12%
of all NC high schools have received SPARK™ training, although high schools
were not specifically targeted for the grant.
Page 4
2010 NCAAHPERD/ NC DPH IsPOD Evaluation
All rights reserved.
4
(3) 73% of K-8 PE teachers in the adopting LEAs have received SPARK™ training
and 62% of all K-8 PE teachers have received SPARK™ training. IsPOD has
trained 2,252 K-8 PE teachers and other school staffs across the state, for a total
of 2,432 SPARK™ trained staffs.
(4) Student ―reach‖ (the percent of elementary students receiving the benefits of the
SPARK™ philosophy and curriculum in their PE classes) is estimated to be 19%
to 87% of all K-8 students in the 61 LEAs adopting SPARK™ by spring 2010.
Reach for Year Three should improve substantially due to higher reporting of
FitnessGram™ data in fall 2010.
Program outcomes are based on teacher surveys, student surveys, and FitnessGram™
assessment data submitted in spring 2010. (An addendum to this report with outcomes
based on fall 2010 survey and FitnessGram™ data will be issued in March 2011.)
These outcomes show:
Almost all the teachers indicated that they enjoyed SPARK™ training and felt
well prepared to implement SPARK™, and 91% of teachers felt the SPARK™
program enhanced their teaching style.
75% or more of teachers observed positive benefits from using SPARK™:
improved student skill levels, fewer students ―sitting out‖ during PE, students
being more active during PE, and students enjoying PE more.
A large percentage of students are not meeting the Center for Disease Control
(CDC) health and nutrition guidelines, which include recommended servings per
day of vegetables and dairy/milk, and 60 minutes of daily physical activity.
Students in higher grade levels are engaging in significantly fewer ―healthy‖
habits compared to students in lower grade levels, and in significantly more
―unhealthy‖ habits compared to students in lower grade levels.
Using FitnessGram™, PE teachers submit six fitness measurements for students,
including Body Mass Index (BMI) and measures of aerobic/cardiovascular fitness, body
Page 5
2010 NCAAHPERD/NC DPH IsPOD Evaluation
All rights reserved.
5
strength (core, upper, and lower), and flexibility. FitnessGram™ assessments from
more than 82,000 1st-8th graders show:
43% of these students exceed the ―healthy fitness zone‖ (HFZ) for BMI,
indicating that they are at risk for metabolic syndrome. In the IsPOD program, a
higher percent of males (44%) than females (42%), and older students (about
44%) than younger students (about 40%), were over the HFZ for BMI.
Differences were statistically significant.
Indicators of aerobic and cardiovascular fitness, which are submitted for 4th-8th
graders only, show 83% of females and 57% of males (for whom standards are
more stringent) are in the healthy fitness zone. A steady and statistically
significant decrease in aerobic fitness was observed for both females and males
as they progressed from grade 4 to grade 8.
BMI and aerobic capacity, which are linked, provide the best indicators of students’
overall health, identifying students who may be at risk for metabolic syndrome, a group
of risk factors that collectively promote and increase the risk of cardiovascular disease
and diabetes. Analysis of the spring 2010 FitnessGram™ data shows a steady trend
from grades 4 through 8: A progressively higher percent of students are over the HFZ
for BMI and under the HFZ for aerobic capacity, showing that students are becoming
progressively at risk for metabolic syndrome as they age.
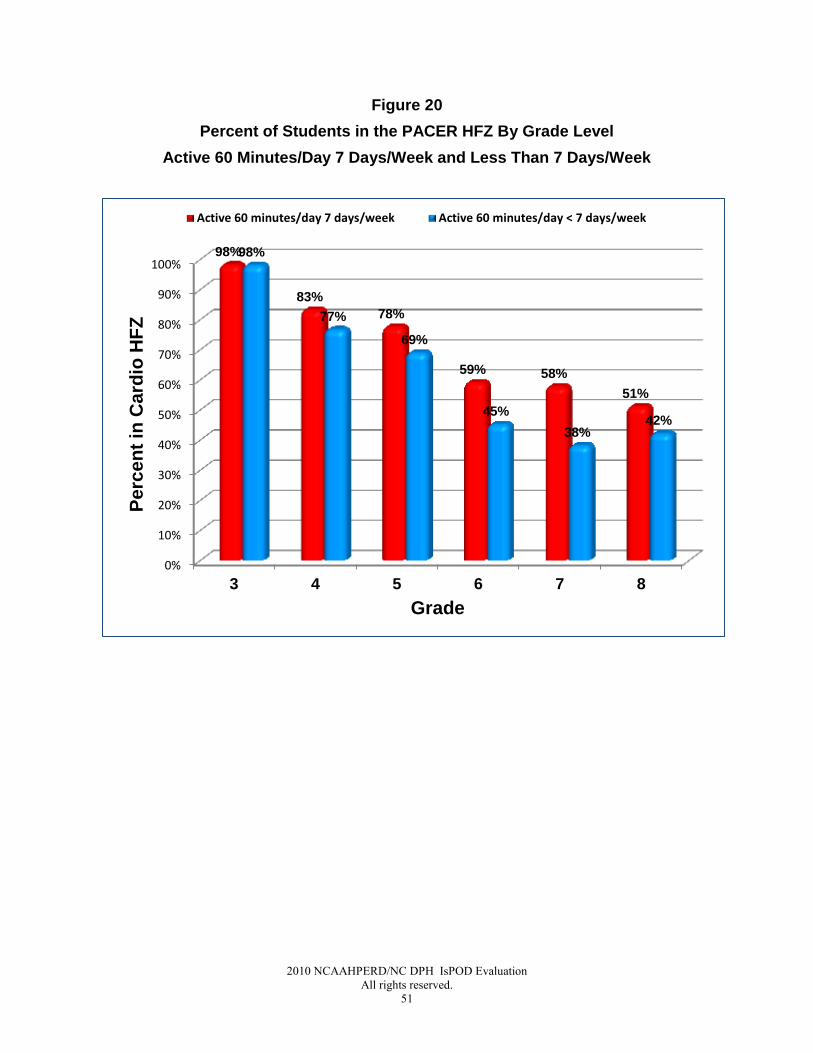
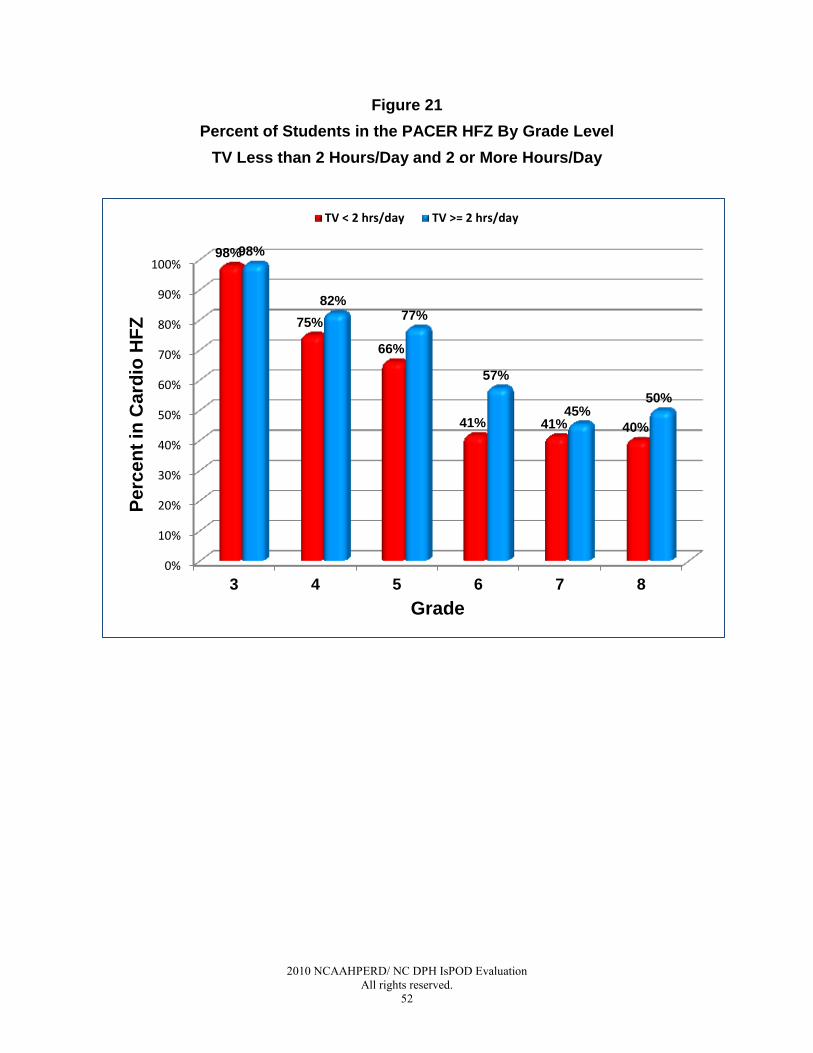
Student survey results show that a decrease in the number of PE days/week, a
decrease in the amount of daily physical activity, and an increase in daily TV time are
contributing to lower cardiovascular fitness levels for students in higher grade levels.
Analysis of combined student survey and FitnessGram™ results for students in all
grade levels was performed to determine the impact of students’ daily habits (in physical
activity, nutrition, and screen time) on their FitnessGram™ measurements. Some of the
statistically significant findings show:
Responses to questions about physical activity were highly correlated with
FitnessGram™ measurements. Students who were more active were more
Page 6
2010 NCAAHPERD/ NC DPH IsPOD Evaluation
All rights reserved.
6
likely to be in the HFZ for all six fitness measurements compared to students
who were not as active. Students who had PE 3 or more days/week were more
likely to be in the HFZ for aerobic capacity, flexibility, and lower back strength
compared to students who did not.
Students who ate breakfast 7 days/week, dinner at home 5 or more days/week,
and four or more servings of vegetables/day were more likely to be in the HFZ
for every FitnessGram™ measurement compared to students who did not.
Students who spent less time watching TV or playing video games were more
likely to be in the HFZ for every FitnessGram™ measurement compared to
students who had more ―screen time.‖
Although participation in SPARK™ has been high, participation in FitnessGram™
lagged, perhaps due in part to FitnessGram™ software issues. NCAAHPERD has
worked to fix problems and improve participation, and plans to encourage and prepare
K-2 PE teachers to perform more FitnessGram™ testing and reporting. NCAAHPERD
is also adding FitnessGram™ training to its annual ―booster‖ training sessions to
encourage teachers expressing discomfort with the online, self-taught FitnessGram™
training.
NCAAHPERD staffs have addressed several issues with survey data. The length and
frequency of student and teacher surveys may deter participants from completing them,
so evaluators are revising surveys for spring 2011. IsPOD relies upon student data
from the NC Department of Public Instruction (DPI), some of which was missing or
incomplete; NCAAHPERD has worked with DPI to fill in the gaps and to link survey data
with student, teacher, and school ID numbers, resulting in a greater understanding of
the data and broader research possibilities. NCAAHPERD has approached SAS
Institute and the State Center for Health Statistics for support with storage,
management, and analysis of FitnessGram™ and survey data as the program grows.
The fact that the IsPOD program has reached such a large percentage of districts,
schools, and teachers—who participate on a voluntary basis—suggests that districts,
Page 7
2010 NCAAHPERD/NC DPH IsPOD Evaluation
All rights reserved.
7
schools, and teachers support the program, setting groundwork for sustainability.
NCAAPHERD continues to promote sustainability and statewide implementation with
ongoing training, support and communication, as well as training opportunities for
schools that have not yet adopted SPARK™. Communication of program progress and
results to the scientific community and general public through journal publications, press
releases, and conference presentations will also promote the sustainability of the
program and dissemination of findings; in the remaining years of the grant, emphasis
should be on educating a broader audience about the findings of the IsPOD program.
Page 8
2010 NCAAHPERD/ NC DPH IsPOD Evaluation
All rights reserved.
8
Background In the fall of 2006, the North Carolina North Carolina Alliance for Athletics, Health,
Physical Education, Recreation and Dance (NCAAHPERD) applied for and received a
$400,000 grant from the Health and Wellness Trust Fund (HWTF) to address health
disparities in seven targeted North Carolina (NC) districts from seven NC educational
regions. NCAAHPERD provided specialized, research-based physical education
training in the SPARK™ (Sports, Play and Active Recreation for Kids) curriculum to
students in grades 3 through 8 in the seven targeted districts over a two-year period.
SPARK™ is a research-based physical education program, designed to increase
moderate-to-vigorous physical activity (MVPA), improve fitness levels and sport skills,
and enhance the enjoyment of physical education among students. During the 2-year
HWTF grant period, NCAAHPERD provided training to 395 elementary physical
education teachers from 164 schools.
In fall 2008, the Kate B. Reynolds Charitable Trust (KBR) committed over three million
dollars to the state-wide expansion of this project over four years, with the objective of
making the SPARK™ curriculum and training available to all K-8 elementary schools in
all 115 NC local educational agencies (LEAs). The KBR-funded ―In School Prevention
of Obesity and Disease‖ (IsPOD) program is designed to improve the health and fitness
of North Carolina Kindergarten to 8th grade students by providing PE teachers in
schools with specialized physical education training and a mechanism for assessing
and tracking student fitness levels over time. In addition, the Blue Cross Blue Shield of
North Carolina Foundation awarded a $139,500 one-year grant in 2008-09 to expand
the HWTF initiative in the original 7 districts to include the K-2 SPARK™ curricula,
provide the latest 3-8 SPARK™ manuals, and begin the development of the ―train the
trainer‖ program.
The SPARK™ curriculum and training is being provided incrementally to current
physical education teachers in the state. Training is offered at one or more of three
levels (Grades K-2, 3-5, and 6-8) and includes 8 hours of instruction as well as two
complete curriculum manuals. Software, manuals, and training for the FitnessGram™
Page 9
2010 NCAAHPERD/NC DPH IsPOD Evaluation
All rights reserved.
9
software; a program to measure fitness levels, such as BMI, strength, endurance, and
flexibility, is also provided during the training.
In addition to providing training to current NC K-8 physical education teachers, the
NCAAHPERD IsPOD staff is providing SPARK™ training to faculty at NC colleges and
universities with physical education degree programs. Faculty from these NC colleges
and universities can then train future physical education teachers (i.e., students
majoring in physical education) in the SPARK™ curriculum, thus creating a sustainable
pool of physical education teachers with training in the SPARK™ curriculum.
Evaluation Adoption, Implementation, and “Reach”
Program Evaluators are using the ―RE-AIM‖ evaluation model to document and
measure the Reach, Effectiveness, Adoption, Implementation, and Maintenance of the
IsPOD program. This evaluation primarily details the ―AIR‖ portions of the evaluation
model – the number and percent of NC LEAs that have adopted SPARK™; the number
and percent of schools in these LEAs that have received the SPARK™ training; the
number and percent of current NC physical education teachers that have received the
SPARK™ training; and estimates of the number and percent of NC K-8 students that
have been “reached” by SPARK™ in year three of the KBR grant.
Appendix A outlines the program goals, objectives, activities and measurable
outcomes. Goal One of the IsPOD program is to ―reform the Physical Education
program in North Carolina (NC) K-8 schools to better improve the health and fitness of
NC children.‖ Objectives developed to obtain this goal include (1) making a research-
based K-8 physical education program available to all NC districts and K-8 schools
(adoption), (2) training new and current NC PE teachers in the use of this curriculum
(training and implementation), and (3) creating a mechanism for tracking the health and
fitness of NC children using this curriculum (“reach”).
Page 10
2010 NCAAHPERD/ NC DPH IsPOD Evaluation
All rights reserved.
10
ADOPTION
NC LEAs Adopting SPARK™ and Schools with SPARK™ Training
NC LEAs
North Carolina is divided into 115 local educational agencies (LEAs) or school districts
among 8 different educational regions (central, north central, south central, north
eastern, south eastern, north western, south western, and western). During the HWTF
grant (fall 2007 through spring 2008) and the first 3 ½ year of the KBR grant (fall 2008
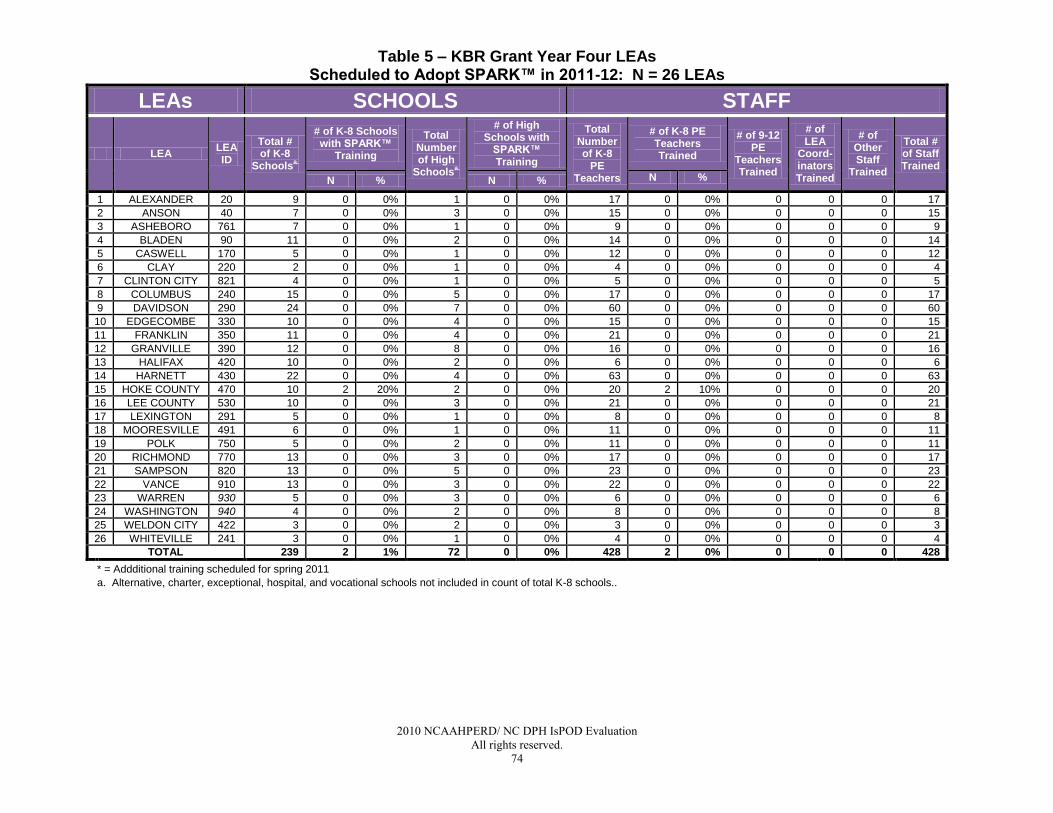
through fall 2010) 83 of 115 NC LEAs (72%) have adopted SPARK™. Six additional
LEAs are scheduled for SPARK™ training in spring 2011, for a projected adoption rate
of 77% of the NC LEAs (89 of 115) by the end of grant year three. In addition, 12 LEAs
that have already received SPARK™ training (4 from KBR Grant Years 1 and 2, and 8
from fall 2010) are scheduled to receive additional SPARK™ in spring 2011.
During the adoption phase the NCAAPHERD IsPOD Director works with the district
physical education coordinator to negotiate IsPOD training dates and locations for
elementary and middle schools in the district. Each district coordinator receives a
packet of information about the IsPOD Program, which includes the IsPOD Fact Sheet,
information about SPARK™ and FitnessGram™, explanations of the responsibilities of
the district and schools participating in IsPOD and a letter of support from State
Superintendent of Education, Dr. June Atkinson. Initially, substitute reimbursement
funds were provided for teachers to attend training sessions. Recently, more training
sessions have been scheduled during teacher work-days. Although this has eliminated
the need to provide substitute reimbursement funds, it has presented more challenges
in scheduling training dates to coincide with planned teacher work days. When
scheduling training for smaller districts, training sessions are scheduled so that teachers
from several districts are included to ensure a minimum of 25 and not more than 40
teachers in attendance at each training session. Once scheduled, IsPOD provides
SPARK™ materials for each teacher. Typically, three dates are scheduled for the three
levels of training (i.e., K-2, 3-5 and 6-8).
Page 11
2010 NCAAHPERD/NC DPH IsPOD Evaluation
All rights reserved.
11
After training has been completed, the teachers, the Ambassador, and the trainer
complete a SPARK™ evaluation which is submitted to NCAAPHERD. As an incentive
for the training, each teacher who completes a training level is offered a year’s free
membership in NCAAHPERD. The IsPOD staffs continue to field questions from
instructors and provide continuing support and counseling on using the curriculum. The
IsPOD staffs also provide leads and assistance in finding funds for equipment for
teachers who have been trained.
Each K-8 school receiving training receives the FitnessGram™ software program.
IsPOD pays the schools’ license fee for FitnessGram™. IsPOD staffs also offer annual
refresher training or ―booster‖ sessions, publish a newsletter and produce periodic
mailings to keep participating teachers connected.
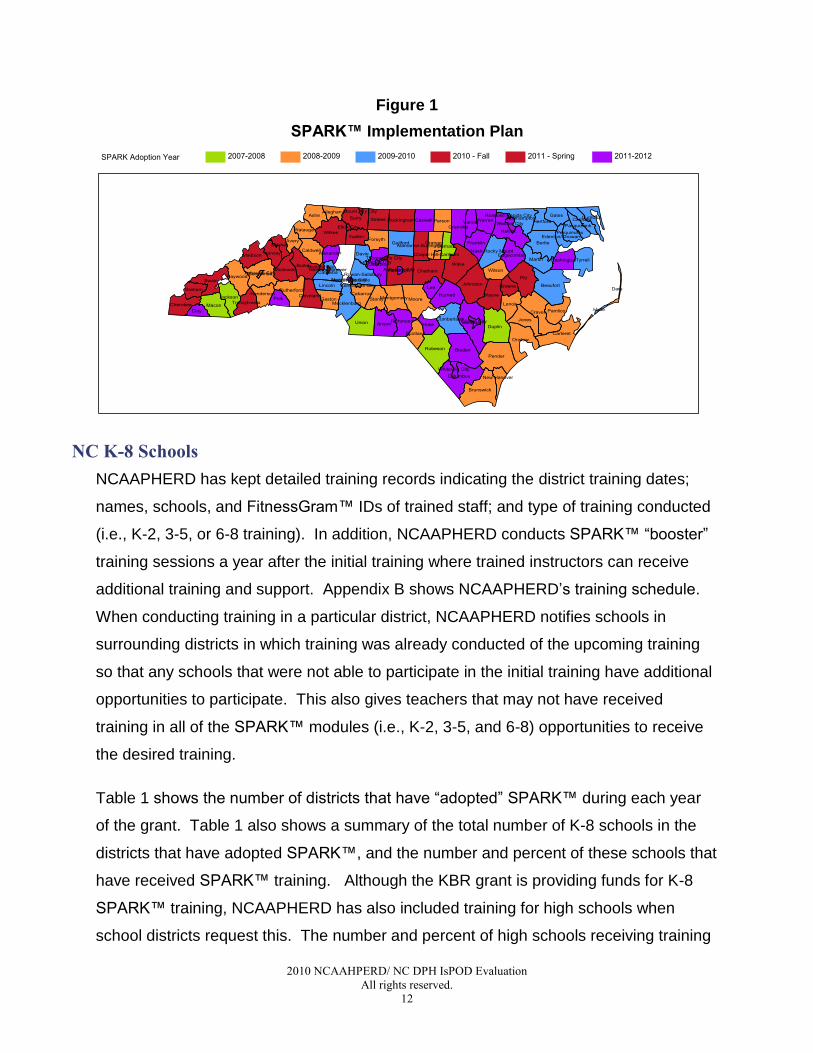
Figure 1 shows the NC LEAS that have received training and the projected
implementation plan for the remainder of the grant.
In summary, NCAAPHERD’s adoption plan is progressing well with 72% of the NC
school districts having adopted SPARK™ through fall 2010 and a projected SPARK™
adoption rate of 77% of the NC LEAs by the end of year three of the KBR grant.
Page 12
2010 NCAAHPERD/ NC DPH IsPOD Evaluation
All rights reserved.
12
Figure 1
SPARK™ Implementation Plan
NC K-8 Schools
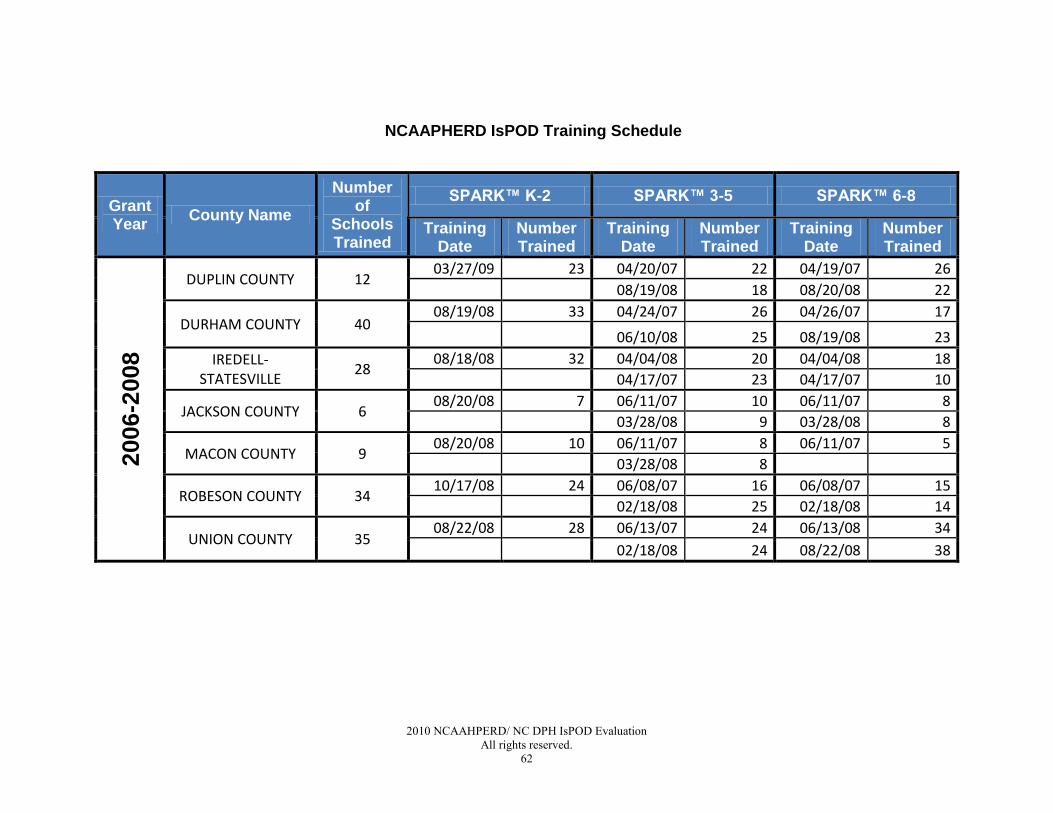
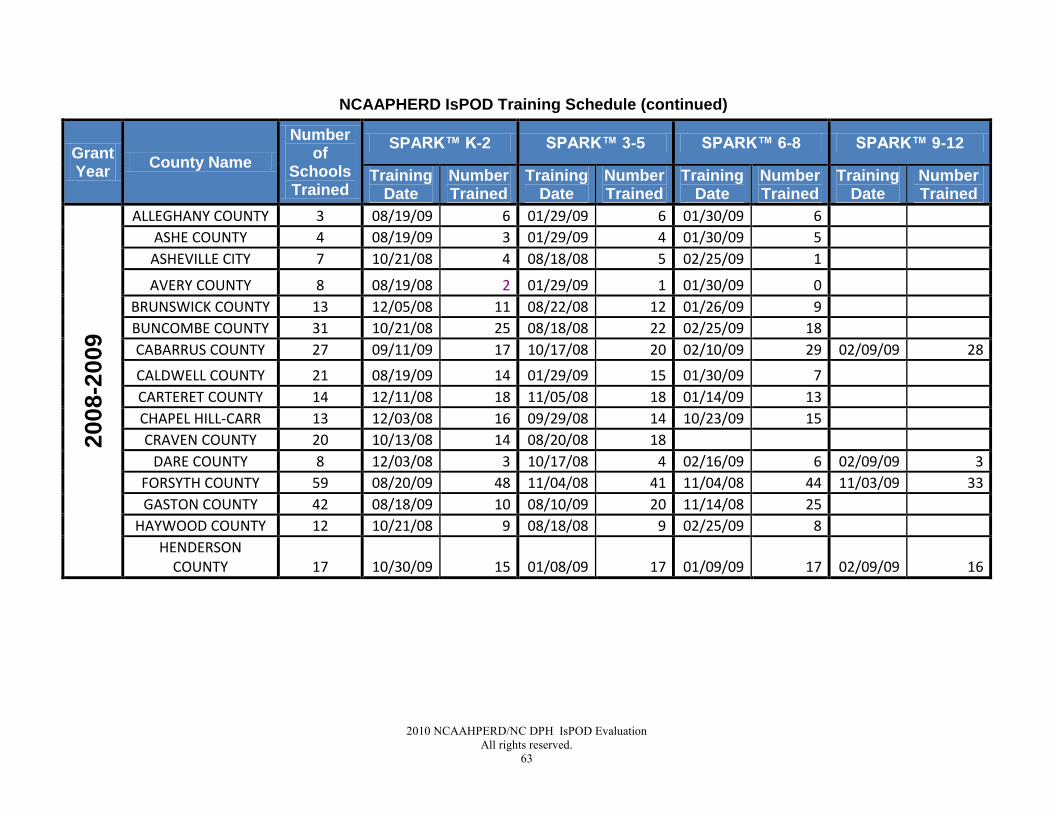
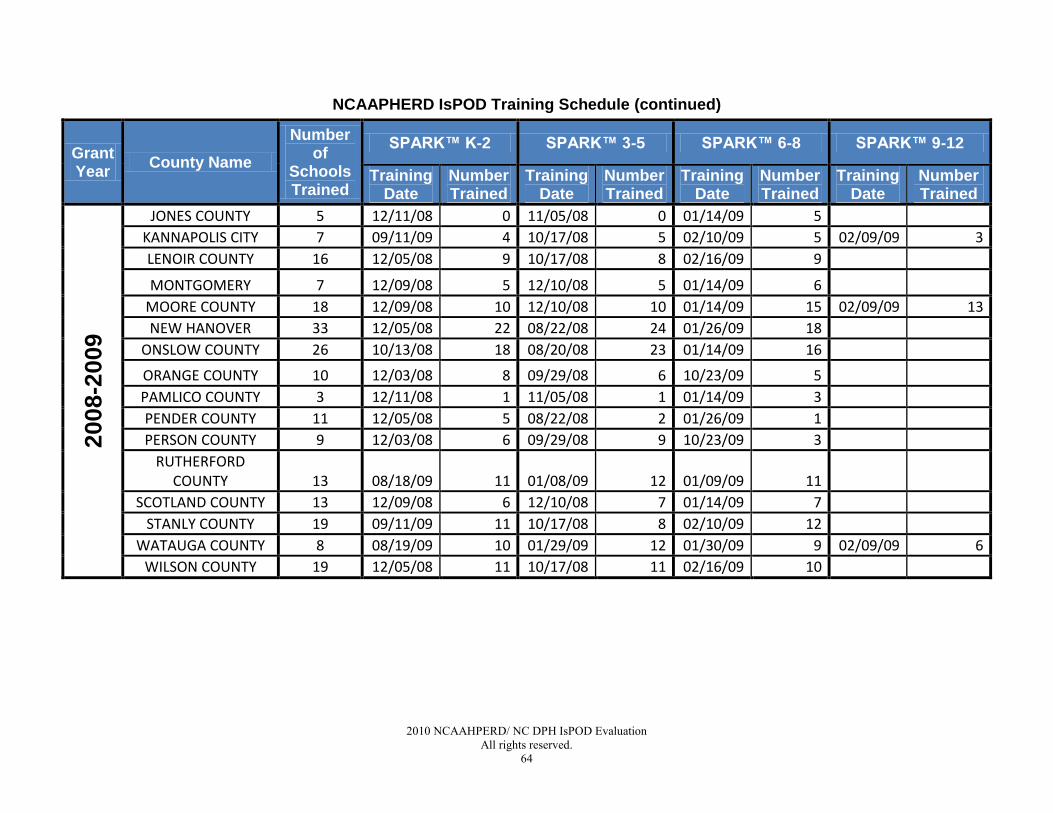
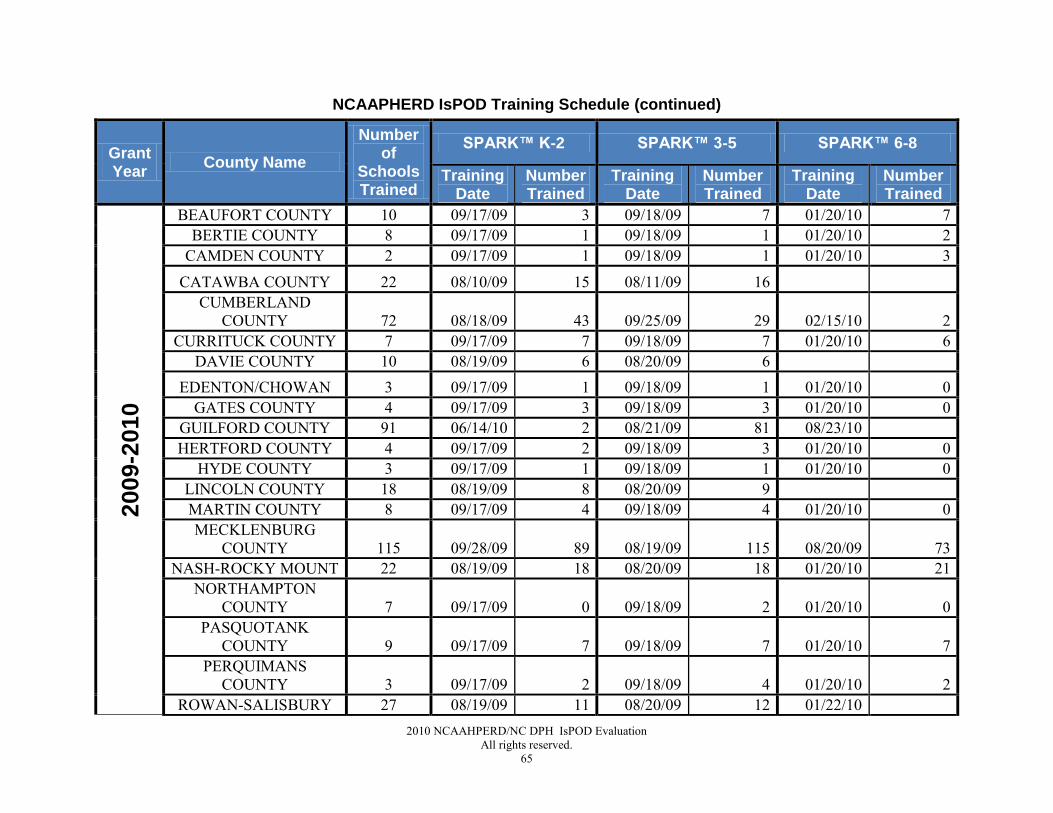
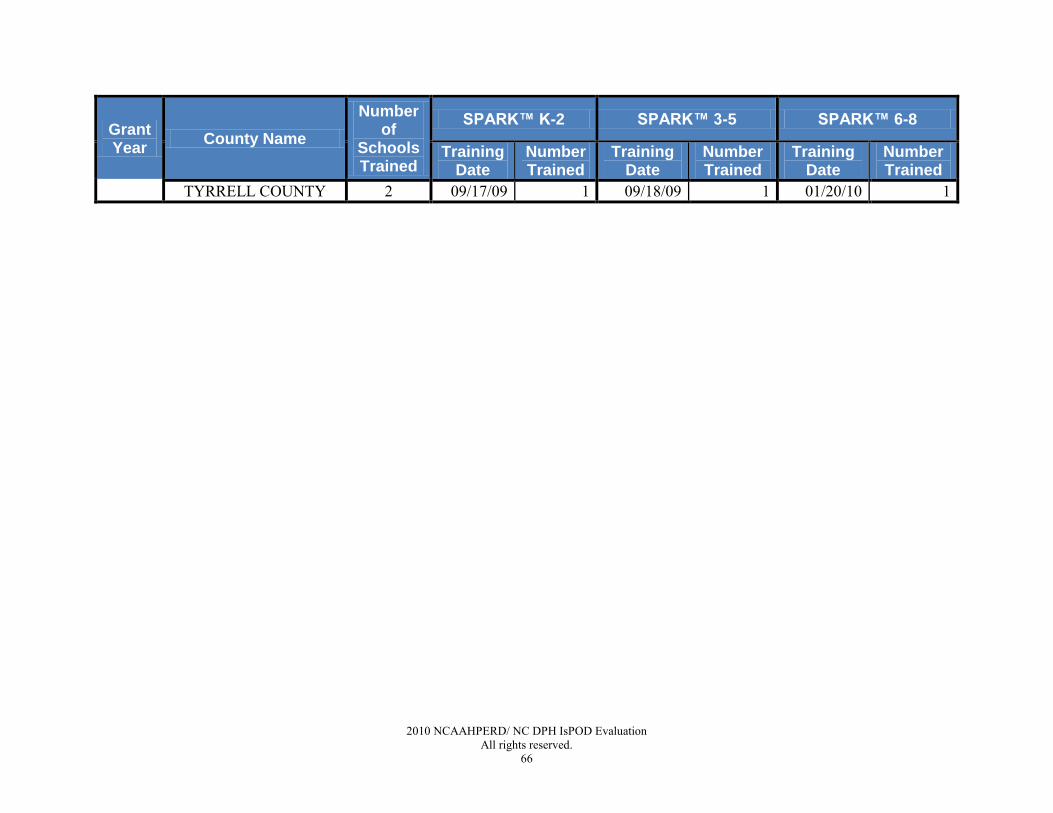
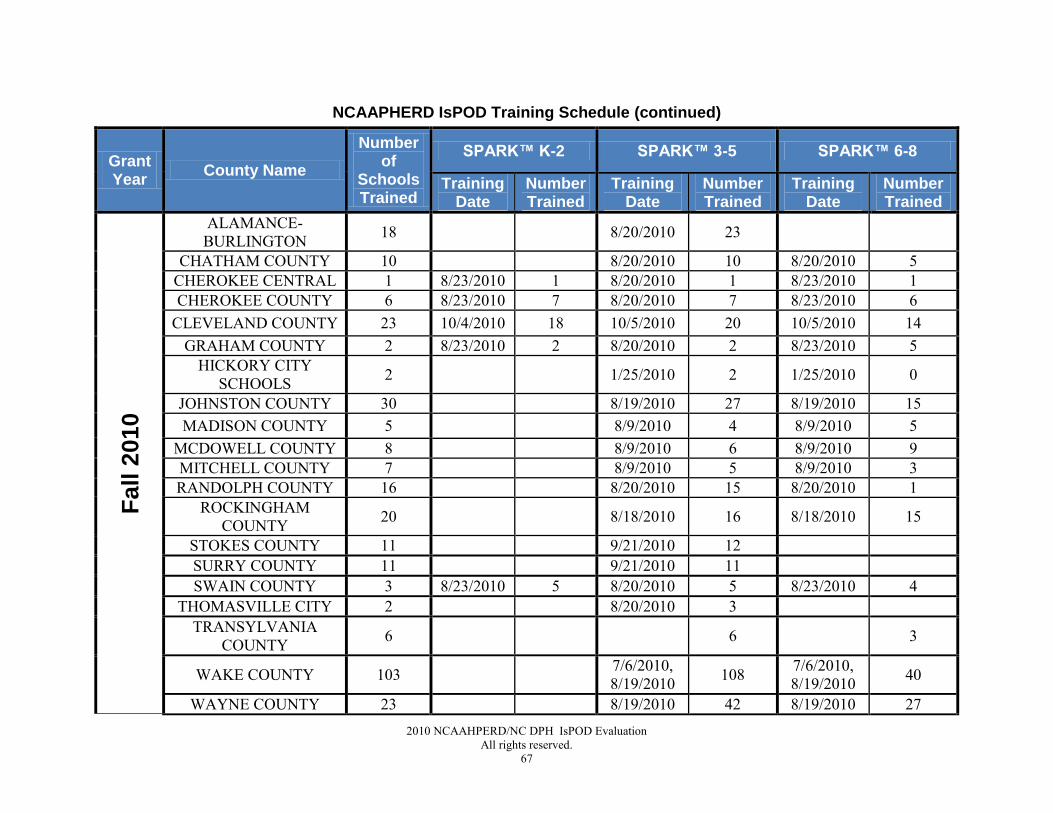
NCAAPHERD has kept detailed training records indicating the district training dates;
names, schools, and FitnessGram™ IDs of trained staff; and type of training conducted
(i.e., K-2, 3-5, or 6-8 training). In addition, NCAAPHERD conducts SPARK™ ―booster‖
training sessions a year after the initial training where trained instructors can receive
additional training and support. Appendix B shows NCAAPHERD’s training schedule.
When conducting training in a particular district, NCAAPHERD notifies schools in
surrounding districts in which training was already conducted of the upcoming training
so that any schools that were not able to participate in the initial training have additional
opportunities to participate. This also gives teachers that may not have received
training in all of the SPARK™ modules (i.e., K-2, 3-5, and 6-8) opportunities to receive
the desired training.
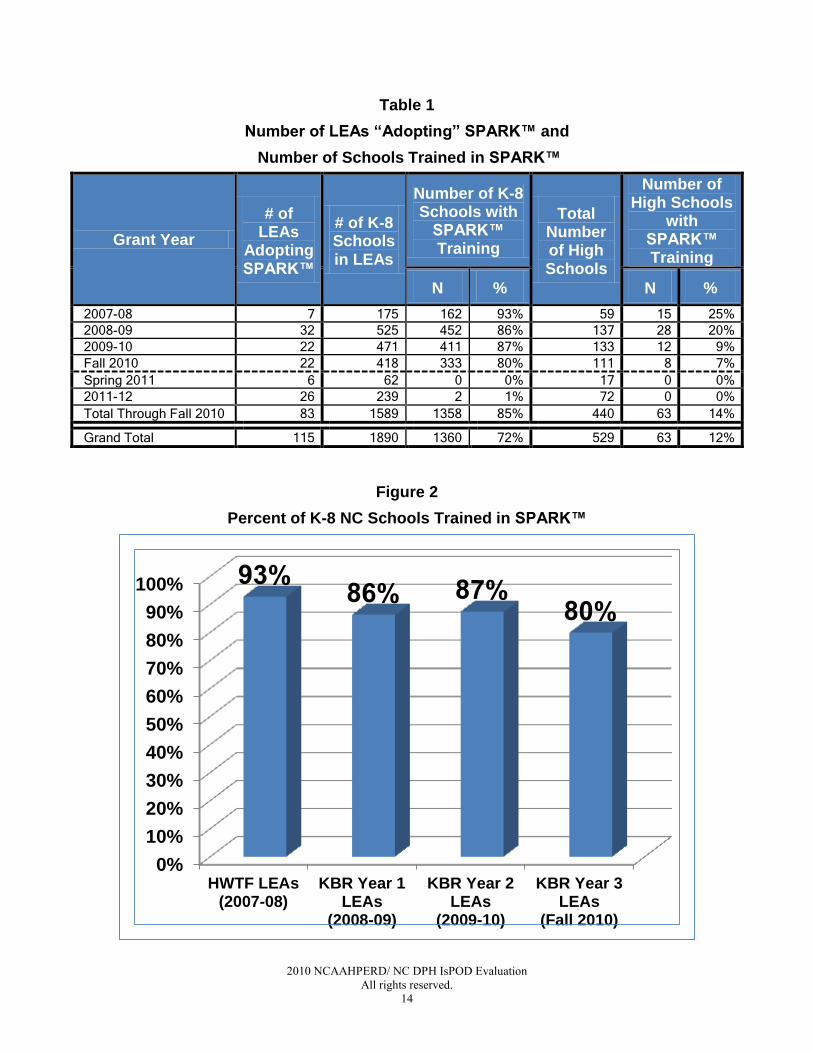
Table 1 shows the number of districts that have ―adopted‖ SPARK™ during each year
of the grant. Table 1 also shows a summary of the total number of K-8 schools in the
districts that have adopted SPARK™, and the number and percent of these schools that
have received SPARK™ training. Although the KBR grant is providing funds for K-8
SPARK™ training, NCAAPHERD has also included training for high schools when
school districts request this. The number and percent of high schools receiving training
Page 13
2010 NCAAHPERD/NC DPH IsPOD Evaluation
All rights reserved.
13
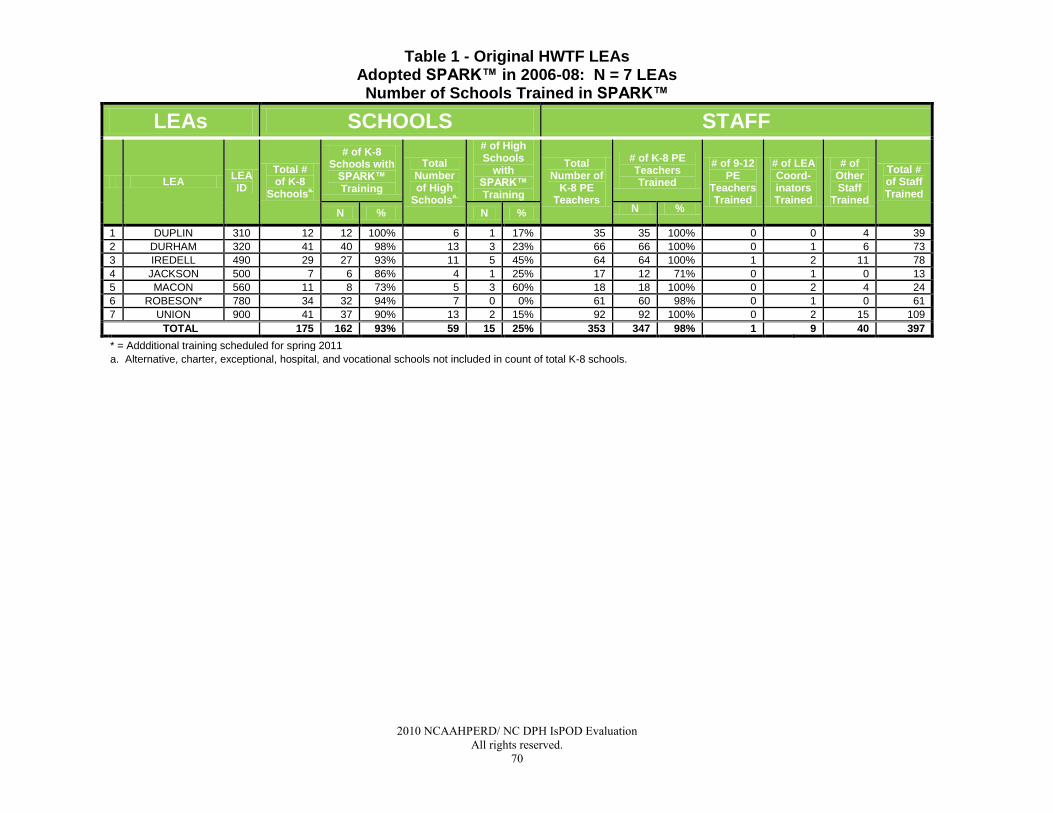
is also shown in Table 1. Tables 1 through 5 in Appendix C show this data for each of
the individual districts for each year of the grant, the NC LEAs that have adopted
SPARK™ and the projected implementation plan for the remainder of the KBR grant.
The percent of K-8 schools receiving SPARK™ training by KBR Grant Year is shown
graphically in Figure 2. As indicated in Table 1 and Figure 2, 85% of the 1,589 NC K-8
public schools in the 83 school districts that have adopted SPARK™ have received
training in SPARK™, and 72% of all 1,890 K-8 schools in the state have received
SPARK™ training. In addition, 12% of all NC high schools have received SPARK™
training, although high schools were not specifically targeted for the grant.
Figure 2 shows that 93% of the K-8 schools from the HWTF Grant have received
training in SPARK™. The percent of K-8 schools from KBR Grant Year One, Grant
Year Two, and Grant Year Three (fall 2010) that have received training is 86%, 87%
and 80%, respectively. The percentage of HWTF Grant K-8 schools trained in
SPARK™ is higher than in KBR Grant Years One and Two because the HWTF Grant
schools have been involved in the program the longest and have had additional years to
receive SPARK™ training. Schools that were not able to receive training during the
district adoption year are invited to receive training when it is offered in nearby districts.
Thus, the percentages given in Figure 2 will continue to increase during the last 1 ½
years of the KBR Grant as schools in these districts are given additional opportunities to
receive training.
Page 14
2010 NCAAHPERD/ NC DPH IsPOD Evaluation
All rights reserved.
14
Table 1
Number of LEAs “Adopting” SPARK™ and
Number of Schools Trained in SPARK™
Grant Year
# of LEAs
Adopting SPARK™
# of K-8 Schools in LEAs
Number of K-8 Schools with
SPARK™ Training
Total Number of High Schools
Number of High Schools
with SPARK™ Training
N % N %
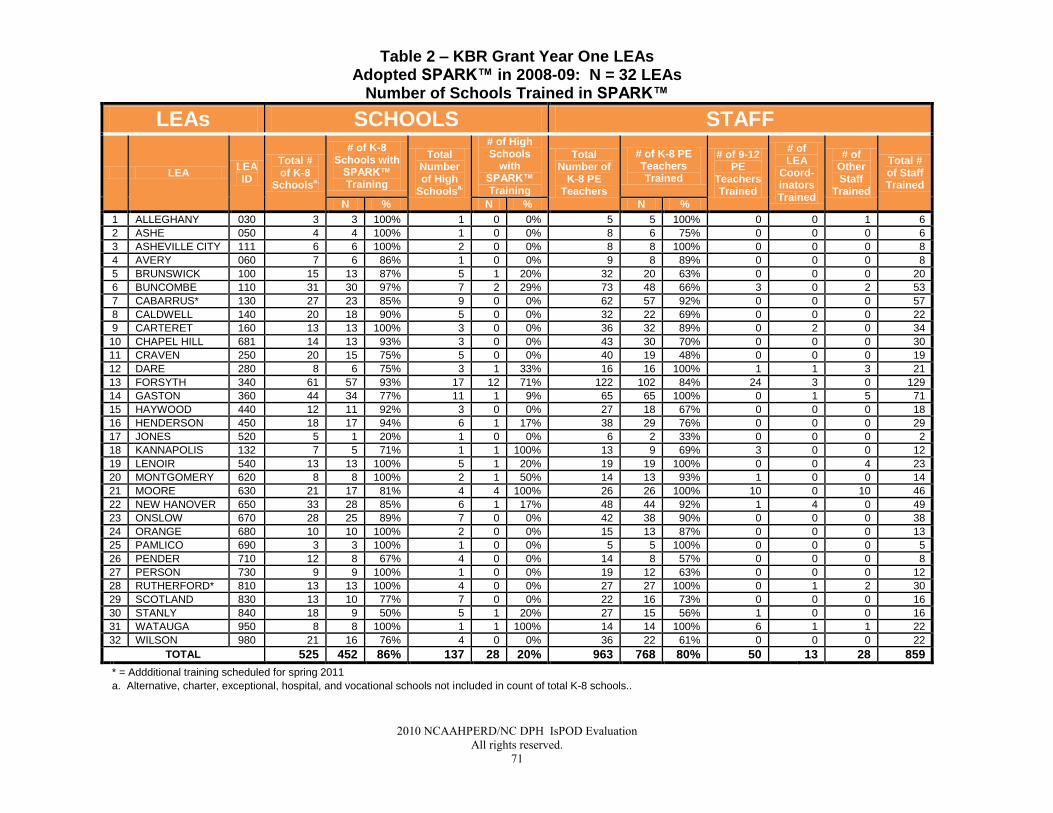
2007-08 7 175 162 93% 59 15 25%
2008-09 32 525 452 86% 137 28 20%
2009-10 22 471 411 87% 133 12 9%
Fall 2010 22 418 333 80% 111 8 7%
Spring 2011 6 62 0 0% 17 0 0%
2011-12 26 239 2 1% 72 0 0%
Total Through Fall 2010 83 1589 1358 85% 440 63 14%
Grand Total 115 1890 1360 72% 529 63 12%
Figure 2
Percent of K-8 NC Schools Trained in SPARK™
0%
10%
20%
30%
40%
50%
60%
70%
80%
90%
100%
HWTF LEAs(2007-08)
KBR Year 1LEAs
(2008-09)
KBR Year 2LEAs
(2009-10)
KBR Year 3LEAs
(Fall 2010)
Page 15
2010 NCAAHPERD/NC DPH IsPOD Evaluation
All rights reserved.
15
IMPLEMENTATION
NC Physical Education Teachers Implementing SPARK™
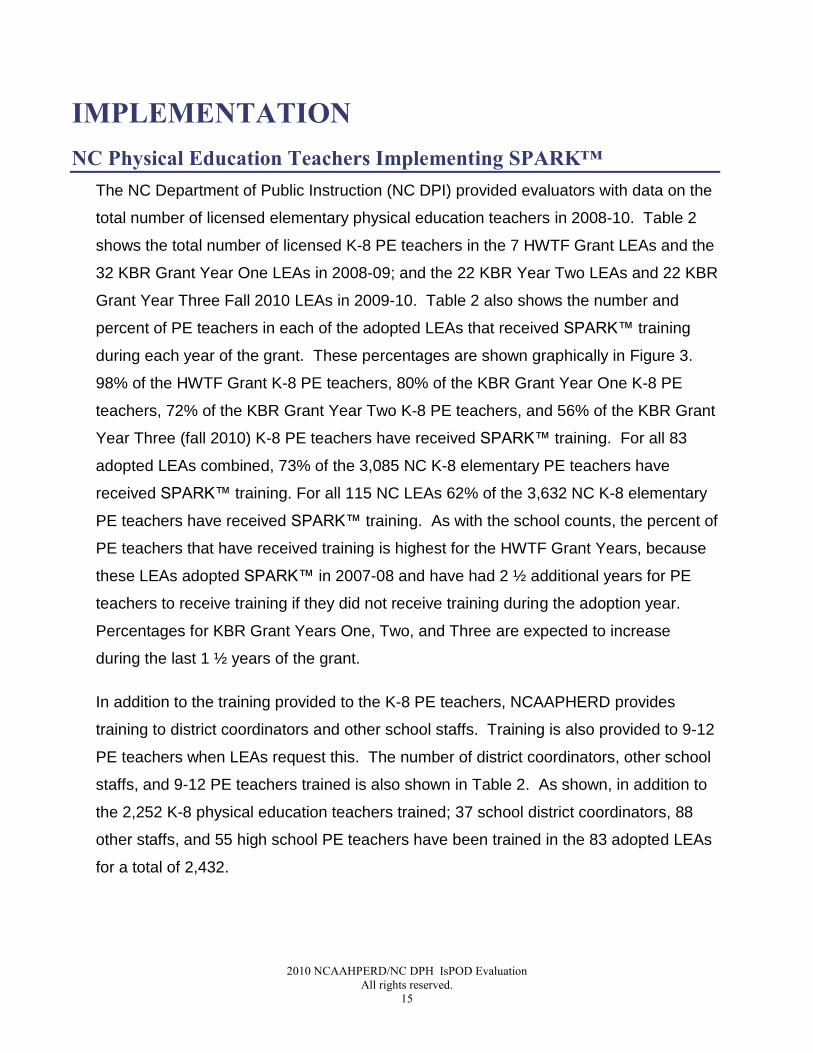
The NC Department of Public Instruction (NC DPI) provided evaluators with data on the
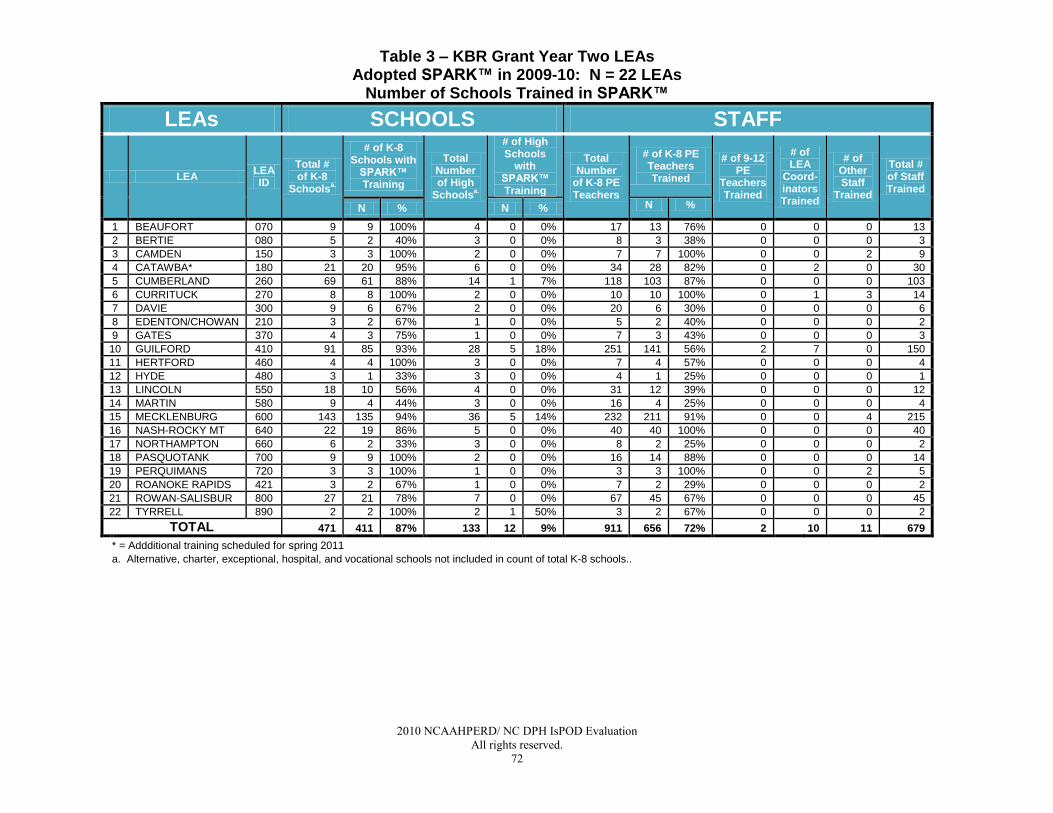
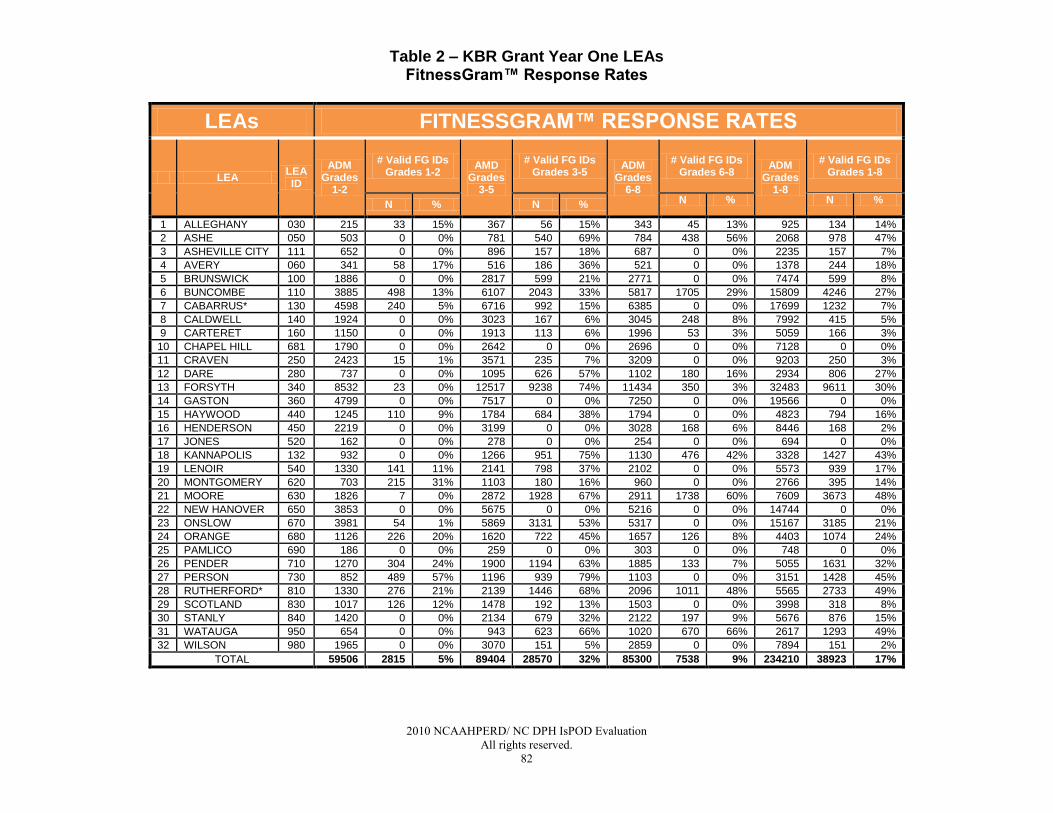
total number of licensed elementary physical education teachers in 2008-10. Table 2
shows the total number of licensed K-8 PE teachers in the 7 HWTF Grant LEAs and the
32 KBR Grant Year One LEAs in 2008-09; and the 22 KBR Year Two LEAs and 22 KBR
Grant Year Three Fall 2010 LEAs in 2009-10. Table 2 also shows the number and
percent of PE teachers in each of the adopted LEAs that received SPARK™ training
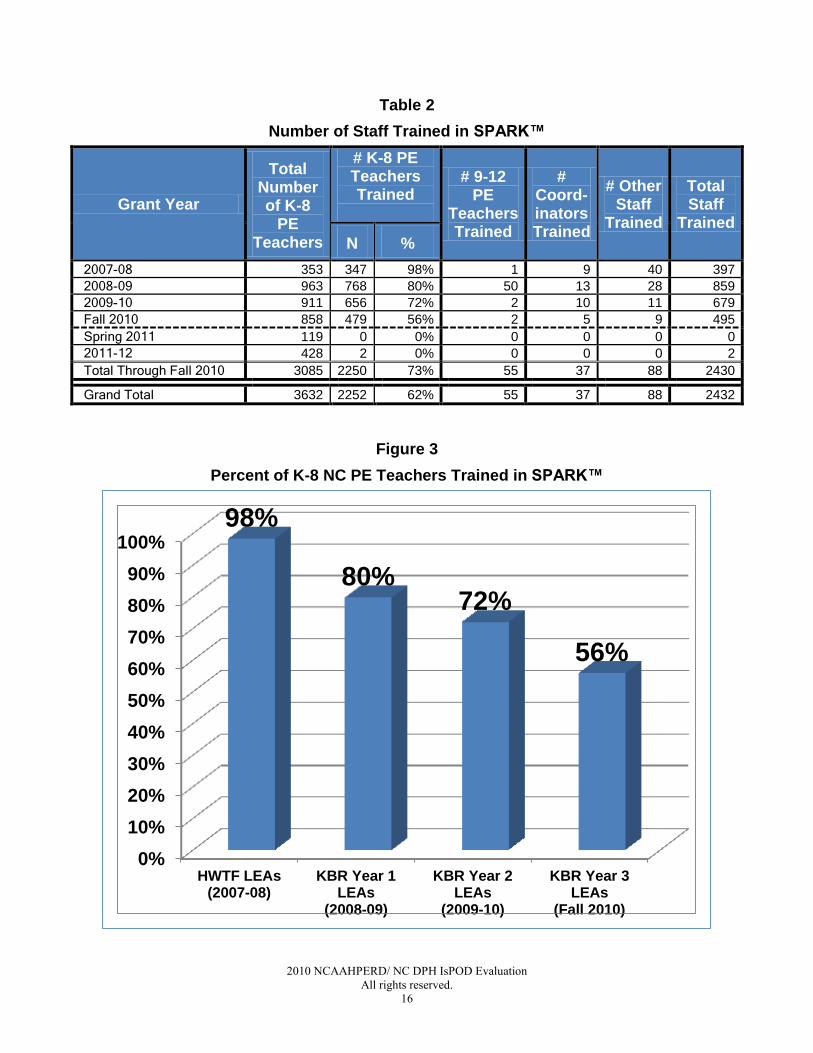
during each year of the grant. These percentages are shown graphically in Figure 3.
98% of the HWTF Grant K-8 PE teachers, 80% of the KBR Grant Year One K-8 PE
teachers, 72% of the KBR Grant Year Two K-8 PE teachers, and 56% of the KBR Grant
Year Three (fall 2010) K-8 PE teachers have received SPARK™ training. For all 83
adopted LEAs combined, 73% of the 3,085 NC K-8 elementary PE teachers have
received SPARK™ training. For all 115 NC LEAs 62% of the 3,632 NC K-8 elementary
PE teachers have received SPARK™ training. As with the school counts, the percent of
PE teachers that have received training is highest for the HWTF Grant Years, because
these LEAs adopted SPARK™ in 2007-08 and have had 2 ½ additional years for PE
teachers to receive training if they did not receive training during the adoption year.
Percentages for KBR Grant Years One, Two, and Three are expected to increase
during the last 1 ½ years of the grant.
In addition to the training provided to the K-8 PE teachers, NCAAPHERD provides
training to district coordinators and other school staffs. Training is also provided to 9-12
PE teachers when LEAs request this. The number of district coordinators, other school
staffs, and 9-12 PE teachers trained is also shown in Table 2. As shown, in addition to
the 2,252 K-8 physical education teachers trained; 37 school district coordinators, 88
other staffs, and 55 high school PE teachers have been trained in the 83 adopted LEAs
for a total of 2,432.
Page 16
2010 NCAAHPERD/ NC DPH IsPOD Evaluation
All rights reserved.
16
Table 2
Number of Staff Trained in SPARK™
Grant Year
Total Number of K-8
PE Teachers
# K-8 PE Teachers Trained
# 9-12 PE
Teachers Trained
# Coord-inators Trained
# Other Staff
Trained
Total Staff
Trained
N %
2007-08 353 347 98% 1 9 40 397
2008-09 963 768 80% 50 13 28 859
2009-10 911 656 72% 2 10 11 679
Fall 2010 858 479 56% 2 5 9 495
Spring 2011 119 0 0% 0 0 0 0
2011-12 428 2 0% 0 0 0 2
Total Through Fall 2010 3085 2250 73% 55 37 88 2430
Grand Total 3632 2252 62% 55 37 88 2432
Figure 3
Percent of K-8 NC PE Teachers Trained in SPARK™
0%
10%
20%
30%
40%
50%
60%
70%
80%
90%
100%
HWTF LEAs(2007-08)
KBR Year 1LEAs
(2008-09)
KBR Year 2LEAs
(2009-10)
KBR Year 3LEAs
(Fall 2010)
98%
80% 72%
56%
Page 17
2010 NCAAHPERD/NC DPH IsPOD Evaluation
All rights reserved.
17
REACH
NC K-8 Students “Reached” by SPARK™
Student ―Reach‖ is the number and percent elementary students receiving the benefits
of the SPARK™ philosophy and curriculum in their PE classes. Since not every student
responded to the student surveys, lower and upper bounds for student ―reach‖ are being
estimated.
The upper bound for student ―reach‖ was estimated by assuming that every PE teacher
that received SPARK™ training is implementing the SPARK™ philosophy and/or
curriculum in the PE classes s/he teaches. This was determined by calculating the
Average Daily Membership (ADM) for each SPARK™ trained elementary school in a
district and dividing this by the ADM for all the elementary schools in the district. ADM
data was downloaded from the NC DPI website
http://www.ncpublicschools.org/fbs/accounting/data/.
The lower bound for student ―reach‖ was estimated by tabulating the total number of
valid FitnessGram™ Student IDs for every elementary school in a district and dividing
this by the ADM for all the elementary schools in the district. The assumption for the
lower bound estimates is that teachers that entered FitnessGram™ data for their
students are, in fact, also implementing the SPARK™ curriculum and/or philosophy.
Teacher survey results indicate that, for the most part, teachers that are using
FitnessGram™ are also using the SPARK™ curriculum and/or philosophy.
―Reach‖ estimates were determined for the first two years of the KBR Grant using ADM
and FitnessGram™ results from spring 2010. New ―reach‖ estimates for KBR Grant
Year Three, which should improve substantially, will be determined when the fall 2010
FitnessGram™ data is available. As the response rates from the teacher and student
surveys increases, estimates of student ―reach‖ can also be further substantiated.
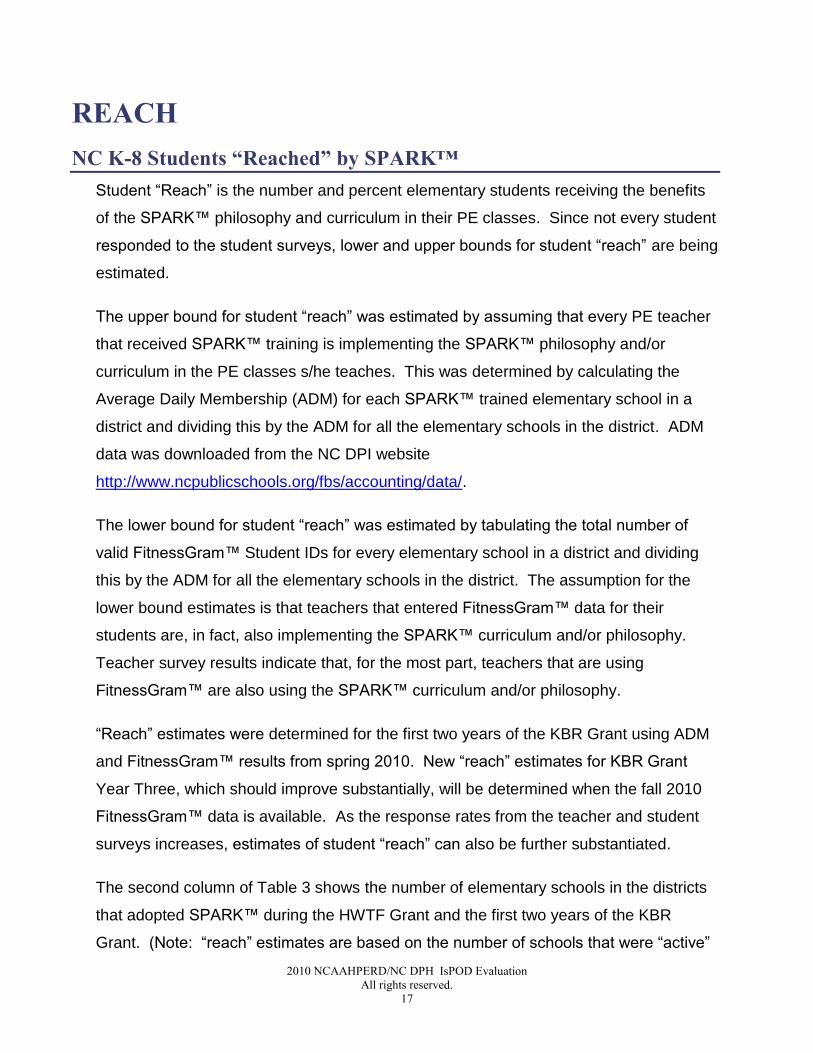
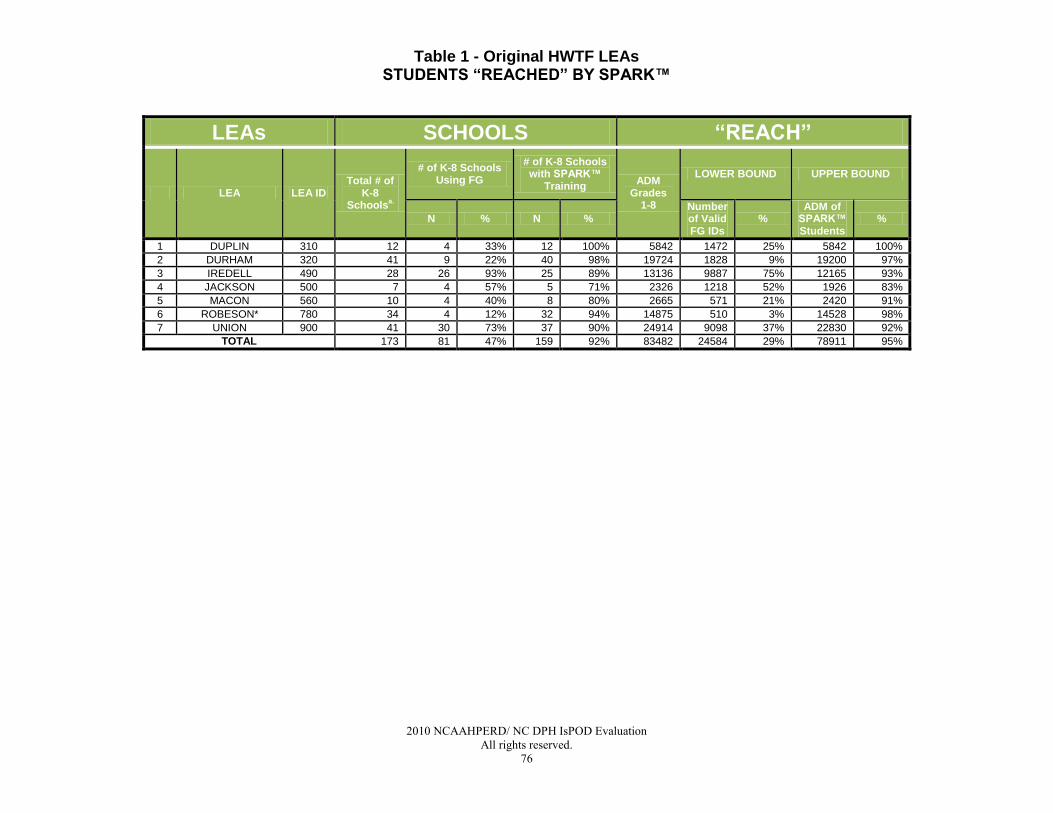
The second column of Table 3 shows the number of elementary schools in the districts
that adopted SPARK™ during the HWTF Grant and the first two years of the KBR
Grant. (Note: ―reach‖ estimates are based on the number of schools that were ―active‖
Page 18
2010 NCAAHPERD/ NC DPH IsPOD Evaluation
All rights reserved.
18
during the given grant year). The next columns show the number and percent of
elementary schools in those districts that submitted FitnessGram™ results and that
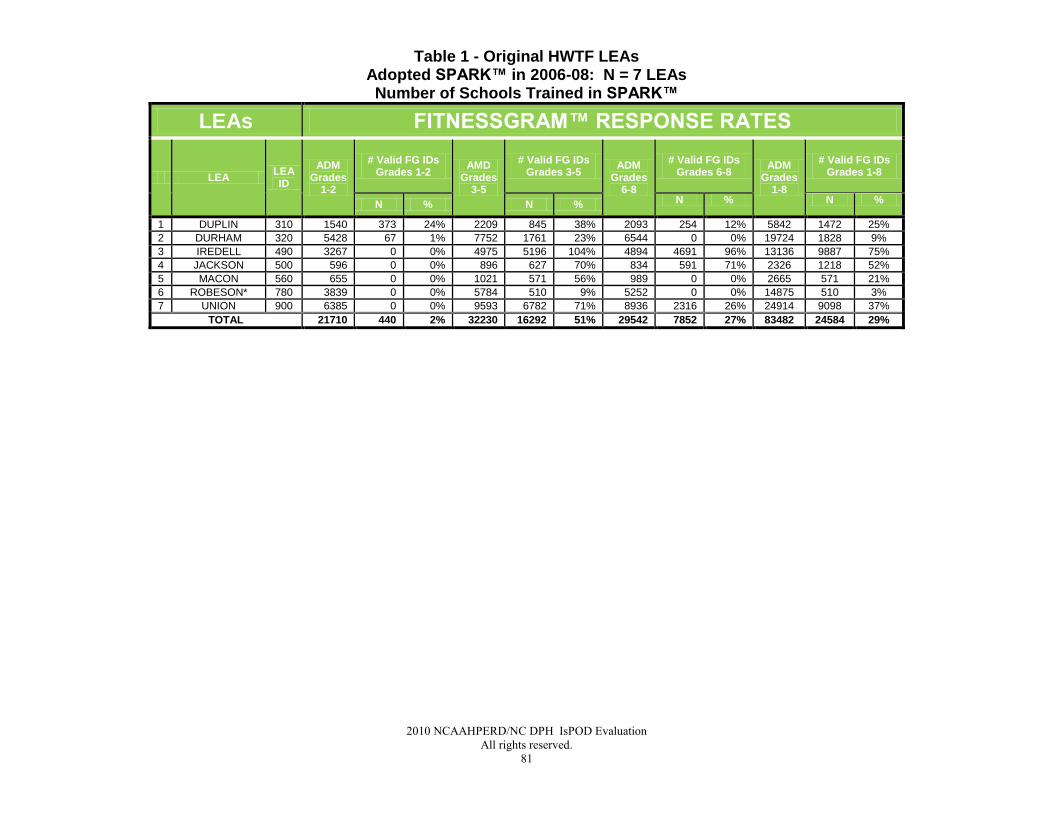
received the SPARK™ training. From fall 2007 to spring 2010, 82% of all elementary
schools in the SPARK™-adopted LEAs received SPARK™ training, whereas only 32%
of all elementary schools in those LEAs submitted FitnessGram™ results in spring
2010. Thus, although a large percentage of schools received the SPARK™ training
final FitnessGram™ results were only received for about a third of the schools. This is
due largely to the challenges encountered in rolling out the FitnessGram™ software that
were encountered in 2009-10 that are detailed in the ―Challenges/Recommendations‖
section. Furthermore, student ―reach‖ estimates based on FitnessGram™ results for
grades K-2 will be skewed low since K-2 teachers are encouraged, but not required to
submit FitnessGram™ measures for K-2 students.
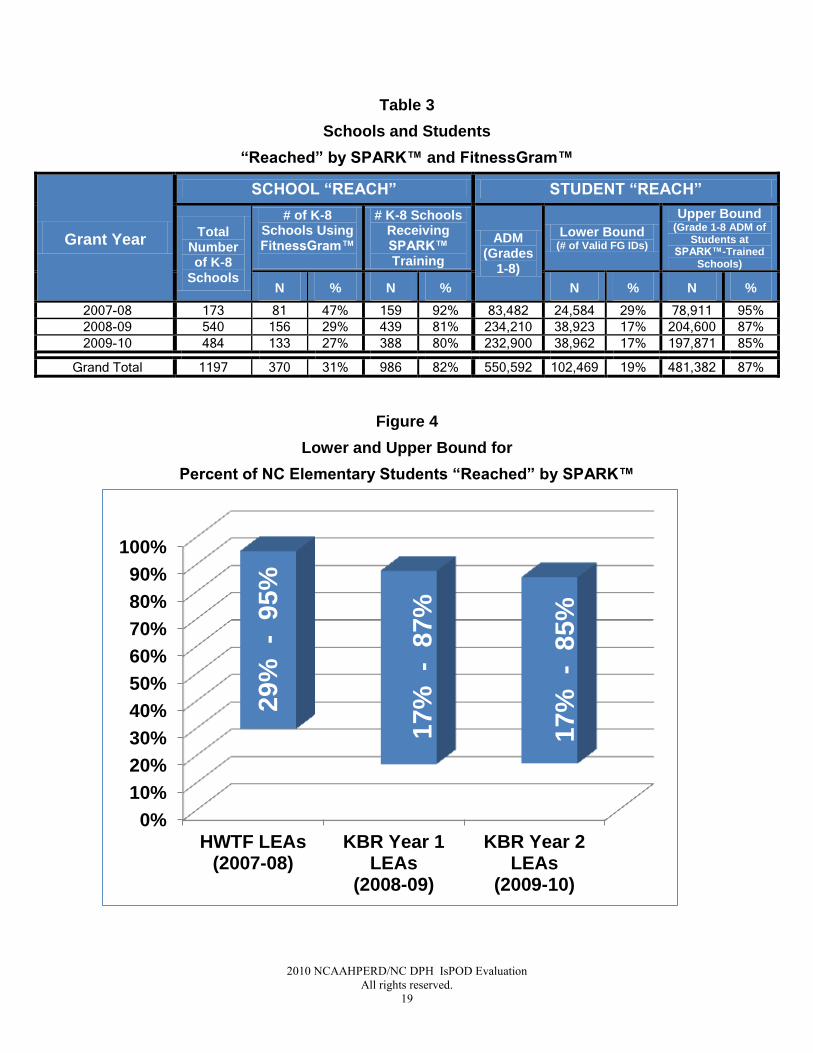
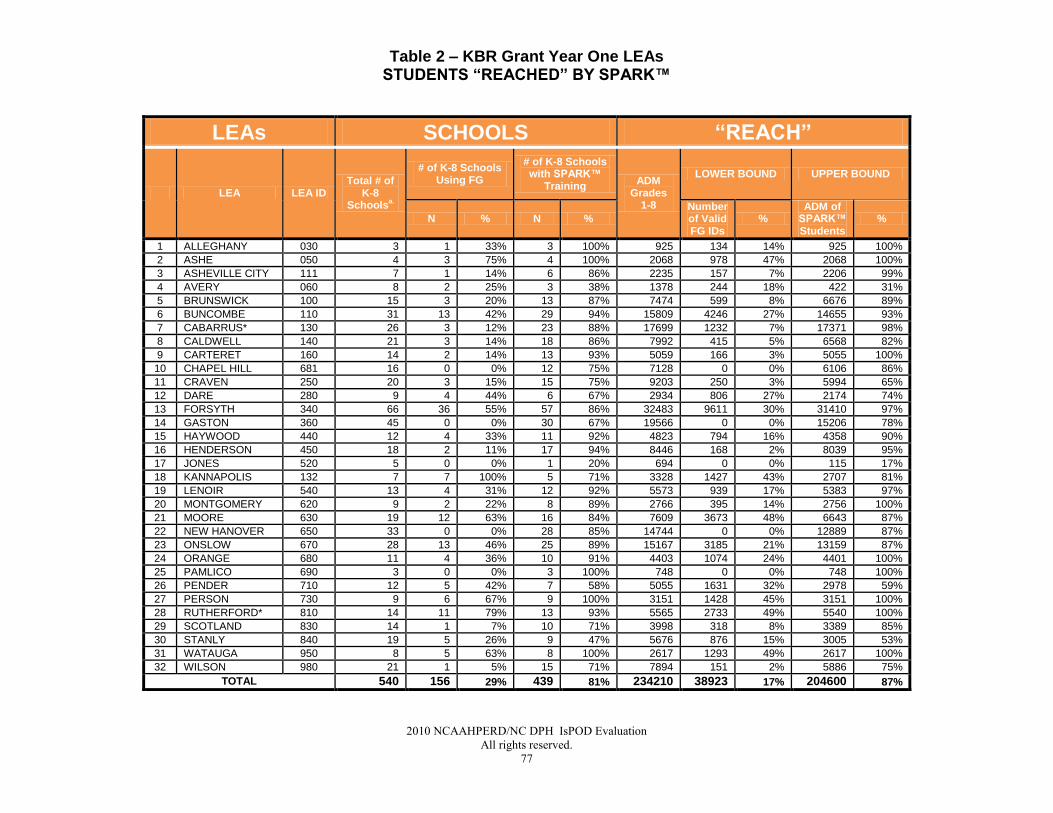
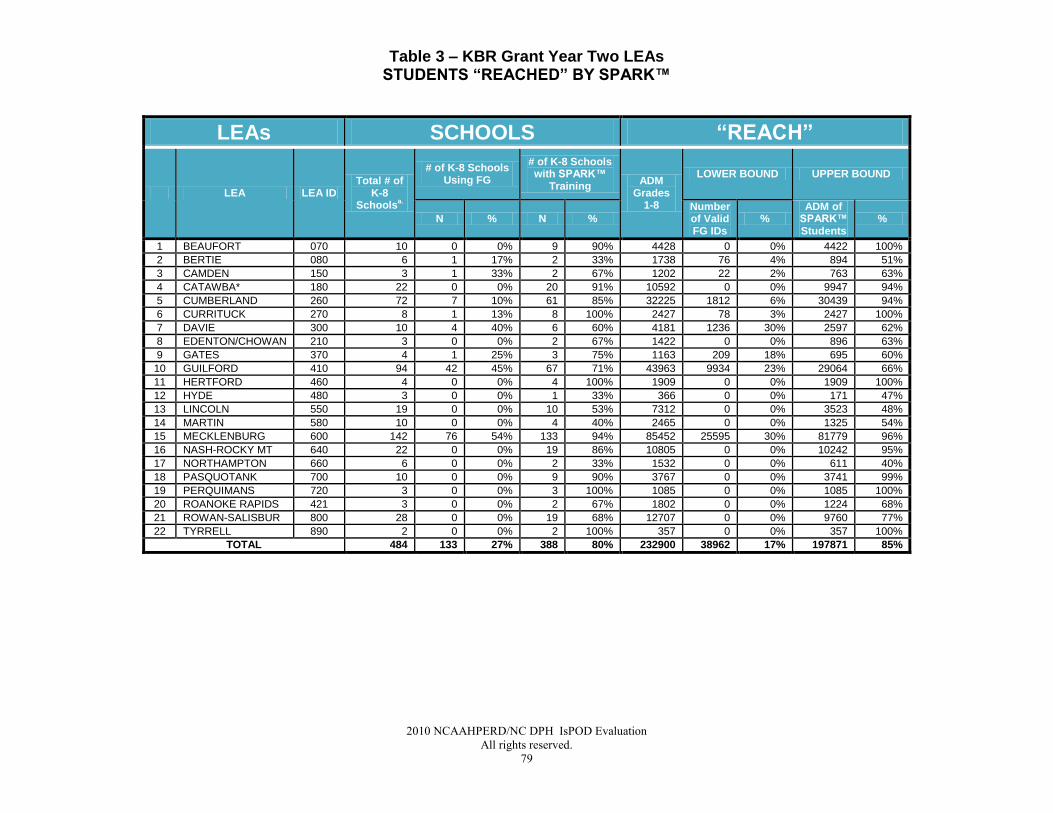
The last 4 columns of Table 3 show the estimated ―reach‖ of SPARK™ in spring 2010
based on the number of schools that received SPARK™ training and the number of
valid FitnessGram™ student IDs. Assuming all SPARK™ trained schools are
implementing SPARK™, as many as 87% of the elementary students in the 61 LEAs
that were SPARK™ trained as of spring 2010 are being ―reached‖ by SPARK™. Using
the valid number of FitnessGram™ student IDs as a lower bound, as few as 19% of
elementary students have been ―reached‖ by SPARK™ as of spring 2010. These upper
and lower bounds for student ―reach‖ are shown in Figure 4. Student ―reach‖ estimates
are shown by district in the Appendix D tables.
Page 19
2010 NCAAHPERD/NC DPH IsPOD Evaluation
All rights reserved.
19
Table 3
Schools and Students
“Reached” by SPARK™ and FitnessGram™
Grant Year
SCHOOL “REACH” STUDENT “REACH”
Total Number of K-8
Schools
# of K-8 Schools Using FitnessGram™
# K-8 Schools Receiving SPARK™ Training
ADM (Grades
1-8)
Lower Bound (# of Valid FG IDs)
Upper Bound (Grade 1-8 ADM of
Students at SPARK™-Trained
Schools)
N % N % N % N %
2007-08 173 81 47% 159 92% 83,482 24,584 29% 78,911 95%
2008-09 540 156 29% 439 81% 234,210 38,923 17% 204,600 87%
2009-10 484 133 27% 388 80% 232,900 38,962 17% 197,871 85%
Grand Total 1197 370 31% 986 82% 550,592 102,469 19% 481,382 87%
Figure 4
Lower and Upper Bound for
Percent of NC Elementary Students “Reached” by SPARK™
0%
10%
20%
30%
40%
50%
60%
70%
80%
90%
100%
HWTF LEAs(2007-08)
KBR Year 1LEAs
(2008-09)
KBR Year 2LEAs
(2009-10)
29
%
- 9
5%
17%
-
87
%
17
%
- 8
5%
Page 20
2010 NCAAHPERD/ NC DPH IsPOD Evaluation
All rights reserved.
20
Analysis of FitnessGram™ results for spring 2010 show that FitnessGram™, and
presumably SPARK™, is being implemented at a much higher rate for elementary
grades 3 to 5, compared 6 to 8. As stated previously, although PE teachers for grades
K-2 are encouraged to submit FitnessGram™ results for their students, this is not a
requirement of the IsPOD program.
Table 4 shows the FitnessGram™ Response rates in spring 2010 for the 61 LEAs that
had adopted SPARK™. Total percents for each of the grade groups are shown
graphically in Figure 5. Whereas grades 3 to 5 have a FitnessGram™ response rate of
35%, the response rate for grades 6 to 8 was only19% (and the response rate for
grades 1-2 was only 4%). Presumably, SPARK™ is being implemented at a lower rate
for these grade levels also. Questions have been included on the student and teacher
surveys for spring 2011 to further investigate why FitnessGram™ and/or SPARK™ are
being used less frequently for the lower grade levels.
Page 21
2010 NCAAHPERD/NC DPH IsPOD Evaluation
All rights reserved.
21
Table 4
FitnessGram™ Response Rates – Spring 2010
Grant Year
By Grades Levels All Grades
ADM Grades
1-2
FG Response Rate
Grades 1-2
ADM Grades
3-5
FG Response Rate
Grades 3-5
ADM Grades
6-8
FG Response Rate
Grades 6-8
ADM Grades
1-8
FG Response Rate
Grades 1-8
# FG IDs
% N % N % N %
2007-08 21,710 440 2% 32,230 16,292 51% 29,542 7,852 27% 83,482 24,584 29%
2008-09 59,506 2,815 5% 89,404 28,570 32% 85,300 7,538 9% 234,210 38,923 17%
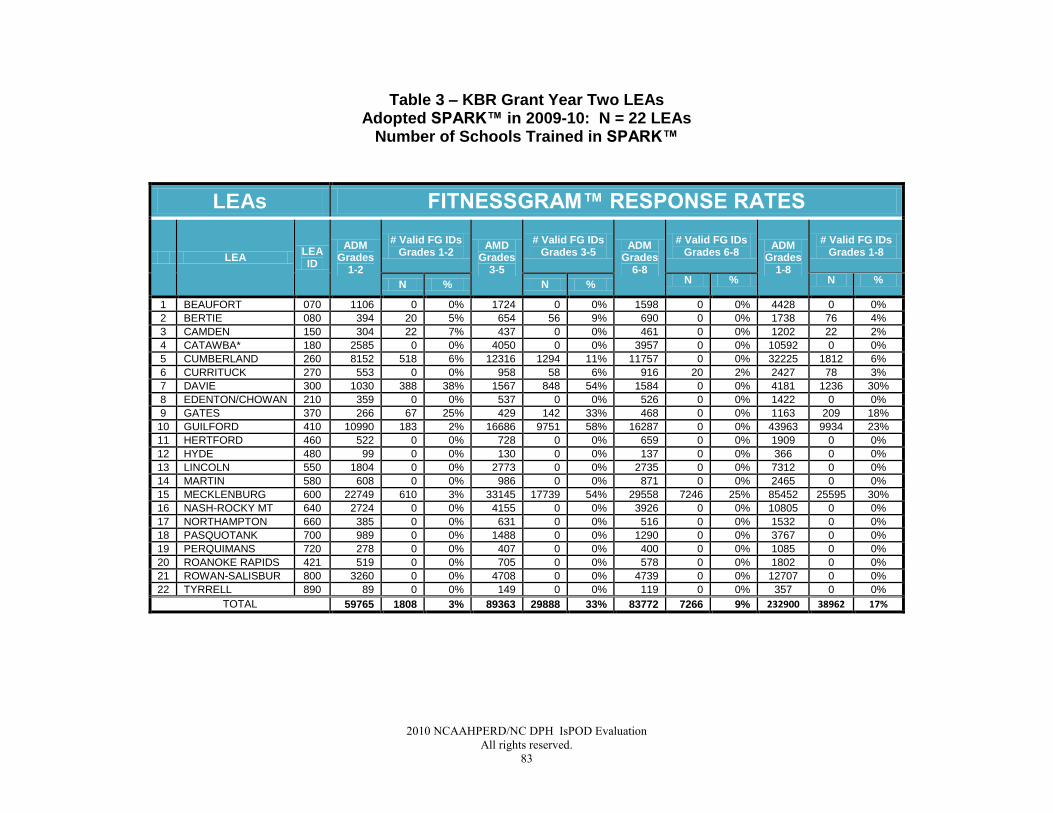
2009-10 59,765 1,808 3% 89,363 29,888 33% 83,772 7,266 9% 232,900 38,962 17%
Grand Total
140,981 5,063 4% 210,997 74,750 35% 198,614 22,656 11% 550,592 102,469 19%
Figure 5
FitnessGram™ Response Rates – Spring 2010
0%
5%
10%
15%
20%
25%
30%
35%
40%
45%
50%
Grades 1-2 Grades 3-5 Grades 6-8
Page 22
2010 NCAAHPERD/ NC DPH IsPOD Evaluation
All rights reserved.
22
OUTCOMES Summaries and analysis of the spring 2010 survey data and FitnessGram™ results are
presented in this section.
Survey Results
Teacher Surveys
In spring 2010, 300 teachers from 44 NC school districts responded to the online IsPOD
teacher survey. Of the teacher survey respondents 52% taught students in grades K-2,
32% taught grades 3 to 5, and 14% taught grades 6 to 8.
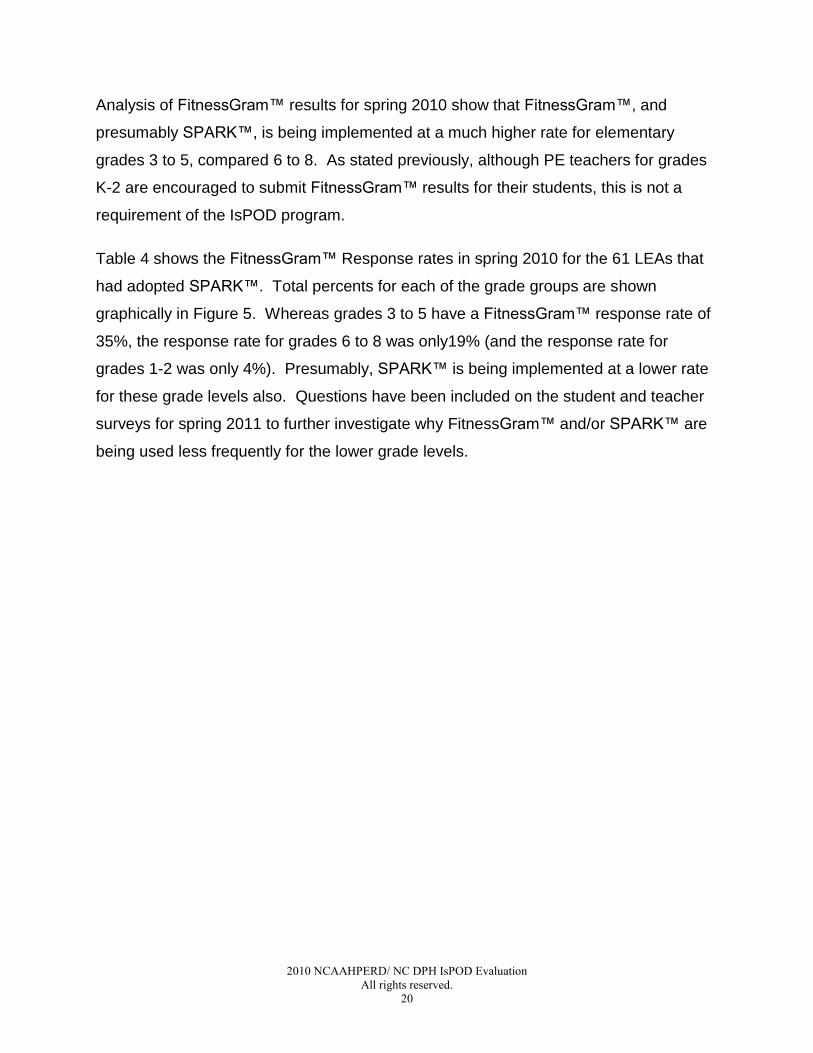
Teachers indicated that middle school students received PE more days per week on
average than lower elementary school students, with 81% responding that their 6th-8th
graders had PE 3 or more days per week, whereas only 16% of their K-5th graders had
PE 3 or more days per week. Lower elementary PE teachers, however, reported that
they used the SPARK™ curriculum more often, with about two-thirds of K-5th grade
teachers stating they use the SPARK™ curriculum more than half the time in their PE
classes, whereas only about 36% of the 6th-8th grade PE teachers stated they use the
SPARK™ curriculum more than half the time in their PE classes.
Although middle school PE teachers tended to state they used the SPARK™
curriculum less often than lower elementary PE teachers, PE teachers in middle school
and grades 3rd-5th were more likely to state they submit FitnessGram™ reports on more
than half their students. Whereas, only 35% of K-2nd grade teachers stated they submit
FitnessGram™ reports on more than half their students, over 90% of 3rd-8th grade
teachers stated they submit FitnessGram™ reports on more than half their students.
These results are shown in Table 5.
Page 23
2010 NCAAHPERD/NC DPH IsPOD Evaluation
All rights reserved.
23
Table 5
Teacher Survey Results – Spring 2010
Grades Total
Teach PE 3 or more
Days/Week
Total
Use SPARK™ Curriculum
More than 50% of Time
Total
Submit FitnessGram™
Reports on More than 50%
of their Students
# % # % N %
K – 2nd
638 99 16% 627 418 67% 389 138 35%
3rd
– 5th 414 68 16% 621 396 64% 606 568 94%
6th – 8
th 170 137 81% 87 31 36% 244 223 91%
Total 1222 304 25% 1335 845 63% 1239 929 75%
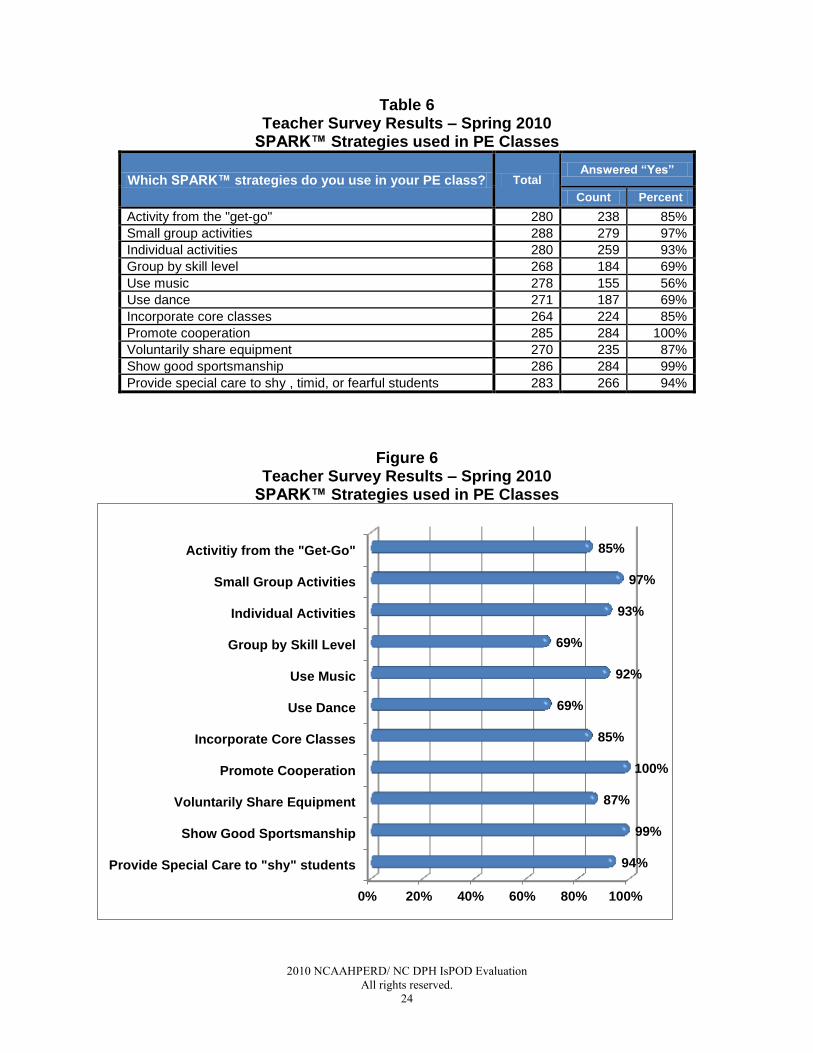
Although the percentage of time PE teachers use the SPARK™ curriculum varied
somewhat by grade level, most of the teachers for all grade levels appear to be
embracing the SPARK™ philosophy. SPARK™ has an inclusive philosophy that
encourages student activity from the ―get-go‖ for all students. More than 85% of the
teachers indicated that they incorporate the following SPARK™ strategies into their PE
classes: activity from the ―get-go; incorporating core classes; voluntarily sharing
equipment; individual and small group activities; providing special care to shy, timid, or
fearful students; encouraging good sportsmanship and cooperation. Most teachers
(69%) indicated that they use dance and group by skill levels in their PE classes, and
56% indicated that they use music. These results are summarized in Table 6 and
Figure 6.
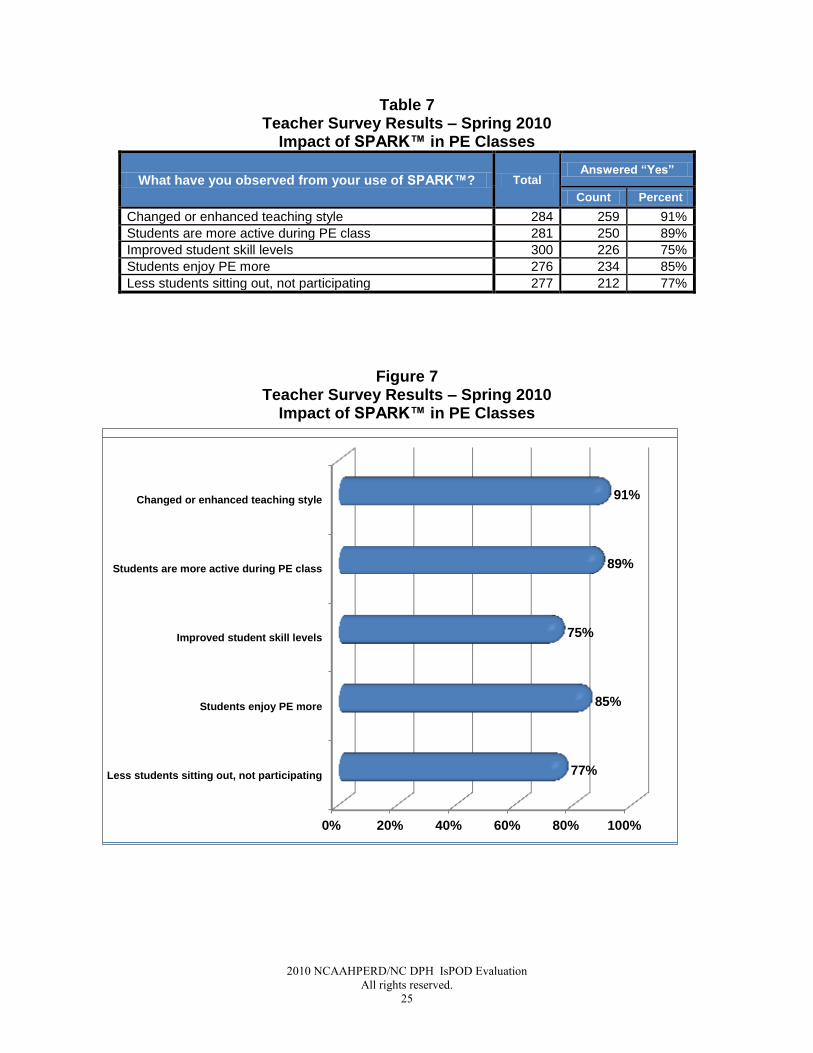
As a result of using SPARK™ in their PE classes 75% or more of the teachers indicated
that they have observed a number of positive benefits such as improved student skill
levels, less students sitting out and not participating in PE, students being more active
during PE and enjoying PE more. In addition, 91% of the teachers felt that the
SPARK™ program had enhanced their teaching style. These outcomes are
summarized in Table 7 and Figure 7.
Page 24
2010 NCAAHPERD/ NC DPH IsPOD Evaluation
All rights reserved.
24
Table 6 Teacher Survey Results – Spring 2010
SPARK™ Strategies used in PE Classes
Which SPARK™ strategies do you use in your PE class? Total Answered “Yes”
Count Percent
Activity from the "get-go" 280 238 85%
Small group activities 288 279 97%
Individual activities 280 259 93%
Group by skill level 268 184 69%
Use music 278 155 56%
Use dance 271 187 69%
Incorporate core classes 264 224 85%
Promote cooperation 285 284 100%
Voluntarily share equipment 270 235 87%
Show good sportsmanship 286 284 99%
Provide special care to shy , timid, or fearful students 283 266 94%
Figure 6 Teacher Survey Results – Spring 2010
SPARK™ Strategies used in PE Classes
0% 20% 40% 60% 80% 100%
Provide Special Care to "shy" students
Show Good Sportsmanship
Voluntarily Share Equipment
Promote Cooperation
Incorporate Core Classes
Use Dance
Use Music
Group by Skill Level
Individual Activities
Small Group Activities
Activitiy from the "Get-Go"
94%
99%
87%
100%
85%
69%
92%
69%
93%
97%
85%
Page 25
2010 NCAAHPERD/NC DPH IsPOD Evaluation
All rights reserved.
25
Table 7 Teacher Survey Results – Spring 2010
Impact of SPARK™ in PE Classes
What have you observed from your use of SPARK™? Total Answered “Yes”
Count Percent
Changed or enhanced teaching style 284 259 91%
Students are more active during PE class 281 250 89%
Improved student skill levels 300 226 75%
Students enjoy PE more 276 234 85%
Less students sitting out, not participating 277 212 77%
Figure 7 Teacher Survey Results – Spring 2010
Impact of SPARK™ in PE Classes
0% 20% 40% 60% 80% 100%
Less students sitting out, not participating
Students enjoy PE more
Improved student skill levels
Students are more active during PE class
Changed or enhanced teaching style
77%
85%
75%
89%
91%
Page 26
2010 NCAAHPERD/ NC DPH IsPOD Evaluation
All rights reserved.
26
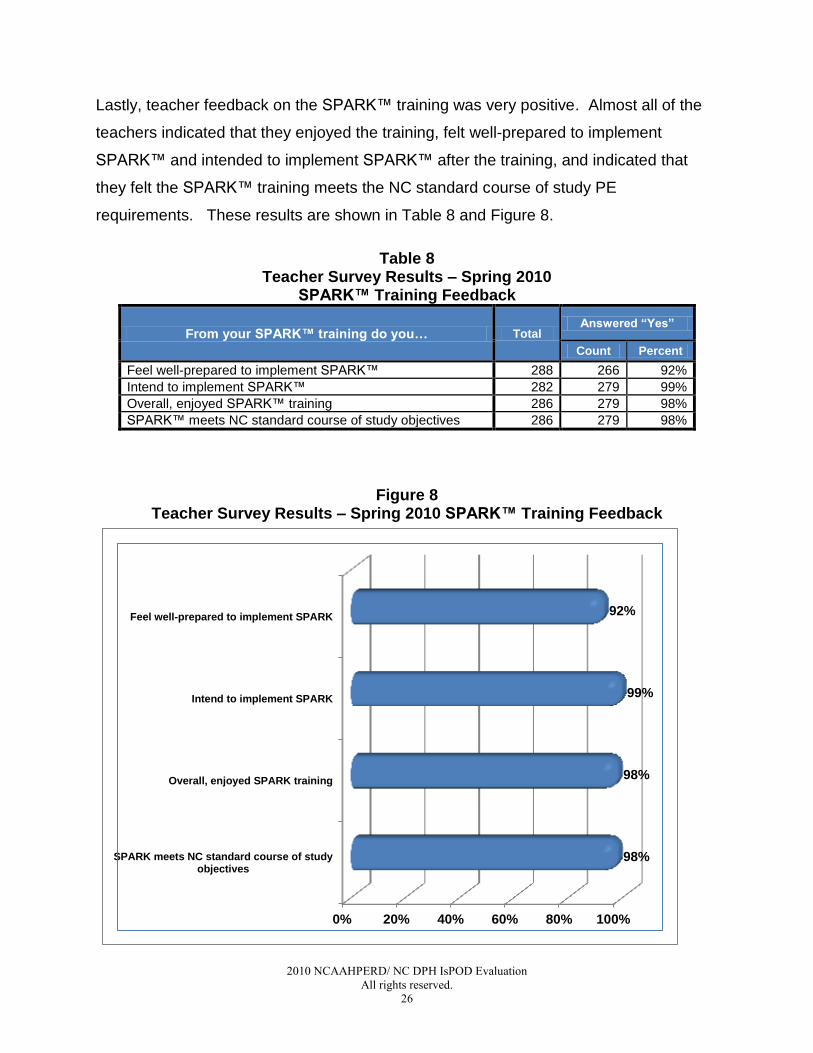
Lastly, teacher feedback on the SPARK™ training was very positive. Almost all of the
teachers indicated that they enjoyed the training, felt well-prepared to implement
SPARK™ and intended to implement SPARK™ after the training, and indicated that
they felt the SPARK™ training meets the NC standard course of study PE
requirements. These results are shown in Table 8 and Figure 8.
Table 8 Teacher Survey Results – Spring 2010
SPARK™ Training Feedback
From your SPARK™ training do you… Total Answered “Yes”
Count Percent
Feel well-prepared to implement SPARK™ 288 266 92%
Intend to implement SPARK™ 282 279 99%
Overall, enjoyed SPARK™ training 286 279 98%
SPARK™ meets NC standard course of study objectives 286 279 98%
Figure 8 Teacher Survey Results – Spring 2010 SPARK™ Training Feedback
0% 20% 40% 60% 80% 100%
SPARK meets NC standard course of studyobjectives
Overall, enjoyed SPARK training
Intend to implement SPARK
Feel well-prepared to implement SPARK
98%
98%
99%
92%
Page 27
2010 NCAAHPERD/NC DPH IsPOD Evaluation
All rights reserved.
27
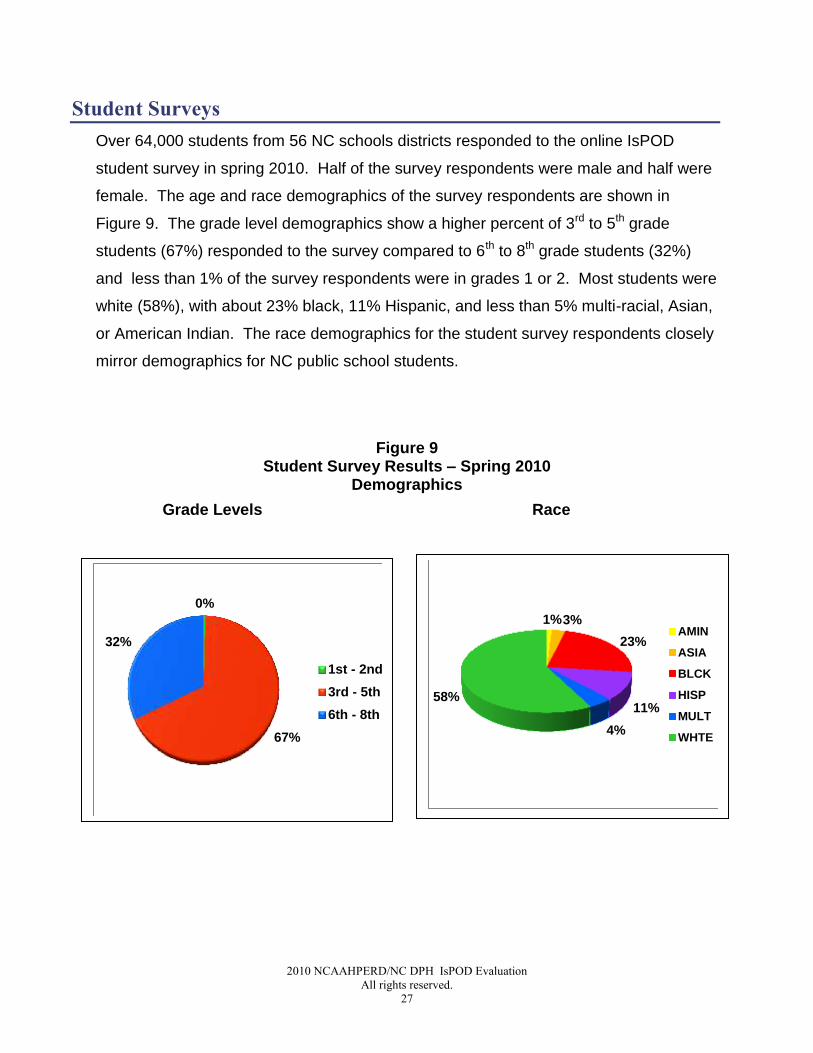
Student Surveys
Over 64,000 students from 56 NC schools districts responded to the online IsPOD
student survey in spring 2010. Half of the survey respondents were male and half were
female. The age and race demographics of the survey respondents are shown in
Figure 9. The grade level demographics show a higher percent of 3rd to 5th grade
students (67%) responded to the survey compared to 6th to 8th grade students (32%)
and less than 1% of the survey respondents were in grades 1 or 2. Most students were
white (58%), with about 23% black, 11% Hispanic, and less than 5% multi-racial, Asian,
or American Indian. The race demographics for the student survey respondents closely
mirror demographics for NC public school students.
Figure 9 Student Survey Results – Spring 2010
Demographics
Grade Levels Race
0%
67%
32%
1st - 2nd
3rd - 5th
6th - 8th
1% 3%
23%
11%
4%
58%
AMIN
ASIA
BLCK
HISP
MULT
WHTE
Page 28
2010 NCAAHPERD/ NC DPH IsPOD Evaluation
All rights reserved.
28
The IsPOD Spring 2010 Student Survey consisted of 34 questions including questions
about their PE classes (12 questions), their levels of physical activity at school and at
home (7 questions), questions about the amount of time they spend watching TV,
playing video or computer games (3 questions), questions about their eating habits (7
questions), and questions about their general health (5 questions).
Responses to student survey questions were compared to the Center for Disease
Control (CDC) health and nutrition guidelines for elementary and middle school
students. Student survey results show a large percentage of students are not meeting
CDC health and nutrition guidelines.
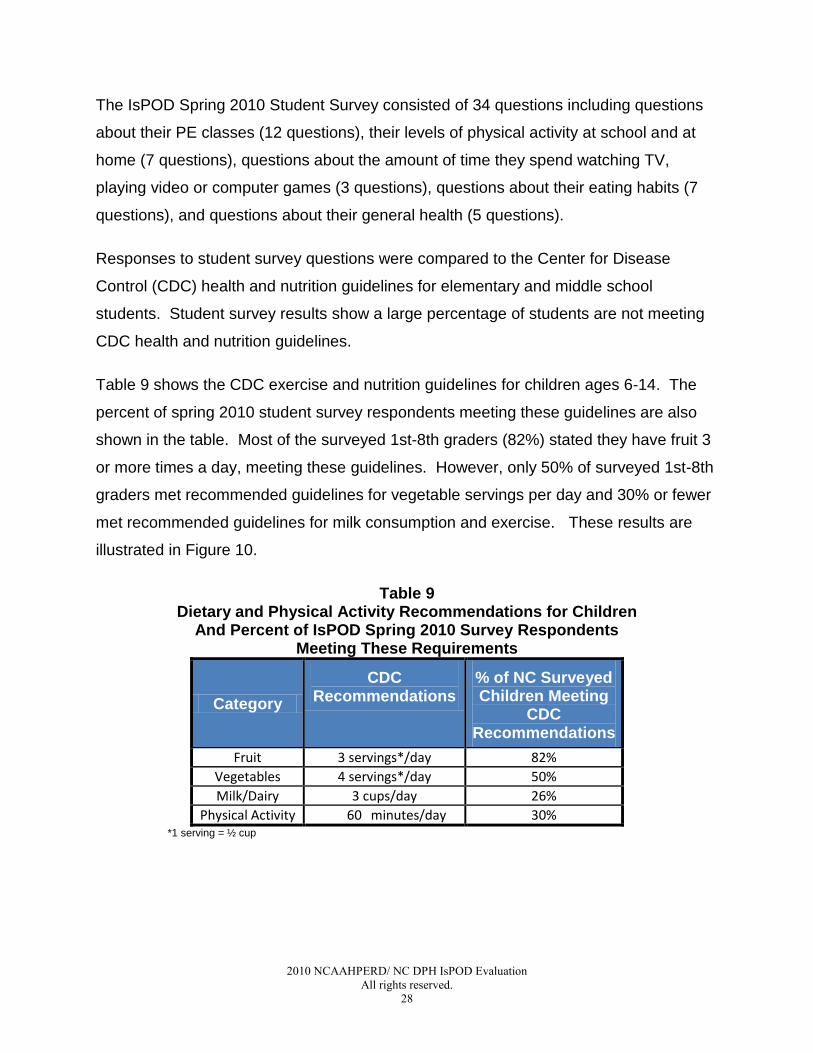
Table 9 shows the CDC exercise and nutrition guidelines for children ages 6-14. The
percent of spring 2010 student survey respondents meeting these guidelines are also
shown in the table. Most of the surveyed 1st-8th graders (82%) stated they have fruit 3
or more times a day, meeting these guidelines. However, only 50% of surveyed 1st-8th
graders met recommended guidelines for vegetable servings per day and 30% or fewer
met recommended guidelines for milk consumption and exercise. These results are
illustrated in Figure 10.
Table 9 Dietary and Physical Activity Recommendations for Children
And Percent of IsPOD Spring 2010 Survey Respondents Meeting These Requirements
Category
CDC Recommendations
% of NC Surveyed Children Meeting
CDC Recommendations
Fruit 3 servings*/day 82%
Vegetables 4 servings*/day 50%
Milk/Dairy 3 cups/day 26%
Physical Activity 60 minutes/day 30% *1 serving = ½ cup
Page 29
2010 NCAAHPERD/NC DPH IsPOD Evaluation
All rights reserved.
29
Figure 10 Dietary and Physical Activity Recommendations for Children
And Percent of IsPOD Spring 2010 Survey Respondents Meeting These Requirements
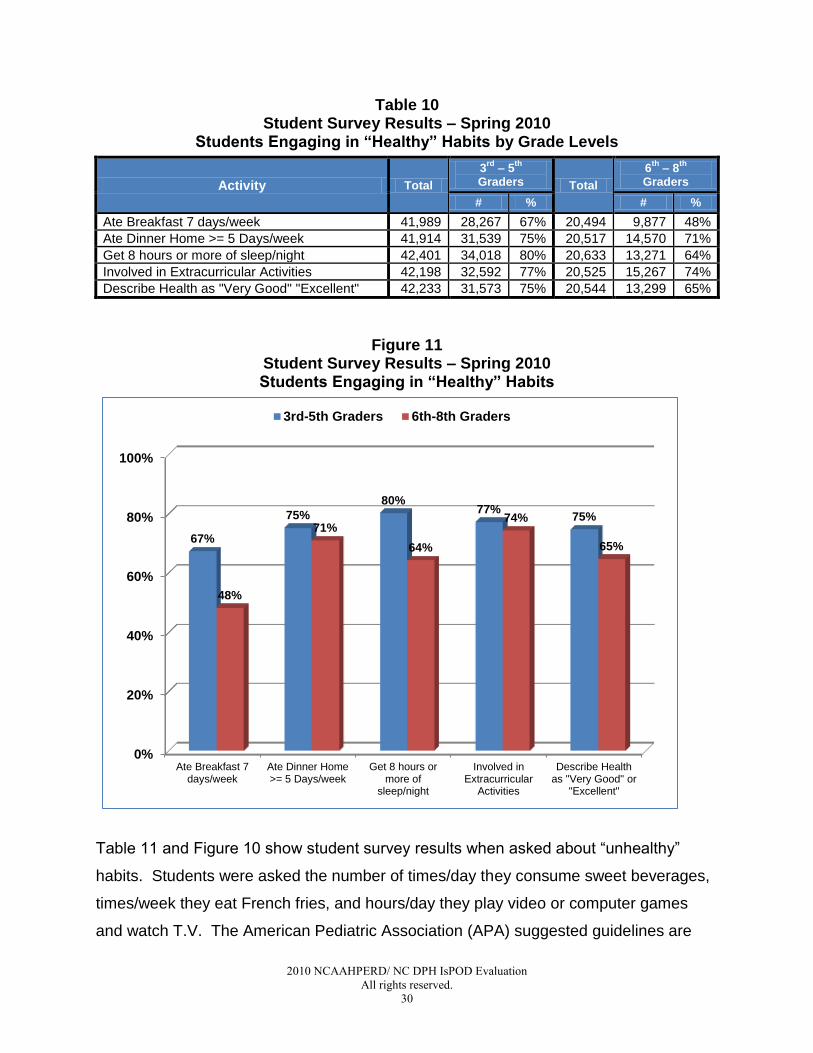
Not only are a large percentage of students not meeting CDC health and nutrition
guidelines, but students are engaging in more ―unhealthy‖ habits and fewer ―healthy‖
habits as they get older. When asked about ―healthy‖ habits such as involvement in
extra-curricular activities, eating a daily breakfast, eating dinner at home (versus eating
out), and getting sufficient sleep (8 hours per night), student survey results showed that
6th-8th graders were less likely to engage in ―healthy‖ habits compared to 3rd-5th graders.
Table 10 and Figure 9 illustrate these results. The differences in the percent of 3rd-5th
and 6th-8th engaging in ―healthy‖ habits was found to be statistically significant
(alpha=0.05) for each habit.
0% 20% 40% 60% 80% 100%
Fruit (3 or more servings/day)
Vegetables (4 or more servings/day)
Milk/Dairy (3 or more servings/day)
Physical Activity (60 minutes/day)
82%
50%
26%
30%
Page 30
2010 NCAAHPERD/ NC DPH IsPOD Evaluation
All rights reserved.
30
Table 10 Student Survey Results – Spring 2010
Students Engaging in “Healthy” Habits by Grade Levels
Activity Total
3rd
– 5th
Graders Total
6th
– 8th
Graders
# % # %
Ate Breakfast 7 days/week 41,989 28,267 67% 20,494 9,877 48%
Ate Dinner Home >= 5 Days/week 41,914 31,539 75% 20,517 14,570 71%
Get 8 hours or more of sleep/night 42,401 34,018 80% 20,633 13,271 64%
Involved in Extracurricular Activities 42,198 32,592 77% 20,525 15,267 74%
Describe Health as "Very Good" "Excellent" 42,233 31,573 75% 20,544 13,299 65%
Figure 11 Student Survey Results – Spring 2010 Students Engaging in “Healthy” Habits
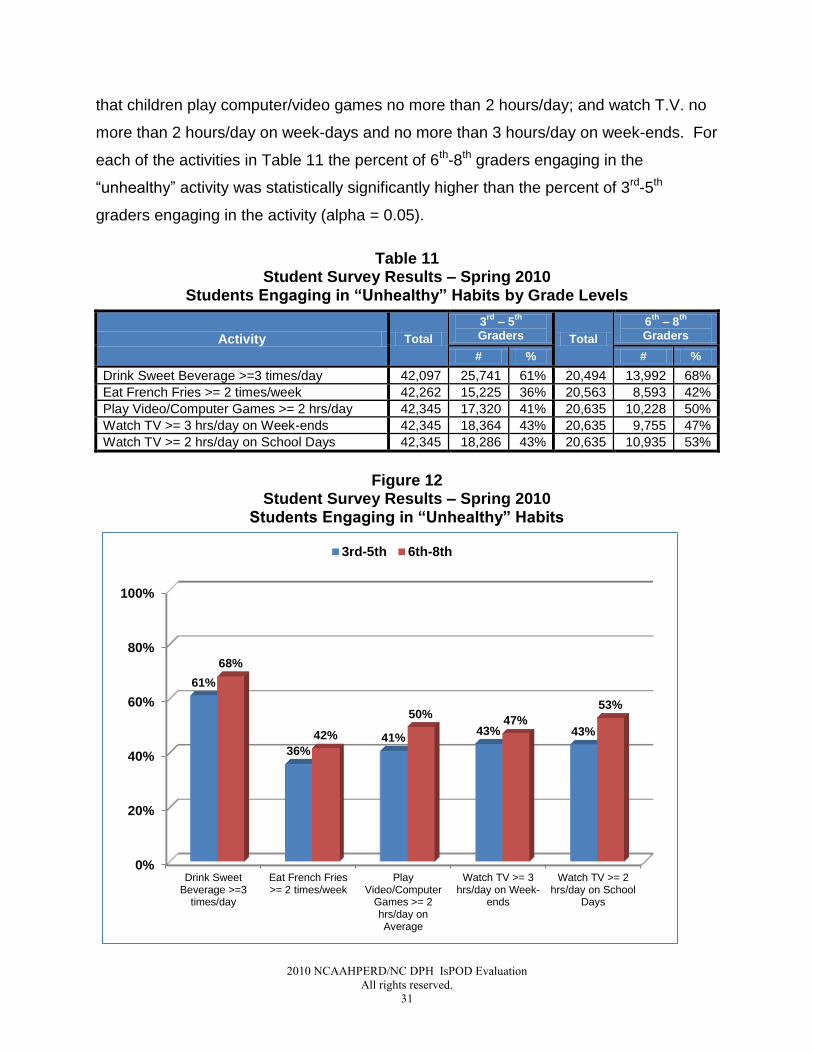
Table 11 and Figure 10 show student survey results when asked about ―unhealthy‖
habits. Students were asked the number of times/day they consume sweet beverages,
times/week they eat French fries, and hours/day they play video or computer games
and watch T.V. The American Pediatric Association (APA) suggested guidelines are
0%
20%
40%
60%
80%
100%
Ate Breakfast 7days/week
Ate Dinner Home>= 5 Days/week
Get 8 hours ormore of
sleep/night
Involved inExtracurricular
Activities
Describe Healthas "Very Good" or
"Excellent"
67%
75%
80% 77%
75%
48%
71%
64%
74%
65%
3rd-5th Graders 6th-8th Graders
Page 31
2010 NCAAHPERD/NC DPH IsPOD Evaluation
All rights reserved.
31
that children play computer/video games no more than 2 hours/day; and watch T.V. no
more than 2 hours/day on week-days and no more than 3 hours/day on week-ends. For
each of the activities in Table 11 the percent of 6th-8th graders engaging in the
―unhealthy‖ activity was statistically significantly higher than the percent of 3rd-5th
graders engaging in the activity (alpha = 0.05).
Table 11 Student Survey Results – Spring 2010
Students Engaging in “Unhealthy” Habits by Grade Levels
Activity Total
3rd
– 5th
Graders Total
6th
– 8th
Graders
# % # %
Drink Sweet Beverage >=3 times/day 42,097 25,741 61% 20,494 13,992 68%
Eat French Fries >= 2 times/week 42,262 15,225 36% 20,563 8,593 42%
Play Video/Computer Games >= 2 hrs/day 42,345 17,320 41% 20,635 10,228 50%
Watch TV >= 3 hrs/day on Week-ends 42,345 18,364 43% 20,635 9,755 47%
Watch TV >= 2 hrs/day on School Days 42,345 18,286 43% 20,635 10,935 53%
Figure 12
Student Survey Results – Spring 2010 Students Engaging in “Unhealthy” Habits
0%
20%
40%
60%
80%
100%
Drink SweetBeverage >=3
times/day
Eat French Fries>= 2 times/week
PlayVideo/Computer
Games >= 2hrs/day onAverage
Watch TV >= 3hrs/day on Week-
ends
Watch TV >= 2hrs/day on School
Days
61%
36% 41%
43% 43%
68%
42%
50% 47%
53%
3rd-5th 6th-8th
Page 32
2010 NCAAHPERD/ NC DPH IsPOD Evaluation
All rights reserved.
32
FitnessGram™ Results
In spring 2010 fitness measurements were obtained from over 82,000 North Carolina
1st – 8th grade students in 370 schools and 42 school districts. This represents 69% of
the 61 districts that had been trained in SPARK™ as of spring 2010 and 31% of all the
1195 1st - 8th grade schools in these 61 districts. Fitness results for the 6
FitnessGram™ measurements collected are presented in this section.
The researchers and developers of the FitnessGram™ Assessment Tool, The Cooper
Institute, developed new FitnessGram™ Standards in September 2010. IsPOD
evaluators are applying these new FitnessGram™ standards for all FitnessGram™ data
collected (with the exception of PACER results for which new standards were not
developed). The FitnessGram™ standards are used to determine whether students of
certain genders and ages fall into Healthy Fitness Zones (HFZ). The FitnessGram™
assessments, standards, and healthy fitness zones are discussed in this section.
Additional information can be found on the Cooper Institute’s website at
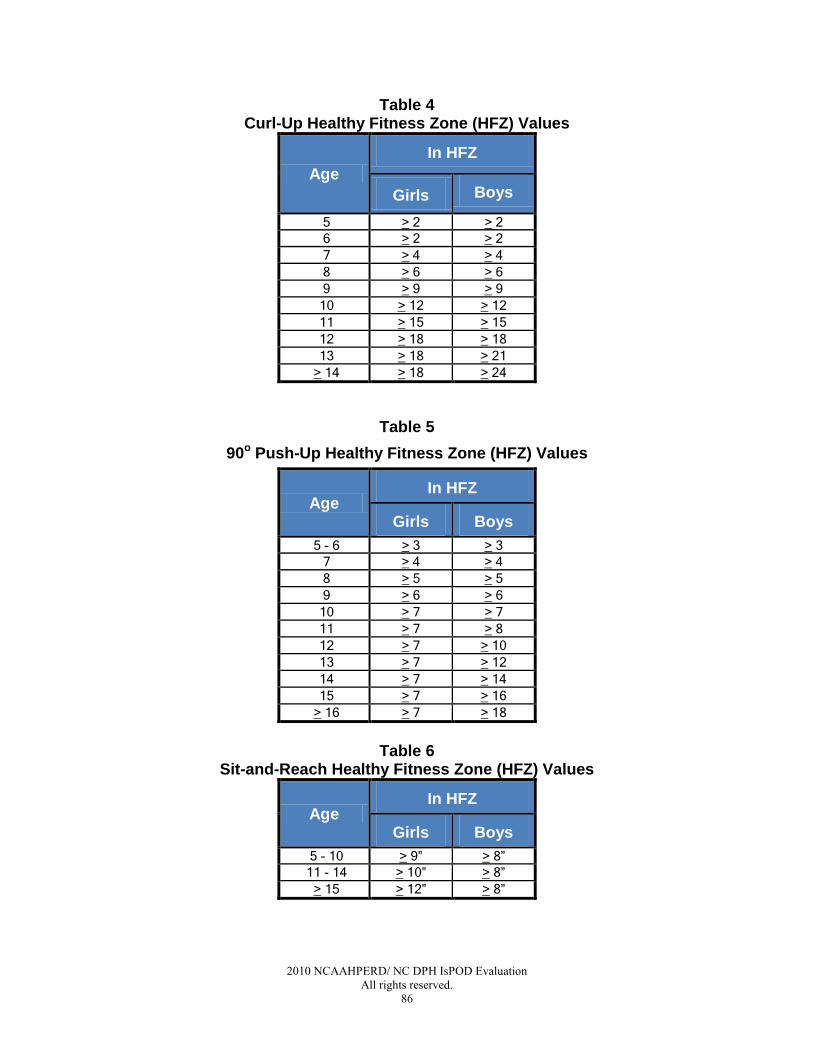
http://www.cooperinstitute.org/ourkidshealth/fitnessgram/index.cfm. Appendix F shows
the new HFZ Standards for BMI, PACER, Curl-up, Push-Up, Sit-and-Reach, and
Trunklift.
Body Composition
Spring 2010 IsPOD results from over 82,000 NC 1st-8th grade students show that as
many as 43% of North Carolina elementary and middle school students are over the
HFZ for BMI, indicating that they are at ―some risk‖ or ―high risk‖ for metabolic disorders.
Although FitnessGram™ BMI standards which are criterion-based differ from the CDC
BMI standards which are norm-based, almost all students over the FitnessGram™ BMI
HFZ are overweight or obese according to CDC guidelines. IsPOD FitnessGram™
spring 2010 results are comparable to conclusions obtained from the North Carolina
Nutrition and Physical Activity Surveillance System (NC-NPASS) 2009 report indicating
that 46% of NC 12-18 year olds may be overweight or obese. The NC-PASS report is
based on results obtained from only 6,854 12-18 year old NC children seen in NC
Page 33
2010 NCAAHPERD/NC DPH IsPOD Evaluation
All rights reserved.
33
Public Health Sponsored WIC clinics, Child Health Clinics, and some School-Based
Health Centers; whereas, the IsPOD program results are based on over 82,000
FitnessGram™ measurements collected on 1st-8th graders throughout North Carolina.
Spring 2010 IsPOD results show 55% of females and 52% of males are in the healthy
fitness zone (HFZ) for BMI (i.e., neither under- or over-weight). The percent of female
and male 1st-8th grade students over the BMI HFZ is 42% and 44%, respectively. The
percent of children over the BMI HFZ was shown to increase steadily through the
elementary school grade levels indicating that more students are at risk for metabolic
disorders as they get older. This increase was found to be statistically significant (alpha
=0.05). In addition, a slightly higher percent of males were found to be over the BMI
HFZ compared to females. These results are shown in Table 12 and Figure 13.
Page 34
2010 NCAAHPERD/ NC DPH IsPOD Evaluation
All rights reserved.
34
Table 12 Body Composition
Percent of Students Above BMI HFZ
Grade
Female Male Total
N
Percent Over-weight
N Percent Over-weight
N Percent Over-weight
1st 937 40% 884 38% 1821 39%
2nd
1175 42% 1209 40% 2384 41%
3rd
9670 40% 10075 42% 19745 41%
4th 9624 43% 10103 45% 19727 44%
5th 9396 44% 9857 46% 19253 45%
6th 3528 44% 3550 47% 7078 45%
7th 3315 41% 3149 45% 6464 43%
8th 3174 43% 3321 44% 6495 43%
Total 40819 42% 42148 44% 82967 43%
FitnessGram™ results from 370 NC 1st-8th grade schools in 42 school districts.
Figure 13
Body Composition Percent of Students Above BMI HFZ
30%
35%
40%
45%
50%
1st 2nd 3rd 4th 5th 6th 7th 8th
Pe
rce
nt
Ab
ove
HFZ
Grade
Female Male
Page 35
2010 NCAAHPERD/NC DPH IsPOD Evaluation
All rights reserved.
35
Aerobic Fitness
Aerobic or cardiovascular fitness is an important indicator of overall health. Research
indicates that good aerobic or cardiovascular health is associated with reduced risks of
obesity, diabetes, high blood pressure, coronary heart disease, some forms of cancer,
and other health problems in adults. FitnessGram™ provides three different measures
of aerobic capacity (PACER, one-mile run, and the walk test). Schools districts can
utilize all of these measures for aerobic fitness; however, the only requirement for the
IsPOD program is PACER. PACER (Progressive Aerobic Cardiovascular Endurance
Run) is a multi-stage fitness test that progresses in intensity. The objective in
administering the PACER is to run as long as possible back and forth across a 20-meter
space at a specified pace that gets progressively faster each minute. A 15-meter
version of the PACER can also be performed for schools with smaller facilities. PACER
provides a measure of maximal oxygen uptake (VO2 max).
Although children in grades K-3 are encouraged to participate in the PACER, The
Cooper Institute does not recommend having lap count standards and has not
developed HFZ values for children ages 9 and under. The HFZ values for the 20-meter
PACER for children ages 10 and over are shown in Table 2 in Appendix F. New
FitnessGram™ standards were not developed for PACER, in fall 2010 as they were for
the other fitness measurements. Rather, in the future FitnessGram™ will be using a
different measure of aerobic capacity that is based on the PACER results and BMI
measurements combined. Evaluators are consulting with the Cooper Institute to obtain
the formulas for converting PACER measurements to the VO2 Max measurements
which will be used to measure aerobic capacity in the future.
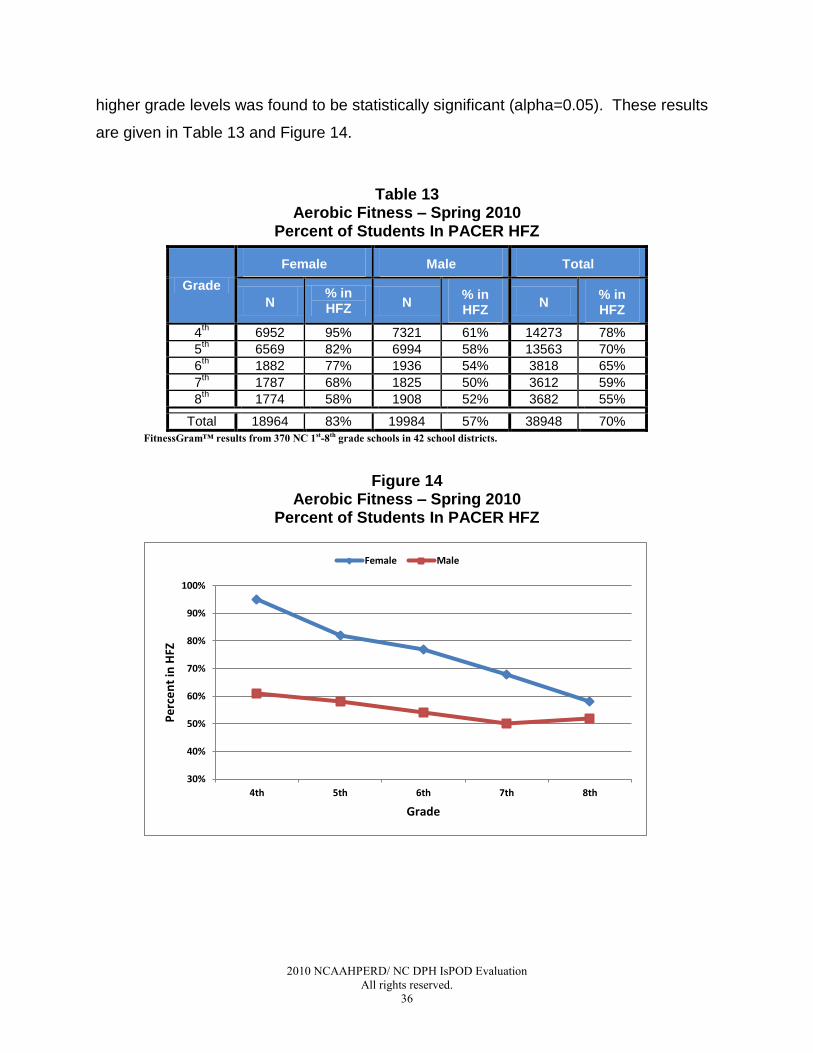
Although BMI FitnessGram™ results were obtained for over 82,000 NC 1st-8th grade
students, PACER results were only submitted for about 55,000 1st-8th graders (and
about 39,000 4th-8th graders). PACER results for 4th-8th graders show 83% of females
and 57% of males are in the healthy fitness zone. As indicated in Table 2 in Appendix F
the PACER FitnessGram™ standards for males are more stringent than for females.
However, results from spring 2010 showed a steady decrease in aerobic fitness for both
females and males for grades 4th through 8th. This decrease in aerobic fitness for
Page 36
2010 NCAAHPERD/ NC DPH IsPOD Evaluation
All rights reserved.
36
higher grade levels was found to be statistically significant (alpha=0.05). These results
are given in Table 13 and Figure 14.
Table 13
Aerobic Fitness – Spring 2010 Percent of Students In PACER HFZ
Grade
Female Male Total
N % in HFZ N
% in HFZ
N % in HFZ
4th 6952 95% 7321 61% 14273 78%
5th 6569 82% 6994 58% 13563 70%
6th 1882 77% 1936 54% 3818 65%
7th 1787 68% 1825 50% 3612 59%
8th 1774 58% 1908 52% 3682 55%
Total 18964 83% 19984 57% 38948 70%
FitnessGram™ results from 370 NC 1st-8th grade schools in 42 school districts.
Figure 14 Aerobic Fitness – Spring 2010
Percent of Students In PACER HFZ
30%
40%
50%
60%
70%
80%
90%
100%
4th 5th 6th 7th 8th
Pe
rce
nt
in H
FZ
Grade
Female Male
Page 37
2010 NCAAHPERD/NC DPH IsPOD Evaluation
All rights reserved.
37
Muscular Strength, Endurance, and Flexibility
FitnessGram™ has the capability to track student fitness in 8 fitness assessment areas
with regards to muscular strength, endurance, and flexibility to determine overall
musculoskeletal system health. The IsPOD program has chosen to focus on four
primary indicators of musculoskeletal health measures: Curl-up, Push-Up, Sit and
Reach, and Trunk Lift. These fitness measures were chosen because they provide an
overall measure of abdominal (core) strength and endurance; upper body strength and
endurance; and flexibility of the lower back, hamstring, and hip-flexor muscles which are
indicators of a healthy well-functioning back. In addition, these FitnessGram™
measures are ones that can be performed with standard tools and equipment that are
available to most schools (e.g., a floor mat, box, and ruler).
Lower Back
The Trunk Extensor strength and flexibility activity or ―Trunk Lift‖ provides a measure of
lower back strength, flexibility, and alignment, which is important for maintaining a
healthy back. The Trunk Lift is performed by having the student lie on a mat facedown,
toes pointed, and hands flat under the thighs. The student lifts the upper body off the
floor using the muscles of the back, in a very slow and controlled manner, with the head
in a straight alignment with the spine, to a maximum height of 12 inches. The student
holds this position until the tester can measure the distance from the floor to the
student’s chin. This measurement is the FitnessGram™ assessment value. Trunk Lift
HFZ values are given in Table 6 in Appendix F.
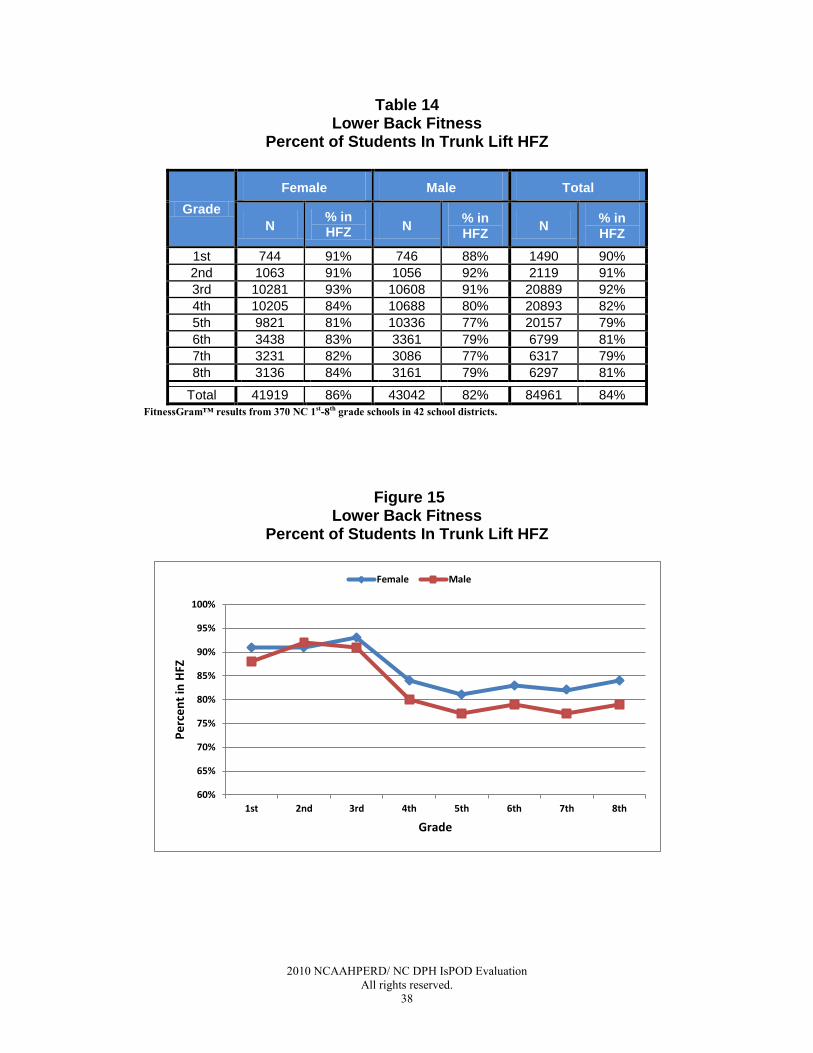
FitnessGram™ assessments obtained for almost 85,000 NC 1st-8th grade students
showed 84% met healthy fitness zone ―healthy back‖ standards in spring 2010. Results
show that overall a higher percent of females met HFZ standards compared to males
with 86% of females and 82% of males in the HFZ. The percent of students in the HFZ
was found to decrease significantly (alpha=0.05) for both males and females after grade
3.
Page 38
2010 NCAAHPERD/ NC DPH IsPOD Evaluation
All rights reserved.
38
Table 14 Lower Back Fitness
Percent of Students In Trunk Lift HFZ
Grade
Female Male Total
N % in HFZ
N % in HFZ
N % in HFZ
1st 744 91% 746 88% 1490 90%
2nd 1063 91% 1056 92% 2119 91%
3rd 10281 93% 10608 91% 20889 92%
4th 10205 84% 10688 80% 20893 82%
5th 9821 81% 10336 77% 20157 79%
6th 3438 83% 3361 79% 6799 81%
7th 3231 82% 3086 77% 6317 79%
8th 3136 84% 3161 79% 6297 81%
Total 41919 86% 43042 82% 84961 84%
FitnessGram™ results from 370 NC 1st-8th grade schools in 42 school districts.
Figure 15 Lower Back Fitness
Percent of Students In Trunk Lift HFZ
60%
65%
70%
75%
80%
85%
90%
95%
100%
1st 2nd 3rd 4th 5th 6th 7th 8th
Pe
rce
nt
in H
FZ
Grade
Female Male
Page 39
2010 NCAAHPERD/NC DPH IsPOD Evaluation
All rights reserved.
39
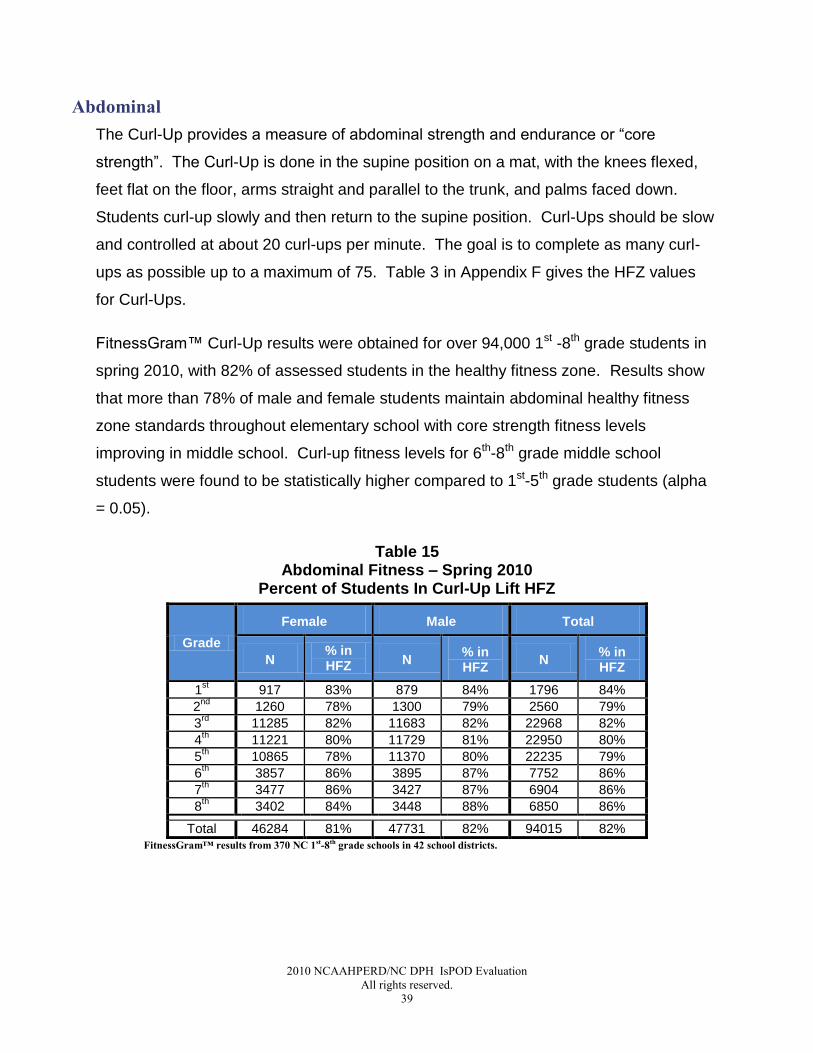
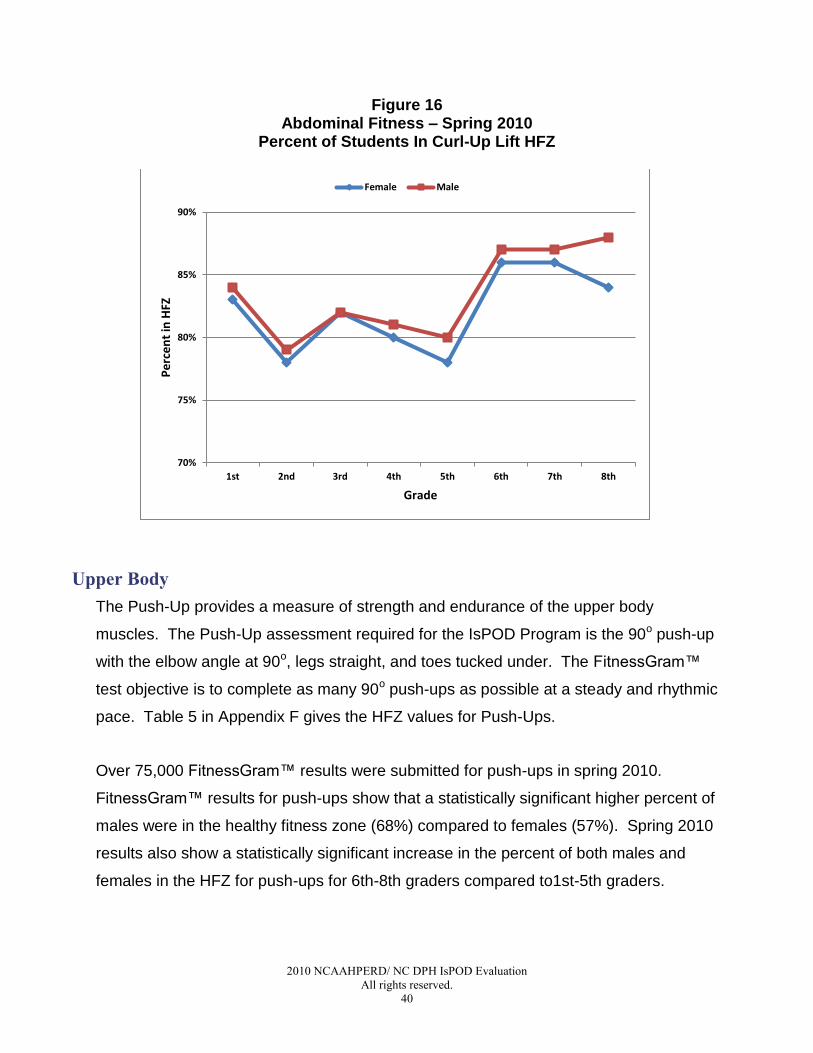
Abdominal
The Curl-Up provides a measure of abdominal strength and endurance or ―core
strength‖. The Curl-Up is done in the supine position on a mat, with the knees flexed,
feet flat on the floor, arms straight and parallel to the trunk, and palms faced down.
Students curl-up slowly and then return to the supine position. Curl-Ups should be slow
and controlled at about 20 curl-ups per minute. The goal is to complete as many curl-
ups as possible up to a maximum of 75. Table 3 in Appendix F gives the HFZ values
for Curl-Ups.
FitnessGram™ Curl-Up results were obtained for over 94,000 1st -8th grade students in
spring 2010, with 82% of assessed students in the healthy fitness zone. Results show
that more than 78% of male and female students maintain abdominal healthy fitness
zone standards throughout elementary school with core strength fitness levels
improving in middle school. Curl-up fitness levels for 6th-8th grade middle school
students were found to be statistically higher compared to 1st-5th grade students (alpha
= 0.05).
Table 15 Abdominal Fitness – Spring 2010
Percent of Students In Curl-Up Lift HFZ
Grade
Female Male Total
N % in HFZ N
% in HFZ
N % in HFZ
1st 917 83% 879 84% 1796 84%
2nd
1260 78% 1300 79% 2560 79%
3rd
11285 82% 11683 82% 22968 82%
4th 11221 80% 11729 81% 22950 80%
5th 10865 78% 11370 80% 22235 79%
6th 3857 86% 3895 87% 7752 86%
7th 3477 86% 3427 87% 6904 86%
8th 3402 84% 3448 88% 6850 86%
Total 46284 81% 47731 82% 94015 82%
FitnessGram™ results from 370 NC 1st-8th grade schools in 42 school districts.
Page 40
2010 NCAAHPERD/ NC DPH IsPOD Evaluation
All rights reserved.
40
Figure 16 Abdominal Fitness – Spring 2010
Percent of Students In Curl-Up Lift HFZ
Upper Body
The Push-Up provides a measure of strength and endurance of the upper body
muscles. The Push-Up assessment required for the IsPOD Program is the 90o push-up
with the elbow angle at 90o, legs straight, and toes tucked under. The FitnessGram™
test objective is to complete as many 90o push-ups as possible at a steady and rhythmic
pace. Table 5 in Appendix F gives the HFZ values for Push-Ups.
Over 75,000 FitnessGram™ results were submitted for push-ups in spring 2010.
FitnessGram™ results for push-ups show that a statistically significant higher percent of
males were in the healthy fitness zone (68%) compared to females (57%). Spring 2010
results also show a statistically significant increase in the percent of both males and
females in the HFZ for push-ups for 6th-8th graders compared to1st-5th graders.
70%
75%
80%
85%
90%
1st 2nd 3rd 4th 5th 6th 7th 8th
Pe
rce
nt
in H
FZ
Grade
Female Male
Page 41
2010 NCAAHPERD/NC DPH IsPOD Evaluation
All rights reserved.
41
Table 16 Upper Body – Spring 2010
Percent of Students In Push-Up Lift HFZ
Grade
Female Male Total
N % in HFZ N % in HFZ N % in HFZ
1st 627 50% 592 63% 1219 56%
2nd 935 48% 924 62% 1859 55%
3rd 9157 56% 9527 70% 18684 63%
4th 9129 52% 9510 68% 18639 60%
5th 8900 52% 9309 66% 18209 59%
6th 3092 68% 3165 72% 6257 70%
7th 2768 69% 2742 72% 5510 71%
8th 2696 68% 2811 70% 5507 69%
Total 37304 57% 38580 68% 75884 63%
FitnessGram™ results from 370 NC 1st-8th grade schools in 42 school districts
Figure 17 Upper Body
Percent of Students In Push-Up Lift HFZ
40%
45%
50%
55%
60%
65%
70%
75%
80%
1st 2nd 3rd 4th 5th 6th 7th 8th
Pe
rce
nt
in H
FZ
Grade
Female Male
Page 42
2010 NCAAHPERD/ NC DPH IsPOD Evaluation
All rights reserved.
42
Flexibility
The Sit-and-Reach activity provides a measure of flexibility, predominantly of the
hamstring muscles. The back-saver Sit-and-Reach assessment, which involves
performing measurements on the left and right sides, is required for the IsPOD program.
To perform the Sit-and-Reach a wooden box (approximately 12‖ high) and yardstick are
needed. The yardstick is taped to the top of the box with the 9-inch mark at the edge
and the ―zero‖ end facing the student. The student sits on the floor facing the box with
one leg fully extended and the foot flat against the side of the box. The other leg is bent
with the sole of the foot flat on the floor. With palms down the student reaches directly
forward (back straight and head up) over the yardstick four times and holds the position
of the fourth reach for at least one second. The inch on the yardstick the student
reaches is the FitnessGram™ measurement. This activity is repeated on the other side
and both left and right FitnessGram™ measurements are recorded. To be in the
Healthy Fitness Zone students must reach the HFZ criteria for both the left and right
sides. Table 6 in Appendix F shows the HFZ values for Sit-and-Reach.
FitnessGram™ measurements obtained for the Sit-and-Reach activity showed more
variability between schools and districts than other FitnessGram™ measurements.
Given that the Sit-and-Reach activity is not as commonly performed and assessed as
some of the other FitnessGram™ activities such as curl-ups and push-ups that most PE
teachers are familiar with, it is possible that PE teachers at various schools are not
consistently collecting these measurements in the manner described in the manuals.
IsPOD trainers have been providing additional training and support in how to collect FG
measurements so that measurements reported are accurate and consistent
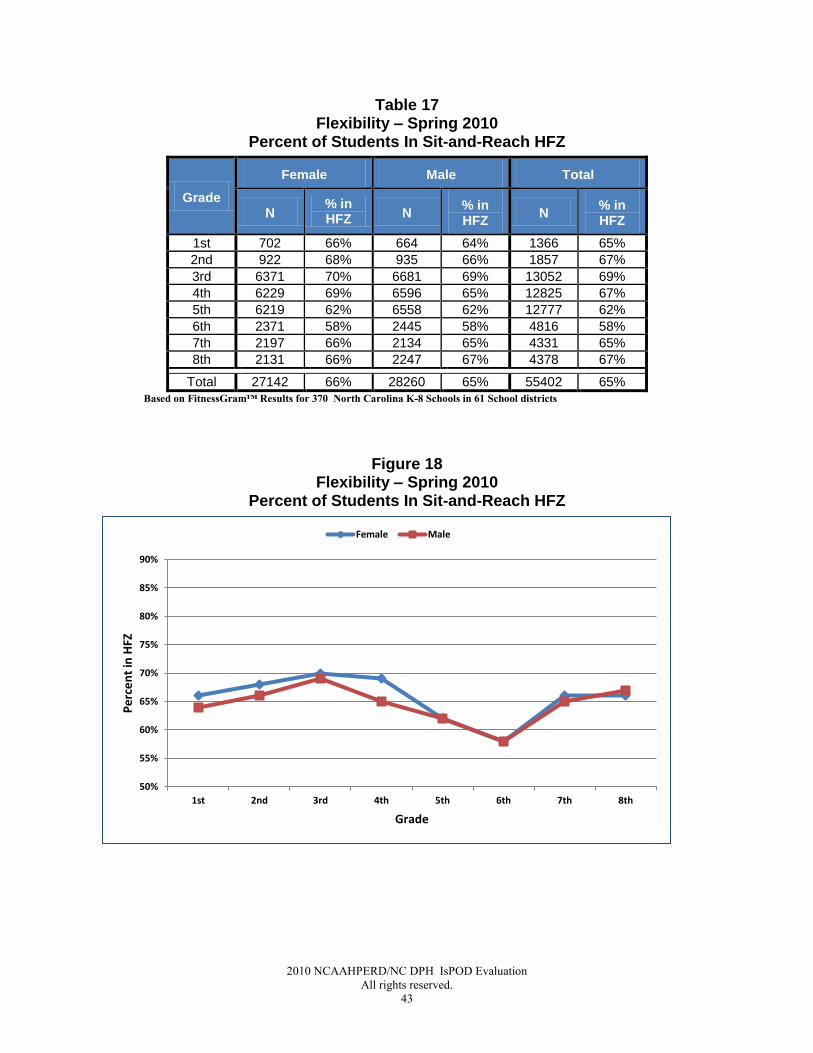
About 65% of both males and females met sit-and-reach HFZ flexibility standards, with
spring 2010 results showing student flexibility highest in grade 3, decreasing from
grades 3 through 6, and then increasing again in middle school.
Page 43
2010 NCAAHPERD/NC DPH IsPOD Evaluation
All rights reserved.
43
Table 17 Flexibility – Spring 2010
Percent of Students In Sit-and-Reach HFZ
Grade
Female Male Total
N % in HFZ N
% in HFZ
N % in HFZ
1st 702 66% 664 64% 1366 65%
2nd 922 68% 935 66% 1857 67%
3rd 6371 70% 6681 69% 13052 69%
4th 6229 69% 6596 65% 12825 67%
5th 6219 62% 6558 62% 12777 62%
6th 2371 58% 2445 58% 4816 58%
7th 2197 66% 2134 65% 4331 65%
8th 2131 66% 2247 67% 4378 67%
Total 27142 66% 28260 65% 55402 65%
Based on FitnessGram™ Results for 370 North Carolina K-8 Schools in 61 School districts
Figure 18 Flexibility – Spring 2010
Percent of Students In Sit-and-Reach HFZ
50%
55%
60%
65%
70%
75%
80%
85%
90%
1st 2nd 3rd 4th 5th 6th 7th 8th
Pe
rce
nt
in H
FZ
Grade
Female Male
Page 44
2010 NCAAHPERD/NCDPH IsPOD Evaluation
All rights reserved.
Analysis of Combined Survey and
FitnessGram™ Results
Spring 2010 survey results (64,556 responses) were merged with spring 2010
FitnessGram™ results (102,736 students), resulting in 38,175 matched merged records.
Student Survey responses to questions regarding students’ physical activity, nutrition,
screen time, and general health were analyzed to determine the impact their daily habits
have on their FitnessGram™ measurements. Student responses to these questions
were also analyzed by grade. These results are presented in this section.
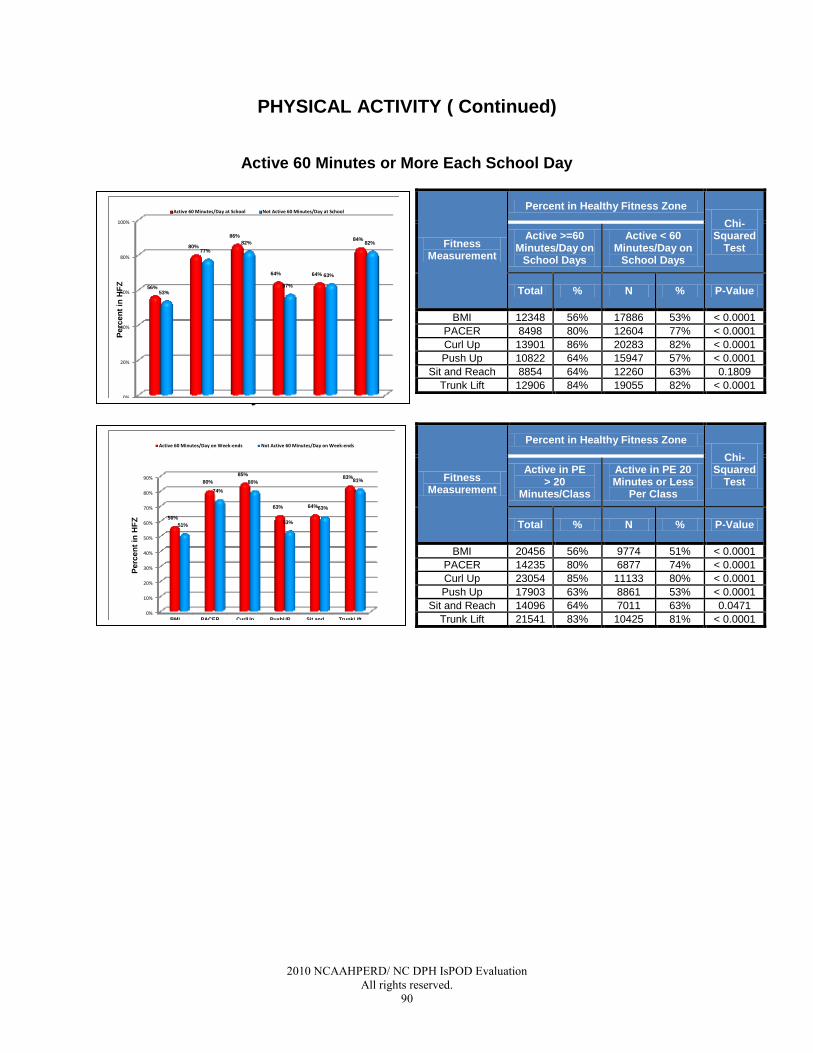
Physical Activity
Students were asked how many days per week they have PE, the length of their PE
classes, and the amount of time they are physically active in their PE classes. They
were also asked how many days a week they get 60 minutes or more or physical
activity, and the amount of time on school days and week-ends that they get physical
activity. Student responses to questions regarding their physical activity were highly
correlated with results from their FitnessGram™ measurements. Table 18 shows a
summary of results. Appendix G shows complete tables and results. As indicated in
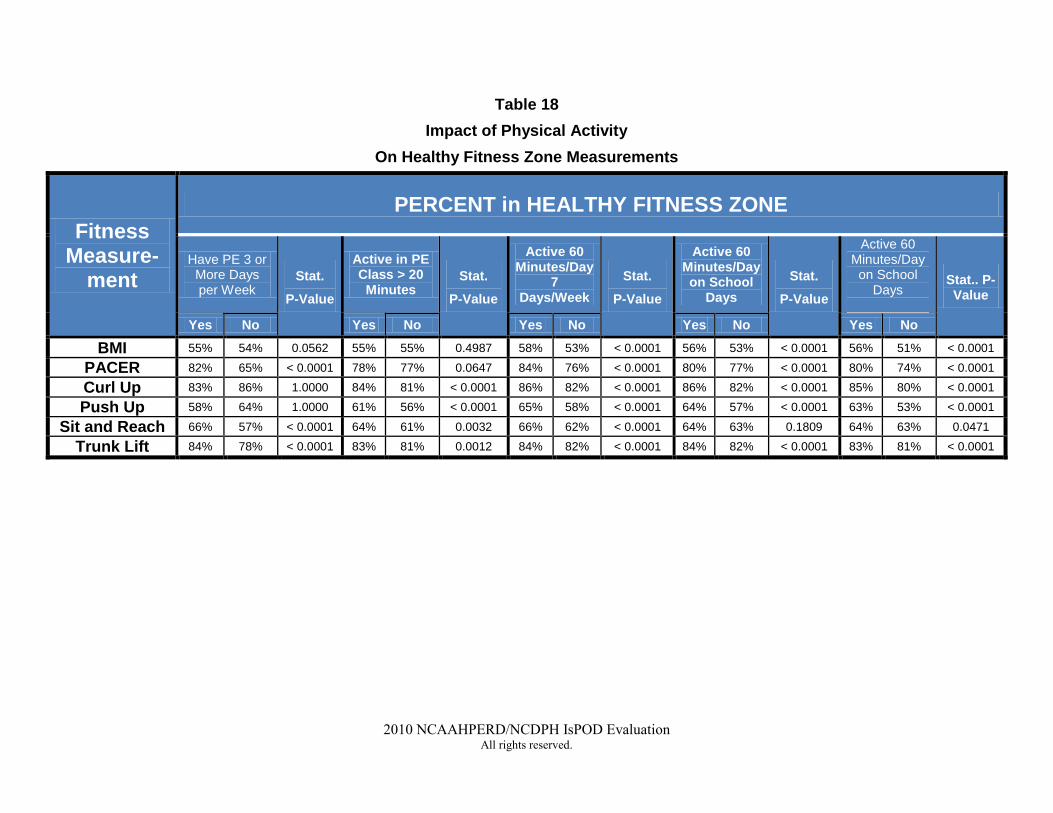
Table 18 the following were found to be statistically significant:
Students active 60 minutes/day for 7 days/week were more likely to be in the
HFZ for BMI, PACER, Curl-up, Push-up, Sit and Reach, and Trunk Lift.
Students that had PE 3 or more days/week were more likely to be in the HFZ for
PACER, Sit and Reach, and Trunk Lift compared to students that did not.
Students that were physically active in their PE classes for more than 20
minutes/class were more likely to be in the HFZ for PACER, Curl-up, Push-up,
Sit and Reach, and Trunk Lift compared to students that did not.
Students that were active 60 minutes or more per day on school days and on
week-ends were more likely to be in the HFZ for BMI, PACER, Curl-up, Push-
up, and Trunk Lift compared to students that did not.
Page 45
2010 NCAAHPERD/NCDPH IsPOD Evaluation
All rights reserved.
Table 18
Impact of Physical Activity
On Healthy Fitness Zone Measurements
Fitness Measure-
ment
PERCENT in HEALTHY FITNESS ZONE
Have PE 3 or More Days per Week
Stat.
P-Value
Active in PE Class > 20
Minutes Stat.
P-Value
Active 60 Minutes/Day
7 Days/Week
Stat.
P-Value
Active 60 Minutes/Day on School
Days
Stat.
P-Value
Active 60 Minutes/Day on School
Days
Stat.. P-Value
Yes No Yes No Yes No Yes No Yes No
BMI 55% 54% 0.0562 55% 55% 0.4987 58% 53% < 0.0001 56% 53% < 0.0001 56% 51% < 0.0001
PACER 82% 65% < 0.0001 78% 77% 0.0647 84% 76% < 0.0001 80% 77% < 0.0001 80% 74% < 0.0001
Curl Up 83% 86% 1.0000 84% 81% < 0.0001 86% 82% < 0.0001 86% 82% < 0.0001 85% 80% < 0.0001
Push Up 58% 64% 1.0000 61% 56% < 0.0001 65% 58% < 0.0001 64% 57% < 0.0001 63% 53% < 0.0001
Sit and Reach 66% 57% < 0.0001 64% 61% 0.0032 66% 62% < 0.0001 64% 63% 0.1809 64% 63% 0.0471
Trunk Lift 84% 78% < 0.0001 83% 81% 0.0012 84% 82% < 0.0001 84% 82% < 0.0001 83% 81% < 0.0001
Page 46
2010 NCAAHPERD/NCDPH IsPOD Evaluation
All rights reserved.
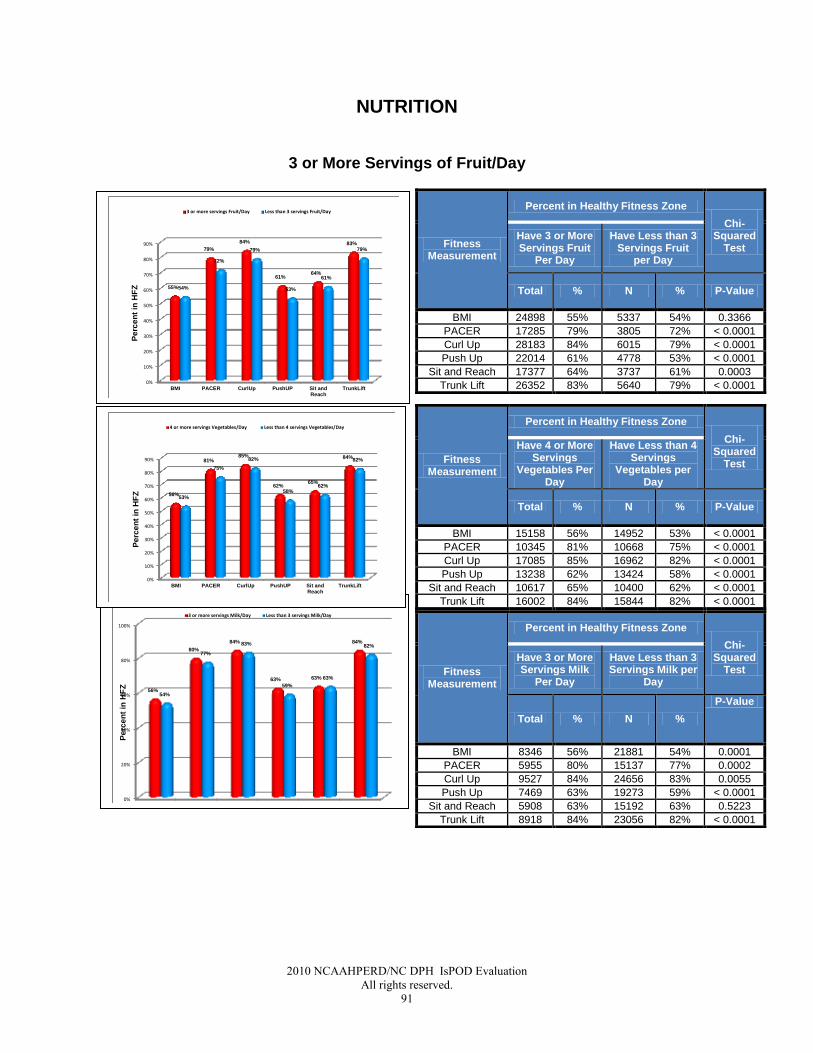
Nutrition
Student survey questions about nutrition included average daily servings of fruit,
vegetables, and milk; and days per week they ate breakfast and had dinner at home.
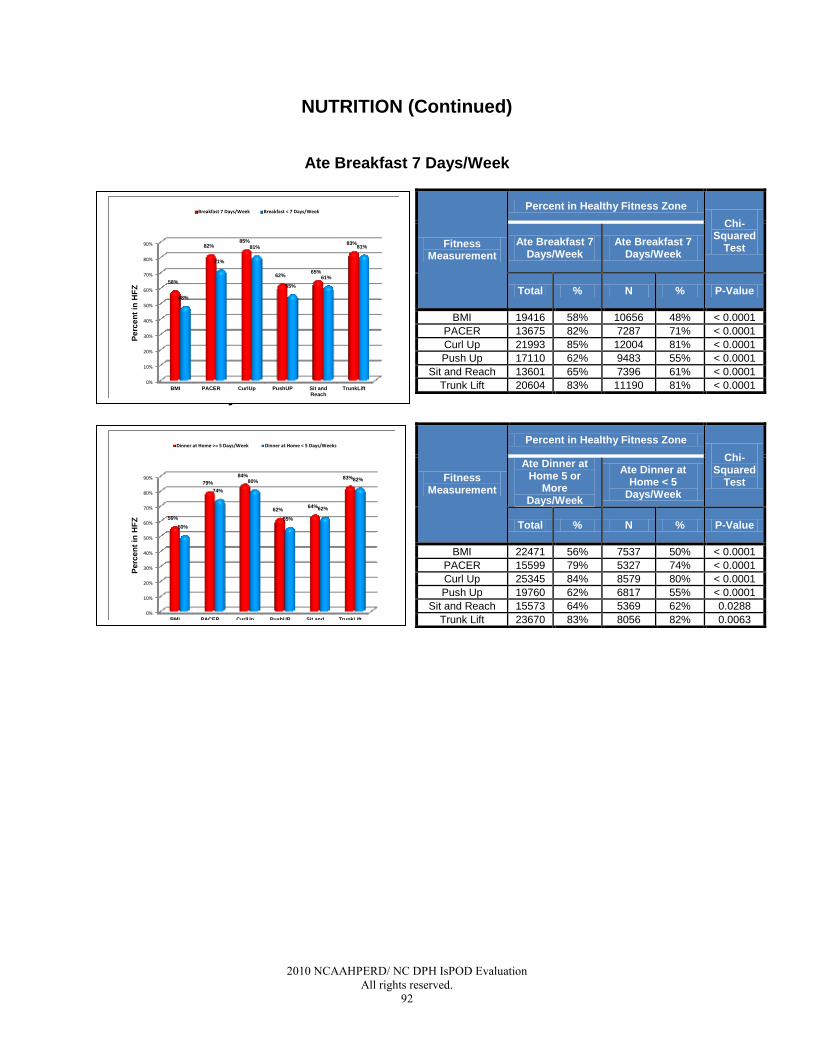
Appendix G shows complete tables and results. Table 19 shows the impact student
nutrition has on fitness measurements and the following statistically significant findings:
Students that had breakfast 7 days/week, dinner at home 5 or more days/week,
and 4 or more servings of vegetables/day were more likely to be in the HFZ for
every FitnessGram™ measurement compared to students that did not.
Students that had 3 or more servings of fruit daily were more likely to be in the
HFZ for PACER, Curl-up, Push-Up, Sit-and-Reach, and Trunk Lift compared to
students that did not.
Students that had 3 or more servings of dairy per day were more likely to be in
the HFZ for BMI, PACER, Curl-up, Push-Up, and Trunk Lift compared to
students that did not.
Screen Time
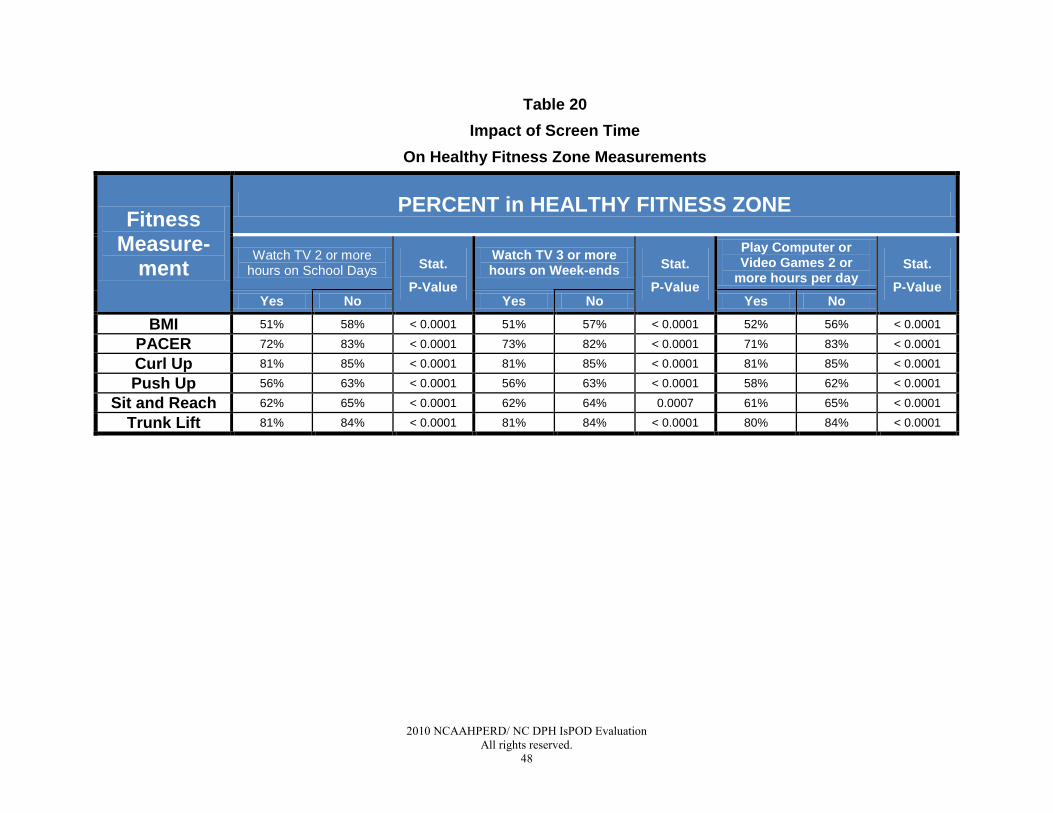
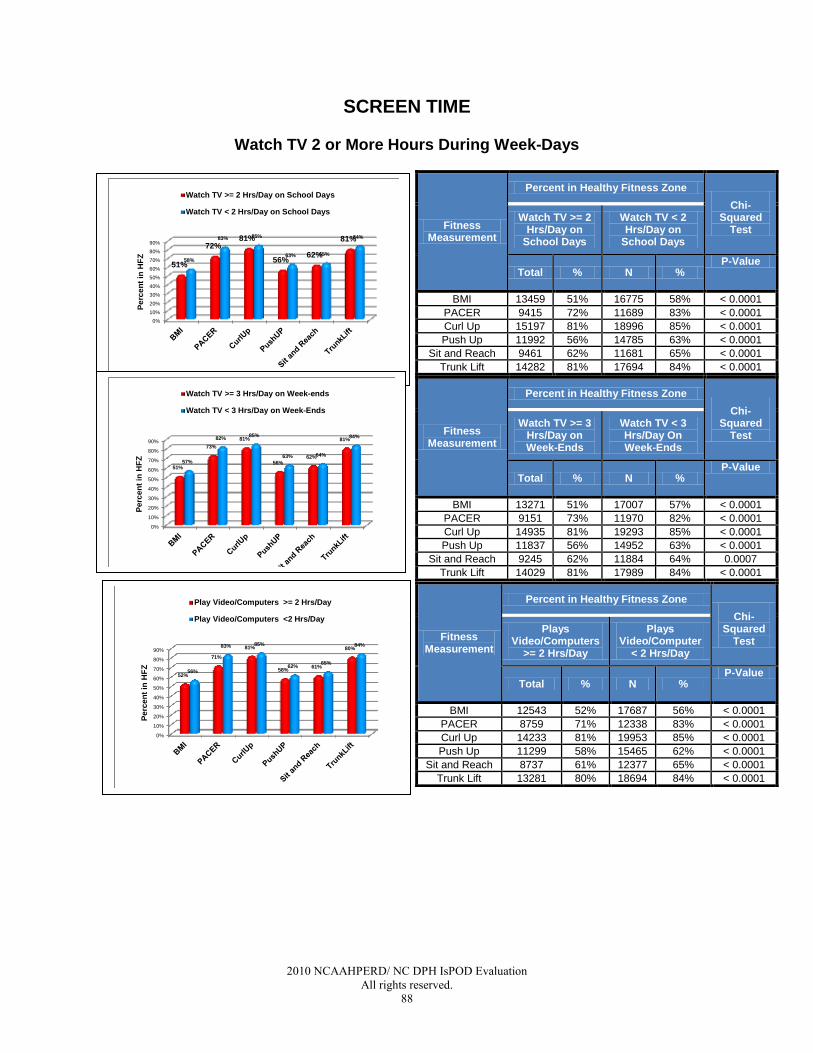
Three survey questions related to ―screen time‖ – average hours/day spent watching TV
on week-days and week-ends; and average hours/day spent playing video and/or
computer games. Results in Table 20 show these statistically significant findings:
Students that watched TV less than 2 hours/day on week-days were more likely
to be in the HFZ for every FitnessGram™ measurement.
Students that watched TV less than 3 hours/day on week-ends were more likely
to be in the HFZ for every FitnessGram™ measurement.
Students that played computer or video games less than 2 hours/day were
more likely to be in the HFZ for every FitnessGram™ measurement compared
to students that did not.
Page 47
2010 NCAAHPERD/NCDPH IsPOD Evaluation
All rights reserved.
Table 19
Impact of Nutrition
On Healthy Fitness Zone Measurements
Fitness Measure-
ment
PERCENT in HEALTHY FITNESS ZONE
3 or More Servings Fruit
per Day Stat.
P-Value
4 or More Servings
Vegetables Per Day
Stat.
P-Value
3 or More Servings Dairy per
Day
Stat.
P-Value
Have Breakfast 7
Days per Week
Stat.
P-Value
Have Dinner at Home 5 or More Days per Week
Stat.. P-Value
Yes No Yes No Yes No Yes No Yes No
BMI 55% 54% 0.3366 56% 53% < 0.0001 56% 54% 0.0001 58% 48% < 0.0001 56% 50% < 0.0001
PACER 79% 72% < 0.0001 81% 75% < 0.0001 80% 77% 0.0002 82% 71% < 0.0001 79% 74% < 0.0001
Curl Up 84% 79% < 0.0001 85% 82% < 0.0001 84% 83% 0.0055 85% 81% < 0.0001 84% 80% < 0.0001
Push Up 61% 53% < 0.0001 62% 58% < 0.0001 63% 59% < 0.0001 62% 55% < 0.0001 62% 55% < 0.0001
Sit and Reach 64% 61% 0.0003 65% 62% < 0.0001 63% 63% 0.5223 65% 61% < 0.0001 64% 62% 0.0288
Trunk Lift 83% 79% < 0.0001 84% 82% < 0.0001 84% 82% < 0.0001 83% 81% < 0.0001 83% 82% 0.0063
Page 48
2010 NCAAHPERD/ NC DPH IsPOD Evaluation
All rights reserved.
48
Table 20
Impact of Screen Time
On Healthy Fitness Zone Measurements
Fitness Measure-
ment
PERCENT in HEALTHY FITNESS ZONE
Watch TV 2 or more hours on School Days
Stat.
P-Value
Watch TV 3 or more hours on Week-ends
Stat.
P-Value
Play Computer or Video Games 2 or
more hours per day Stat.
P-Value Yes No Yes No Yes No
BMI 51% 58% < 0.0001 51% 57% < 0.0001 52% 56% < 0.0001
PACER 72% 83% < 0.0001 73% 82% < 0.0001 71% 83% < 0.0001
Curl Up 81% 85% < 0.0001 81% 85% < 0.0001 81% 85% < 0.0001
Push Up 56% 63% < 0.0001 56% 63% < 0.0001 58% 62% < 0.0001
Sit and Reach 62% 65% < 0.0001 62% 64% 0.0007 61% 65% < 0.0001
Trunk Lift 81% 84% < 0.0001 81% 84% < 0.0001 80% 84% < 0.0001
Page 49
2010 NCAAHPERD/NCDPH IsPOD Evaluation
All rights reserved.
Analysis By Grade Levels
Several notable trends were detected with regards to student PACER results by grade
level. PACER results provide a measure of cardiovascular fitness. The percent of
students in the HFZ for cardiovascular fitness was found to decrease significantly for
higher grades compared to lower grades. Student survey results show that a decrease
in the number of PE days per week, a decrease in the amount of daily physical activity,
and an increase in daily TV time is contributing to a decrease in cardiovascular fitness
for the higher grade levels. These results are illustrated in Figures 19, 20, and 21,
respectively.
Figure 19 shows the percent of students in the PACER HFZ by grade level. The data in
Figure 19 is further broken down by students that have PE 3 or more days per week
versus students that have PE fewer than 3 days per week.
Figure 20 also shows the percent of students in the PACER HFZ by grade level.
However, Figure 20 is further broken down by students that get 60 minutes of physical
activity for 7 days a week, versus those who get 60 minutes of physical activity for fewer
than 7 days a week.
Lastly, Figure 21 shows the percent of students in the PACER HFZ by grade level, with
the data further broken down by students that watch TV 2 or more hours per day,
versus those that watch TV fewer than 2 hrs per day.
These figures illustrate how a decrease in student physical activity for the higher grade
levels is contributing to lower cardiovascular fitness levels for these students in higher
grade levels.
Page 50
2010 NCAAHPERD/ NC DPH IsPOD Evaluation
All rights reserved.
50
Figure 19
Percent of Students in the PACER HFZ By Grade Level
PE 3 or More Days/Week and PE Fewer Than 3 Days/Week
0%
10%
20%
30%
40%
50%
60%
70%
80%
90%
100%
3 4 5 6 7 8
98%
79%
72%
50% 49% 46%
96%
77%
70%
48%
42% 44%
Pe
rce
nt
in C
ard
io H
FZ
Grade
pe >= 3 day/s week pe < 3 days/week
Page 51
2010 NCAAHPERD/NC DPH IsPOD Evaluation
All rights reserved.
51
Figure 20
Percent of Students in the PACER HFZ By Grade Level
Active 60 Minutes/Day 7 Days/Week and Less Than 7 Days/Week
0%
10%
20%
30%
40%
50%
60%
70%
80%
90%
100%
3 4 5 6 7 8
98%
83%
78%
59% 58%
51%
98%
77%
69%
45%
38% 42%
Pe
rce
nt
in C
ard
io H
FZ
Grade
Active 60 minutes/day 7 days/week Active 60 minutes/day < 7 days/week
Page 52
2010 NCAAHPERD/ NC DPH IsPOD Evaluation
All rights reserved.
52
Figure 21
Percent of Students in the PACER HFZ By Grade Level
TV Less than 2 Hours/Day and 2 or More Hours/Day
0%
10%
20%
30%
40%
50%
60%
70%
80%
90%
100%
3 4 5 6 7 8
98%
75%
66%
41% 41% 40%
98%
82% 77%
57%
45% 50%
Pe
rce
nt
in C
ard
io H
FZ
Grade
TV < 2 hrs/day TV >= 2 hrs/day
Page 53
2010 NCAAHPERD/NC DPH IsPOD Evaluation
All rights reserved.
53
Challenges/Recommendations With a project the size and scope of the IsPOD program, a number of challenges are to
be expected. Program coordinators have done an exceptional job of addressing
challenges and in developing action plans for moving forward, as discussed below.
Additional recommendations are also provided.
FitnessGram™ Data
NCAAHPERD has encountered a number of challenges in rolling out FitnessGram™
software, which have had an impact on the IsPOD program:
1. FitnessGram™ testing was developed primarily for grades 3-12. While testing
can be performed for grades K-2, special instructions and procedures must be
followed. IsPOD encourages FitnessGram™ testing and reporting for grades K-
2, but requires it only for grades 3-8. The impact on the program has been a
substantially lower response rate for grades K-2 compared to grades 3-8. (This
is similar to NC end-of-grade testing, required beginning in 3rd grade, although
preliminary testing is performed in many schools for grades K-2). The intent
moving forward is to encourage and prepare K-2 students and PE teachers to
perform more FitnessGram™ testing and reporting, thus increasing the response
rates for these grade levels. This will help detect student fitness needs at an
earlier age.
2. FitnessGram™ software was upgraded from Version 8 (a PC-based software) to
Version 9 (a web-based software) in spring 2010. FitnessGram™
implementation was hampered by limited availability of working copies of the new
9.0 software, resulting in submittals of both Version 8 and Version 9 data, and
issues with Version 9 caused it to malfunction or function only part of the time.
These problems were compounded by some schools’ web-security blocking;
older, incompatible versions of Internet Explorer; and limited access to computer
Page 54
2010 NCAAHPERD/ NC DPH IsPOD Evaluation
All rights reserved.
54
labs. NCAAHPERD staffs instructed schools with computer problems to record
student assessments on hard copy, and NCAAHPERD facilitated input of these
data. The result, however, was that FitnessGram™ data were not received for a
number of schools that reportedly performed assessments. NCAAHPERD’s
frequent communication and good rapport with teachers has lessened their
frustration with these problems and probably minimized the impact on the
program. Staffs at NCAAHPERD continue to work diligently with the Human
Kinetics FitnessGram™ developers to address software problems, and a
significantly higher FitnessGram™ response rate is expected for fall 2010 data.
3. NC DPI is dependent on each LEA and its school to provide up-to-date
information on student class enrollment. Often, schools do not report PE class
assignments, only homeroom class assignments. NCAAHPERD is one of the
first organizations to be given secure access to these data and is the first to
request this information for PE class assignments. Numerous requested DPI
data extracts were found to be incomplete, incorrect, or missing. NCAAHPERD
staffs manually corrected PE teacher class lists and continue to collaborate with
NC DPI to resolve these issues for future DPI data extracts.
4. Teacher training with FitnessGram™ 9.0 was limited to self-taught, online
webinars, PowerPoint presentations on the web, and fact sheets showing steps
in entering data. Training materials are provided to each SPARK™-trained
school, including a CD showing how to administer and record each of the six
required tests. IsPOD staffs have set up a FitnessGram™ ―Help Desk‖ site and
an ―FAQ‖ site on their website to help schools with FitnessGram™ assessment
and reporting. In addition, IsPOD staffs have provided several on-site
instructional presentations and hosted a seminar at the NCAAHPERD annual
conference on how to perform and report FitnessGram™ assessments.
Feedback on these presentations has been positive. Evidence suggests that a
number of teachers feel intimidated and uncomfortable using the self-taught
FitnessGram™ training, or are reluctant to do so. NCAAHPERD is addressing
Page 55
2010 NCAAHPERD/NC DPH IsPOD Evaluation
All rights reserved.
55
this by incorporating FitnessGram™ assessment and reporting training into its
annual ―booster‖ training sessions.
5. FitnessGram™ implemented new HFZ (health fitness zone) standards in fall
2010, which are being retroactively applied to previously collected data.
Other FitnessGram™ issues—all successfully resolved—include FitnessGram™ not
accepting Kindergarten-level data (a ―character‖ field), FitnessGram™ software
allowing teachers to enter duplicate student records, and FitnessGram™ not retaining
student records over time.
Survey Data
As the IsPOD program continues to reach more teachers and students, NCAAHPERD
staffs have addressed several issues arising with the survey data:
1. Prior to spring 2010, teacher and student survey data were not linked to teacher
and student ID numbers. Beginning in spring 2010 all teacher and student
surveys are linked to the student ID numbers obtained from NC DPI. The same
issues encountered with extracting student data from the NC DPI database for
use with FitnessGram™ apply to the survey data. Having student and teacher
survey data linked to LEA ID numbers, school ID numbers, and student ID
numbers, however, results in a greater understanding of the data and broader
research possibilities since student survey data can now be merged with
FitnessGram™ results.
2. As with the online submittal of FitnessGram™ results, some schools have
encountered issues with online submittal of survey results due to web-security
blocking issues, older versions of Internet Explorer, and limited access to
computer labs. Hard-copy survey versions can be emailed to the schools
encountering these issues; however, the program must factor in time and
resources for receiving hard-copy survey results and entering this data.
Page 56
2010 NCAAHPERD/ NC DPH IsPOD Evaluation
All rights reserved.
56
3. IRBS regulations mandate that the teacher and student surveys be voluntary.
Teachers and students are notified that their participation is voluntary, which will
continue to affect the survey response rates.
4. The length and frequency (twice yearly) of the student and teacher surveys may
be deterring some participants from completing them; evaluators are revising the
surveys for spring 2011. The current student survey consists of 33 multiple-
choice questions addressing students’ enjoyment of PE classes, the amount and
types of physical activity (in school and at home), screen time (computer/video
time), and food, drink, and health habits. The teacher survey consists of 61
multiple-choice and open-ended questions: 18 questions about their assessment
and use of SPARK™, 3 questions about their use of FitnessGram™, 21
questions about school policy (including days and hours of PE time), 7 questions
about the availability and condition of PE equipment, 5 questions for teachers of
students with physical disabilities, and 7 questions about additional duties, such
as coaching. For spring 2011, the teacher survey will be broken into two
separate surveys, a shorter survey required for the IsPOD program gathering
teacher feedback on SPARK™ and FitnessGram™ training and implementation,
and an optional ―Healthy Schools‖ survey that will assist NCAAHPERD in
advocating for PE and health programs in schools. Evaluators are conducting
focus groups with students and teachers in February 2011 to ensure appropriate
survey length and that participants interpret questions as evaluators intended.
Communications and Collaborations
Ongoing and timely communications and collaborations between NCAAHPERD, KBR,
FitnessGram™ developer Human Kinetics, NC DPI, the State Center for Health
Statistics, program evaluators, LEA coordinators, and PE teachers have been critical to
the success of IsPOD thus far, and will be crucial for continued success. Avenues of
communication initiated by NCAAHPERD, and plans and suggestions for ongoing
collaborations to help ensure the sustainability of the program, are detailed in this
section.
Page 57
2010 NCAAHPERD/NC DPH IsPOD Evaluation
All rights reserved.
57
NCAAHPERD has established good rapport with PE district coordinators and teachers,
endeavoring to be a strong advocate for PE teachers, to promote and support health
and fitness programs in schools, and to maintain a voice in public and political forums to
support teachers’ mission. PE teachers appear to understand and appreciate that
NCAAHPERD advocates for them, appear to be embracing the SPARK™ philosophy,
and have been patient with the difficulties encountered in rolling out the FitnessGram™
software. Several PE teachers commented at the NCAAHPERD convention that district
and FitnessGram™ reports are validating the need for PE teachers and providing
concrete data that teachers can show their supervisors to illustrate the need for health,
wellness, and physical education programs in schools.
NCAAHPERD maintains ongoing communications with PE teachers through
newsletters, an online IsPOD ―Help Desk,‖ and email ―blasts.‖ Participation in the
IsPOD program continues to be voluntary. Other than CEUs (continuing education
units) for participating in SPARK™ training and a free annual NCAAHPERD
membership for submitting surveys and FitnessGram™ assessments, teachers have
not been given any mandates or incentives for participating in IsPOD. The fact that the
IsPOD program has reached such a large percentage of districts, schools, and teachers
on a voluntary basis suggests that districts, schools, and teachers support the program,
thus setting the groundwork for sustainability. Although participation in SPARK™ has
been high, participation in FitnessGram™ has lagged, perhaps due in part to
FitnessGram™ software issues that are being addressed.
House Bill 1757, which passed in July 2010 and will become effective in fall 2011,
mandates fitness testing in all NC K-8 schools. If FitnessGram™ is approved by the
legislature and/or NC DPI as the preferred utility for recording and tracking student
fitness levels, ongoing and effective collaborations between NCAAHPERD,
FitnessGram™ developer Human Kinetics, and NC DPI will be critical in sustaining the
program. Consideration must also be given to the long-term storage and management
of the data being collected. Currently, the IsPOD survey and FitnessGram™ data are
being cleaned and managed by one statistician at the State Center for Health Statistics.
As the program continues to expand, the storage, management, and analysis of the
Page 58
2010 NCAAHPERD/ NC DPH IsPOD Evaluation
All rights reserved.
58
data should be performed by collaborative team of statisticians and data analysts.
NCAAHPERD has approached SAS Institute and the State Center for Health Statistics
requesting additional support in this area. This will continue to be a need and
consideration as the program expands.
Lastly, communication of program progress and results to the scientific community and
general public through journal publications, press releases, and conference
presentations will promote the sustainability of the program and dissemination of
findings. In the remaining years of the grant, emphasis should be placed on educating
a broader audience regarding the findings of the IsPOD program.
Page 59
2010 NCAAHPERD/NC DPH IsPOD Evaluation
All rights reserved.
59
AAAppppppeeennndddiiixxx AAA
GGGoooaaalll aaannnddd OOObbbjjjeeeccctttiiivvveeesss
Page 60
2010 NCAAHPERD/ NC DPH IsPOD Evaluation
All rights reserved.
60
IsPOD Goal One Grant Objectives and Measureable Outcomes
Goal One
Objective Measureable Outcomes and Outputs
Refo
rm t
he p
hysic
al e
du
ca
tion
pro
gra
m in N
ort
h C
aro
lina K
-8
sch
oo
ls.
1.1
Make a research-based K-8 physical education program designed to improve children's health and fitness available to
NC counties, schools, teachers, and students
1.1.1
All 115 NC counties will be introduced to the SPARK™ curriculum by the end of the grant period
1.1.2
Document the number of K-8 schools in each NC school district that have received training in SPARK™ and have adopted SPARK™
1.1.3
Document the number of NC physical education teachers in each NC school that have received training in SPARK™ and have implemented SPARK™
1.1.4 Document the number NC K-8 students that have been “reached” by SPARK™.
1.2 Create a sustainable physical education
program in NC schools
1.2.1 4 to 6 trainers will be trained in the SPARK™ curriculum and provide training to school districts
1.2.2 Document number and type of SPARK™ training received by NC PE Teachers through IsPOD grant
1.2.3
Document number NC colleges/universities with physical fitness programs that have faculty receiving SPARK™ training through IsPOD grant
1.2.4
Document number of college students majoring in physical education that receive SPARK™ training through IsPOD grant
1.3
Create a mechanism for tracking the health and fitness of NC children
1.3.1 Document use of FitnessGram™ software through IsPOD grant
1.3.2 Document the number of schools and teachers using FitnessGram™ software
Page 61
2010 NCAAHPERD/NC DPH IsPOD Evaluation
All rights reserved.
61
AAAppppppeeennndddiiixxx BBB
NNNCCCAAAAAAPPPHHHEEERRRDDD
TTTrrraaaiiinnniiinnnggg RRReeecccooorrrdddsss
Page 62
2010 NCAAHPERD/ NC DPH IsPOD Evaluation
All rights reserved.
62
NCAAPHERD IsPOD Training Schedule
Grant Year
County Name
Number of
Schools Trained
SPARK™ K-2 SPARK™ 3-5 SPARK™ 6-8
Training Date
Number Trained
Training Date
Number Trained
Training Date
Number Trained
200
6-2
008
DUPLIN COUNTY 12 03/27/09 23 04/20/07 22 04/19/07 26
08/19/08 18 08/20/08 22
DURHAM COUNTY 40 08/19/08 33 04/24/07 26 04/26/07 17
06/10/08 25 08/19/08 23
IREDELL-STATESVILLE
28 08/18/08 32 04/04/08 20 04/04/08 18
04/17/07 23 04/17/07 10
JACKSON COUNTY 6 08/20/08 7 06/11/07 10 06/11/07 8
03/28/08 9 03/28/08 8
MACON COUNTY 9 08/20/08 10 06/11/07 8 06/11/07 5
03/28/08 8
ROBESON COUNTY 34 10/17/08 24 06/08/07 16 06/08/07 15
02/18/08 25 02/18/08 14
UNION COUNTY 35 08/22/08 28 06/13/07 24 06/13/08 34
02/18/08 24 08/22/08 38
Page 63
2010 NCAAHPERD/NC DPH IsPOD Evaluation
All rights reserved.
63
NCAAPHERD IsPOD Training Schedule (continued)
Grant Year
County Name
Number of
Schools Trained
SPARK™ K-2 SPARK™ 3-5 SPARK™ 6-8 SPARK™ 9-12
Training Date
Number Trained
Training Date
Number Trained
Training Date
Number Trained
Training Date
Number Trained
200
8-2
009
ALLEGHANY COUNTY 3 08/19/09 6 01/29/09 6 01/30/09 6
ASHE COUNTY 4 08/19/09 3 01/29/09 4 01/30/09 5
ASHEVILLE CITY 7 10/21/08 4 08/18/08 5 02/25/09 1
AVERY COUNTY 8 08/19/08 2 01/29/09 1 01/30/09 0
BRUNSWICK COUNTY 13 12/05/08 11 08/22/08 12 01/26/09 9
BUNCOMBE COUNTY 31 10/21/08 25 08/18/08 22 02/25/09 18
CABARRUS COUNTY 27 09/11/09 17 10/17/08 20 02/10/09 29 02/09/09 28
CALDWELL COUNTY 21 08/19/09 14 01/29/09 15 01/30/09 7
CARTERET COUNTY 14 12/11/08 18 11/05/08 18 01/14/09 13
CHAPEL HILL-CARR 13 12/03/08 16 09/29/08 14 10/23/09 15
CRAVEN COUNTY 20 10/13/08 14 08/20/08 18
DARE COUNTY 8 12/03/08 3 10/17/08 4 02/16/09 6 02/09/09 3
FORSYTH COUNTY 59 08/20/09 48 11/04/08 41 11/04/08 44 11/03/09 33
GASTON COUNTY 42 08/18/09 10 08/10/09 20 11/14/08 25
HAYWOOD COUNTY 12 10/21/08 9 08/18/08 9 02/25/09 8
HENDERSON COUNTY 17 10/30/09 15 01/08/09 17 01/09/09 17 02/09/09 16
Page 64
2010 NCAAHPERD/ NC DPH IsPOD Evaluation
All rights reserved.
64
NCAAPHERD IsPOD Training Schedule (continued)
Grant Year
County Name
Number of
Schools Trained
SPARK™ K-2 SPARK™ 3-5 SPARK™ 6-8 SPARK™ 9-12
Training Date
Number Trained
Training Date
Number Trained
Training Date
Number Trained
Training Date
Number Trained
200
8-2
009
JONES COUNTY 5 12/11/08 0 11/05/08 0 01/14/09 5
KANNAPOLIS CITY 7 09/11/09 4 10/17/08 5 02/10/09 5 02/09/09 3
LENOIR COUNTY 16 12/05/08 9 10/17/08 8 02/16/09 9
MONTGOMERY 7 12/09/08 5 12/10/08 5 01/14/09 6
MOORE COUNTY 18 12/09/08 10 12/10/08 10 01/14/09 15 02/09/09 13
NEW HANOVER 33 12/05/08 22 08/22/08 24 01/26/09 18
ONSLOW COUNTY 26 10/13/08 18 08/20/08 23 01/14/09 16
ORANGE COUNTY 10 12/03/08 8 09/29/08 6 10/23/09 5
PAMLICO COUNTY 3 12/11/08 1 11/05/08 1 01/14/09 3
PENDER COUNTY 11 12/05/08 5 08/22/08 2 01/26/09 1
PERSON COUNTY 9 12/03/08 6 09/29/08 9 10/23/09 3
RUTHERFORD COUNTY 13 08/18/09 11 01/08/09 12 01/09/09 11
SCOTLAND COUNTY 13 12/09/08 6 12/10/08 7 01/14/09 7
STANLY COUNTY 19 09/11/09 11 10/17/08 8 02/10/09 12
WATAUGA COUNTY 8 08/19/09 10 01/29/09 12 01/30/09 9 02/09/09 6
WILSON COUNTY 19 12/05/08 11 10/17/08 11 02/16/09 10
Page 65
2010 NCAAHPERD/NC DPH IsPOD Evaluation
All rights reserved.
65
NCAAPHERD IsPOD Training Schedule (continued)
Grant Year
County Name
Number of
Schools Trained
SPARK™ K-2 SPARK™ 3-5 SPARK™ 6-8
Training Date
Number Trained
Training Date
Number Trained
Training Date
Number Trained
200
9-2
010
BEAUFORT COUNTY 10 09/17/09 3 09/18/09 7 01/20/10 7
BERTIE COUNTY 8 09/17/09 1 09/18/09 1 01/20/10 2
CAMDEN COUNTY 2 09/17/09 1 09/18/09 1 01/20/10 3
CATAWBA COUNTY 22 08/10/09 15 08/11/09 16
CUMBERLAND
COUNTY 72 08/18/09 43 09/25/09 29 02/15/10 2
CURRITUCK COUNTY 7 09/17/09 7 09/18/09 7 01/20/10 6
DAVIE COUNTY 10 08/19/09 6 08/20/09 6
EDENTON/CHOWAN 3 09/17/09 1 09/18/09 1 01/20/10 0
GATES COUNTY 4 09/17/09 3 09/18/09 3 01/20/10 0
GUILFORD COUNTY 91 06/14/10 2 08/21/09 81 08/23/10
HERTFORD COUNTY 4 09/17/09 2 09/18/09 3 01/20/10 0
HYDE COUNTY 3 09/17/09 1 09/18/09 1 01/20/10 0
LINCOLN COUNTY 18 08/19/09 8 08/20/09 9
MARTIN COUNTY 8 09/17/09 4 09/18/09 4 01/20/10 0
MECKLENBURG
COUNTY 115 09/28/09 89 08/19/09 115 08/20/09 73
NASH-ROCKY MOUNT 22 08/19/09 18 08/20/09 18 01/20/10 21
NORTHAMPTON
COUNTY 7 09/17/09 0 09/18/09 2 01/20/10 0
PASQUOTANK
COUNTY 9 09/17/09 7 09/18/09 7 01/20/10 7
PERQUIMANS
COUNTY 3 09/17/09 2 09/18/09 4 01/20/10 2
ROWAN-SALISBURY 27 08/19/09 11 08/20/09 12 01/22/10
Page 66
2010 NCAAHPERD/ NC DPH IsPOD Evaluation
All rights reserved.
66
Grant Year
County Name
Number of
Schools Trained
SPARK™ K-2 SPARK™ 3-5 SPARK™ 6-8
Training Date
Number Trained
Training Date
Number Trained
Training Date
Number Trained
TYRRELL COUNTY 2 09/17/09 1 09/18/09 1 01/20/10 1
Page 67
2010 NCAAHPERD/NC DPH IsPOD Evaluation
All rights reserved.
67
NCAAPHERD IsPOD Training Schedule (continued)
Grant Year
County Name
Number of
Schools Trained
SPARK™ K-2 SPARK™ 3-5 SPARK™ 6-8
Training Date
Number Trained
Training Date
Number Trained
Training Date
Number Trained
Fall
2010
ALAMANCE-
BURLINGTON 18 8/20/2010 23
CHATHAM COUNTY 10 8/20/2010 10 8/20/2010 5
CHEROKEE CENTRAL 1 8/23/2010 1 8/20/2010 1 8/23/2010 1
CHEROKEE COUNTY 6 8/23/2010 7 8/20/2010 7 8/23/2010 6
CLEVELAND COUNTY 23 10/4/2010 18 10/5/2010 20 10/5/2010 14
GRAHAM COUNTY 2 8/23/2010 2 8/20/2010 2 8/23/2010 5
HICKORY CITY
SCHOOLS 2 1/25/2010 2 1/25/2010 0
JOHNSTON COUNTY 30 8/19/2010 27 8/19/2010 15
MADISON COUNTY 5 8/9/2010 4 8/9/2010 5
MCDOWELL COUNTY 8 8/9/2010 6 8/9/2010 9
MITCHELL COUNTY 7 8/9/2010 5 8/9/2010 3
RANDOLPH COUNTY 16 8/20/2010 15 8/20/2010 1
ROCKINGHAM
COUNTY 20 8/18/2010 16 8/18/2010 15
STOKES COUNTY 11 9/21/2010 12
SURRY COUNTY 11 9/21/2010 11
SWAIN COUNTY 3 8/23/2010 5 8/20/2010 5 8/23/2010 4
THOMASVILLE CITY 2 8/20/2010 3
TRANSYLVANIA
COUNTY 6 6 3
WAKE COUNTY 103 7/6/2010,
8/19/2010 108
7/6/2010,
8/19/2010 40
WAYNE COUNTY 23 8/19/2010 42 8/19/2010 27
Page 68
2010 NCAAHPERD/ NC DPH IsPOD Evaluation
All rights reserved.
68
Grant Year
County Name
Number of
Schools Trained
SPARK™ K-2 SPARK™ 3-5 SPARK™ 6-8
Training Date
Number Trained
Training Date
Number Trained
Training Date
Number Trained
WILKES COUNTY 16 8/18/2010 19 8/19/2010 19 8/19/2010 14
YADKIN COUNTY 3 9/21/2010 3 9/21/2010 3
YANCEY COUNTY
SCHOOLS 8 8/9/2010 6 8/9/2010 7
Page 69
2010 NCAAHPERD/NC DPH IsPOD Evaluation
All rights reserved.
69
AAAppppppeeennndddiiixxx CCC
NNNuuummmbbbeeerrr aaannnddd PPPeeerrrccceeennnttt
ooofff SSSccchhhoooooolllsss &&& SSStttaaaffffff
wwwiiittthhh SSSPPPAAARRRKKK™™™ TTTrrraaaiiinnniiinnnggg
Page 70
2010 NCAAHPERD/ NC DPH IsPOD Evaluation
All rights reserved.
70
Table 1 - Original HWTF LEAs Adopted SPARK™ in 2006-08: N = 7 LEAs Number of Schools Trained in SPARK™
LEAs SCHOOLS STAFF
LEA LEA ID
Total # of K-8
Schoolsa.
# of K-8 Schools with
SPARK™ Training
Total Number of High
Schoolsa.
# of High Schools
with SPARK™ Training
Total Number of
K-8 PE Teachers
# of K-8 PE Teachers Trained
# of 9-12 PE
Teachers Trained
# of LEA Coord-inators Trained
# of Other Staff
Trained
Total # of Staff Trained
N % N % N %
1 DUPLIN 310 12 12 100% 6 1 17% 35 35 100% 0 0 4 39
2 DURHAM 320 41 40 98% 13 3 23% 66 66 100% 0 1 6 73
3 IREDELL 490 29 27 93% 11 5 45% 64 64 100% 1 2 11 78
4 JACKSON 500 7 6 86% 4 1 25% 17 12 71% 0 1 0 13
5 MACON 560 11 8 73% 5 3 60% 18 18 100% 0 2 4 24
6 ROBESON* 780 34 32 94% 7 0 0% 61 60 98% 0 1 0 61
7 UNION 900 41 37 90% 13 2 15% 92 92 100% 0 2 15 109
TOTAL 175 162 93% 59 15 25% 353 347 98% 1 9 40 397
* = Addditional training scheduled for spring 2011
a. Alternative, charter, exceptional, hospital, and vocational schools not included in count of total K-8 schools.
Page 71
2010 NCAAHPERD/NC DPH IsPOD Evaluation
All rights reserved.
71
Table 2 – KBR Grant Year One LEAs Adopted SPARK™ in 2008-09: N = 32 LEAs
Number of Schools Trained in SPARK™
LEAs SCHOOLS STAFF
LEA LEA ID
Total # of K-8
Schoolsa.
# of K-8 Schools with
SPARK™ Training
Total Number of High
Schoolsa.
# of High Schools
with SPARK™ Training
Total Number of
K-8 PE Teachers
# of K-8 PE Teachers Trained
# of 9-12 PE
Teachers Trained
# of LEA
Coord-inators Trained
# of Other Staff
Trained
Total # of Staff Trained
N % N % N %
1 ALLEGHANY 030 3 3 100% 1 0 0% 5 5 100% 0 0 1 6
2 ASHE 050 4 4 100% 1 0 0% 8 6 75% 0 0 0 6
3 ASHEVILLE CITY 111 6 6 100% 2 0 0% 8 8 100% 0 0 0 8
4 AVERY 060 7 6 86% 1 0 0% 9 8 89% 0 0 0 8
5 BRUNSWICK 100 15 13 87% 5 1 20% 32 20 63% 0 0 0 20
6 BUNCOMBE 110 31 30 97% 7 2 29% 73 48 66% 3 0 2 53
7 CABARRUS* 130 27 23 85% 9 0 0% 62 57 92% 0 0 0 57
8 CALDWELL 140 20 18 90% 5 0 0% 32 22 69% 0 0 0 22
9 CARTERET 160 13 13 100% 3 0 0% 36 32 89% 0 2 0 34
10 CHAPEL HILL 681 14 13 93% 3 0 0% 43 30 70% 0 0 0 30
11 CRAVEN 250 20 15 75% 5 0 0% 40 19 48% 0 0 0 19
12 DARE 280 8 6 75% 3 1 33% 16 16 100% 1 1 3 21
13 FORSYTH 340 61 57 93% 17 12 71% 122 102 84% 24 3 0 129
14 GASTON 360 44 34 77% 11 1 9% 65 65 100% 0 1 5 71
15 HAYWOOD 440 12 11 92% 3 0 0% 27 18 67% 0 0 0 18
16 HENDERSON 450 18 17 94% 6 1 17% 38 29 76% 0 0 0 29
17 JONES 520 5 1 20% 1 0 0% 6 2 33% 0 0 0 2
18 KANNAPOLIS 132 7 5 71% 1 1 100% 13 9 69% 3 0 0 12
19 LENOIR 540 13 13 100% 5 1 20% 19 19 100% 0 0 4 23
20 MONTGOMERY 620 8 8 100% 2 1 50% 14 13 93% 1 0 0 14
21 MOORE 630 21 17 81% 4 4 100% 26 26 100% 10 0 10 46
22 NEW HANOVER 650 33 28 85% 6 1 17% 48 44 92% 1 4 0 49
23 ONSLOW 670 28 25 89% 7 0 0% 42 38 90% 0 0 0 38
24 ORANGE 680 10 10 100% 2 0 0% 15 13 87% 0 0 0 13
25 PAMLICO 690 3 3 100% 1 0 0% 5 5 100% 0 0 0 5
26 PENDER 710 12 8 67% 4 0 0% 14 8 57% 0 0 0 8
27 PERSON 730 9 9 100% 1 0 0% 19 12 63% 0 0 0 12
28 RUTHERFORD* 810 13 13 100% 4 0 0% 27 27 100% 0 1 2 30
29 SCOTLAND 830 13 10 77% 7 0 0% 22 16 73% 0 0 0 16
30 STANLY 840 18 9 50% 5 1 20% 27 15 56% 1 0 0 16
31 WATAUGA 950 8 8 100% 1 1 100% 14 14 100% 6 1 1 22
32 WILSON 980 21 16 76% 4 0 0% 36 22 61% 0 0 0 22
TOTAL 525 452 86% 137 28 20% 963 768 80% 50 13 28 859
* = Addditional training scheduled for spring 2011
a. Alternative, charter, exceptional, hospital, and vocational schools not included in count of total K-8 schools..
Page 72
2010 NCAAHPERD/ NC DPH IsPOD Evaluation
All rights reserved.
72
Table 3 – KBR Grant Year Two LEAs Adopted SPARK™ in 2009-10: N = 22 LEAs
Number of Schools Trained in SPARK™
LEAs SCHOOLS STAFF
LEA LEA ID
Total # of K-8
Schoolsa.
# of K-8 Schools with
SPARK™ Training
Total Number of High
Schoolsa.
# of High Schools
with SPARK™ Training
Total Number
of K-8 PE Teachers
# of K-8 PE Teachers Trained
# of 9-12 PE
Teachers Trained
# of LEA
Coord-inators Trained
# of Other Staff
Trained
Total # of Staff Trained
N % N % N %
1 BEAUFORT 070 9 9 100% 4 0 0% 17 13 76% 0 0 0 13
2 BERTIE 080 5 2 40% 3 0 0% 8 3 38% 0 0 0 3
3 CAMDEN 150 3 3 100% 2 0 0% 7 7 100% 0 0 2 9
4 CATAWBA* 180 21 20 95% 6 0 0% 34 28 82% 0 2 0 30
5 CUMBERLAND 260 69 61 88% 14 1 7% 118 103 87% 0 0 0 103
6 CURRITUCK 270 8 8 100% 2 0 0% 10 10 100% 0 1 3 14
7 DAVIE 300 9 6 67% 2 0 0% 20 6 30% 0 0 0 6
8 EDENTON/CHOWAN 210 3 2 67% 1 0 0% 5 2 40% 0 0 0 2
9 GATES 370 4 3 75% 1 0 0% 7 3 43% 0 0 0 3
10 GUILFORD 410 91 85 93% 28 5 18% 251 141 56% 2 7 0 150
11 HERTFORD 460 4 4 100% 3 0 0% 7 4 57% 0 0 0 4
12 HYDE 480 3 1 33% 3 0 0% 4 1 25% 0 0 0 1
13 LINCOLN 550 18 10 56% 4 0 0% 31 12 39% 0 0 0 12
14 MARTIN 580 9 4 44% 3 0 0% 16 4 25% 0 0 0 4
15 MECKLENBURG 600 143 135 94% 36 5 14% 232 211 91% 0 0 4 215
16 NASH-ROCKY MT 640 22 19 86% 5 0 0% 40 40 100% 0 0 0 40
17 NORTHAMPTON 660 6 2 33% 3 0 0% 8 2 25% 0 0 0 2
18 PASQUOTANK 700 9 9 100% 2 0 0% 16 14 88% 0 0 0 14
19 PERQUIMANS 720 3 3 100% 1 0 0% 3 3 100% 0 0 2 5
20 ROANOKE RAPIDS 421 3 2 67% 1 0 0% 7 2 29% 0 0 0 2
21 ROWAN-SALISBUR 800 27 21 78% 7 0 0% 67 45 67% 0 0 0 45
22 TYRRELL 890 2 2 100% 2 1 50% 3 2 67% 0 0 0 2
TOTAL 471 411 87% 133 12 9% 911 656 72% 2 10 11 679
* = Addditional training scheduled for spring 2011
a. Alternative, charter, exceptional, hospital, and vocational schools not included in count of total K-8 schools..
Page 73
2010 NCAAHPERD/NC DPH IsPOD Evaluation
All rights reserved.
73
Table 4 – KBR Grant Year Three LEAs Adopted SPARK™ in 2010-11: N = 22 LEAs Fall 2010, N= 6 LEAs Spring 2011
Number of Schools Trained in SPARK™
LEAs SCHOOLS STAFF
LEA LEA ID
Total # of K-8
Schoolsa.
# of K-8 Schools with SPARK™
Training
Total Number of High
Schoolsa.
# of High Schools with
SPARK™ Training
Total Number of K-8
PE Teachers
# of K-8 PE Teachers Trained
# of 9-12 PE
Teachers Trained
# of LEA
Coord-inators Trained
# of Other Staff
Trained
Total # of Staff Trained
N % N % N %
1 ALAMANCE* 10 27 18 67% 7 0 0% 55 23 42% 0 0 0 23
2 CHATHAM* 190 13 10 77% 3 0 0% 20 10 50% 0 1 0 11
3 CHEROKEE 200 9 6 67% 4 0 0% 16 8 50% 0 0 0 8
4 CLEVELAND 230 23 23 100% 6 1 17% 45 33 73% 0 0 0 33
5 GRAHAM 380 2 2 100% 1 0 0% 7 5 71% 0 0 0 5
6 HICKORY CITY* 181 8 2 25% 2 0 0% 11 2 18% 0 0 0 2
7 JOHNSTON 510 34 30 88% 10 0 0% 69 39 57% 0 0 0 39
8 MADISON 570 5 5 100% 2 0 0% 8 8 100% 0 0 1 9
9 MCDOWELL 590 10 8 80% 4 2 50% 20 9 45% 0 0 0 9
10 MITCHELL 610 7 7 100% 2 0 0% 7 7 100% 0 0 2 9
11 RANDOLPH* 760 24 16 67% 7 0 0% 46 16 35% 0 0 0 16
12 ROCKINGHAM 790 20 20 100% 5 0 0% 34 31 91% 0 1 0 32
13 STOKES* 850 14 11 79% 4 0 0% 27 12 44% 0 0 0 12
14 SURRY* 860 15 11 73% 4 1 25% 26 11 42% 1 0 0 12
15 SWAIN 870 4 3 75% 2 0 0% 6 6 100% 0 0 3 9
16 THOMASVILLE 292 3 2 67% 1 0 0% 7 3 43% 0 0 0 3
17 TRANSYLVANIA 880 6 6 100% 2 0 0% 13 9 69% 0 1 0 10
18 WAKE* 920 135 103 76% 24 0 0% 323 148 46% 0 2 0 150
19 WAYNE 960 24 23 96% 10 3 30% 59 52 88% 1 0 1 54
20 WILKES 970 17 16 94% 6 0 0% 33 33 100% 0 0 0 33
21 YADKIN* 990 10 3 30% 4 1 25% 15 3 20% 0 0 0 3
22 YANCEY 995 8 8 100% 1 0 0% 11 11 100% 0 0 2 13
TOTAL 418 333 80% 111 8 7% 858 479 56% 2 5 9 495
TRAINING SCHEDULED FOR SPRING 2011: 1 BURKE 120 21 0 0% 5 0 0% 38 0 0% 0 0 0 0
2 ELKIN CITY 861 2 0 0% 1 0 0% 7 0 0% 0 0 0 0
3 GREENE 400 3 0 0% 2 0 0% 6 0 0% 0 0 0 0
4 MOUNT AIRY 862 3 0 0% 1 0 0% 5 0 0% 0 0 0 0
5 NEWTON 182 4 0 0% 2 0 0% 8 0 0% 0 0 0 0
6 PITT 740 29 0 0% 6 0 0% 55 0 0% 0 0 0 0
TOTAL 62 0 0% 17 0 0% 119 0 0% 0 0 0 0
* = Addditional training scheduled for spring 2011
a. Alternative and Exceptional schools with ADM < 100, Charter, and Vocational schools not included.
Page 74
2010 NCAAHPERD/ NC DPH IsPOD Evaluation
All rights reserved.
74
Table 5 – KBR Grant Year Four LEAs Scheduled to Adopt SPARK™ in 2011-12: N = 26 LEAs
LEAs SCHOOLS STAFF
LEA LEA ID
Total # of K-8
Schoolsa.
# of K-8 Schools with SPARK™
Training
Total Number of High
Schoolsa.
# of High Schools with
SPARK™ Training
Total Number of K-8
PE Teachers
# of K-8 PE Teachers Trained
# of 9-12 PE
Teachers Trained
# of LEA
Coord-inators Trained
# of Other Staff
Trained
Total # of Staff Trained
N % N % N %
1 ALEXANDER 20 9 0 0% 1 0 0% 17 0 0% 0 0 0 17
2 ANSON 40 7 0 0% 3 0 0% 15 0 0% 0 0 0 15
3 ASHEBORO 761 7 0 0% 1 0 0% 9 0 0% 0 0 0 9
4 BLADEN 90 11 0 0% 2 0 0% 14 0 0% 0 0 0 14
5 CASWELL 170 5 0 0% 1 0 0% 12 0 0% 0 0 0 12
6 CLAY 220 2 0 0% 1 0 0% 4 0 0% 0 0 0 4
7 CLINTON CITY 821 4 0 0% 1 0 0% 5 0 0% 0 0 0 5
8 COLUMBUS 240 15 0 0% 5 0 0% 17 0 0% 0 0 0 17
9 DAVIDSON 290 24 0 0% 7 0 0% 60 0 0% 0 0 0 60
10 EDGECOMBE 330 10 0 0% 4 0 0% 15 0 0% 0 0 0 15
11 FRANKLIN 350 11 0 0% 4 0 0% 21 0 0% 0 0 0 21
12 GRANVILLE 390 12 0 0% 8 0 0% 16 0 0% 0 0 0 16
13 HALIFAX 420 10 0 0% 2 0 0% 6 0 0% 0 0 0 6
14 HARNETT 430 22 0 0% 4 0 0% 63 0 0% 0 0 0 63
15 HOKE COUNTY 470 10 2 20% 2 0 0% 20 2 10% 0 0 0 20
16 LEE COUNTY 530 10 0 0% 3 0 0% 21 0 0% 0 0 0 21
17 LEXINGTON 291 5 0 0% 1 0 0% 8 0 0% 0 0 0 8
18 MOORESVILLE 491 6 0 0% 1 0 0% 11 0 0% 0 0 0 11
19 POLK 750 5 0 0% 2 0 0% 11 0 0% 0 0 0 11
20 RICHMOND 770 13 0 0% 3 0 0% 17 0 0% 0 0 0 17
21 SAMPSON 820 13 0 0% 5 0 0% 23 0 0% 0 0 0 23
22 VANCE 910 13 0 0% 3 0 0% 22 0 0% 0 0 0 22
23 WARREN 930 5 0 0% 3 0 0% 6 0 0% 0 0 0 6
24 WASHINGTON 940 4 0 0% 2 0 0% 8 0 0% 0 0 0 8
25 WELDON CITY 422 3 0 0% 2 0 0% 3 0 0% 0 0 0 3
26 WHITEVILLE 241 3 0 0% 1 0 0% 4 0 0% 0 0 0 4
TOTAL 239 2 1% 72 0 0% 428 2 0% 0 0 0 428
* = Addditional training scheduled for spring 2011
a. Alternative, charter, exceptional, hospital, and vocational schools not included in count of total K-8 schools..
Page 75
2010 NCAAHPERD/NC DPH IsPOD Evaluation
All rights reserved.
75
AAAppppppeeennndddiiixxx DDD
SSStttuuudddeeennntttsss “““RRReeeaaaccchhheeeddd”””
BBByyy SSSPPPAAARRRKKK™™™
Page 76
2010 NCAAHPERD/ NC DPH IsPOD Evaluation
All rights reserved.
76
Table 1 - Original HWTF LEAs STUDENTS “REACHED” BY SPARK™
LEAs SCHOOLS “REACH”
LEA LEA ID Total # of
K-8 Schools
a.
# of K-8 Schools Using FG
# of K-8 Schools with SPARK™
Training ADM
Grades 1-8
LOWER BOUND UPPER BOUND
N % N % Number of Valid FG IDs
% ADM of
SPARK™ Students
%
1 DUPLIN 310 12 4 33% 12 100% 5842 1472 25% 5842 100%
2 DURHAM 320 41 9 22% 40 98% 19724 1828 9% 19200 97%
3 IREDELL 490 28 26 93% 25 89% 13136 9887 75% 12165 93%
4 JACKSON 500 7 4 57% 5 71% 2326 1218 52% 1926 83%
5 MACON 560 10 4 40% 8 80% 2665 571 21% 2420 91%
6 ROBESON* 780 34 4 12% 32 94% 14875 510 3% 14528 98%
7 UNION 900 41 30 73% 37 90% 24914 9098 37% 22830 92%
TOTAL 173 81 47% 159 92% 83482 24584 29% 78911 95%
Page 77
2010 NCAAHPERD/NC DPH IsPOD Evaluation
All rights reserved.
77
Table 2 – KBR Grant Year One LEAs STUDENTS “REACHED” BY SPARK™
LEAs SCHOOLS “REACH”
LEA LEA ID Total # of
K-8 Schools
a.
# of K-8 Schools Using FG
# of K-8 Schools with SPARK™
Training ADM
Grades 1-8
LOWER BOUND UPPER BOUND
N % N % Number of Valid FG IDs
% ADM of
SPARK™ Students
%
1 ALLEGHANY 030 3 1 33% 3 100% 925 134 14% 925 100%
2 ASHE 050 4 3 75% 4 100% 2068 978 47% 2068 100%
3 ASHEVILLE CITY 111 7 1 14% 6 86% 2235 157 7% 2206 99%
4 AVERY 060 8 2 25% 3 38% 1378 244 18% 422 31%
5 BRUNSWICK 100 15 3 20% 13 87% 7474 599 8% 6676 89%
6 BUNCOMBE 110 31 13 42% 29 94% 15809 4246 27% 14655 93%
7 CABARRUS* 130 26 3 12% 23 88% 17699 1232 7% 17371 98%
8 CALDWELL 140 21 3 14% 18 86% 7992 415 5% 6568 82%
9 CARTERET 160 14 2 14% 13 93% 5059 166 3% 5055 100%
10 CHAPEL HILL 681 16 0 0% 12 75% 7128 0 0% 6106 86%
11 CRAVEN 250 20 3 15% 15 75% 9203 250 3% 5994 65%
12 DARE 280 9 4 44% 6 67% 2934 806 27% 2174 74%
13 FORSYTH 340 66 36 55% 57 86% 32483 9611 30% 31410 97%
14 GASTON 360 45 0 0% 30 67% 19566 0 0% 15206 78%
15 HAYWOOD 440 12 4 33% 11 92% 4823 794 16% 4358 90%
16 HENDERSON 450 18 2 11% 17 94% 8446 168 2% 8039 95%
17 JONES 520 5 0 0% 1 20% 694 0 0% 115 17%
18 KANNAPOLIS 132 7 7 100% 5 71% 3328 1427 43% 2707 81%
19 LENOIR 540 13 4 31% 12 92% 5573 939 17% 5383 97%
20 MONTGOMERY 620 9 2 22% 8 89% 2766 395 14% 2756 100%
21 MOORE 630 19 12 63% 16 84% 7609 3673 48% 6643 87%
22 NEW HANOVER 650 33 0 0% 28 85% 14744 0 0% 12889 87%
23 ONSLOW 670 28 13 46% 25 89% 15167 3185 21% 13159 87%
24 ORANGE 680 11 4 36% 10 91% 4403 1074 24% 4401 100%
25 PAMLICO 690 3 0 0% 3 100% 748 0 0% 748 100%
26 PENDER 710 12 5 42% 7 58% 5055 1631 32% 2978 59%
27 PERSON 730 9 6 67% 9 100% 3151 1428 45% 3151 100%
28 RUTHERFORD* 810 14 11 79% 13 93% 5565 2733 49% 5540 100%
29 SCOTLAND 830 14 1 7% 10 71% 3998 318 8% 3389 85%
30 STANLY 840 19 5 26% 9 47% 5676 876 15% 3005 53%
31 WATAUGA 950 8 5 63% 8 100% 2617 1293 49% 2617 100%
32 WILSON 980 21 1 5% 15 71% 7894 151 2% 5886 75%
TOTAL 540 156 29% 439 81% 234210 38923 17% 204600 87%
Page 78
2010 NCAAHPERD/ NC DPH IsPOD Evaluation
All rights reserved.
78
Page 79
2010 NCAAHPERD/NC DPH IsPOD Evaluation
All rights reserved.
79
Table 3 – KBR Grant Year Two LEAs STUDENTS “REACHED” BY SPARK™
LEAs SCHOOLS “REACH”
LEA LEA ID Total # of
K-8 Schools
a.
# of K-8 Schools Using FG
# of K-8 Schools with SPARK™
Training ADM
Grades 1-8
LOWER BOUND UPPER BOUND
N % N % Number of Valid FG IDs
% ADM of
SPARK™ Students
%
1 BEAUFORT 070 10 0 0% 9 90% 4428 0 0% 4422 100%
2 BERTIE 080 6 1 17% 2 33% 1738 76 4% 894 51%
3 CAMDEN 150 3 1 33% 2 67% 1202 22 2% 763 63%
4 CATAWBA* 180 22 0 0% 20 91% 10592 0 0% 9947 94%
5 CUMBERLAND 260 72 7 10% 61 85% 32225 1812 6% 30439 94%
6 CURRITUCK 270 8 1 13% 8 100% 2427 78 3% 2427 100%
7 DAVIE 300 10 4 40% 6 60% 4181 1236 30% 2597 62%
8 EDENTON/CHOWAN 210 3 0 0% 2 67% 1422 0 0% 896 63%
9 GATES 370 4 1 25% 3 75% 1163 209 18% 695 60%
10 GUILFORD 410 94 42 45% 67 71% 43963 9934 23% 29064 66%
11 HERTFORD 460 4 0 0% 4 100% 1909 0 0% 1909 100%
12 HYDE 480 3 0 0% 1 33% 366 0 0% 171 47%
13 LINCOLN 550 19 0 0% 10 53% 7312 0 0% 3523 48%
14 MARTIN 580 10 0 0% 4 40% 2465 0 0% 1325 54%
15 MECKLENBURG 600 142 76 54% 133 94% 85452 25595 30% 81779 96%
16 NASH-ROCKY MT 640 22 0 0% 19 86% 10805 0 0% 10242 95%
17 NORTHAMPTON 660 6 0 0% 2 33% 1532 0 0% 611 40%
18 PASQUOTANK 700 10 0 0% 9 90% 3767 0 0% 3741 99%
19 PERQUIMANS 720 3 0 0% 3 100% 1085 0 0% 1085 100%
20 ROANOKE RAPIDS 421 3 0 0% 2 67% 1802 0 0% 1224 68%
21 ROWAN-SALISBUR 800 28 0 0% 19 68% 12707 0 0% 9760 77%
22 TYRRELL 890 2 0 0% 2 100% 357 0 0% 357 100%
TOTAL 484 133 27% 388 80% 232900 38962 17% 197871 85%
Page 80
2010 NCAAHPERD/ NC DPH IsPOD Evaluation
All rights reserved.
80
AAAppppppeeennndddiiixxx EEE
FFFiiitttnnneeessssssGGGrrraaammm™™™
RRReeessspppooonnnssseee RRRaaattteeesss
Page 81
2010 NCAAHPERD/NC DPH IsPOD Evaluation
All rights reserved.
81
Table 1 - Original HWTF LEAs Adopted SPARK™ in 2006-08: N = 7 LEAs Number of Schools Trained in SPARK™
LEAs FITNESSGRAM™ RESPONSE RATES
LEA LEA ID
ADM Grades
1-2
# Valid FG IDs Grades 1-2
AMD Grades
3-5
# Valid FG IDs Grades 3-5
ADM Grades
6-8
# Valid FG IDs Grades 6-8
ADM Grades
1-8
# Valid FG IDs Grades 1-8
N % N % N % N %
1 DUPLIN 310 1540 373 24% 2209 845 38% 2093 254 12% 5842 1472 25%
2 DURHAM 320 5428 67 1% 7752 1761 23% 6544 0 0% 19724 1828 9%
3 IREDELL 490 3267 0 0% 4975 5196 104% 4894 4691 96% 13136 9887 75%
4 JACKSON 500 596 0 0% 896 627 70% 834 591 71% 2326 1218 52%
5 MACON 560 655 0 0% 1021 571 56% 989 0 0% 2665 571 21%
6 ROBESON* 780 3839 0 0% 5784 510 9% 5252 0 0% 14875 510 3%
7 UNION 900 6385 0 0% 9593 6782 71% 8936 2316 26% 24914 9098 37%
TOTAL 21710 440 2% 32230 16292 51% 29542 7852 27% 83482 24584 29%
Page 82
2010 NCAAHPERD/ NC DPH IsPOD Evaluation
All rights reserved.
82
Table 2 – KBR Grant Year One LEAs FitnessGram™ Response Rates
LEAs FITNESSGRAM™ RESPONSE RATES
LEA LEA ID
ADM Grades
1-2
# Valid FG IDs Grades 1-2
AMD Grades
3-5
# Valid FG IDs Grades 3-5
ADM Grades
6-8
# Valid FG IDs Grades 6-8
ADM Grades
1-8
# Valid FG IDs Grades 1-8
N % N % N % N %
1 ALLEGHANY 030 215 33 15% 367 56 15% 343 45 13% 925 134 14%
2 ASHE 050 503 0 0% 781 540 69% 784 438 56% 2068 978 47%
3 ASHEVILLE CITY 111 652 0 0% 896 157 18% 687 0 0% 2235 157 7%
4 AVERY 060 341 58 17% 516 186 36% 521 0 0% 1378 244 18%
5 BRUNSWICK 100 1886 0 0% 2817 599 21% 2771 0 0% 7474 599 8%
6 BUNCOMBE 110 3885 498 13% 6107 2043 33% 5817 1705 29% 15809 4246 27%
7 CABARRUS* 130 4598 240 5% 6716 992 15% 6385 0 0% 17699 1232 7%
8 CALDWELL 140 1924 0 0% 3023 167 6% 3045 248 8% 7992 415 5%
9 CARTERET 160 1150 0 0% 1913 113 6% 1996 53 3% 5059 166 3%
10 CHAPEL HILL 681 1790 0 0% 2642 0 0% 2696 0 0% 7128 0 0%
11 CRAVEN 250 2423 15 1% 3571 235 7% 3209 0 0% 9203 250 3%
12 DARE 280 737 0 0% 1095 626 57% 1102 180 16% 2934 806 27%
13 FORSYTH 340 8532 23 0% 12517 9238 74% 11434 350 3% 32483 9611 30%
14 GASTON 360 4799 0 0% 7517 0 0% 7250 0 0% 19566 0 0%
15 HAYWOOD 440 1245 110 9% 1784 684 38% 1794 0 0% 4823 794 16%
16 HENDERSON 450 2219 0 0% 3199 0 0% 3028 168 6% 8446 168 2%
17 JONES 520 162 0 0% 278 0 0% 254 0 0% 694 0 0%
18 KANNAPOLIS 132 932 0 0% 1266 951 75% 1130 476 42% 3328 1427 43%
19 LENOIR 540 1330 141 11% 2141 798 37% 2102 0 0% 5573 939 17%
20 MONTGOMERY 620 703 215 31% 1103 180 16% 960 0 0% 2766 395 14%
21 MOORE 630 1826 7 0% 2872 1928 67% 2911 1738 60% 7609 3673 48%
22 NEW HANOVER 650 3853 0 0% 5675 0 0% 5216 0 0% 14744 0 0%
23 ONSLOW 670 3981 54 1% 5869 3131 53% 5317 0 0% 15167 3185 21%
24 ORANGE 680 1126 226 20% 1620 722 45% 1657 126 8% 4403 1074 24%
25 PAMLICO 690 186 0 0% 259 0 0% 303 0 0% 748 0 0%
26 PENDER 710 1270 304 24% 1900 1194 63% 1885 133 7% 5055 1631 32%
27 PERSON 730 852 489 57% 1196 939 79% 1103 0 0% 3151 1428 45%
28 RUTHERFORD* 810 1330 276 21% 2139 1446 68% 2096 1011 48% 5565 2733 49%
29 SCOTLAND 830 1017 126 12% 1478 192 13% 1503 0 0% 3998 318 8%
30 STANLY 840 1420 0 0% 2134 679 32% 2122 197 9% 5676 876 15%
31 WATAUGA 950 654 0 0% 943 623 66% 1020 670 66% 2617 1293 49%
32 WILSON 980 1965 0 0% 3070 151 5% 2859 0 0% 7894 151 2%
TOTAL 59506 2815 5% 89404 28570 32% 85300 7538 9% 234210 38923 17%
Page 83
2010 NCAAHPERD/NC DPH IsPOD Evaluation
All rights reserved.
83
Table 3 – KBR Grant Year Two LEAs Adopted SPARK™ in 2009-10: N = 22 LEAs
Number of Schools Trained in SPARK™
LEAs FITNESSGRAM™ RESPONSE RATES
LEA LEA ID
ADM Grades
1-2
# Valid FG IDs Grades 1-2
AMD Grades
3-5
# Valid FG IDs Grades 3-5
ADM Grades
6-8
# Valid FG IDs Grades 6-8
ADM Grades
1-8
# Valid FG IDs Grades 1-8
N % N % N % N %
1 BEAUFORT 070 1106 0 0% 1724 0 0% 1598 0 0% 4428 0 0%
2 BERTIE 080 394 20 5% 654 56 9% 690 0 0% 1738 76 4%
3 CAMDEN 150 304 22 7% 437 0 0% 461 0 0% 1202 22 2%
4 CATAWBA* 180 2585 0 0% 4050 0 0% 3957 0 0% 10592 0 0%
5 CUMBERLAND 260 8152 518 6% 12316 1294 11% 11757 0 0% 32225 1812 6%
6 CURRITUCK 270 553 0 0% 958 58 6% 916 20 2% 2427 78 3%
7 DAVIE 300 1030 388 38% 1567 848 54% 1584 0 0% 4181 1236 30%
8 EDENTON/CHOWAN 210 359 0 0% 537 0 0% 526 0 0% 1422 0 0%
9 GATES 370 266 67 25% 429 142 33% 468 0 0% 1163 209 18%
10 GUILFORD 410 10990 183 2% 16686 9751 58% 16287 0 0% 43963 9934 23%
11 HERTFORD 460 522 0 0% 728 0 0% 659 0 0% 1909 0 0%
12 HYDE 480 99 0 0% 130 0 0% 137 0 0% 366 0 0%
13 LINCOLN 550 1804 0 0% 2773 0 0% 2735 0 0% 7312 0 0%
14 MARTIN 580 608 0 0% 986 0 0% 871 0 0% 2465 0 0%
15 MECKLENBURG 600 22749 610 3% 33145 17739 54% 29558 7246 25% 85452 25595 30%
16 NASH-ROCKY MT 640 2724 0 0% 4155 0 0% 3926 0 0% 10805 0 0%
17 NORTHAMPTON 660 385 0 0% 631 0 0% 516 0 0% 1532 0 0%
18 PASQUOTANK 700 989 0 0% 1488 0 0% 1290 0 0% 3767 0 0%
19 PERQUIMANS 720 278 0 0% 407 0 0% 400 0 0% 1085 0 0%
20 ROANOKE RAPIDS 421 519 0 0% 705 0 0% 578 0 0% 1802 0 0%
21 ROWAN-SALISBUR 800 3260 0 0% 4708 0 0% 4739 0 0% 12707 0 0%
22 TYRRELL 890 89 0 0% 149 0 0% 119 0 0% 357 0 0%
TOTAL 59765 1808 3% 89363 29888 33% 83772 7266 9% 232900 38962 17%
Page 84
2010 NCAAHPERD/NCDPH IsPOD Evaluation
All rights reserved.
AAAppppppeeennndddiiixxx FFF
CCCoooooopppeeerrr IIInnnssstttiiitttuuuttteee
FFFiiitttnnneeessssssGGGrrraaammm™™™ SSStttaaannndddaaarrrdddsss
Page 85
2010 NCAAHPERD/NC DPH IsPOD Evaluation
All rights reserved.
85
Table 1
BMI Healthy Fitness Zone (HFZ) Values
Age
Girls Boys
Below HFZ
In HFZ Over HFZ
Below HFZ
In HFZ Over HFZ
5 < 13.5 13.6 - 16.7 >16.8 < 13.8 13.9 - 16.7 >16.8
6 < 13.4 13.5 – 17.0 > 17.1 < 13.7 13.8 – 16.9 > 17.0 7 < 13.4 13.5 – 17.5 > 17.6 < 13.7 13.8 – 17.3 > 17.4 8 < 13.5 13.6 – 18.2 > 18.3 < 13.8 13.9 – 17.8 > 17.9 9 < 13.7 13.8 – 18.9 > 19.0 < 14.0 14.1 – 18.5 > 18.6
10 < 14.0 14.1 – 19.5 > 19.6 < 14.2 14.3 – 18.9 > 19.0 11 < 14.4 14.5 – 20.4 > 20.5 < 14.5 14.6 – 19.7 > 19.8 12 < 14.8 14.9 – 21.2 > 21.3 < 15.0 15.1 – 20.5 > 20.6 13 < 15.3 15.4 – 22.0 > 22.1 < 15.4 15.5 – 21.3 > 21.4 14 < 15.8 15.9 – 22.8 > 22.9 < 16.0 16.1 – 22.1 > 22.2 15 < 16.3 16.4 – 23.5 > 23.6 < 16.5 16.6 – 22.9 > 23.0 16 < 16.8 16.9 – 24.1 > 24.2 < 17.1 17.2 – 23.7 > 23.8 17 < 17.2 17.3 – 24.6 > 24.7 < 17.7 17.8 – 24.4 > 24.5
> 17 < 17.5 17.6 – 25.1 > 25.2 < 18.2 18.3 – 25.1 > 25.2
Table 2
20 Meter PACER Healthy Fitness Zone (HFZ) Values
Age In HFZ
Girls Boys
10 > 7 > 23 11 > 15 > 23 12 > 15 > 32 13 > 23 > 41 14 > 23 > 41 15 > 32 > 51 16 > 32 > 61 17 > 41 > 61
> 17 > 41 > 72
Table 3
Trunk Lift Healthy Fitness Zone (HFZ) Values
Age In HFZ
Girls Boys
5 - 9 > 6” > 6” > 10 > 9” > 9”
Page 86
2010 NCAAHPERD/ NC DPH IsPOD Evaluation
All rights reserved.
86
Table 4 Curl-Up Healthy Fitness Zone (HFZ) Values
Age
In HFZ
Girls Boys
5 > 2 > 2 6 > 2 > 2 7 > 4 > 4
8 > 6 > 6
9 > 9 > 9
10 > 12 > 12 11 > 15 > 15 12 > 18 > 18 13 > 18 > 21
> 14 > 18 > 24
Table 5
90o Push-Up Healthy Fitness Zone (HFZ) Values
Age In HFZ
Girls Boys
5 - 6 > 3 > 3 7 > 4 > 4 8 > 5 > 5
9 > 6 > 6
10 > 7 > 7
11 > 7 > 8 12 > 7 > 10 13 > 7 > 12 14 > 7 > 14 15 > 7 > 16
> 16 > 7 > 18
Table 6
Sit-and-Reach Healthy Fitness Zone (HFZ) Values
Age In HFZ
Girls Boys
5 - 10 > 9” > 8” 11 - 14 > 10” > 8”
> 15 > 12” > 8”
Page 87
2010 NCAAHPERD/NC DPH IsPOD Evaluation
All rights reserved.
87
AAAppppppeeennndddiiixxx GGG
AAAnnnaaalllyyysssiiisss ooofff FFFiiitttnnneeessssssGGGrrraaammm™™™ aaannnddd
SSStttuuudddeeennnttt SSSuuurrrvvveeeyyy RRReeesssuuullltttsss
Page 88
2010 NCAAHPERD/ NC DPH IsPOD Evaluation
All rights reserved.
88
SCREEN TIME
Watch TV 2 or More Hours During Week-Days
Watch TV 3 or More Hours During Week-Ends
Play Video/Computer Games 2 or More Hours/Day
Fitness Measurement
Percent in Healthy Fitness Zone
Chi-Squared
Test Watch TV >= 2
Hrs/Day on School Days
Watch TV < 2 Hrs/Day on
School Days
Total % N % P-Value
BMI 13459 51% 16775 58% < 0.0001
PACER 9415 72% 11689 83% < 0.0001
Curl Up 15197 81% 18996 85% < 0.0001
Push Up 11992 56% 14785 63% < 0.0001
Sit and Reach 9461 62% 11681 65% < 0.0001
Trunk Lift 14282 81% 17694 84% < 0.0001
Fitness Measurement
Percent in Healthy Fitness Zone
Chi-Squared
Test Watch TV >= 3
Hrs/Day on Week-Ends
Watch TV < 3 Hrs/Day On Week-Ends
Total % N % P-Value
BMI 13271 51% 17007 57% < 0.0001
PACER 9151 73% 11970 82% < 0.0001
Curl Up 14935 81% 19293 85% < 0.0001
Push Up 11837 56% 14952 63% < 0.0001
Sit and Reach 9245 62% 11884 64% 0.0007
Trunk Lift 14029 81% 17989 84% < 0.0001
Fitness Measurement
Percent in Healthy Fitness Zone
Chi-Squared
Test Plays
Video/Computers >= 2 Hrs/Day
Plays Video/Computer
< 2 Hrs/Day
Total % N % P-Value
BMI 12543 52% 17687 56% < 0.0001
PACER 8759 71% 12338 83% < 0.0001
Curl Up 14233 81% 19953 85% < 0.0001
Push Up 11299 58% 15465 62% < 0.0001
Sit and Reach 8737 61% 12377 65% < 0.0001
Trunk Lift 13281 80% 18694 84% < 0.0001
0%
10%
20%
30%
40%
50%
60%
70%
80%
90%
51%
72% 81%
56% 62%
81%
58%
83% 85%
63% 65%
84%
Pe
rce
nt
in H
FZ
Watch TV >= 2 Hrs/Day on School Days
Watch TV < 2 Hrs/Day on School Days
0%
10%
20%
30%
40%
50%
60%
70%
80%
90%
52%
71%
81%
58% 61%
80%
56%
83% 85%
62% 65%
84%
Pe
rce
nt
in H
FZ
Play Video/Computers >= 2 Hrs/Day
Play Video/Computers <2 Hrs/Day
0%
10%
20%
30%
40%
50%
60%
70%
80%
90%
51%
73%
81%
56% 62%
81%
57%
82% 85%
63% 64%
84%
Pe
rce
nt
in H
FZ
Watch TV >= 3 Hrs/Day on Week-ends
Watch TV < 3 Hrs/Day on Week-Ends
Page 89
2010 NCAAHPERD/NC DPH IsPOD Evaluation
All rights reserved.
89
PHYSICAL ACTIVITY
Have PE 3 or More Days/Week
Active in PE 20 Minutes or More Each Class
Active 60 Minutes/Day for 7 Days/Week
Fitness Measurement
Percent in Healthy Fitness Zone
Chi-Squared
Test Have PE 3 or
More Days/Week
Have PE Less Than 3
Days/Week
Total % N % P-Value
BMI 22494 55% 8022 54% 0.0562
PACER 16501 82% 4846 65% < 0.0001
Curl Up 25451 83% 9080 86% < 0.0001
Push Up 20097 58% 6932 64% < 0.0001
Sit and Reach 14883 66% 6413 57% < 0.0001
Trunk Lift 23760 84% 8523 78% < 0.0001
Fitness Measurement
Percent in Healthy Fitness Zone
Chi-Squared
Test Active in PE
> 20 Minutes/Class
Active in PE 20 Minutes or Less
Per Class
Total % N % P-Value
BMI 24794 55% 5612 55% 0.4987
PACER 17501 78% 3759 77% 0.0647
Curl Up 28224 84% 6185 81% < 0.0001
Push Up 22076 61% 4869 56% < 0.0001
Sit and Reach 17581 64% 3647 61% 0.0032
Trunk Lift 26313 83% 5860 81% 0.0012
Fitness Measurement
Percent in Healthy Fitness Zone
Chi-Squared
Test Active 60
Minutes/Day for 7 Days/Week
Active 60 Minutes/Day for < 7 Days/Week
Total % N % P-Value
BMI 9738 58% 20550 53% < 0.0001
PACER 6817 84% 14338 76% < 0.0001
Curl Up 10934 86% 23317 82% < 0.0001
Push Up 8568 65% 18257 58% < 0.0001
Sit and Reach 6843 66% 14328 62% < 0.0001
Trunk Lift 10187 84% 21841 82% < 0.0001
0%
10%
20%
30%
40%
50%
60%
70%
80%
90%
55%
82% 83%
58%
66%
84%
54%
65%
86%
64%
57%
78%
Pe
rce
nt
in H
FZ
PE >= 3 Days/Wk PE < 3 Days/Wk
0%
20%
40%
60%
80%
100%
BMI PACER CurlUp PushUP Sit andReach
TrunkLift
58%
84% 86%
65% 66%
84%
53%
76%
82%
58%
62%
82%
Pe
rce
nt
in H
FZ
Active 60 Minutes/Day Not Active 60 Minutes/Day
0%
10%
20%
30%
40%
50%
60%
70%
80%
90%
55%
78%
84%
61% 64%
83%
55%
77% 81%
56%
61%
81%
Pe
rce
nt
in H
FZ
Active in PE > 20 Minutes Active in PE <= 20 Minutes
Page 90
2010 NCAAHPERD/ NC DPH IsPOD Evaluation
All rights reserved.
90
PHYSICAL ACTIVITY ( Continued)
Active 60 Minutes or More Each School Day
Active 60 Minutes or More on Week-end Days
Fitness Measurement
Percent in Healthy Fitness Zone
Chi-Squared
Test Active >=60
Minutes/Day on School Days
Active < 60 Minutes/Day on
School Days
Total % N % P-Value
BMI 12348 56% 17886 53% < 0.0001
PACER 8498 80% 12604 77% < 0.0001
Curl Up 13901 86% 20283 82% < 0.0001
Push Up 10822 64% 15947 57% < 0.0001
Sit and Reach 8854 64% 12260 63% 0.1809
Trunk Lift 12906 84% 19055 82% < 0.0001
Fitness Measurement
Percent in Healthy Fitness Zone
Chi-Squared
Test Active in PE
> 20 Minutes/Class
Active in PE 20 Minutes or Less
Per Class
Total % N % P-Value
BMI 20456 56% 9774 51% < 0.0001
PACER 14235 80% 6877 74% < 0.0001
Curl Up 23054 85% 11133 80% < 0.0001
Push Up 17903 63% 8861 53% < 0.0001
Sit and Reach 14096 64% 7011 63% 0.0471
Trunk Lift 21541 83% 10425 81% < 0.0001
0%
20%
40%
60%
80%
100%
BMI PACER CurlUp PushUPSit and ReachTrunkLift
56%
80%
86%
64% 64%
84%
53%
77%
82%
57%
63%
82%
Pe
rce
nt
in H
FZ
Active 60 Minutes/Day at School Not Active 60 Minutes/Day at School
0%
10%
20%
30%
40%
50%
60%
70%
80%
90%
BMI PACER CurlUp PushUP Sit andReach
TrunkLift
56%
80%
85%
63% 64%
83%
51%
74%
80%
53%
63%
81%
Pe
rce
nt
in H
FZ
Active 60 Minutes/Day on Week-ends Not Active 60 Minutes/Day on Week-ends
Page 91
2010 NCAAHPERD/NC DPH IsPOD Evaluation
All rights reserved.
91
NUTRITION
3 or More Servings of Fruit/Day
4 or More Servings of Vegetables/Day
3 or More Servings of Milk/Day
PHYSICAL ACTIVITY
Have PE 3 or More Days/Week
Fitness Measurement
Percent in Healthy Fitness Zone
Chi-Squared
Test Have 3 or More Servings Fruit
Per Day
Have Less than 3 Servings Fruit
per Day
Total % N % P-Value
BMI 24898 55% 5337 54% 0.3366
PACER 17285 79% 3805 72% < 0.0001
Curl Up 28183 84% 6015 79% < 0.0001
Push Up 22014 61% 4778 53% < 0.0001
Sit and Reach 17377 64% 3737 61% 0.0003
Trunk Lift 26352 83% 5640 79% < 0.0001
Fitness Measurement
Percent in Healthy Fitness Zone
Chi-Squared
Test
Have 4 or More Servings
Vegetables Per Day
Have Less than 4 Servings
Vegetables per Day
Total % N % P-Value
BMI 15158 56% 14952 53% < 0.0001
PACER 10345 81% 10668 75% < 0.0001
Curl Up 17085 85% 16962 82% < 0.0001
Push Up 13238 62% 13424 58% < 0.0001
Sit and Reach 10617 65% 10400 62% < 0.0001
Trunk Lift 16002 84% 15844 82% < 0.0001
Fitness Measurement
Percent in Healthy Fitness Zone
Chi-Squared
Test Have 3 or More Servings Milk
Per Day
Have Less than 3 Servings Milk per
Day
Total % N %
P-Value
BMI 8346 56% 21881 54% 0.0001
PACER 5955 80% 15137 77% 0.0002
Curl Up 9527 84% 24656 83% 0.0055
Push Up 7469 63% 19273 59% < 0.0001
Sit and Reach 5908 63% 15192 63% 0.5223
Trunk Lift 8918 84% 23056 82% < 0.0001
0%
10%
20%
30%
40%
50%
60%
70%
80%
90%
BMI PACER CurlUp PushUP Sit andReach
TrunkLift
55%
79%
84%
61% 64%
83%
54%
72%
79%
53%
61%
79%
Pe
rce
nt
in H
FZ
3 or more servings Fruit/Day Less than 3 servings Fruit/Day
0%
20%
40%
60%
80%
100%
BMI PACER CurlUp PushUP Sit and Reach TrunkLift
56%
80%
84%
63% 63%
84%
54%
77%
83%
59%
63%
82%
Pe
rce
nt
in H
FZ
3 or more servings Milk/Day Less than 3 servings Milk/Day
0%
10%
20%
30%
40%
50%
60%
70%
80%
90%
BMI PACER CurlUp PushUP Sit andReach
TrunkLift
56%
81% 85%
62% 65%
84%
53%
75%
82%
58% 62%
82%
Pe
rce
nt
in H
FZ
4 or more servings Vegetables/Day Less than 4 servings Vegetables/Day
Page 92
2010 NCAAHPERD/ NC DPH IsPOD Evaluation
All rights reserved.
92
NUTRITION (Continued)
Ate Breakfast 7 Days/Week
Ate Dinner at Home 5 or More Days/Week
Fitness Measurement
Percent in Healthy Fitness Zone
Chi-Squared
Test Ate Breakfast 7
Days/Week Ate Breakfast 7
Days/Week
Total % N % P-Value
BMI 19416 58% 10656 48% < 0.0001
PACER 13675 82% 7287 71% < 0.0001
Curl Up 21993 85% 12004 81% < 0.0001
Push Up 17110 62% 9483 55% < 0.0001
Sit and Reach 13601 65% 7396 61% < 0.0001
Trunk Lift 20604 83% 11190 81% < 0.0001
Fitness Measurement
Percent in Healthy Fitness Zone
Chi-Squared
Test
Ate Dinner at Home 5 or
More Days/Week
Ate Dinner at Home < 5
Days/Week
Total % N % P-Value
BMI 22471 56% 7537 50% < 0.0001
PACER 15599 79% 5327 74% < 0.0001
Curl Up 25345 84% 8579 80% < 0.0001
Push Up 19760 62% 6817 55% < 0.0001
Sit and Reach 15573 64% 5369 62% 0.0288
Trunk Lift 23670 83% 8056 82% 0.0063
0%
10%
20%
30%
40%
50%
60%
70%
80%
90%
BMI PACER CurlUp PushUP Sit andReach
TrunkLift
58%
82% 85%
62% 65%
83%
48%
71%
81%
55%
61%
81%
Pe
rce
nt
in H
FZ
Breakfast 7 Days/Week Breakfast < 7 Days/Week
0%
10%
20%
30%
40%
50%
60%
70%
80%
90%
BMI PACER CurlUp PushUP Sit andReach
TrunkLift
56%
79%
84%
62% 64%
83%
50%
74%
80%
55%
62%
82%
Pe
rce
nt
in H
FZ
Dinner at Home >= 5 Days/Week Dinner at Home < 5 Days/Weeks