I/Spring 2001 HEALTH SYSTEM WATCH Supplement of the journal Soziale Sicherheit (Social Security) by the Institute for Advanced Studies / Institut für Höhere Studien (IHS) - IHS HealthEcon Edited by the Hauptverband der österreichischen Sozialversicherungsträger (Federation of Austrian Social Security Institutions) Health expenditure in the EU: No public sector without the private one Focus: The Austrian hospital sector – one system or nine? Maria M. Hofmarcher, Monika Riedel* Summary The health sector in Austria is growing faster than the national economy, the primary example of this being public health expenditure. Price inflation in the privately financed health sector remained constant over the last few years and was slightly below general price growth, which could be explained by rising competition. Health is and remains, however, a good that is highly valued by Austrians, who display consumer behaviour typical of that in industrial countries and thus substantiate the hypothesis that health is a „luxury good“. This is also shown in particular in that private health expenditure is increasing significantly more than public spending with Austrians perhaps favouring private individual payments over expenditure for private health insurance. Hospitals in all of the Länder have been increasing the number of cases they treat and optimising performance points since the introduction of performance-oriented hospital financing (LKF). This behaviour is in accord with international experience and corresponds to supply-induced demand or DRG creep (point maximisation) as indicated in the literature. In addition, the budgeting of the hospital sector shifts the risk onto the owners of the hospitals and thus increases the incentive to behave in such a manner. A further reaction to the budgeting was that – within the legal boundaries – in each Land a specific financing and organisational structure was formed for hospitals. It has turned out that hospital-holdings are a greater burden on Länder budgets than decentralised hospitals. The different forms of LKF-systems in the Länder has, however, led to the system being exploited to varying degrees. The further structuring of the financing system should therefore either take this into consideration or measures should be taken to standardise the systems. *We would like to thank Gerald Röhrling for his assistance.
Transcript
I/Spring 2001
HEALTH SYSTEM WATCH Supplement of the journal Soziale Sicherheit (Social Security) by
the Institute for Advanced Studies / Institut für Höhere Studien (IHS)
- IHS HealthEcon
Edited by the Hauptverband der österreichischen
Sozialversicherungsträger (Federation of Austrian Social Security Institutions)
Health expenditure in the EU: No public sector without the private one
Focus: The Austrian hospital sector – one system or
nine?
Maria M. Hofmarcher, Monika Riedel*
Summary
The health sector in Austria is growing faster than the national economy, the primary
example of this being public health expenditure. Price inflation in the privately financed
health sector remained constant over the last few years and was slightly below general price
growth, which could be explained by rising competition. Health is and remains, however, a
good that is highly valued by Austrians, who display consumer behaviour typical of that in
industrial countries and thus substantiate the hypothesis that health is a „luxury good“. This
is also shown in particular in that private health expenditure is increasing significantly more
than public spending with Austrians perhaps favouring private individual payments over
expenditure for private health insurance.
Hospitals in all of the Länder have been increasing the number of cases they treat and
optimising performance points since the introduction of performance-oriented hospital
financing (LKF). This behaviour is in accord with international experience and corresponds
to supply-induced demand or DRG creep (point maximisation) as indicated in the literature.
In addition, the budgeting of the hospital sector shifts the risk onto the owners of the
hospitals and thus increases the incentive to behave in such a manner. A further reaction to
the budgeting was that – within the legal boundaries – in each Land a specific financing and
organisational structure was formed for hospitals. It has turned out that hospital-holdings are
a greater burden on Länder budgets than decentralised hospitals. The different forms of
LKF-systems in the Länder has, however, led to the system being exploited to varying
degrees. The further structuring of the financing system should therefore either take this into
consideration or measures should be taken to standardise the systems.
*We would like to thank Gerald Röhrling for his assistance.
HEALTH SYSTEM WATCH 1/2001 2
Public health expenditure in the EU is flowing more sluggishly than ever
During the 1990s the share of total health expenditure attributed to the public sector fell on
average in Europe (1990: 78.0 per cent; 1998: 75.2 per cent). This share was 70.5 per cent
in Austria in 1998, a decline of around 3 percentage points since 1990. The decline in the
proportion of public health expenditure between 1990 and 1998 in Austria corresponds
exactly to the decline in the 12 countries that form the European currency union, although
the level of the proportion in Austria (70.5 per cent) is around 3 percentage points lower than
the EU-12 average (73.6 per cent). The public share of total health expenditure in the 13
accession countries converged in the 1990s and in 1998 it was only 5 per cent higher than
the EU-15 mean. The central and Eastern European countries applying for EU membership
had a share of 82.2 per cent and in 1998 were nine per cent above the EU average (see
table A5).
The share of public spending on health in Austria is comparatively low: Only four EU-
countries have a lower level of public sector health expenditure as a proportion of total health
expenditure than Austria, only one of these (the Netherlands) can be classified as a social
insurance country. For Austria the data shown in the OECD data bank from October 2000 in
fact indicate a further slight decline in the proportion of public health expenditure (1990: 73.5
per cent, 1998: 70.5 per cent). According to the most recent values calculated by Statistik
Austria the public share of health expenditure has, after a slight decline, virtually reached the
level that it was at in 1995 (1995: 72.3 per cent, 1999: 72.1 per cent). But even according to
these figures public health expenditure in Austria forms a below average share when
compared to the EU.
Internationally, per capita health expenditure is the most common measurement used to
compare expenditure levels between countries. In contrast to the figures for ‘health
expenditure as a percentage of GDP‘, Austria is above the weighted EU average when
average per capita health expenditure is considered (see table A3). A position above the
EU-average for per capita health expenditure is logically consistent for Austria because: As a
net contributor Austria is one of the richer EU countries and the literature points frequently to
a positive relationship between income and demand for health services. 1 In terms of per
capita GDP Austria occupies 5th place within the EU and is eleven per cent above the
weighted average (see table A2).
1 e.g. Gerdtham U., J. Sogaard, B. Jönsson, F. Andersson (1992): A pooled cross-section analysis of the health care expenditures of the OECD countries. Zweifel P., H. E. Frech (eds.): Health Economics Worldwide. Kluwer. 1992; also cf. HSW I/1999.
HEALTH SYSTEM WATCH 1/2001 3
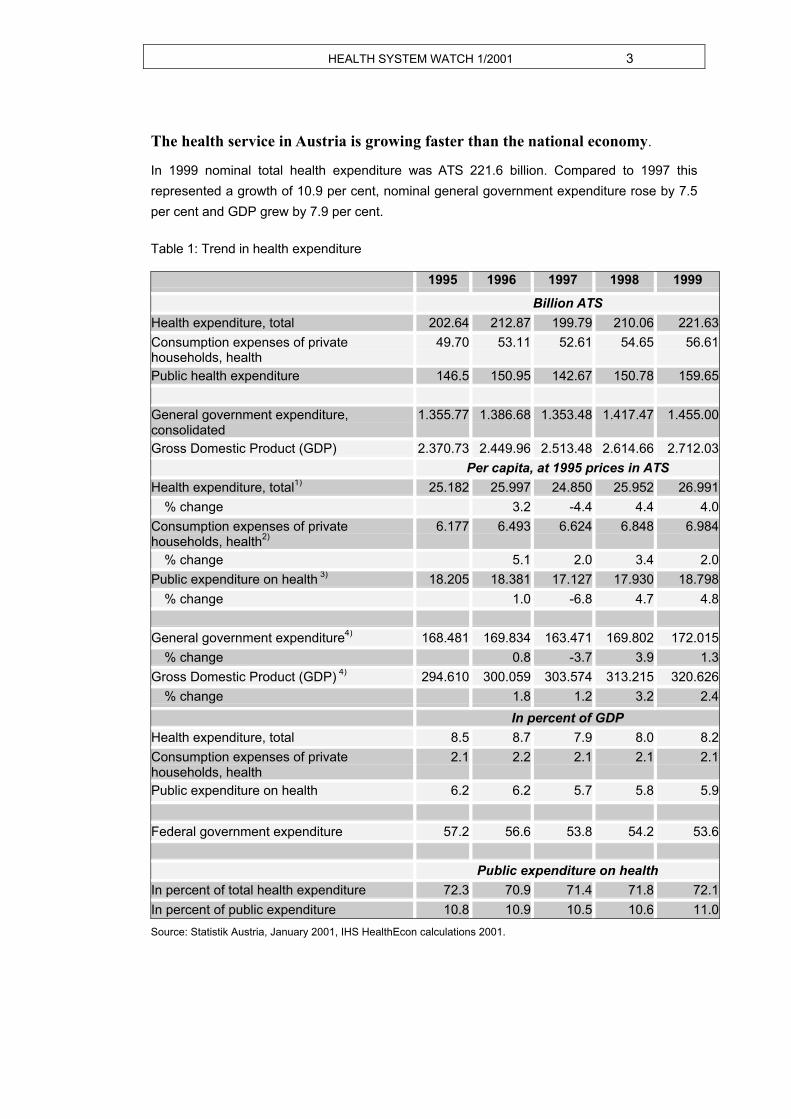
The health service in Austria is growing faster than the national economy.
In 1999 nominal total health expenditure was ATS 221.6 billion. Compared to 1997 this
represented a growth of 10.9 per cent, nominal general government expenditure rose by 7.5
per cent and GDP grew by 7.9 per cent.
Table 1: Trend in health expenditure 1995 1996 1997 1998 1999
Billion ATS
Health expenditure, total 202.64 212.87 199.79 210.06 221.63
Consumption expenses of private households, health
49.70 53.11 52.61 54.65 56.61
Public health expenditure 146.5 150.95 142.67 150.78 159.65
Consumption expenses of private households, health
2.1 2.2 2.1 2.1 2.1
Public expenditure on health 6.2 6.2 5.7 5.8 5.9
Federal government expenditure 57.2 56.6 53.8 54.2 53.6
Public expenditure on health
In percent of total health expenditure 72.3 70.9 71.4 71.8 72.1
In percent of public expenditure 10.8 10.9 10.5 10.6 11.0
Source: Statistik Austria, January 2001, IHS HealthEcon calculations 2001.
HEALTH SYSTEM WATCH 1/2001 4
Nominal GDP and nominal private health expenditure grew around 14 per cent between
1995 and 1999, public health expenditure increased nine per cent.
In terms of annual, real per capita expenditure it can be observed that the health service
grew significantly more than GDP between 1998 and 1999. While economic growth was 3.2
per cent in 1997, the health sector grew by 4.4 per cent and thus by 1.2 percentage points
more than real per capita GDP. As a result of the more subdued GDP growth in 1998, this
margin increased to 1.6 percentage points although the per capita growth of the health
service fell from 4.4 per cent to four per cent.
With a decline in the growth of private per capita expenditure from 3.4 per cent in 1998 to 2.0
per cent in 1999, the growth dynamics of private consumption appear to be in line with
economic growth.
National economic inflation was more dynamic over the last two years than inflation in the
health service. However, this may only have been the case for private consumption.
Economic growth and the growth of public health expenditure drifted apart significantly: The
decline in economic growth from 3.2 per cent in 1998 to 2.4 per cent in 1999 was
accompanied by an acceleration in growth in the public health sector, which reached 4.7 per
cent in 1998 and 4.8 per cent in 1999.
Total health expenditure as a proportion of GDP was 8.2 per cent in 1999, 0.3 percentage
points below the 1995 level; the proportion of public health reached 5.9 per cent.
With regard to health expenditure in relation to GDP, Austria (with 8.2 per cent) was below
the European average (8.7 per cent, see table A4) in 1998. The Austrian value is the ninth
highest or seventh lowest in the EU. Of the six social insurance countries (Bismarck type) in
the EU, only Luxembourg spent a lower share on health than Austria. The rates of the other
Bismarck countries (D, F, B, NL) are all higher than that of Austria.
Despite declining spending on private health insurance, private health expenditure is growing strongly…
Privately financed health expenditure grew 29 per cent between 1995 and 1999. In 1999
health expenditure financed by contribution revenues was 13 per cent above the 1995 level.
(figure 1) The share financed by private health insurance fell by three per cent.
HEALTH SYSTEM WATCH 1/2001 5
Chart 1: Growth dynamics of health expenditure, 1995-1999
1 2 9
1 0 2
8 3
1 1 3
9 7
0
5 0
1 0 0
1 5 0
Out of pocket spendings of privatehouseholds
Taxes
Private health insuranceContributions
Other f inancing sources
1995=100
1999
Source: Statistik Austria, January 2001, IHS HealthEcon Calculations 2001.
......and the proportion of health expenditure financed by them is growing
The share of privately financed health expenditure increased from 14.1 per cent of total
health expenditure in 1995 to 16.6 per cent in 1999 and thus by 2.5 percentage points. The
increasing financial burden on private households primarily goes hand in hand with lower
financing volumes from private health insurance and other sources of finance.
Supplementary private health insurance financed 7.1 per cent of health expenditure in 1999
and roughly eight per cent in 1995 (figure 2).
HEALTH SYSTEM WATCH 1/2001 6
Chart 2: Sources of Finance in the Austrian health sector, 1995 and 1999 shares in percent
45.9
5.77.9
14.1
26.4
4.37.1
16.6
24.7
47.3
Contributions
Taxes
Out of pocket spendings ofprivate households
Private health insurance
Other financing sources
1995
1999
Source: Statistik Austria, January 2001, IHS HealthEcon Calculations 2001.
Although the share of health expenditure that was financed publicly remained fairly constant
between 1995 and 1999 (see table 1), there was a slight shift in the financing shares within
public expenditure: The share of health expenditure financed by taxes decreased from 26.4
per cent in 1995 to 24.7 per cent in 1999; the share financed by contributions increased from
45.9 per cent to 47.3 per cent2.
Public health expenditure is mainly financed by social health insurance contributions.
While 62 per cent of public health expenditure was financed by contributions from enrollees
in 1995, the share was 65.7 per cent in 1999. The share of health expenditure financed by
contributions as a proportion of GDP was 3.9 per cent in 1999, an increase of around 0.2
percentage points since 1997.
Total expenditure financed by social health insurance was ATS 133.4 billion in 1999 and
exceeded the 1995 level 18 per cent (see figures 1 and 3).
2 Including the contribution of social health insurance to hospital financing, which since 1995 has been entered into the national accounts according to ESVG95 as a transfer between public legal representatives and therefore no longer appears explicitly.
HEALTH SYSTEM WATCH 1/2001 7
Chart 3: Development of revenues and expenditures of social health insurance, nominal 1995=100
114107 109
118112
118111
168
0
20
40
60
80
100
120
140
160
180
Gro
ss D
omes
ticP
rod
uct
Pu
blic
exp
en
ditu
re
He
alth
exp
en
ditu
re,
tota
l
Re
ven
ue
s, to
tal
Re
ven
ue
s:co
ntr
ibu
tion
s, in
sure
d
Exp
en
ditu
re, t
ota
l
Pharm
ace
utic
als
Adm
inis
tratio
n a
nd
cle
ari
ng
exp
en
se
In A
TS
, 1995=
100
1996
1997
1998
1999
Sources: HVSV, Statistik Austria, January 2001, IHS HealthEcon 2001.
94 per cent of total health insurance expenditure is health-related insurance benefits which is
mostly inkind benefits. Of the insurance benefits expenditure around 30 per cent is used for
the hospitals sector, 26 per cent for primary care and 20 per cent for medicines. Expenditure
on medicines (+68 per cent) and therapeutic products / medical aid (+41 per cent) grew the
most during the observation period of 1995 to 1999.
Administrative expenditure was 3.6 per cent of total health insurance spending in 1999 and
was 11 per cent higher then than in 1995. This increase was three percentage points below
the GDP growth of 14 per cent and 7 percentage points below the increase in health
insurance expenditure (+18 per cent).
Revenues from insurance contributions increased 12 per cent during the same time period;
this growth was two percentage points below GDP growth and one percentage point above
the growth in administrative expenditure. Co-payments and user charges have been the
strongest growing sources of revenues since 1995 and in 1999 were 69 per cent greater
than the 1995 level. Total revenues including that from co-payments and other sources grew
18 per cent.
HEALTH SYSTEM WATCH 1/2001 8
The Austrian hospital service – one system or nine?
The allocation of legal responsibility in the health sector
As in all social insurance countries the health service in Austria is characterised by financing
pluralism. The Austrian Constitution stipulates that responsibilities for almost all areas of the
health care system - with a few exceptions in legislation and implementation – lie with the
Federal Government. In so far as the Länder are also allocated responsibilities, the Federal
Government and the Länder (states) have agreed to ensure health care delivery within
statutory agreements (Article 15a agreements) which outline the scope of their respective
responsibilities.
In the hospital sector the Federal Government is responsible for basic law; responsibility for
enacting legislation and for implementation lies with the nine Länder. The last so-called
Article 15a Agreement, which regulated the first four years of the new performance-oriented
hospital financing system (LKF-System), ran out on 31.12.2000.
Within the framework of this focus contribution the diversity of a supposedly standardised
system shall be illustrated and substantiated with figures using the example of the hospital
sector in order to then ask the question of whether this diversity is justified in a country with
scarcely more than 8 million inhabitants.
News from the financing of hospitals – is there any?
For around 45 per cent of all hospitals, the so-called fund hospitals, performance-related
invoicing came into effect as a result of the 1997 Article 15a Agreement. Around 70 per cent
of bed capacity and around 80 per cent of hospital personnel are concentrated in fund
hospitals.
The follow-up ruling agreed in December 2000 for the Article 15a Agreement for the time
period 01.01.01 - 31.12.04 adopted the regulations of the old agreement in many aspects.
However, from this point on the objectives associated with the LKF-system were
incorporated into the agreement. In the negotiations the Länder could not reach a unified
agreement on the financing volume of the regional funds or on a predominant distribution
mechanism of the available regional funds according to an unweighted nationwide LKF-core
system3. Precisely these measures were, however, recommended in a report from the audit
division4. Under the new regulations the possibility remains for the individual Länder, within
the framework of the LKF-system, to continue to organise their financing differently. These
3 The budget committee’s report on the government bill (395 of the supplements): Agreement according to Art. 15a B-VG about the restructuring of the health service and the financing of hospitals together with enclosed article number 410 of the supplements to the Stenographischen Protokollen des Nationalrates XXI. GP. 4 Observation report from the audit division about the reform of the health service and hospital financing, 12 July 2000, pp.12.
HEALTH SYSTEM WATCH 1/2001 9
differences concern the delimitation between the core system and the fund control system5,
the distribution of methods of control to the individual hospitals, the compensation for the
activities of hospital out-patient departments as well as covering possible hospital losses.
Table 2 shows the minimum resources of the state funds, which are then distributed
according to defined quotas. In 1999 those minimum resources financed around 51 per cent
of the final costs6 of the fund hospitals.
Table 2: Funding of hospitals (minium required amounts in Mio ATS)
In percent of
1997 1998 1999 2000 2001 in % 2001
VAT-volume
Contributions by federal government 6.119 6.185 6.333 6.407 6.584 12.7
VAT-share 1.416 2.788 2.855 3.003 3.077 3.254 6.3
a) Flat amount so far acc. art.12 (4) 2 330 330 330 330 330 0.6
Around four fifths of the minimum resources of the regional funds come from social health
insurance funds. This amount is an annually indexed flat rate which is supplemented by co-
payments. The indexing of the flat rate depends on the development of the social health
insurance revenues. In 1999 around 41 per cent of the final costs of fund hospitals were
financed by the social health insurance flat rate.
The Länder, depending on their respective regional regulations, put further resources into the
state funds, for example to cover surplus spending. The structure for raising minimum funds
has been relatively constant since the introduction of the new financing method: the
structural fund contributes just 13 per cent to the resources of the state funds and is pooled
from Federal funds, roughly half from defined flat rates in accordance with Article 12 § 4 of
the Article 15-a agreement and half from a fixed share of 1.416 per cent of the VAT tax
5 Within the framework of the core system individual diagnosis groups are assigned standard flat rate point values nationwide. The control system is arranged by states and allows for consideration of state specific requirements by considering criteria specific to the structure (type of hospital, personnel factor, technical equipment, building sturcture, utilization of capacity and hotel components). For an explanation of the LKF-system cf. BMSG, Leistungsorientierte Krankenanstaltenfinanzierung (LKF) - Modell 2001 and descriptions from previous years. 6 Final costs inclusive of depreciation, final costs are adjusted for cost reductions and in-house settlements; cost reductions occur for example when non-medical services which are produced by a hospital for a demand external to the hospital are performed.
HEALTH SYSTEM WATCH 1/2001 10
revenue. Länder (0.949 per cent) and local authorities (0.642 per cent) likewise make their
(minimum) contribution to the state funds in the form of a fixed share of VAT tax revenue.
Due to the budgeting of the resources from social health insurance the risk of expenditure
development now rests solely with the owners of the hospitals or with the regional
administrative bodies. In Carinthia, for example, the province’s share of the fund resources
tripled in the first two years of the LKF-system, but while the contribution from social insurers
did increase by ATS 20 million, from a relative perspective it fell from 81 per cent to 67 per
cent7.
Further contributions to hospital financing from Federal funds are stipulated in the Federal
Hospitals Act (KAG) or in the Health and Social Sector Contribution Act (GSBG). The
Federal Government thus makes a targeted contribution towards the operational deficit of a
maximum of 18.75 per cent of the total surplus operating costs (§57 KAG). Under the title of
Clinical Additional Expenditure the Federal Government reimburses university hospitals for
the additional expenses that arise from construction, decorating and expansion as well as for
work that is necessary for teaching (§55 KAG). The cost of this was still estimated at ATS
5,000 million for the year 2000.
All expenditure that is above the level of the minimum funds allocated to the hospitals (the
so-called ‚operational deficit‘) must be borne by the legal holder/owner of the hospital, by the
Land, by the municipality and by the hospital district (in essence the local authorities in the
hospital’s catchment area). What share of the deficit the individual bodies concerned must
bear is subject to provincial legislation; the combined shares from the holders, the
municipality and the hospital district must, however, cover at least half of the “deficit” (§34
KAG). When the Land is also the owner of the hospital, the burden of the “deficit” is
correspondingly greater.
Länder management in hospitals
When all details are taken into consideration each Land can be seen to have its own system
of hospital financing8. These differences are presented here systematically. The first
criterion to be considered is the delimitation between the core system and the fund control
system.
7 Observation report from the Carinthia audit division 2000/2, issued 28th July 2000. 8 Dienesch S., G. Heitzenberger, Krankenanstaltenfinanzierung 9 mal anders, Österreichische Krankenhauszeitung 38, 12/1997, pp. 5-8; Rauner M. S., M. M. Schaffhauser-Linzatti, Evaluation of the new Austrian inpatient reimbursement system, In De Angelis, Ricciardi, Storchi (eds.), Monitoring, evaluation, planning health services. 1998, various observation reports from the Austrian audit division about the reform of the health service and hospital financing.
HEALTH SYSTEM WATCH 1/2001 11
Features of LKF-financing
• Marginal / No consideration of the control system: In Upper Austria the
opportunity to allocate resources according to qualitative criteria is not made use of
at all. In Lower Austria only two per cent of resources are distributed according to
this type of criteria, the type of hospital being the decisive factor in determining this.
• Fixed shares for the fund control and core system: In Voralberg, Tyrol and
Burgenland there is a fixed percentage distribution of resources for the core and
control system. In Voralberg this is 15 per cent and in Tyrol and Burgenland it is 30
per cent.
• Weighting of LKF-points according to criteria in the control system: Carinthia,
Styria and Vienna have not set a fixed percentage delimitation of the resources from
the core and control sector, instead they multiply the obtained points by a control
factor before the resources are distributed. Carinthia and Styria assign the
weighting factors to the types of hospitals in different ways, Vienna constructs
weights from a multiplied combination of a personnel factor and additional costs
factor.
• In Salzburg a mixture of fixed delimitation and weighting is used. The total
resources are divided into sections of which 75 per cent of the resources from the
first section (social insurance and KRAZAF funds) are to be distributed unweighted
according to care levels and 25 per cent weighted according to care levels. 40 per
cent of the resources from the second section (Land and local authority section) are
allocated according to past “operational deficits” and 60 per cent according to
weighted LDF points. As a result of the method of division used in Salzburg an
average proportion of 56 per cent was allocated to the core sector and 44 per cent to
the control sector in 1997 and 1998 according to the audit division’s report. As such
Salzburg has the largest control system by far in relative terms.
HEALTH SYSTEM WATCH 1/2001 12
Table 3: Structure of hospital financing arrangements in the Länder
Source: Rechnungshof 2000, IHS HealthEcon 2001.
Features of self-financing
To what extent and in what form the Länder finance their hospitals is regulated according by
Länder. In Burgenland, Lower Austria and Tyrol all resources are put into the funds, no
resources are retained outside of the funds. In all of the Länder except Carinthia and Styria9
self-financing restrictions are provided for by the Länder. The budgeting assures the
incentive for hospital holders to avoid spending surpluses. Thus for example in Salzburg,
Tyrol and Lower Austria there were no spending surpluses in 1997 and 1998.
In Upper Austria, Voralberg and in part in Vienna “operational deficits” are allocated on a
percentage basis, which slightly weakens the incentive to operate economically. For
example, in Voralberg the state and the local authorities each bear 40 per cent of the deficit
and the remaining 20 per cent is borne by the legal holders of the hospitals. Of the hospitals’
deficit 50 per cent was transferred to a balancing fund that exists within the fund and 50 per
cent of any deficits were settled from this. The legal holders had to pay for the remaining
deficit themselves.
9 In Styria an upper limit or minimum contribution was agreed on, deviating from this, however, the province then made resources corresponding to the then requirement available. Cf. Audit division report for Styria 2000/3, pp. 6.
Feature Burgen= land
Carinthia Lower Austria
Upper Austria
Salz= burg
Styria Tyrol Vorarl= berg
Vienna
Fund raising in the state funds. Raising of all resources for the fund incl. owner shares?
yes no yes no no no yes no* no
Limited to covering the net operating deficit?
yes no yes yes: % yes yes yes: % partial:%
Distribution of the resources for in-patients Allocation between core and control sector
70: 30 G1 98: 2 100: 0 G2, % G1 70: 30
85: 15 G1
Allocation of the control resources to individual hospitals
% G2 G2 G2, G3
G2 G2 G4 G5
Out-patient department reimbursement (according to audit division reports) Out-patient reimbursement
A P L** P P P L P P
%... fixed percentage basis G1... Weighting of LKF-Points, no separation between core and control system G2... Weighting according to type of hospital G3... Weighting according to the previous year’s operating deficits G4... Weighting according to personnel factor G5... Weighting according to a personnel factor and additional costs factor which are multiplied together. A... financed by compensation payments L... performance based P... flat rate sum * until 1999 funds were raised to a small extent outside the fund. ** Since 1999
HEALTH SYSTEM WATCH 1/2001 13
In Lower Austria there has not been any deficit cover since the LKF came into effect. The
funds were balanced with the total budget made available, which also included the indexed
owners‘ shares of the province that were granted before the LKF. In Burgenland hospitals
that produce surpluses can put these into reserves. This can also be regarded as an
incentive to operate efficiently.
Financing hospital out-patient departments
Compensation for the activities of hospital out-patient departments is still carried out in the
form of lump sums in most Länder, although the introduction of an LKF system for out-patient
department activities is planned. The fact that expenditure-related compensation of the
service volumes in out-patient departments has still not been introduced was criticised in
reports from the audit division.
In Burgenland out-patient departments are partially financed by means of compensation from
a balancing funds. So far, only in Tyrol and since 1999 in Lower Austria is an LKF-system
already used for hospital out-patient departments.
From an economic point of view, however, the creation of performance-related compensation
geared exclusively towards out-patient departments distorts the optimal allocation of
resources. If a financing system based on flat rates for diagnoses is applied (as the LKF
should after all represent) then the goal of putting resources to their most efficient use can
only be fulfilled if the remuneration for the treatment of a standardised diagnosis is uniform.
Different flat rates for the same diagnosis in out-patient departments and in the in-patient
sector are contrary to the underlying intention10.
Do hospital companies place a greater burden on Länders‘ budgets?
A high net burden11 on Länder budgets appears to exist in those Länder in which a
substantial share of the hospitals are centrally amalgamated as is the case in Vienna, Styria
and Carinthia12. It is noticeable that although the net burden of individual Länder fluctuates
over time, the difference in levels between the Länder remains constant relatively
persistently13. Due to investment-related fluctuations Figure 4 shows the average burdens
for the available years (1994-1998).
10 Stepan A., M. Sommersguter-Reichmann, Analyse des neuen Leistungsorientierten Krankenanstalten-Finanzierungssystems in Österreich. Arbeitspapier, 2001, pp. 9. 11 Net burden = net expenditure for hospitals as a proportion of the total state budget. Net expenditure = balance from the comparison of expenditure relevant to appropriation and quantity from the ordinary and extraordinary budget with income. 12 The correlation between average net burden and the share of beds among centrally held hospitals is 76, the correlation between average net burden and the share of beds among centrally held hospitals is 63 (delimitation of the variables as in figure 4 and table 4). 13 In the last few years there have been major fluctuations in the burdens of Länder budgets as a result of hospital expenditure, which the audit division puts down to differing levels of investment activity.
HEALTH SYSTEM WATCH 1/2001 14
Chart 4: Average net burden of the state housholds 1994 – 1998
Source: Rechnungshof 2000, IHS HealthEcon 2001.
In Vienna the burden on the Land budget (an average of 8 percent) is double that in
Voralberg (4 per cent). The burdens of the other Länder fall significantly behind those of
Vienna, Styria and Carinthia. In the three Länder named up to 75 per cent of beds are
concentrated in hospitals which belong to the state´s hospital association or company. (see
table 4). In Voralberg on the other hand the hospital landscape is organised on a smaller
scale. There is a multitude of hospitals with fewer beds and furthermore practically no
amalgamations under a central holders‘ organisation. In Lower Austria, where the burden of
the state budget is likewise small, many hospitals have certainly amalgamated but with a
series of regional associations rather than with one central association.
0,0
1,0
2,0
3,0
4,0
5,0
6,0
7,0
8,0
9,0
Vie
nna
Sty
ria
Car
inth
ia
Bur
genl
and
Low
erA
ustr
ia
Tyr
ol
Upp
erA
ustr
ia
Sal
zbur
g
Vor
arlb
erg
In p
erce
nt
of
the
ove
rall
bu
dg
et
HEALTH SYSTEM WATCH 1/2001 15
Table 4: Hospitals and beds according to owner 1998
Source: BMSG 2000, IHS HealthEcon 2001.
An increaAn increasing number of cases being treated and point maximisation sing number of cases being treated and point maximisation appears obvious but undesirableappears obvious but undesirable
It is interesting for health policy to determine whether LKF-financing has led to behavioural
changes on the part of the decision-makers in the hospital sector. Firstly, it is relevant
whether the number of cases is increasing and secondly whether evidence exists of a
change in coding habits triggered by the new form of financing14. In addition, it is interesting
to establish whether any possible behavioural changes differ between Länder, especially as
each Land is organising their financing in a different way.
Remuneration systems based on flat rates for cases have been repeatedly criticised. This
criticism is not based solely on theoretical considerations15 but rather is supported by
observations made during the introduction of such systems in other countries16. As long as
the diagnosis is decisive for the payment then the incentive exists to exploit the scope of
interpretation in favour of more highly valued diagnoses (DRG creep). This has already
been experienced internationally17 and a similar mechanism could also take effect in Austria.
In Lower Austria, for example, the sanction mechanism was used in accordance with a
networked data evaluation for a third of the cases invoiced because of point optimisation;
around 8.5 million points (point value in 1998 = ATS 0.986) were deducted. In Tyrol it was
established within the framework of safeguards for data and medical quality that the use of
14 It should, however, be noted that coding habits are certainly not only caused by economic incentives but rather, for example, also caused by the commitment of the local controllings and those reponsible for quality assurance and the safeguarding of data. 15 e.g. Stepan A., M. Sommersguter-Reichmann, 2001, op. cit. 16 Lauterbach K., M. Arnold, Über die Vor- und Nachteile einer leistungsbezogenen Vergütung der stationären Versorgung. Lehren aus den USA für das deutsche Krankenhaus. In Arnold, Paffrath: Krankenhaus-Report '95, Gustav Fischer Verlag, pp. 167-175. 17 Hofmarcher M.M., E. Orosz, Resource Allocation and Purchasing in Hungary, The World Bank 2001.
share sharetotal central unique central, % total central unique central, %
Comment: If no hospital association is established the respective office of the state government was treated as the central holder.
Number of hospitals Number of beds
HEALTH SYSTEM WATCH 1/2001 16
an optimisation programme had resulted in supplementary point correction totalling around
7.25 million points or ATS 5.4 million18.
The error rate for Salzburg was only slightly lower than for Lower Austria. In Salzburg the
proportion of cases that were incorrectly coded even increased between 1997 (28 per cent)
and 1998 (37 per cent) and fell again to around the initial level (27 per cent) in 1999. The
1998 increase should, however, also be seen in context with the new, more detailed
intensive documentation and with the stricter checking procedures. Of the cases queried in
1999 too many services were coded in roughly a quarter and false diagnoses had been
made in 17 per cent19.
An increasing number of cases being treated: how great is the prevalence of supplier -induced demand?
As the individual case being treated now forms the basis of hospital revenue rather than the
hospital day as was the case previously20, economically rational behaviour (with the
assumption of short-term fixed input costs) results in a maximisation of the number of cases
treated each with a shorter length of stay. Under the old system, on the other hand, it was
economically optimal to maximise the number of hospital days, which were charged at a flat
rate. Correspondingly it was to be expected that when the system changed there would be
an increase in the number of cases and a fall in the duration of stay.
A marked increase in the number of in-patients cases occurred in almost all Länder,
frequently followed by a further, similarly large increase in the second year of the LKF. Only
Burgenland showed no obvious increase in the number of cases and in Voralberg the
increase in cases was apparently already anticipated in 1996. The pattern of hospital stay
durations is more ambiguous: viewed over the entire time period from 1994 – 1999 the
average length of stay fell in all Länder except for Vienna. However, on examination of the
individual years, 1997 stands out as having featured a conspicuously large decline in
duration of stays in Upper and Lower Austria.
18 Observation report from the audit division, Lower Austria 2000/10, pp. 22, Tyrol 2000/3, pp. 23. 19 Salzburger Krankenanstaltenfinanzierungsfonds, Report on the Salzburg hospital financing fund (SAKRAF) concerning 1999, Salzburg, April 2000. 20 In the current system the hospital care day is useful only when maximum or minimum values for the duration of stay are exceeded or not reached, and is then organised degressively. It is therefore economically unattractive to extend the duration of stay beyond the upper limit.
HEALTH SYSTEM WATCH 1/2001 17
Chart 5: Changes in the number of inpatient cases
-2
0
2
4
6
8
10
12
14
Aus
tria
Bur
genl
and
Car
inth
ia
Low
erA
ustr
ia
Upp
erA
ustr
ia
Sal
zbur
g
Sty
ria
Tyr
ol
Vor
arlb
erg
Vie
nna
% c
han
ge
ove
r p
revi
ou
s ye
ar
1995
1996
1997
1998
Source: Statistik Austria, IHS HealthEcon 2001.
Point maximisation or morbidity?
The hospital discharge statistics show that the frequency of individual diagnoses made
significant leaps when the LKF system came into effect. An example of this is the diagnoses
from the births and complications of gravidity sector (ICD630-676). In 1994 normal births
(ICD650) nationwide were coded around twice as frequently as complications of gravidity,
birth or puerperal fever (ICD640-648, 651-676). By 1996 the proportion of complications
grew to the cost of the proportion of normal births, the ratio of complications to normal births
was 0.59:1. In 1997 this ratio then shifted sharply to 1.12:1, thus significantly more
complications were coded than normal births. In 1998 the number of complications coded
then fell again to slightly below the number of normal births.
HEALTH SYSTEM WATCH 1/2001 18
Chart 6: Childbirths and complications of gravidity
Source: Hospital discharge statistics according to annual health statistics, current years, IHS HealthEcon.
The decline in the birth rate between 1994 and 1998 was roughly 12 per cent, the decline in
births coded as normal, however, was almost 29 per cent. It therefore appears probable that
the increase in the proportion of complications coded was not caused solely by an increase
in complications during or after pregnancy but rather was also a result of a change in coding
practices.
In the current diagnostic key (model 2000) the flat rate for a normal birth is 19,290 points,
per/postpartale complications are worth 19,998 points and serious peri/postpartale
complications are worth 20,900 points. Without further investigation, however, a more
precise explanation for the change in diagnostic behaviour cannot be given. One possibility
could be that birth complications were previously neglected in the documentation if no further
(financial) consequences were dependent on it and that this neglect has now been
eradicated. It is, however, just as conceivable that the scope for diagnostic interpretation is
now being systematically exploited to gain higher point values. The aforementioned
frequency of false coding in several Länder is grounds for the assumption that there exists a
certain degree of freedom to exploit the system. In the individual Länder the statistics for
1997 likewise show a sharp increase in complications in most cases, the increase is most
pronounced in Upper Austria. There are conspicuous deviations in Voralberg and Vienna:
the proportion of complications increased here to a significantly higher level than the
nationwide average but rather than decreasing again in 1998 it actually increased slightly
more. A growing frequency of complications was registered in Styria in 1997 and 1998 but
the initial level in this Land was so far below the national average that although it doubled,
0,00
0,20
0,40
0,60
0,80
1,00
1,20
1,40
1,60
1,80
Aus
tria
Bur
genl
and
Car
inth
ia
Low
erA
ustr
ia
Upp
erA
ustr
ia
Sal
zbur
g
Sty
ria
Tyr
ol
Vor
arlb
erg
Vie
nna
Rat
io o
f co
mp
licat
ion
s to
no
rmal
ch
ildb
irth
s 19941995199619971998
HEALTH SYSTEM WATCH 1/2001 19
the frequency of complications relative to normal births in 1998 was still lower than in any
other state. In 1994 in Styria around three times more normal births were coded than
complications. Styria (0.30:1) therefore already deviated conspicuously in 1994 from the
ratios of the other Länder which ranged from 0.47:1 (Voralberg) to 0.63:1 (Vienna).
The frequent diagnosis of complications in connection with gravidity, birth and puerperal
fever could also explain why the average length of stay in Vienna is relatively low in the case
of both normal births (1998 Austria 6.0; Vienna 5.3) and complications (1998 Austria 6.2;
Vienna 5.5). A similar argument can be made in Styria where complications are diagnosed
comparatively rarely and the duration of hospital stay for normal births is the second highest
in the country after Voralberg.
Appendix: Prognosis for the Austrian economy
The symptoms of a cooling-off of the world economy have further intensified. The expected
weakening of the USA economy has set in but is greater than anticipated. Last autumn the
European Commission predicted an economic growth rate of 3.3 per cent for 2001 and 3 per
cent for 2002; at present, however, analysts are questioning whether a growth rate of even 3
per cent will be attainable in the current year. This estimation is supported by the data that
has meanwhile become available. The clear weakening of the American growth rate is
spreading to Europe.
Austria forms no exception to this picture of the economy. For Austria, however, more recent
forecast values can be presented in table A1 than for the USA and the EU, the data are
therefore not directly comparable. Economic growth in Austria will be almost one percentage
point lower in 2001 than last year but could increase again slightly as early as 2002. The
trend in real wages remained significantly behind the trend in work productivity in the year
2000; Austria’s unemployment rate according to the EUROSTAT definition also continues to
remain below half the level of the comparative EU figure. As work force supply will scarcely
increase it can be assumed that despite the weakening economy unemployment will
1) Real annual change in percent.2) Taking into account the definition of EUROSTAT on the basis of labour force data.Source: Austria: Forecast of the Austrian economy 2001-2002, Institute For Advanced Studies, March 2001; EU, USA and HVPI Austria: European Economy, Directorate General of the European Commission Economics and Finance, Supplement A: Economic Analyses No. 10/11 - October/November 2000.
Table A1: Economic Forecast
Gross Domestic Product, at constant prices (percentage changes relative to the previous year)
Inflation (harmonised consumer price index HCPI)(percentage changes relative to the previous year)
Labour productivity (Real GDP per employed person) (percentage changes relative to the previous year)
Number of employees
(in percent of GDP)
(percentage changes relative to the previous year)
Number of unemployed (in percent of the persons in civilian employment)2
Finance surplus/-deficit of the general government
HEALTH SYSTEM WATCH 1/2001 21
Table A2: Per capital Gross Domestic Product, US Dollar, purchasing power parity Index EU15=100
* population weighted average; 1) 1991, 2) 1992; CEE10: entry touting countries without Malta, Turky, Cyprus Sources: OECD Health Data, Oct. 2000; Progress Reports 2000 for all entry touting countries 1995-1999; WHO Health for all database, January 2001 for all entry touting countries 1990 and Malta 1990-1999; IHS HealthEcon 2001.
HEALTH SYSTEM WATCH 1/2001 22
Table A3: Per capita health expenditure, US Dollar, purchasing power parity Index EU15=100
*population weighted average; 1) 1991, 2) 1993; CEE10: entry touting countries without Malta, Turky, Cyprus Sources: OECD Health Data, Oct. 2000; **WHO Health for all database, January 2001; +World Development Indicators 2000; IHS HealthEcon 2001.
HEALTH SYSTEM WATCH 1/2001 23
Table A4: Health expenditure in percent of GDP Index EU15=100
* GDP-weigthed average; 1) 1991, 2) 1992, 3) 1993; CEE10: entry touting countries without Malta, Turky, Cyprus Sources: OECD Health Data, Oct. 2000; WHO Health for all database, January 2001 for all entry touting countries ; +World Development Indicators 2000; IHS HealthEcon 2001.