61
Israel Advanced Technology Industries Israel’s Life Sciences Industry IATI 2015 Report
Israel AdvancedTechnology Industries
Israel’s Life Sciences IndustryIATI 2015 Report

Israel AdvancedTechnology Industries
iat i.co.il
ISRAEL'S LARGESTUMBRELLA ORGANIZATION
for the High-Techand Life Science Industries
For more information about IATI please contact: T: +972 (0)73-713-6313 | E: iat i@iat i.co.il |
Dear Friends,
Israel’s Life Sciences Industry – IATI 2015 Report presents an overview of the current status of the Israeli life sciences industry. It analyzes industry dynamics and trends while providing insights into the basic ingredients of the industry that has made it such a successful sector: academic excellence, government support, investments, mergers& acquisitions (M&A) and more.
The Israeli Life Science Industry is rapidly and exuberantly growing, while playing an important role in the world healthcare market. Following a decade of significant growth, the Israeli life sciences industry is continually demonstrating encouraging parameters of maturity and promising signs towards a breakthrough decade. Israel’s life sciences industry is innovative, where excellence in academic research, government support and increased availability of funding is translated into commercial success. It is based on a combination of highly educated professionals with entrepreneurial culture, innovative spirit and great technologies.
All efforts were taken to make this report as extensive and detailed as possible to reflect the many different facets of the industry. We trust that you will find it both useful and informative. Please feel free to forward it to others.
Special thanks to IVC Research Center who analyzed its database according to our specific requests.
Warm Greetings IATI Team
Dr. Benny Zeevi Karin Mayer Rubinstein IATI Co-Chairman IATI CEO General Managing Partner DFJ Tel-Aviv Venture Partners All rights reserved for IATI - Israel Advanced Technology Industries (R.A)© ("IATI") . No part of this publication may be reproduced, copied, photocopied, stored in retrieval system, transmitted by electronic, mechanical, photocopying or recording means in any form in whole or in part - without the prior written permission of IATI.
TABLE OF CONTENTS
Introduction ……………………………...................................................................................................................................………... 2 Academic Excellence in Life Sciences ……………………………...……………………………………………………………………………….……... 3 Commercialization Companies Israel- Technology Transfer Offices (TTOs) …………………………..………………… 6
Government Support …………………………………………………………………………………………………………………………………….……….…... 11
The Incubators Program ……………………………………………………………………………………………..………………………..…….…... 13
Accelerators ………………………………………………………………………………………………………………………………………..……………..…….…... 16 2005-2014: A Decade of Growth …………………………………………………………………….…………………………………………..…….…... 17 Israel Life Science Industry Sub-Sectors …………………………………………………………………………………………………….…….…... 19 Global Multinational Life Sciences R&D Centers in Israel …………………………………………………………………..….……... 20
Funding …………………………………………………………………………………………………………………………………………………….…………..………... 21 Israel High-Tech Funding ……………………………………………………………………………………………………………………...………... 21
Israel Life Science Sector – Funding ………………………………………………………………………………………………....………... 23
Breakdoen of Life sciences Investments in Israel ………………………………………………………………………...………... 27
Most Active Life Sciences Investors in Israel ………………………………………………………………………………....………... 33
Israeli Life Sciences Companies on The NASDAQ ………………………………………………………………….……..………... 34
Tel Aviv Stock Exchange (TASE) …………..………………………………………………………………………………………………………... 37
Other Stock Exchanges …………………………………………………………………………………………………………………………………….. 38
Acquisitions of Israeli Life Sciences Companies ……………………………………………………………………………….……..………... 39
Export of Israeli Life Sciences Products …………………………………………………………………..…………………………………………... 46
Healthcare IT and Digital Health……………………………………………………………………………………………………………………………... 47
Israel Healthcare IT and Digital Health Landscape ……………………………………………………………………...………... 48
Number of Companies …………………………………………………………………..………………………………………………………………... 48
Subsectors ………………………………………………………………………………………………………………………………………………...………... 50
Business Models…………………………………………………………………..………………………………………………………………………..…... 53
Funding of the Healthcare IT and Digital Sub-Sector …………………………………………………………………..………... 55
Israel Life Sciences Sector – Opportunities …………………………………………………………………………………………………………. 56

2
The state of The Israel Life Sciences Industry IATI- 2015 Summary Report
Introduction
The Israeli Life Science Industry is rapidly and exuberantly growing, while playing an important role in the world healthcare market. Following a decade of significant growth, the Israeli life sciences industry is continually demonstrating encouraging parameters of maturity and promising signs towards a breakthrough decade. Israel’s life sciences industry is innovative, where excellence in academic research, government support and increased availability of funding is translated into commercial success. It is based on a combination of highly educated professionals with entrepreneurial culture, innovative spirit and great technologies.
Since our last report, published in June 2013, the Israel Life Sciences industry has demonstrated significant growth, record investment amounts with interest from new investors mainly from China and the Far East, increased number of companies in advanced stages of clinical trials, the highest number of successful IPOs of Israeli life sciences companies on the NASDAQ, three record years for life sciences exits in total dollars amount as well as an emergence of a prominent sub sector of Health IT and digital Health. We are confident that Israel's life science companies can contribute in helping solve the major challenges facing the global healthcare systems.
The global healthcare systems are facing many challenges. Worldwide, the pressures of the growing demand for healthcare services—fueled by aging populations and burgeoning middle classes, especially in emerging markets like China and India, along with expectations of higher-quality care and a squeeze on funding—have created a perfect storm that is driving a need for new innovative technologies and business models. The healthcare systems will increase demand for new evidence and definitions for positive health outcomes before using any new technology or services .As the economy rebounds and the baby boomers retire, employers as well as insurers are looking for fresh ways to engage, retain and attract the next generation of health consumers.
In such an environment, the need for heightened efficiencies and increased innovation has never been greater. Accordingly, companies must find new ways to improve the efficiency of their operations, increase their research-and development (R&D) capabilities, tap into alternative sources of innovation and capture new customers—particularly as demand for health care rises in emerging markets.
We are confident that Israeli life sciences companies can sustain in playing a paramount role in the global healthcare industry.

3
Academic Excellence in Life Sciences
To a great extent, the country’s economic achievements rely on Israel’s ability to tap into its available scientific and technological potential. Israel’s scientific research highly contributes to its international status and geopolitical position in the region providing it with a respected place among the developed countries in the world hence acting as leverage for economic growth. Life Sciences represent about 50% of Israeli civilian research activities in its 7 universities, 10 research institutes and 5 medical schools. Israel has one of the highest concentrations of scientists per capita (145 per 10,000). One of every three Israeli scientists specialized in life sciences, which is the world’s highest per capita ratio. The number of scientific publications in Life Sciences is one of the parameters for academic excellence which demonstrates a link between basic research, applied research and industrial development. According to a report published in August 2013 by The Samuel Neaman Institute at the Technion, an independent multi-disciplinary national policy research institute for the National Committee for Civilian Research and Development at the Ministry of Science, Technology and Space, out of 58,210 scientific publications that came out of Israel during 2007-2011, about 45% were related to the various life science sub - sectors while 23.07% came from the leading sub-sector, Clinical Medicine. (Figure 1)
Figure 1: Percentage of Scientific Publications from Israel 2007-2011 according to sub-sectors
The contribution of Israeli Scientific Publications in Life Sciences, to the global scientific publications, related sub - sectors is also substantial as can be seen in Figure 2
Source: The Samuel Neaman Institute at the Technion, Analysis of Thomson Reuters Data, August 2013
4
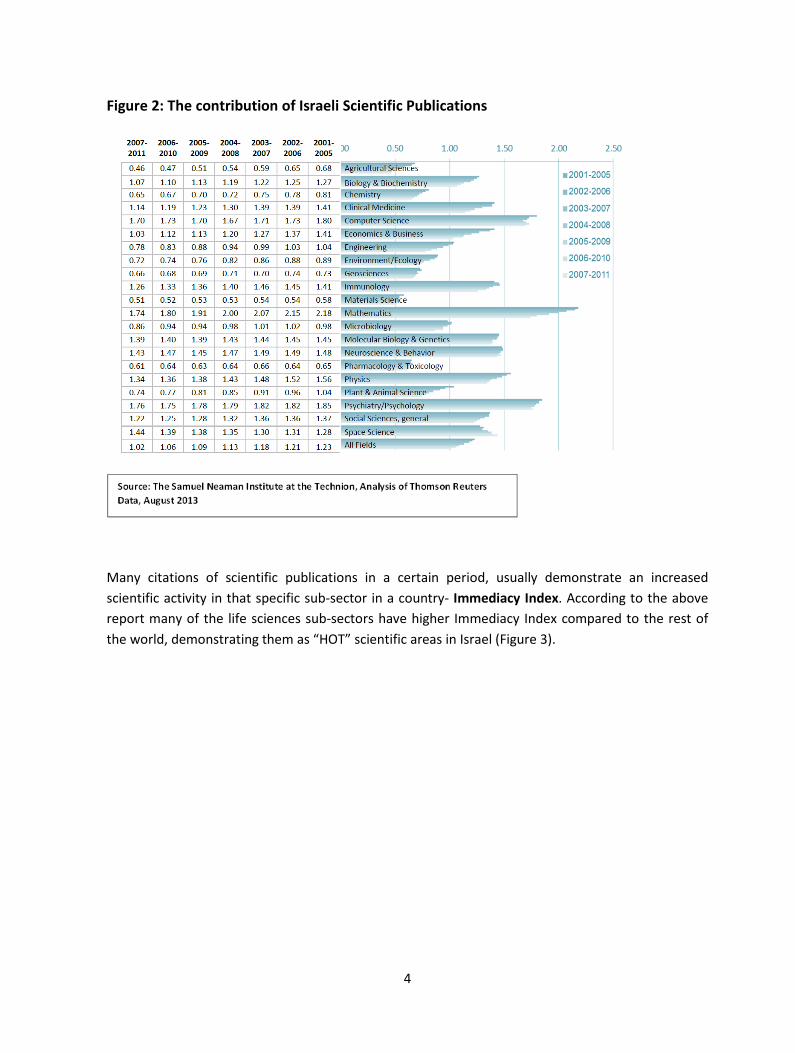
Figure 2: The contribution of Israeli Scientific Publications
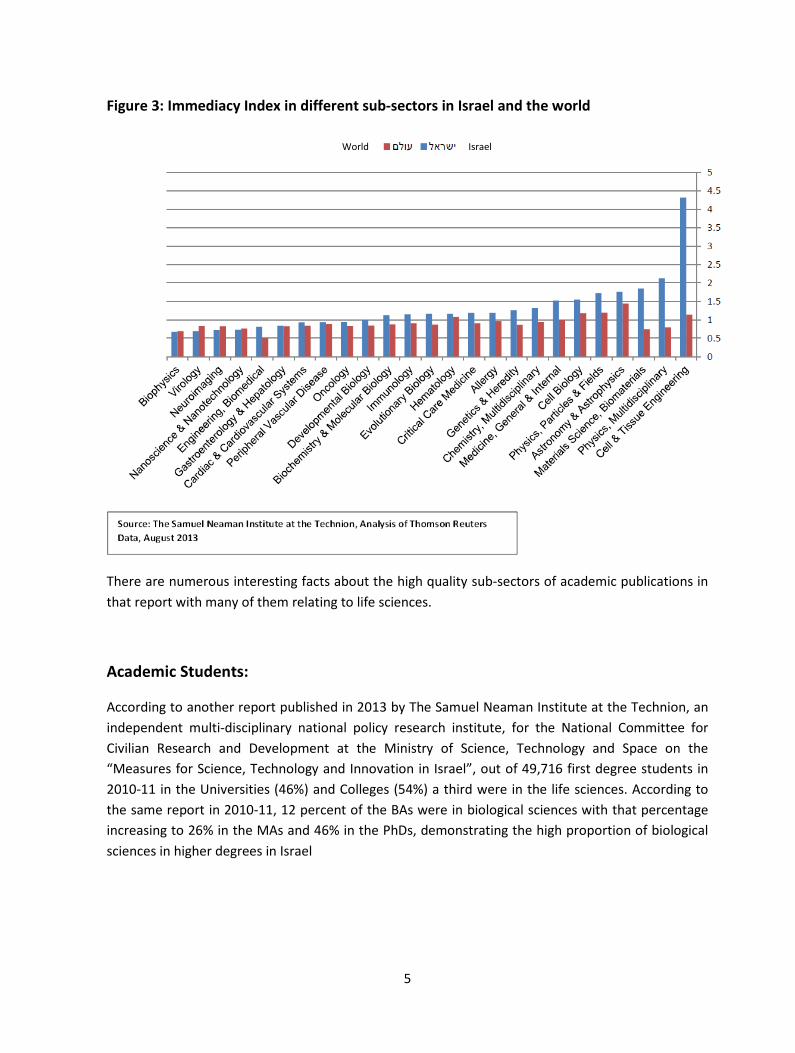
Many citations of scientific publications in a certain period, usually demonstrate an increased scientific activity in that specific sub-sector in a country- Immediacy Index. According to the above report many of the life sciences sub-sectors have higher Immediacy Index compared to the rest of the world, demonstrating them as “HOT” scientific areas in Israel (Figure 3).
5
Figure 3: Immediacy Index in different sub-sectors in Israel and the world
There are numerous interesting facts about the high quality sub-sectors of academic publications in that report with many of them relating to life sciences.
Academic Students:
According to another report published in 2013 by The Samuel Neaman Institute at the Technion, an independent multi-disciplinary national policy research institute, for the National Committee for Civilian Research and Development at the Ministry of Science, Technology and Space on the “Measures for Science, Technology and Innovation in Israel”, out of 49,716 first degree students in 2010-11 in the Universities (46%) and Colleges (54%) a third were in the life sciences. According to the same report in 2010-11, 12 percent of the BAs were in biological sciences with that percentage increasing to 26% in the MAs and 46% in the PhDs, demonstrating the high proportion of biological sciences in higher degrees in Israel
Israel World

6
Commercialization Companies Israel- Technology Transfer Offices (TTOs)
The Central Bureau of Statistics of the State of Israel published a Survey (August 26, 2014) of Commercialization Companies in Israel 2012-2013 relating to Inventions, Patents, License Agreements, Revenues and Startup Companies coming out of the TTOs. The survey was initiated and supported by the Israel National Council for Research and Development, of the Ministry of Science, Technology and Space.
The role of commercialization companies (TTOs) is to search out, develop, and market the knowhow accumulated in the institutions mentioned above, to turn a patent into a commercial product, and help in creating startup companies. Commercialization companies with these activities substantially contribute to the growth of the economy concomitant by increasing the income of the institutions they represent.
The TTOs play a major role in the life sciences industry in Israel with many patents, new start-ups and licensing agreements in the field originating from the eight research universities and eleven research institute and hospitals.
According to the report, Commercialization companies filed 451 original patent applications in 2013, of which 51 were submitted in Israel, and in 2012, 516 original patent applications were submitted, 33 of which were submitted in Israel. The number of original patent applications rose over the period 2008-2013 by 34%.The dominant fields of the original patent applications were medicines (24%), bio-technology (17%), and medical equipment (13%). In 2012, life science related sub sectorscomprised56% of all applications, and in 2013, about 53% of all applications. The main fields of activity in the universities were: Medicines (20%), Bio-Technology (18%), Physics, Electronics and Electro-Optics (14%).The main fields of activity in hospitals were: Medical Equipment (48%) and Medicines (42%).The main fields of activity in research institutions and colleges were: Medicines (33%) and Bio-Technology (26%). (Figure 4)

7
Figure 4: Commercialization Companies in Israel- New Patent Applications, by field, 2012 & 2013
During the years in which the commercialization companies were active under the auspices of the institutions included in the survey, the companies accumulated a large inventory of current patents that were marketed or yet remain to be marketed. This inventory is the inventions portfolio of each company represented here by patent families. As can be seen in Figure 5, the life sciences sub-sectors represent a major part of those patent families. The dominant field of the active portfolio in 2013 was medicines, which was 23% out of total patent families. In 2011, the dominant field was bio-technology, medicines and medical equipment, which was 51% out of total patent families.

8
Figure 5: Commercialization Companies in Israel- Patent Families in the Active Portfolio*, by Field, 2013
*Active portfolio - meaning one patent out of the family patent is operative.
The role of commercialization companies is to market and deliver the knowledge generated in universities, hospitals and research institutions. The conventional way is through license agreements. The number of license agreements that were valid, active or producing royalties in 2012-2013 was 1,966. Most of the agreements were signed with commercialization companies from Israel (71%) with companies from the United States placing second (17%). Most of the new agreements were signed with companies at universities (80%). In the last two years, 2012 and 2013, 259 new license agreements were signed. Of all license agreements, 263 were valid license agreements that produced royalties in 2012-2013; of those, 174 companies in Israel and 89 abroad. The dominant fields of the active license agreements in 2012-2013 were fields which are related to life science: medicines (26%), bio-technology (20%) and agriculture and plants genetics (17%)(Figure 6).

9
Figure 6: Commercialization Companies Israel - Active License Agreements, by Field, 2013
The revenues from sales of intellectual property and gross royalties amounted to NIS 1,881 million in 2012, compared to NIS 1,680 million in 2011, an increase of 11.9%. Most of the revenues from sales of intellectual property (IP) and gross royalties received in 2012 came from Israel - 72%. The dominant field of the received revenues was medicines (94%).The dominant fields of the active license agreements in 2012-2013 were fields which are related to life science: medicines (26%), bio-technology (20%) and agriculture and plants genetics (17%).(Table1)
Table 1: Commercialization Companies Israel - Active License Agreements, by Field, 2013
NIS million
In 2012-2013, commercialization companies were involved in the establishment of 72 start-up companies. The main industries of the start-up companies were scientific research and development (81%) and computer programming (7%).(Table 2)
Other
"Clean" Technology
and Environment
Bio-Informatics
Medical Equipment
Chemistry and Nano
Technology
Bio-Technology
Physics and
Electro-Optics
Agriculture and Plants Genetics
Mathematics and
Computer Science
MedicinesTotalCompanies associated w ith:
1124561135461,7701,881Total
-124561126461,7521,853Universities
---------22Hospitals
1------9-1626 Research institutions and colleges
10
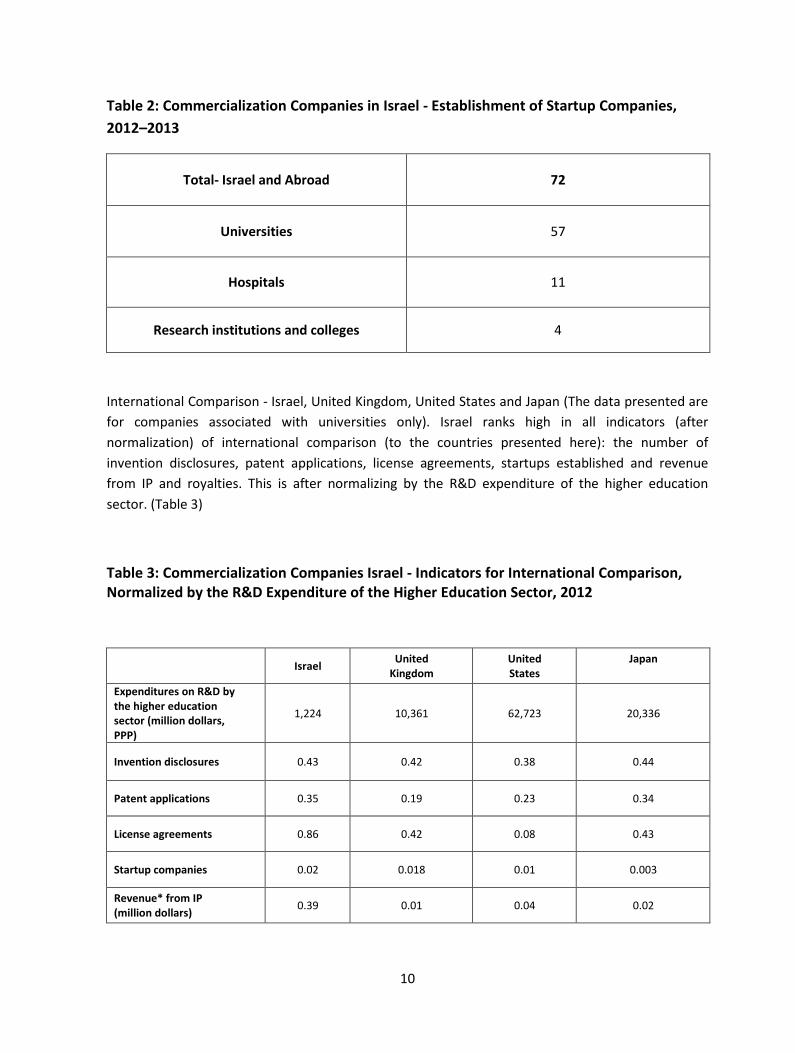
Table 2: Commercialization Companies in Israel - Establishment of Startup Companies, 2012–2013
72 Total- Israel and Abroad
57 Universities
11 Hospitals
4 Research institutions and colleges
International Comparison - Israel, United Kingdom, United States and Japan (The data presented are for companies associated with universities only). Israel ranks high in all indicators (after normalization) of international comparison (to the countries presented here): the number of invention disclosures, patent applications, license agreements, startups established and revenue from IP and royalties. This is after normalizing by the R&D expenditure of the higher education sector. (Table 3)
Table 3: Commercialization Companies Israel - Indicators for International Comparison, Normalized by the R&D Expenditure of the Higher Education Sector, 2012
Japan
United States
United Kingdom Israel
20,336 62,723 10,361 1,224
Expenditures on R&D by the higher education sector (million dollars, PPP)
0.44 0.38 0.42 0.43 Invention disclosures
0.34 0.23 0.19 0.35 Patent applications
0.43 0.08 0.42 0.86 License agreements
0.003 0.01 0.018 0.02 Startup companies
0.02 0.04 0.01 0.39 Revenue* from IP (million dollars)

11
Israel’s scientists and engineers have integrated advanced technologies in electronics, communications, electro -optics, Lasers, IT and others to develop cutting–edge medical devices as well as commercialized defense R&D technologies. Israeli entrepreneurs continually overcome technological barriers and solve development problems quicker and at capital efficiency compared to their larger and more affluent competitors overseas. All Israeli entrepreneurs have been "going global" from day one. With a go-getter attitude embedded in the culture, risk-taking and creativity are encouraged while failures are tolerated.
Government Support
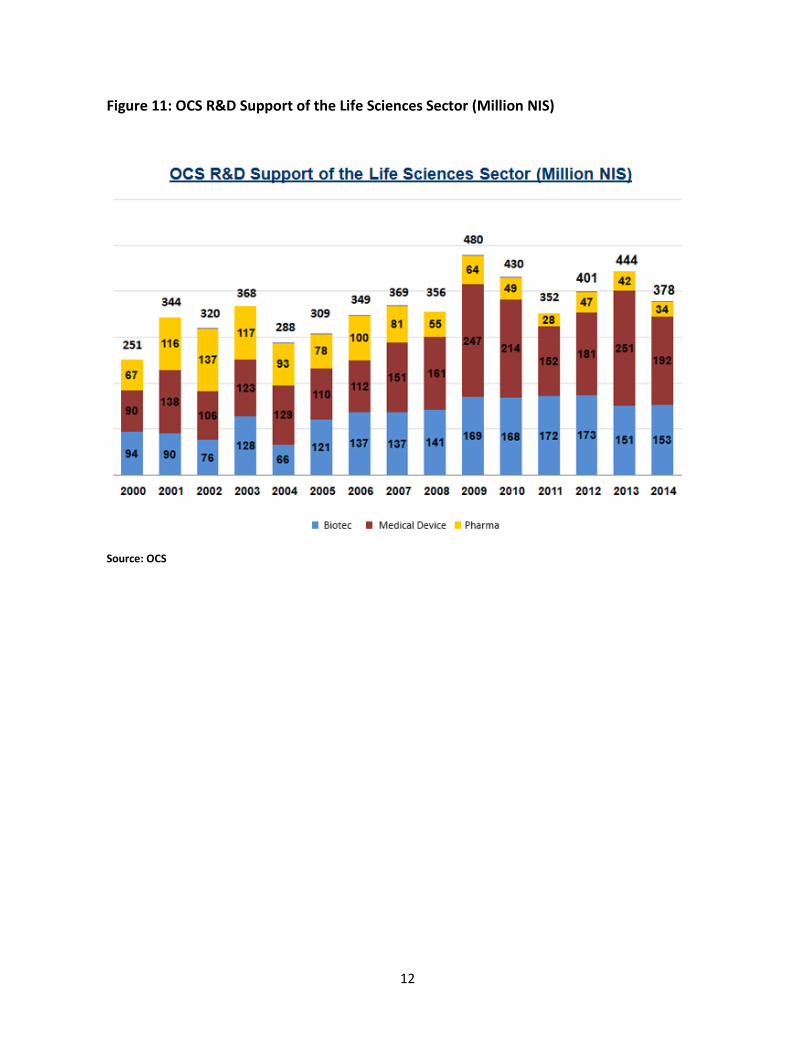
The government of Israel is strongly focused on creating an R&D support network through various grants and incentive programs. The Office of the Chief Scientist (OCS) at the Ministry of Economy is responsible for the funding of industrial R&D programs in Israel and contributes up to 50% of R&D approved expenses of High – Tech companies including that of life sciences companies. During the last decade the OCS invested more than $100 million annually in the life sciences sector via its different programs (Figure 11) including the Incubators program, General Industrial R&D Grants, The Magnet Program (Consortium of academia and industry), Nofar Program (Applied Academic Research), The Kamin program of the OCS is bridging the gap between applied research and the industry, and the TNUFA Program which focuses on linking individual inventors and investors.
12
Figure 11: OCS R&D Support of the Life Sciences Sector (Million NIS)
Source: OCS
13
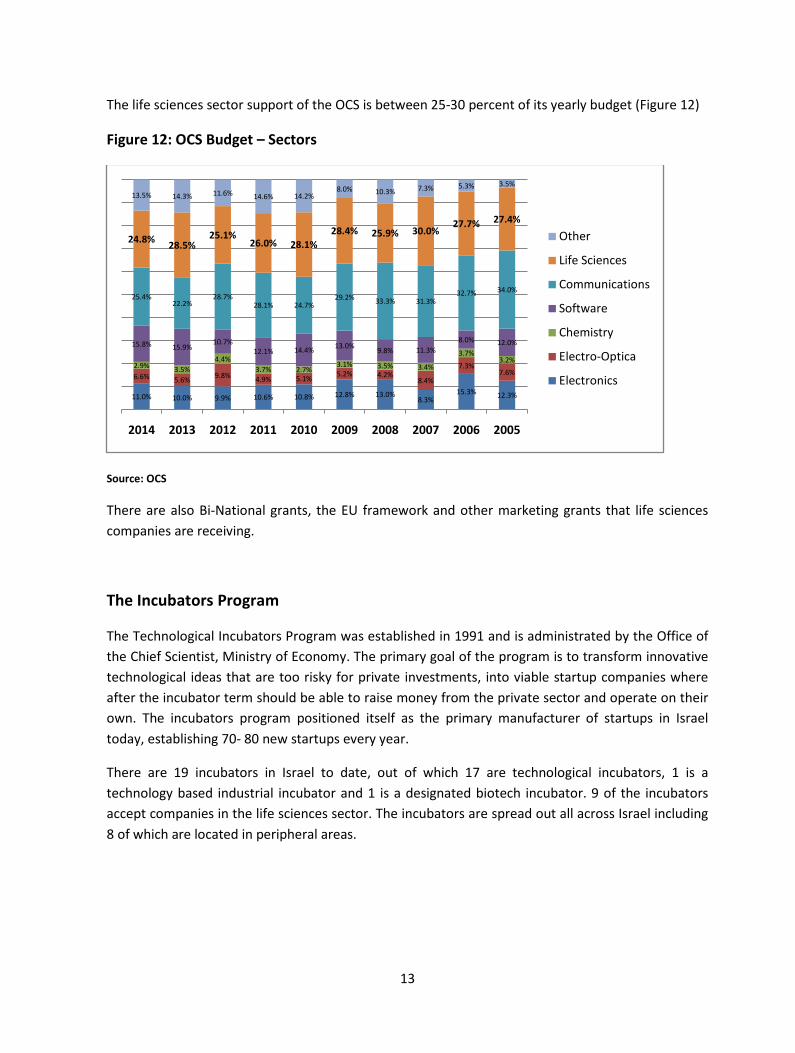
The life sciences sector support of the OCS is between 25-30 percent of its yearly budget (Figure 12)
Figure 12: OCS Budget – Sectors
Source: OCS
There are also Bi-National grants, the EU framework and other marketing grants that life sciences companies are receiving.
The Incubators Program
The Technological Incubators Program was established in 1991 and is administrated by the Office of the Chief Scientist, Ministry of Economy. The primary goal of the program is to transform innovative technological ideas that are too risky for private investments, into viable startup companies where after the incubator term should be able to raise money from the private sector and operate on their own. The incubators program positioned itself as the primary manufacturer of startups in Israel today, establishing 70- 80 new startups every year.
There are 19 incubators in Israel to date, out of which 17 are technological incubators, 1 is a technology based industrial incubator and 1 is a designated biotech incubator. 9 of the incubators accept companies in the life sciences sector. The incubators are spread out all across Israel including 8 of which are located in peripheral areas.
11.0% 10.0% 9.9% 10.6% 10.8% 12.8% 13.0%8.3%
15.3% 12.3%
6.6% 5.6% 9.8% 4.9% 5.1% 5.2% 4.2%8.4%
7.3%7.6%
2.9% 3.5%4.4%
3.7% 2.7%3.1% 3.5% 3.4%
3.7%3.2%
15.8% 15.9%10.7%
12.1% 14.4% 13.0% 9.8% 11.3%8.0% 12.0%
25.4%22.2%
28.7%28.1% 24.7%
29.2% 33.3% 31.3%32.7% 34.0%
24.8% 28.5%25.1%
26.0% 28.1%28.4% 25.9% 30.0%
27.7% 27.4%
13.5% 14.3% 11.6% 14.6% 14.2%8.0% 10.3% 7.3% 5.3% 3.5%
2014 2013 2012 2011 2010 2009 2008 2007 2006 2005
Other
Life Sciences
Communications
Software
Chemistry
Electro-Optica
Electronics
14
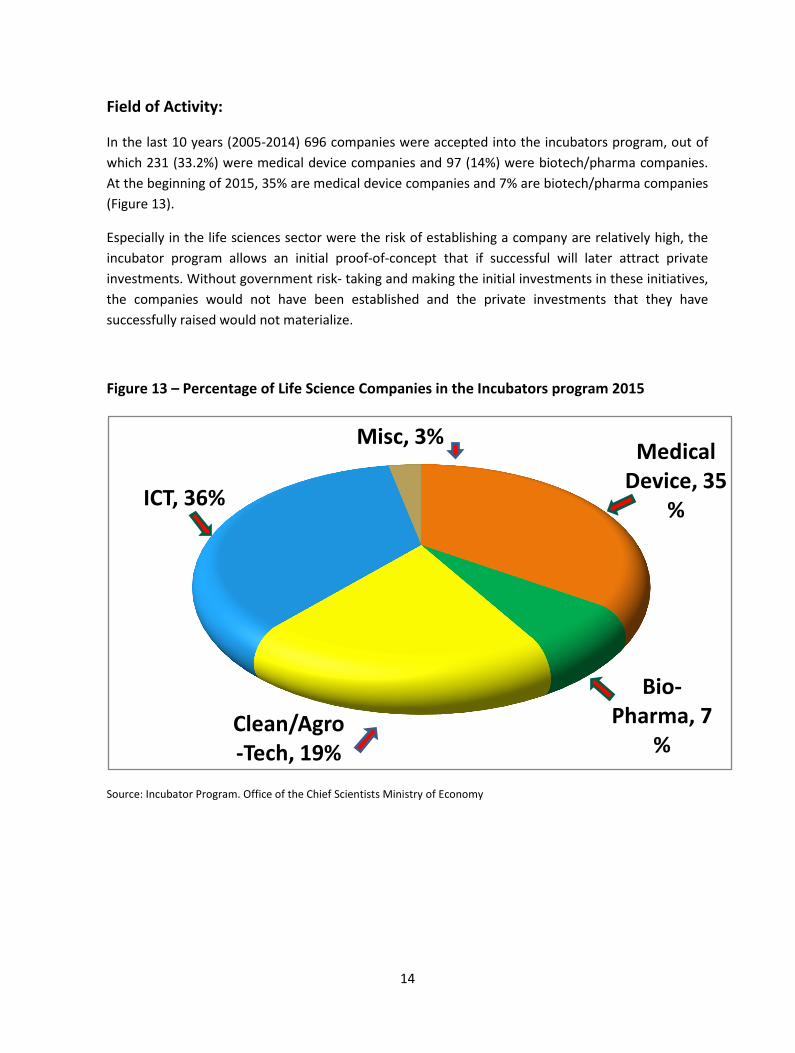
Field of Activity:
In the last 10 years (2005-2014) 696 companies were accepted into the incubators program, out of which 231 (33.2%) were medical device companies and 97 (14%) were biotech/pharma companies. At the beginning of 2015, 35% are medical device companies and 7% are biotech/pharma companies (Figure 13).
Especially in the life sciences sector were the risk of establishing a company are relatively high, the incubator program allows an initial proof-of-concept that if successful will later attract private investments. Without government risk- taking and making the initial investments in these initiatives, the companies would not have been established and the private investments that they have successfully raised would not materialize.
Figure 13 – Percentage of Life Science Companies in the Incubators program 2015
Source: Incubator Program. Office of the Chief Scientists Ministry of Economy
Medical Device, 35
%
Bio-Pharma, 7
%Clean/Agro-Tech, 19%
ICT, 36%
Misc, 3%
15
Financial Support
The incubation term of a project in a technological incubator is approximately 2 years and the total budget for the two-year term ranges between US $500,000 to US $800,000, depending on the field of activity of the project (in addition, projects in peripheral incubators are entitled to an extra budget of US $125,000). 15% of the total budget is financed by the incubator and 85% of the total budget is financed by the government as a grant, that will be paid back only upon success. The company will pay the government 3%-5% royalties from revenue generated, until the full amount of the grant (plus interest) is paid back.
Success stories
From 1991 to the end of 2013, the government initiated over 1,900 companies with a total cumulative government investment of over 730 million dollars.
Over 1,600 companies had matured and left the incubators. Of these graduates, 60% have successfully raised private investments. By the end of 2013, 35% of the incubator's graduates were still up and running. The total cumulative private investment in graduated incubator companies surpassed 4 billion dollars.
This means that for every dollar the government invested in an incubator company, the company raised an additional 5 – 6 dollars from the private sector. (Figure 14)

16
Figure 14 – Incubator Program-Government Funding VS Private Investments 1991 – 2013
Source: Incubator Program. Office of the Chief Scientists Ministry of Economy
Examples of Life Science Success Stories that graduated from the incubator program:
Several successful life sciences companies started in the incubators program and many of them also received additional funding from various programs of the Office of Chief Scientists. Among them are: Argo-Re Walk, Compugen, Simbionix, Protalix, Prolor, Mazor Robotics, Enzymotec, Collplant, Remon Medical, Dune Medical and others.
Accelerators
In the last two years we noticed increased activity of several accelerators in Israel's life sciences industry. Accelerators typically run 12-week programs to get startups quickly from concept to product. They offer mentoring with some also offering seed money in exchange for equity. Programs culminate in a demo day, during which graduates pitch their startups to investors.
0250,000500,000750,000
1,000,0001,250,0001,500,0001,750,0002,000,0002,250,0002,500,0002,750,0003,000,0003,250,0003,500,0003,750,0004,000,0004,250,0004,500,000
19911992199319941995199619971998199920002001200220032004200520062007200820092010201120122013
Government Funding Private Investments
17
Microsoft's accelerator included life sciences companies in all its batches since they started the program in Israel (Overall 11 life sciences companies). Microsoft Ventures opened the first medical accelerator in Israel as it realized the growing potential in this relatively untapped domain as far as it goes to early stage startups. Microsoft Ventures Tel-Aviv partnered with two leading world-class organizations - Becton Dickinson and Healthbox to grant the startups in this program a faster reach out to their market and first hand advise from domain experts in their fields.
MassChallenge accelerator had 9 Israeli startups in the life sciences industry during its 2013-2014 accelerator programs. The accelerators can play an important role in the early stages of Israeli life sciences start-ups especially in better product definition as well as initial assessment by the market and potential customers/partners.
2005-2014: A Decade of Growth
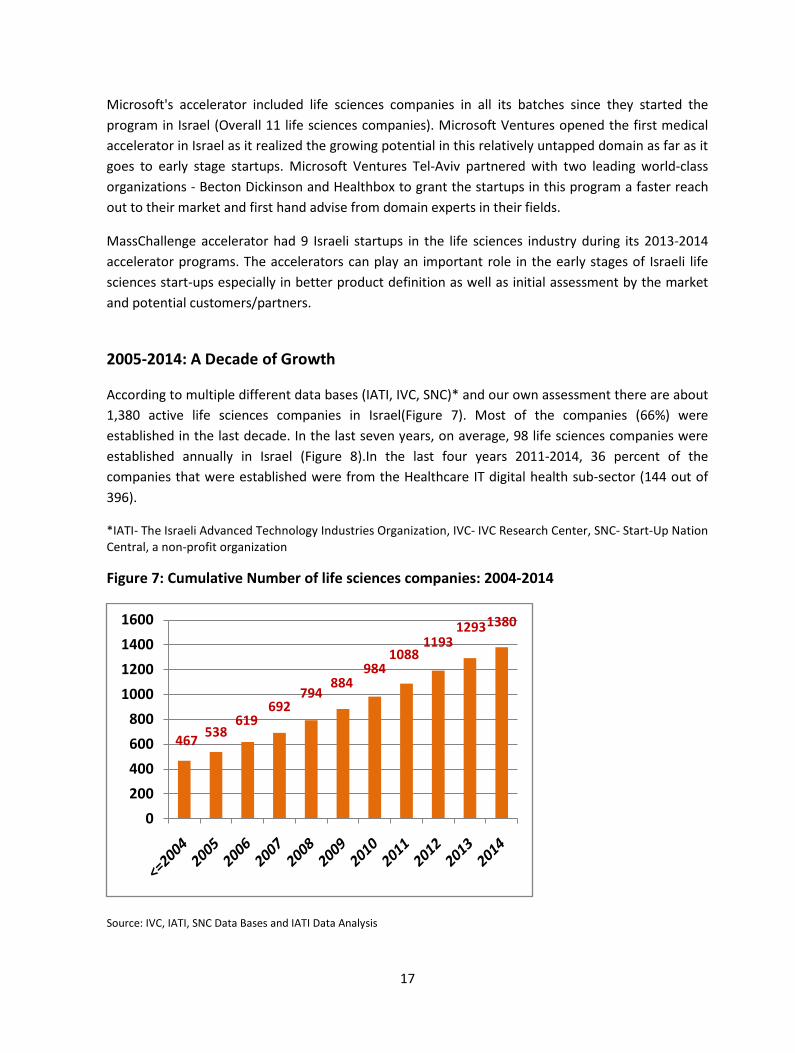
According to multiple different data bases (IATI, IVC, SNC)* and our own assessment there are about 1,380 active life sciences companies in Israel(Figure 7). Most of the companies (66%) were established in the last decade. In the last seven years, on average, 98 life sciences companies were established annually in Israel (Figure 8).In the last four years 2011-2014, 36 percent of the companies that were established were from the Healthcare IT digital health sub-sector (144 out of 396).
*IATI- The Israeli Advanced Technology Industries Organization, IVC- IVC Research Center, SNC- Start-Up Nation Central, a non-profit organization
Figure 7: Cumulative Number of life sciences companies: 2004-2014
Source: IVC, IATI, SNC Data Bases and IATI Data Analysis
467 538619
692794
884984
10881193
12931380
0200400600800
1000120014001600
18
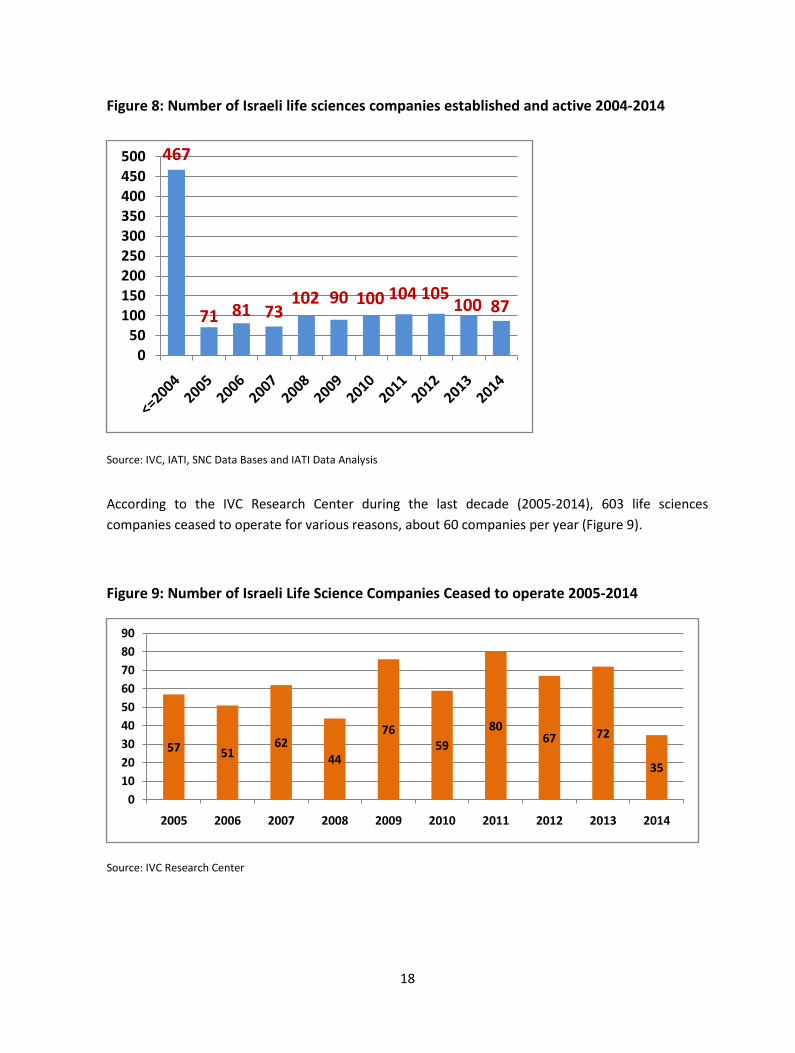
Figure 8: Number of Israeli life sciences companies established and active 2004-2014
Source: IVC, IATI, SNC Data Bases and IATI Data Analysis
According to the IVC Research Center during the last decade (2005-2014), 603 life sciences companies ceased to operate for various reasons, about 60 companies per year (Figure 9).
Figure 9: Number of Israeli Life Science Companies Ceased to operate 2005-2014
Source: IVC Research Center
467
71 81 73102 90 100 104 105
100 87
050
100150200250300350400450500
57 5162
44
7659
8067 72
35
0102030405060708090
2005 2006 2007 2008 2009 2010 2011 2012 2013 2014

19
Israel Life Sciences Industry Sub-Sectors
The Israeli Life Sciences Industry is heavily biased towards the medical device sub-sector, with 725 companies or 53% of the total. Biotech and Pharma is the second largest sub-sector with 317 companies or 23% and Healthcare IT and Digital Health is the third with 285 companies or 20% of all life sciences companies actively operated in Israel, this sub-sector demonstrated the most significant growth in the last four years (see Figure 10).
Figure 10: Israel Life Sciences Industry Sub-Sectors
As the different data bases have different definitions for the companies included in medical device, healthcare IT and digital health sub-sectors, it was impossible to define the various sub groups in each sub-sector (eg: implantable, diagnostics, monitoring, sensing etc.). In the special section of this report dedicated to healthcare IT and digital health there is also breakdown of sub-groups.
Medical Devices
725
Biotechnology/Pharmaceutical
317
Healthcare IT & Digital
Health 285
Others53
20
Global Multinational Life Sciences R&D Centers in Israel
With almost 280 global multinational R&D centers in Israel, the country has become a sought-after hot spot. Multinational R&D centers are playing a major role in the Israeli High-Tech ecosystem employing about 45% of the High-Tech work force.
There are dozens of global multinational Life Sciences R&D centers in Israel of global medical device, Healthcare IT and pharmaceutical companies. Most of these centers originated as a result of acquisitions of Israeli companies. These centers continue to develop breakthrough technologies for the global healthcare market, as well as playing a key role in building a cadre of future Israeli managers in the areas of R&D, sales and marketing. (Figure 15)
Figure 15: Notable Life Sciences Multinational R&D centers in Israel
Few of these multinationals companies have other activities in Israel eg: Novartis invested in Gamida Cell and BioLine Rx and the latter will also identify and develop Israeli technologies for Novartis. Merck-Serono established a strategic bio-incubator fund in Israel with a budget of 10 million Euro. Samsung started an innovation center in Israel and has invested/collaborated with several Israeli companies especially in the digital health sub-sector. In 2010 Roche Partnering signed an agreement with Pontifax to search for Israeli life sciences technologies to invest in together. Many of the corporates venture capital funds invested in Israeli companies in order to get early exposure to their technologies.
21
Funding
Israel High-Tech Funding
There are several sources of funding for the Israeli Life Sciences Industry among them are: Office of Chief Scientist grants, grants like the NIH, Binational Government supported Foundations, angels, venture capital funds (Israeli VCs and foreign VCs), micro-funds, corporate investors and funds raised at the various public markets eg; the TASE and NASDAQ. Exact figures are hard to come by, as the definitions in the various reports that are generated each year are different. We based our funding data on the information of the IVC-KPMG High-Tech Survey, this survey reviews capital raised by Israeli High-Tech companies from Israeli and foreign venture capital funds as well as other investors such as foreign or Israeli investment companies, corporate investors, incubators, accelerators and private investors like angels and angels clubs. Capital raised on public stock exchanges is reported separately in this report.
According to the IVC-KPMG High-Tech 2014 Survey, capital raised by Israeli high-tech companies in 2014, set an all-time record, as 688 companies attracted $3.4 billion. The amount was up 48 percent from $2.3 billion raised by659 companies in 2013.
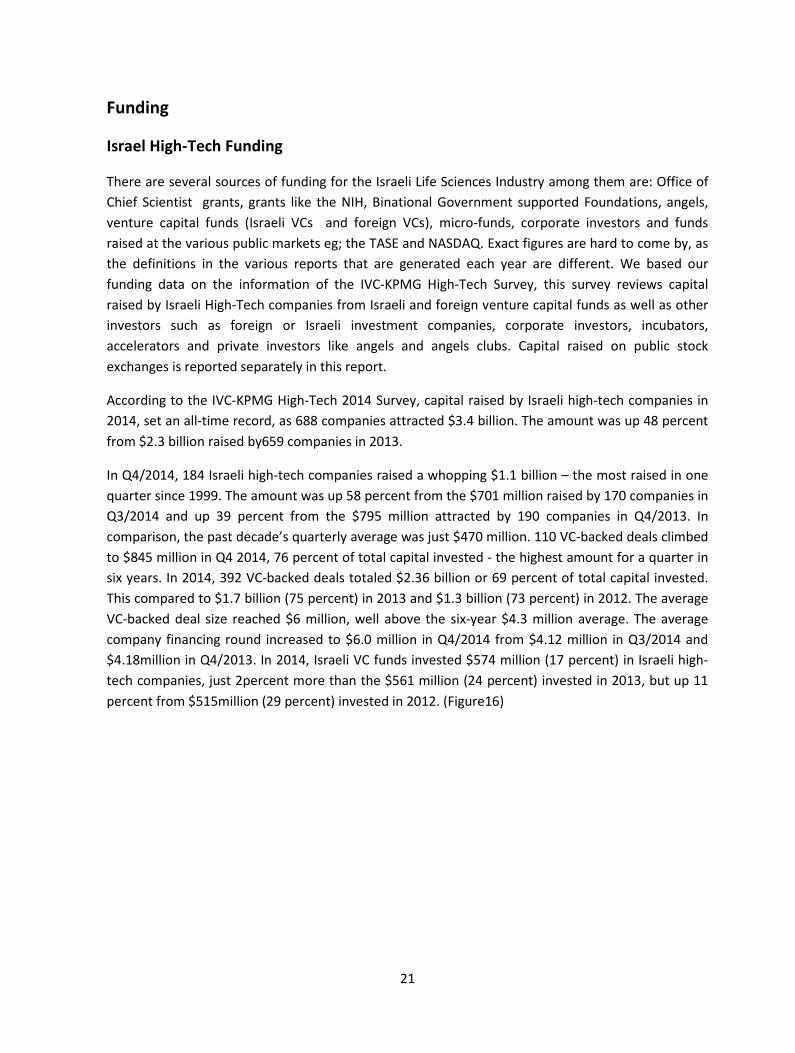
In Q4/2014, 184 Israeli high-tech companies raised a whopping $1.1 billion – the most raised in one quarter since 1999. The amount was up 58 percent from the $701 million raised by 170 companies in Q3/2014 and up 39 percent from the $795 million attracted by 190 companies in Q4/2013. In comparison, the past decade’s quarterly average was just $470 million. 110 VC-backed deals climbed to $845 million in Q4 2014, 76 percent of total capital invested - the highest amount for a quarter in six years. In 2014, 392 VC-backed deals totaled $2.36 billion or 69 percent of total capital invested. This compared to $1.7 billion (75 percent) in 2013 and $1.3 billion (73 percent) in 2012. The average VC-backed deal size reached $6 million, well above the six-year $4.3 million average. The average company financing round increased to $6.0 million in Q4/2014 from $4.12 million in Q3/2014 and $4.18million in Q4/2013. In 2014, Israeli VC funds invested $574 million (17 percent) in Israeli high-tech companies, just 2percent more than the $561 million (24 percent) invested in 2013, but up 11 percent from $515million (29 percent) invested in 2012. (Figure16)
22
Figure16: Capital Raised by Israeli High-Tech Companies
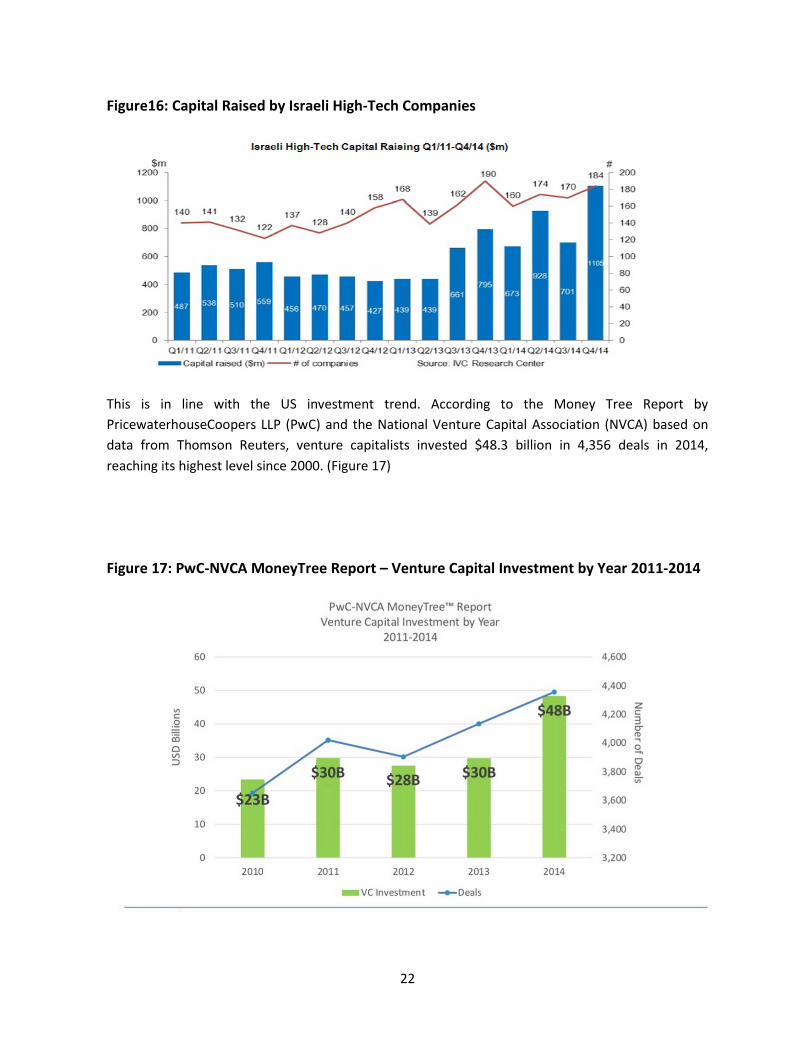
This is in line with the US investment trend. According to the Money Tree Report by PricewaterhouseCoopers LLP (PwC) and the National Venture Capital Association (NVCA) based on data from Thomson Reuters, venture capitalists invested $48.3 billion in 4,356 deals in 2014, reaching its highest level since 2000. (Figure 17)
Figure 17: PwC-NVCA MoneyTree Report – Venture Capital Investment by Year 2011-2014

23
Israel Life Science Sector - Funding
According to the IVC Research Center, in 2014, the life sciences sector attracted 24% of the total investments in the Israeli High-Tech or $801 million. Over the last decade the life sciences sector attracted on average 22.4% of the total investments in the Israel High-Tech. (Figure 18)
Figure 18: Capital raised Israeli High-Tech Companies by Sector 2005 - 2014
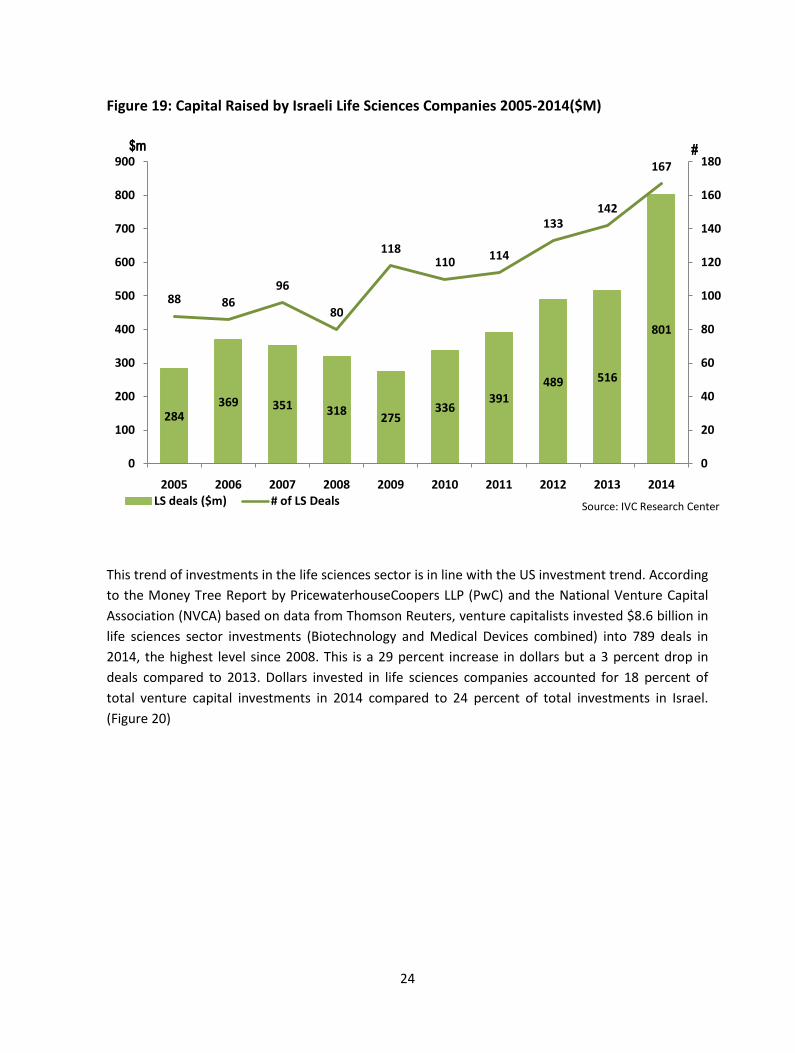
According the IVC Research Center, 2014 set the all-time record in the amount invested in the life sciences sector with $801 million invested in 167 life sciences companies. The amount was up 55 percent from $516million raised by 142 companies in 2013 and 64 percent up from the $489 million invested in 133 life sciences companies in 2012.These three years demonstrated a significant increase compared to the average of $371 million invested in an average of 99 life sciences companies during the years 2005-2011. (Figure 19)
(2013-2014 were also record years for funds raised by Israeli life sciences companies on the NASDAQ as described below).
17% 22%13%
20% 23%12%
19% 16% 21% 22%
35% 24%
21%
25% 20%
18%
20%16%
17% 11%
21%23%
20%
15%25%
28%19%
27%22%
24%
3%5%
15%14%
13%
17%22% 21% 22% 28%
12%10% 19%
15% 7%14%
8% 9% 9% 6%
12% 16% 8% 7% 4% 4% 3% 6% 3% 8%4% 4% 8% 7% 9% 5% 6% 3%
0%
10%
20%
30%
40%
50%
60%
70%
80%
90%
100%
2005 2006 2007 2008 2009 2010 2011 2012 2013 2014Software Communications Life Sciences Internet Semiconductors Other Cleantech
Source: IVC Research Center CenterCenter
24
Figure 19: Capital Raised by Israeli Life Sciences Companies 2005-2014($M)
This trend of investments in the life sciences sector is in line with the US investment trend. According to the Money Tree Report by PricewaterhouseCoopers LLP (PwC) and the National Venture Capital Association (NVCA) based on data from Thomson Reuters, venture capitalists invested $8.6 billion in life sciences sector investments (Biotechnology and Medical Devices combined) into 789 deals in 2014, the highest level since 2008. This is a 29 percent increase in dollars but a 3 percent drop in deals compared to 2013. Dollars invested in life sciences companies accounted for 18 percent of total venture capital investments in 2014 compared to 24 percent of total investments in Israel. (Figure 20)
284369 351 318 275
336391
489 516
801
88 8696
80
118110 114
133142
167
0
100
200
300
400
500
600
700
800
900
2005 2006 2007 2008 2009 2010 2011 2012 2013 2014
0
20
40
60
80
100
120
140
160
180
LS deals ($m) # of LS Deals Source: IVC Research Center
$m #$m #
25
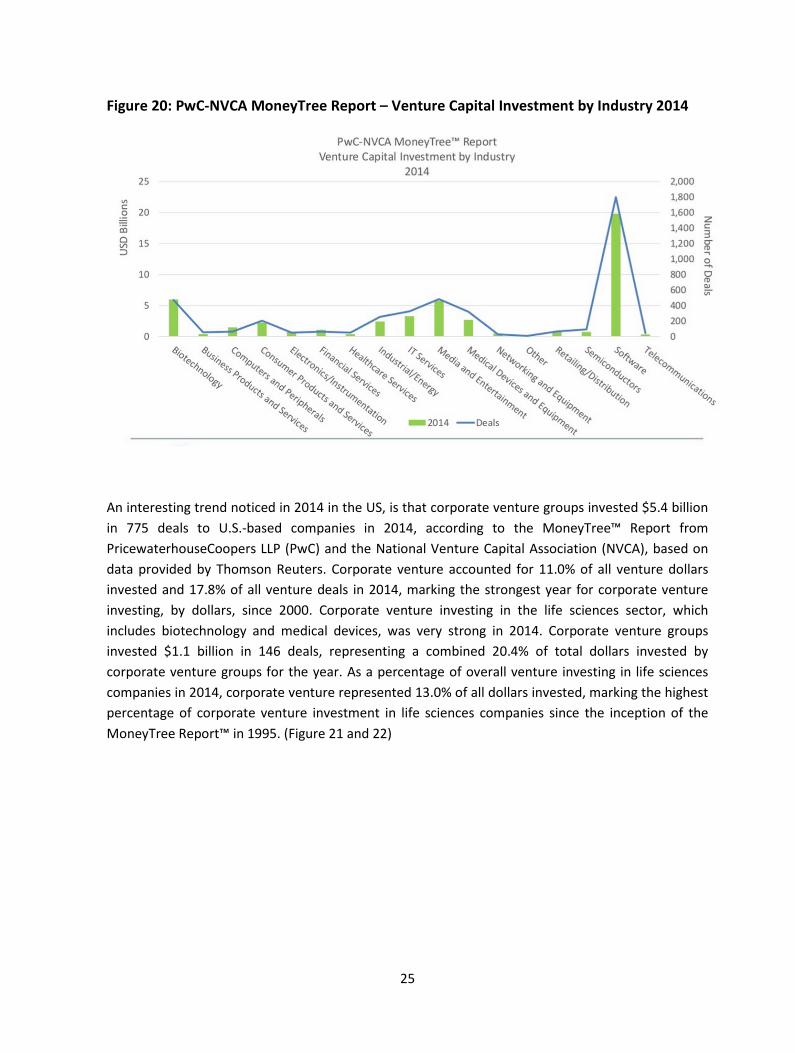
Figure 20: PwC-NVCA MoneyTree Report – Venture Capital Investment by Industry 2014
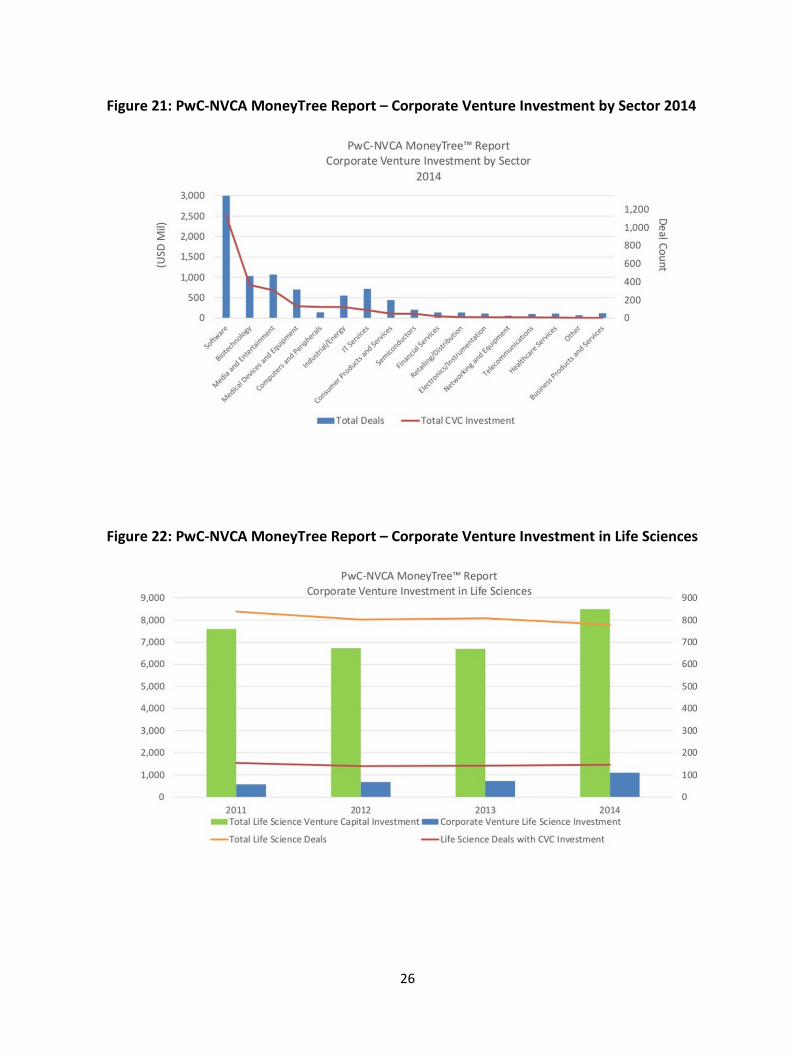
An interesting trend noticed in 2014 in the US, is that corporate venture groups invested $5.4 billion in 775 deals to U.S.-based companies in 2014, according to the MoneyTree™ Report from PricewaterhouseCoopers LLP (PwC) and the National Venture Capital Association (NVCA), based on data provided by Thomson Reuters. Corporate venture accounted for 11.0% of all venture dollars invested and 17.8% of all venture deals in 2014, marking the strongest year for corporate venture investing, by dollars, since 2000. Corporate venture investing in the life sciences sector, which includes biotechnology and medical devices, was very strong in 2014. Corporate venture groups invested $1.1 billion in 146 deals, representing a combined 20.4% of total dollars invested by corporate venture groups for the year. As a percentage of overall venture investing in life sciences companies in 2014, corporate venture represented 13.0% of all dollars invested, marking the highest percentage of corporate venture investment in life sciences companies since the inception of the MoneyTree Report™ in 1995. (Figure 21 and 22)
26
Figure 21: PwC-NVCA MoneyTree Report – Corporate Venture Investment by Sector 2014
Figure 22: PwC-NVCA MoneyTree Report – Corporate Venture Investment in Life Sciences

27
Breakdown of life sciences investments in Israel:
In 2014, $103 million was invested by Israeli venture capital funds, only 13 percent of the total investments in the Israeli life sciences companies, which is down percent-wise compared to the $ 105 million or 20 percent invested in 2013 and $121 million or 24 percent invested in 2012 ( Figure 23).
Figure 23: Capital Invested by Israeli VC Funds vs. Other Investors in Life Sciences 2005-2014($m)
If we look at the total amount invested by Israeli investors compared to foreign investors (As defined in the beginning of this chapter) in 2010-2014, the picture is much better. In 2014 $332 million or 41 percent was invested by Israeli investor which is again down, percent-wise, from the $244 million or 47 percent invested in 2013 and $267 million or 55 percent invested in 2013. This is demonstrating an increased interest in the Israeli life sciences sector by foreign investors and decrease in the number and capital available by Israeli venture capital funds investing in this sector (Figure 24)
92 112 85 86 85 86 128 121 105 103
192257 266 232 191
250263
367 411
698
284
369 351 318275
336391
489516
801
0
100
200
300
400
500
600
700
800
900
2005 2006 2007 2008 2009 2010 2011 2012 2013 2014Other Investors ($m) Israeli VC Funds ($m)
$m
Source: IVC Research Center
28
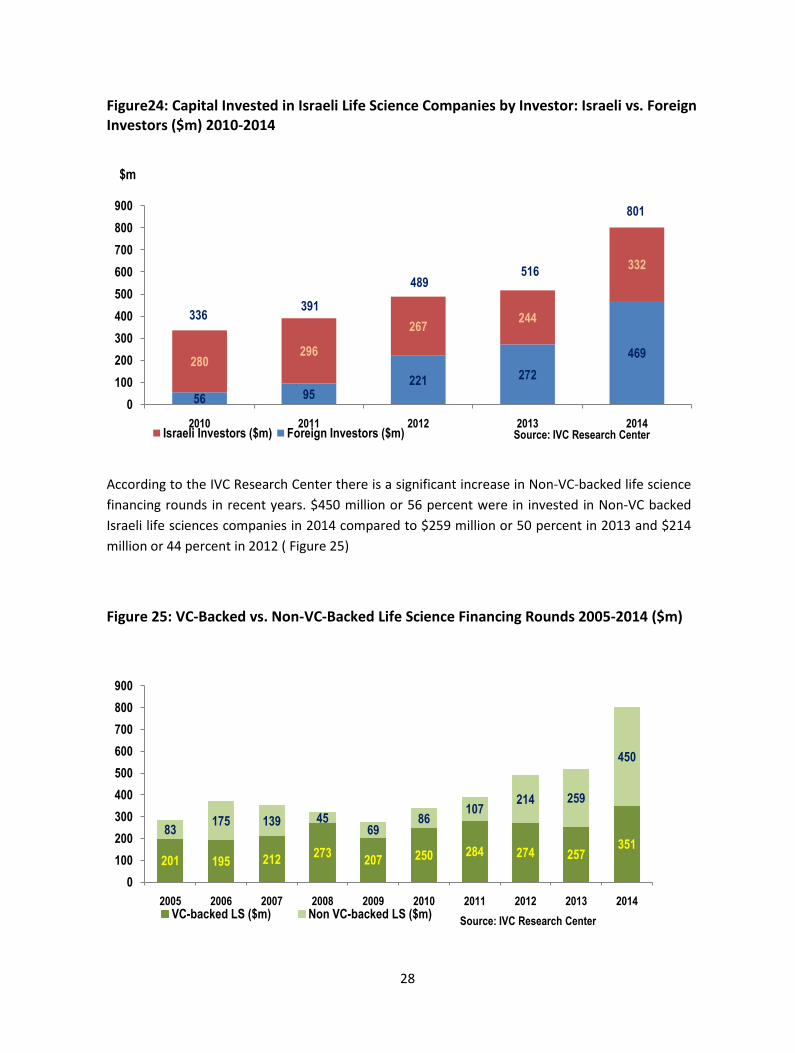
Figure24: Capital Invested in Israeli Life Science Companies by Investor: Israeli vs. Foreign Investors ($m) 2010-2014
According to the IVC Research Center there is a significant increase in Non-VC-backed life science financing rounds in recent years. $450 million or 56 percent were in invested in Non-VC backed Israeli life sciences companies in 2014 compared to $259 million or 50 percent in 2013 and $214 million or 44 percent in 2012 ( Figure 25)
Figure 25: VC-Backed vs. Non-VC-Backed Life Science Financing Rounds 2005-2014 ($m)
56 95221 272
469280296
267 244
332
336 391
489516
801
0100200300400500600700800900
2010 2011 2012 2013 2014Israeli Investors ($m) Foreign Investors ($m) Source: IVC Research Center
$m
201 195 212 273 207 250 284 274 257351
83 175 139 4569
86107
214 259
450
0100200300400500600700800900
2005 2006 2007 2008 2009 2010 2011 2012 2013 2014VC-backed LS ($m) Non VC-backed LS ($m) Source: IVC Research Center
29
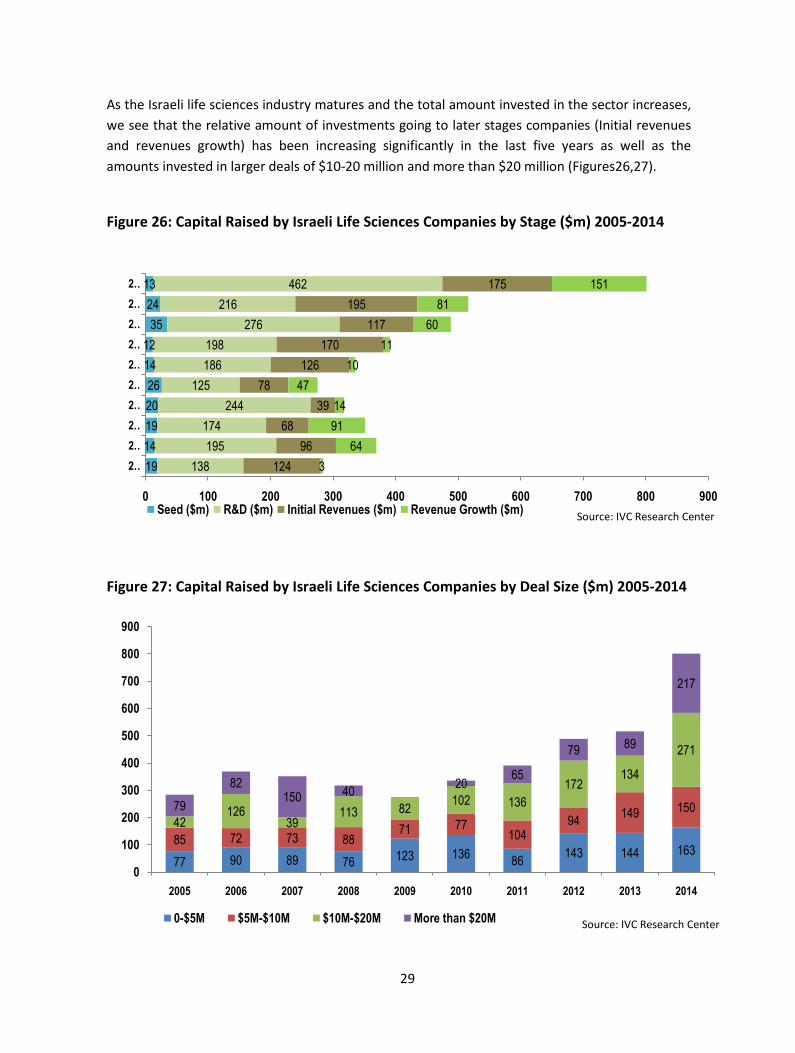
As the Israeli life sciences industry matures and the total amount invested in the sector increases, we see that the relative amount of investments going to later stages companies (Initial revenues and revenues growth) has been increasing significantly in the last five years as well as the amounts invested in larger deals of $10-20 million and more than $20 million (Figures26,27).
Figure 26: Capital Raised by Israeli Life Sciences Companies by Stage ($m) 2005-2014
Figure 27: Capital Raised by Israeli Life Sciences Companies by Deal Size ($m) 2005-2014
1914192026
1412
3524
13
138195
174244
125186198
276216
462
12496
6839
78126
170117
195175
364
9114
4710
1160
81151
0 100 200 300 400 500 600 700 800 900
2…2…2…2…2…2…2…2…2…2…
Seed ($m) R&D ($m) Initial Revenues ($m) Revenue Growth ($m) Source: IVC Research Center
77 90 89 76 123 136 86 143 144 16385 72 73 88
71 77104
94 149 15042
12639
113 82 102 136172
134
271
7982
150 40 20 65
79 89
217
0
100
200
300
400
500
600
700
800
900
2005 2006 2007 2008 2009 2010 2011 2012 2013 2014
0-$5M $5M-$10M $10M-$20M More than $20M Source: IVC Research Center
30
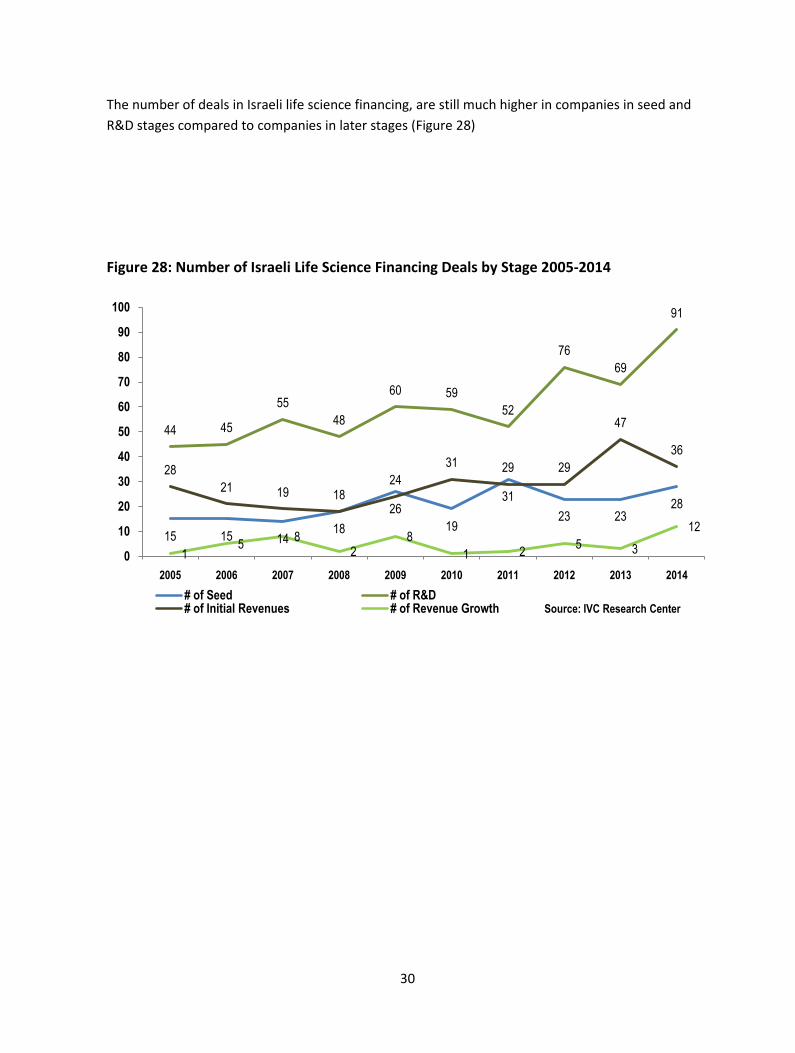
The number of deals in Israeli life science financing, are still much higher in companies in seed and R&D stages compared to companies in later stages (Figure 28)
Figure 28: Number of Israeli Life Science Financing Deals by Stage 2005-2014
15 15 1418
2619
3123 23
28
44 45
5548
60 5952
7669
91
2821 19 18
2431 29 29
47
36
15 8
28
1 2 5 312
0
10
20
30
40
50
60
70
80
90
100
2005 2006 2007 2008 2009 2010 2011 2012 2013 2014# of Seed # of R&D# of Initial Revenues # of Revenue Growth Source: IVC Research Center
31
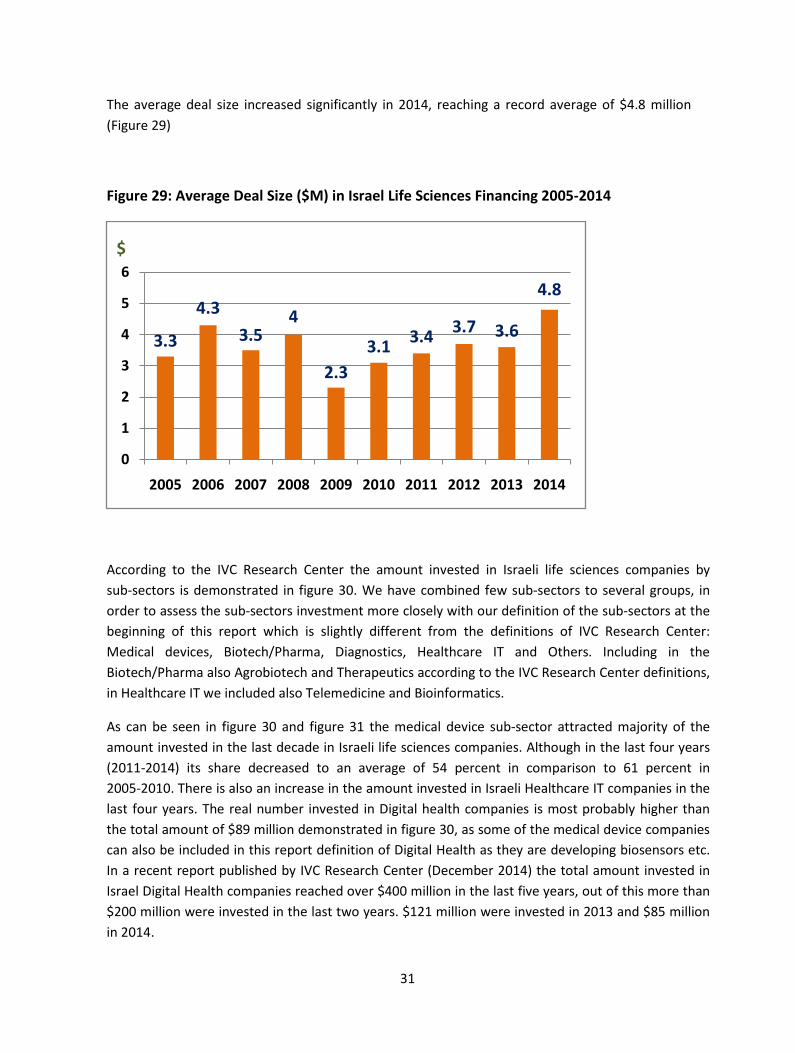
The average deal size increased significantly in 2014, reaching a record average of $4.8 million (Figure 29)
Figure 29: Average Deal Size ($M) in Israel Life Sciences Financing 2005-2014
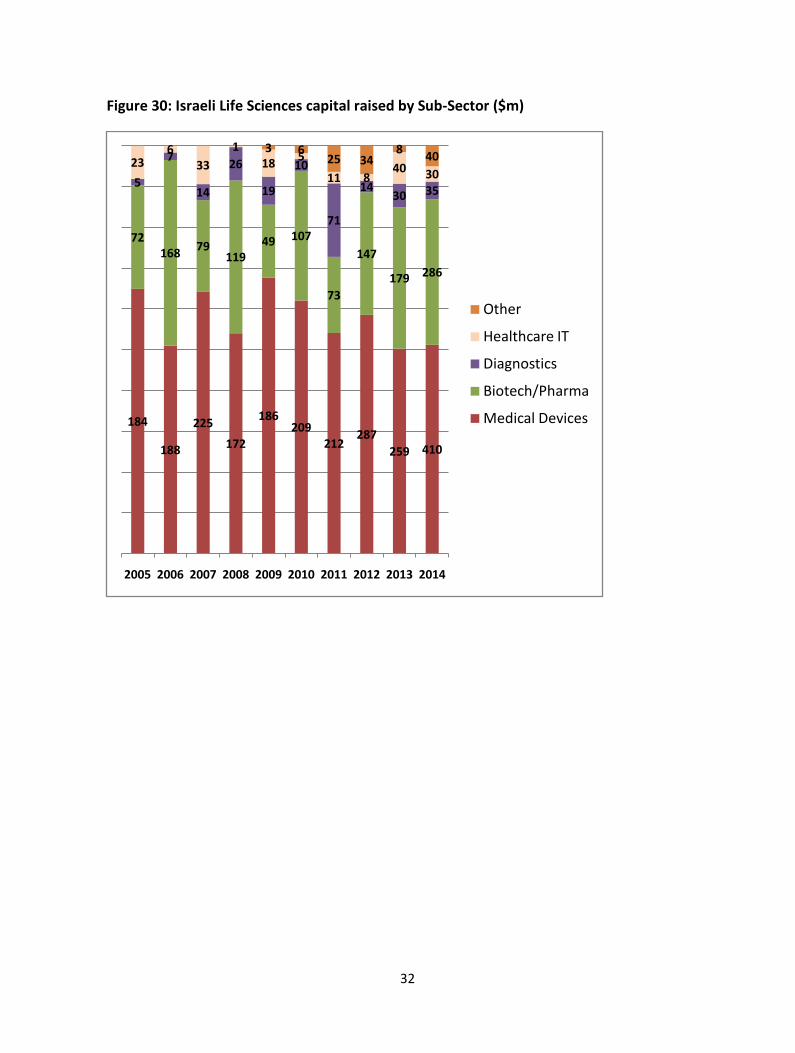
According to the IVC Research Center the amount invested in Israeli life sciences companies by sub-sectors is demonstrated in figure 30. We have combined few sub-sectors to several groups, in order to assess the sub-sectors investment more closely with our definition of the sub-sectors at the beginning of this report which is slightly different from the definitions of IVC Research Center: Medical devices, Biotech/Pharma, Diagnostics, Healthcare IT and Others. Including in the Biotech/Pharma also Agrobiotech and Therapeutics according to the IVC Research Center definitions, in Healthcare IT we included also Telemedicine and Bioinformatics.
As can be seen in figure 30 and figure 31 the medical device sub-sector attracted majority of the amount invested in the last decade in Israeli life sciences companies. Although in the last four years (2011-2014) its share decreased to an average of 54 percent in comparison to 61 percent in 2005-2010. There is also an increase in the amount invested in Israeli Healthcare IT companies in the last four years. The real number invested in Digital health companies is most probably higher than the total amount of $89 million demonstrated in figure 30, as some of the medical device companies can also be included in this report definition of Digital Health as they are developing biosensors etc. In a recent report published by IVC Research Center (December 2014) the total amount invested in Israel Digital Health companies reached over $400 million in the last five years, out of this more than $200 million were invested in the last two years. $121 million were invested in 2013 and $85 million in 2014.
3.3
4.33.5
4
2.33.1 3.4 3.7 3.6
4.8
0
1
2
3
4
5
6
2005 2006 2007 2008 2009 2010 2011 2012 2013 2014
$
32
Figure 30: Israeli Life Sciences capital raised by Sub-Sector ($m)
184
188
225172
186209
212287
259 410
72168 79
11949 107
73
147
179 286
5
7
14
26
19
10
71
1430 35
236
331
18 5
11 840 30
3 625 34
8 40
2005 2006 2007 2008 2009 2010 2011 2012 2013 2014
Other
Healthcare IT
Diagnostics
Biotech/Pharma
Medical Devices
33
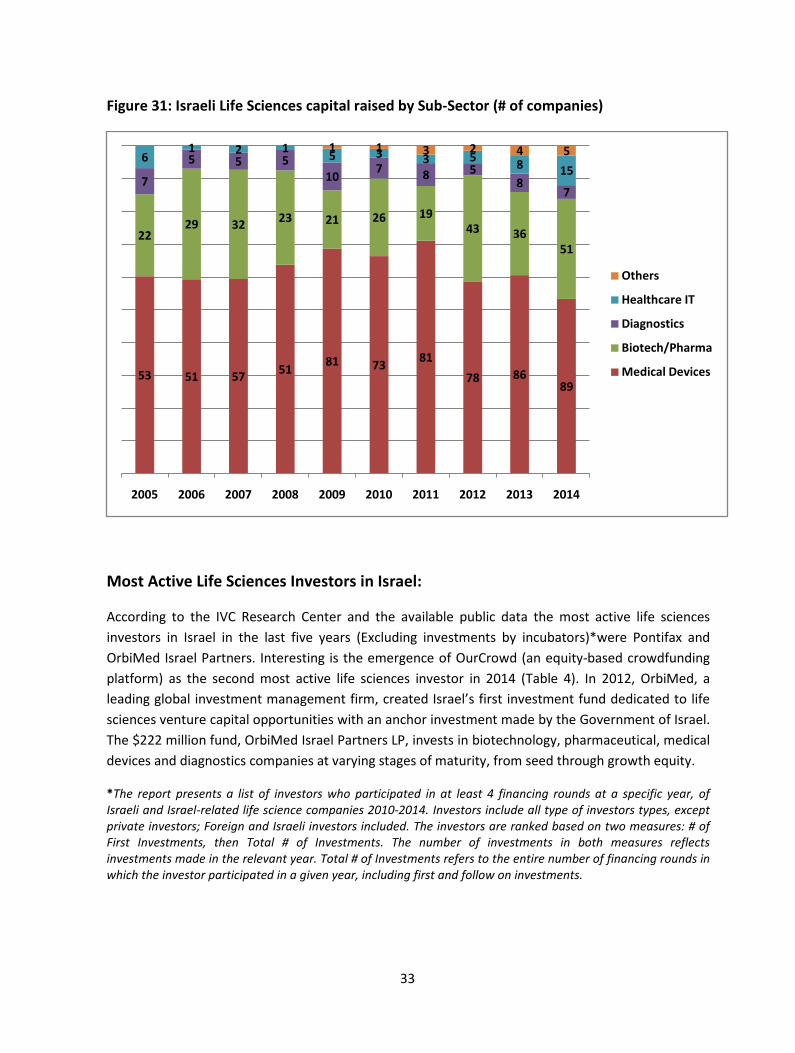
Figure 31: Israeli Life Sciences capital raised by Sub-Sector (# of companies)
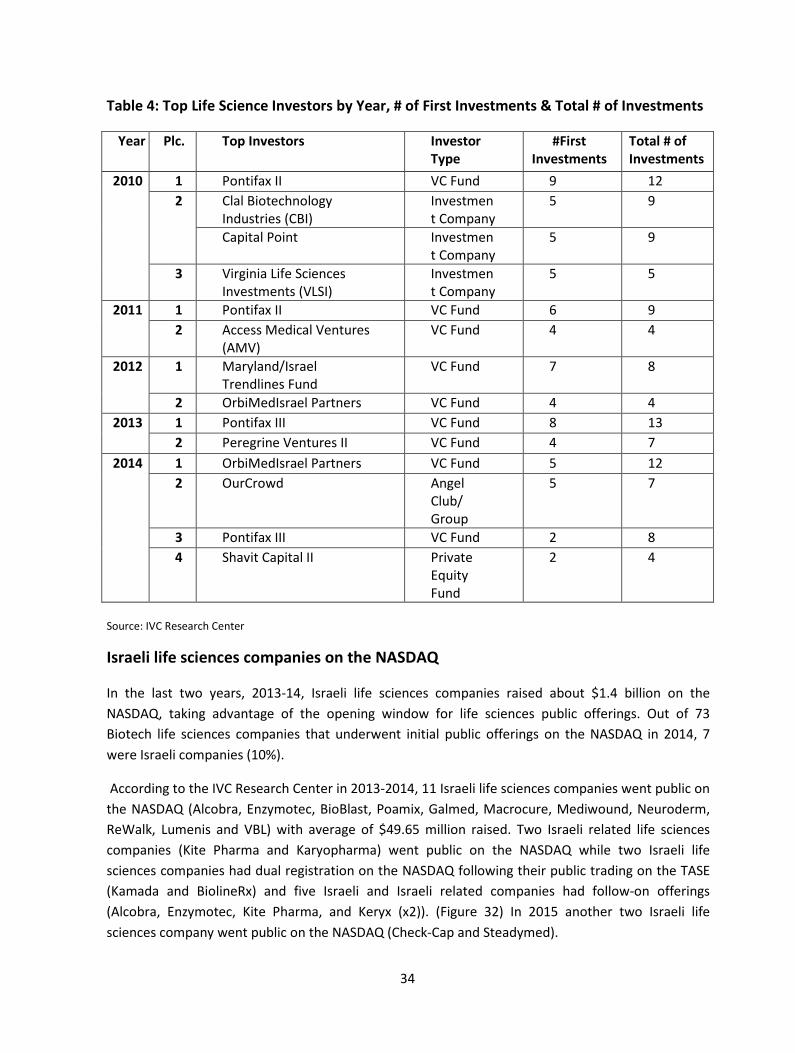
Most Active Life Sciences Investors in Israel:
According to the IVC Research Center and the available public data the most active life sciences investors in Israel in the last five years (Excluding investments by incubators)*were Pontifax and OrbiMed Israel Partners. Interesting is the emergence of OurCrowd (an equity-based crowdfunding platform) as the second most active life sciences investor in 2014 (Table 4). In 2012, OrbiMed, a leading global investment management firm, created Israel’s first investment fund dedicated to life sciences venture capital opportunities with an anchor investment made by the Government of Israel. The $222 million fund, OrbiMed Israel Partners LP, invests in biotechnology, pharmaceutical, medical devices and diagnostics companies at varying stages of maturity, from seed through growth equity.
*The report presents a list of investors who participated in at least 4 financing rounds at a specific year, of Israeli and Israel-related life science companies 2010-2014. Investors include all type of investors types, except private investors; Foreign and Israeli investors included. The investors are ranked based on two measures: # of First Investments, then Total # of Investments. The number of investments in both measures reflects investments made in the relevant year. Total # of Investments refers to the entire number of financing rounds in which the investor participated in a given year, including first and follow on investments.
53 51 57 51 81 73 8178 86
89
2229 32 23 21 26 19
43 3651
7
5 5 510 7 8 5
87
61 2 1 5 3 3 5 8 15
1 1 3 2 4 5
2005 2006 2007 2008 2009 2010 2011 2012 2013 2014
Others
Healthcare IT
Diagnostics
Biotech/Pharma
Medical Devices
34
Table 4: Top Life Science Investors by Year, # of First Investments & Total # of Investments
Year Plc. Top Investors Investor Type
#First Investments
Total # of Investments
2010 1 Pontifax II VC Fund 9 12 2 Clal Biotechnology
Industries (CBI) Investment Company
5 9
Capital Point Investment Company
5 9
3 Virginia Life Sciences Investments (VLSI)
Investment Company
5 5
2011 1 Pontifax II VC Fund 6 9 2 Access Medical Ventures
(AMV) VC Fund 4 4
2012 1 Maryland/Israel Trendlines Fund
VC Fund 7 8
2 OrbiMedIsrael Partners VC Fund 4 4 2013 1 Pontifax III VC Fund 8 13
2 Peregrine Ventures II VC Fund 4 7 2014 1 OrbiMedIsrael Partners VC Fund 5 12
2 OurCrowd Angel Club/ Group
5 7
3 Pontifax III VC Fund 2 8 4 Shavit Capital II Private
Equity Fund
2 4
Source: IVC Research Center
Israeli life sciences companies on the NASDAQ
In the last two years, 2013-14, Israeli life sciences companies raised about $1.4 billion on the NASDAQ, taking advantage of the opening window for life sciences public offerings. Out of 73 Biotech life sciences companies that underwent initial public offerings on the NASDAQ in 2014, 7 were Israeli companies (10%).
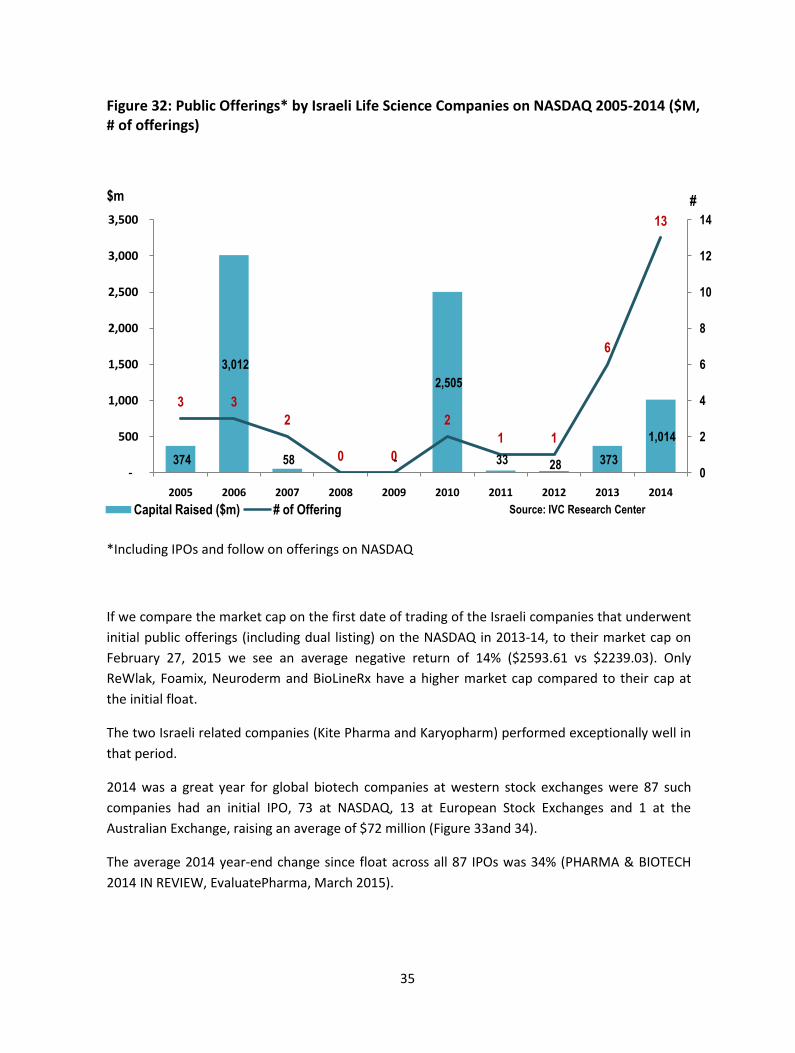
According to the IVC Research Center in 2013-2014, 11 Israeli life sciences companies went public on the NASDAQ (Alcobra, Enzymotec, BioBlast, Poamix, Galmed, Macrocure, Mediwound, Neuroderm, ReWalk, Lumenis and VBL) with average of $49.65 million raised. Two Israeli related life sciences companies (Kite Pharma and Karyopharma) went public on the NASDAQ while two Israeli life sciences companies had dual registration on the NASDAQ following their public trading on the TASE (Kamada and BiolineRx) and five Israeli and Israeli related companies had follow-on offerings (Alcobra, Enzymotec, Kite Pharma, and Keryx (x2)). (Figure 32) In 2015 another two Israeli life sciences company went public on the NASDAQ (Check-Cap and Steadymed).
35
Figure 32: Public Offerings* by Israeli Life Science Companies on NASDAQ 2005-2014 ($M, # of offerings)
*Including IPOs and follow on offerings on NASDAQ
If we compare the market cap on the first date of trading of the Israeli companies that underwent initial public offerings (including dual listing) on the NASDAQ in 2013-14, to their market cap on February 27, 2015 we see an average negative return of 14% ($2593.61 vs $2239.03). Only ReWlak, Foamix, Neuroderm and BioLineRx have a higher market cap compared to their cap at the initial float.
The two Israeli related companies (Kite Pharma and Karyopharm) performed exceptionally well in that period.
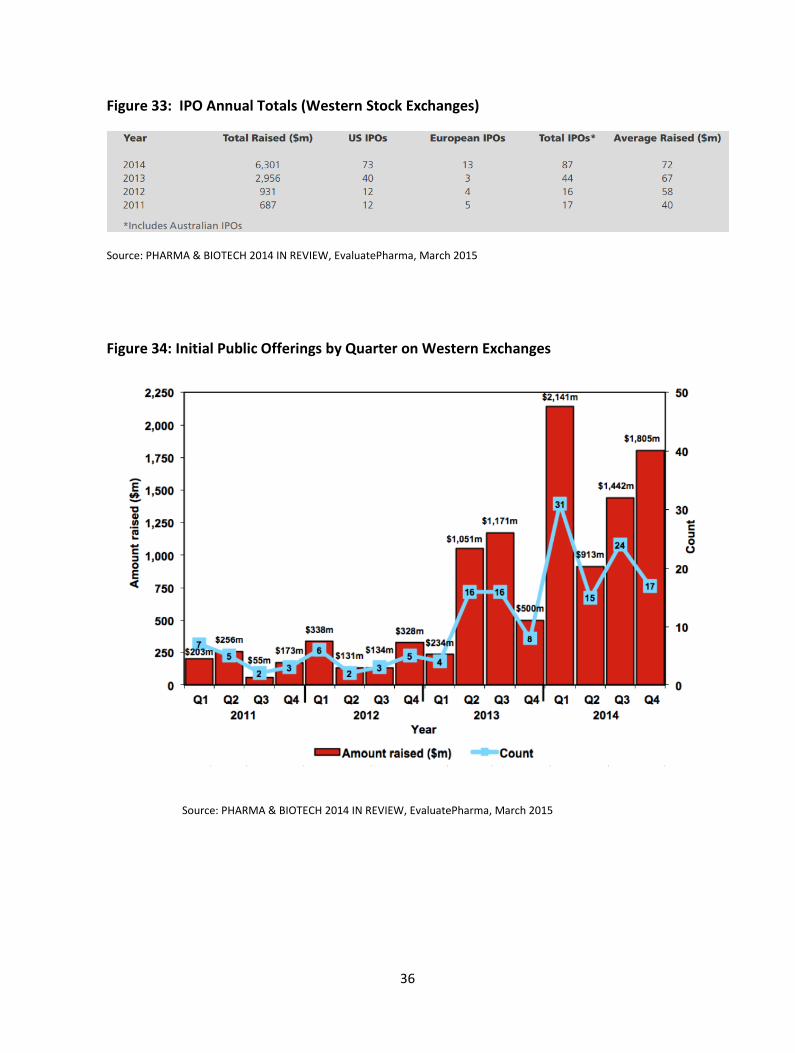
2014 was a great year for global biotech companies at western stock exchanges were 87 such companies had an initial IPO, 73 at NASDAQ, 13 at European Stock Exchanges and 1 at the Australian Exchange, raising an average of $72 million (Figure 33and 34).
The average 2014 year-end change since float across all 87 IPOs was 34% (PHARMA & BIOTECH 2014 IN REVIEW, EvaluatePharma, March 2015).
374
3,012
58 -
2,505
33 28 373 1,014
3 32
0 0
21 1
6
13
-
500
1,000
1,500
2,000
2,500
3,000
3,500
2005 2006 2007 2008 2009 2010 2011 2012 2013 20140
2
4
6
8
10
12
14
Capital Raised ($m) # of Offering Source: IVC Research Center
$m #
36
Figure 33: IPO Annual Totals (Western Stock Exchanges)
Source: PHARMA & BIOTECH 2014 IN REVIEW, EvaluatePharma, March 2015
Figure 34: Initial Public Offerings by Quarter on Western Exchanges
Source: PHARMA & BIOTECH 2014 IN REVIEW, EvaluatePharma, March 2015
37
Tel Aviv Stock Exchange (TASE)
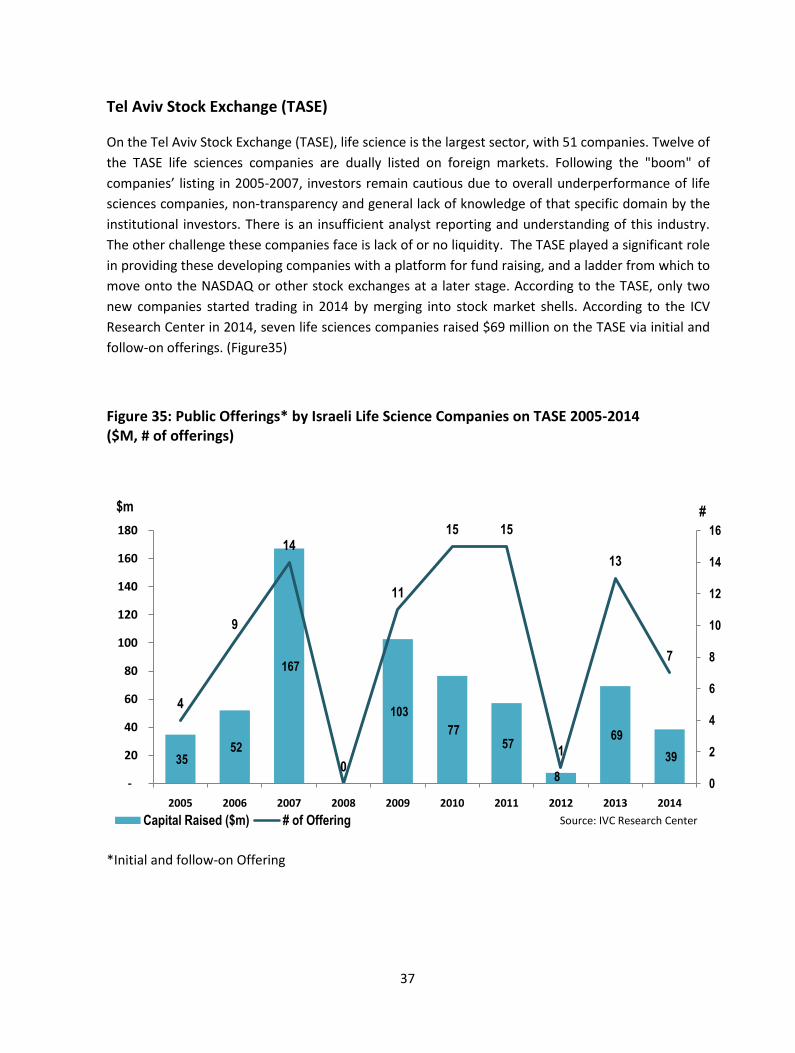
On the Tel Aviv Stock Exchange (TASE), life science is the largest sector, with 51 companies. Twelve of the TASE life sciences companies are dually listed on foreign markets. Following the "boom" of companies’ listing in 2005-2007, investors remain cautious due to overall underperformance of life sciences companies, non-transparency and general lack of knowledge of that specific domain by the institutional investors. There is an insufficient analyst reporting and understanding of this industry. The other challenge these companies face is lack of or no liquidity. The TASE played a significant role in providing these developing companies with a platform for fund raising, and a ladder from which to move onto the NASDAQ or other stock exchanges at a later stage. According to the TASE, only two new companies started trading in 2014 by merging into stock market shells. According to the ICV Research Center in 2014, seven life sciences companies raised $69 million on the TASE via initial and follow-on offerings. (Figure35)
Figure 35: Public Offerings* by Israeli Life Science Companies on TASE 2005-2014 ($M, # of offerings)
*Initial and follow-on Offering
35 52
167
103 77
57
8
69 39
4
9
14
0
11
15 15
1
13
7
-
20
40
60
80
100
120
140
160
180
2005 2006 2007 2008 2009 2010 2011 2012 2013 20140
2
4
6
8
10
12
14
16
Capital Raised ($m) # of Offering Source: IVC Research Center
$m #
38
According to TASE data, in the same period (2005-2014), 19 life sciences companies stopped trading either because they were acquired (4 companies) or turned into stock market shells (15 companies).
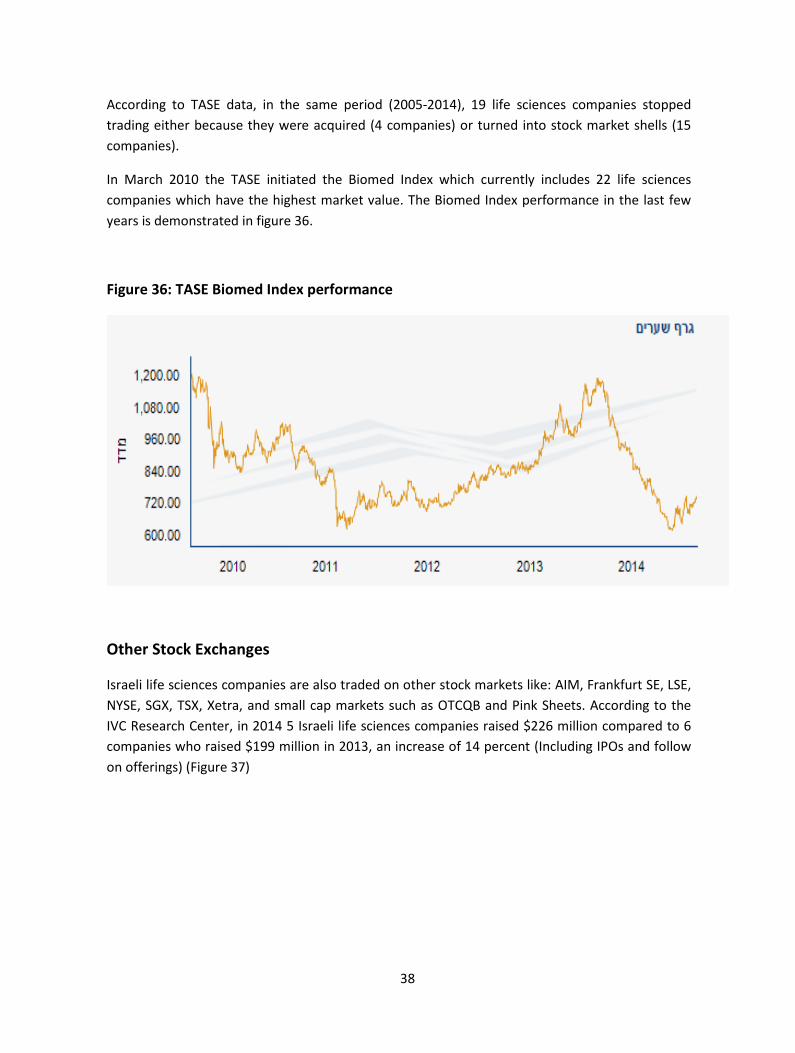
In March 2010 the TASE initiated the Biomed Index which currently includes 22 life sciences companies which have the highest market value. The Biomed Index performance in the last few years is demonstrated in figure 36.
Figure 36: TASE Biomed Index performance
Other Stock Exchanges
Israeli life sciences companies are also traded on other stock markets like: AIM, Frankfurt SE, LSE, NYSE, SGX, TSX, Xetra, and small cap markets such as OTCQB and Pink Sheets. According to the IVC Research Center, in 2014 5 Israeli life sciences companies raised $226 million compared to 6 companies who raised $199 million in 2013, an increase of 14 percent (Including IPOs and follow on offerings) (Figure 37)

39
Figure 37: Public Offerings* by Israeli Life Science Companies on Other Stock Exchanges 2005-2014 ($M, # of offerings)
*Initial and follow-on Offering
If we add all the amounts raised by Israeli Life Sciences Companies from various resources in 2014, it was a record year for the Israeli life sciences industry with more than $2 billion raised!
Acquisitions of Israeli Life Sciences companies
Since 2005, 62 Israeli life sciences companies have been acquired, whereby the aggregate sum of these acquisitions was $7.7 billion excluding royalties. Only in the last two years 2013-2014, Israeli life sciences companies were acquired for almost $2.9 billion (see Table 5). In the same period (2005-2014) $4.13 billion was invested in Israeli life sciences companies (figure 19). As the numbers relate to different sets of data, it is complicated to calculate the multiple on investments made in this sector.
If one takes all acquisitions of Israeli life sciences companies since 2005, the average amount invested until the exit (Data is available for 53 companies) was $38.9 million, the average exit return (all 62 companies) was $133.7 and the average multiple (53 companies) was about 8.05.
When we looked at the average time to exit from “inception” of the companies it was 12.3 years and from the first "institutional" round of investment, it was 8.68 years. (Figure 38).
101 57
20 20
75
106
199 226
1
0
2
1 1
0
3
5
6
5
-
50
100
150
200
250
2005 2006 2007 2008 2009 2010 2011 2012 2013 20140
1
2
3
4
5
6
7
Capital Raised ($m) # of Offering Source: IVC Research Center
$m #

40
Figure 38: Acquisitions of Israeli Life Sciences companies 2005-2014
Figure 39: Acquisitions of Israeli Life Sciences Companies – Stage at Acquisitions (#)
12.3 8.6838.9
133.7
8.050
20
40
60
80
100
120
140
160
Average Time to Exit(Y) (From
Inception)
Average Time to Exit (Y)(From 1st
round)
Average Investment to Exit($M)(#52)
Average Exit ($M)
Average Multiple(#52)
R&D, 20
Initial Revenues, 19
Revenues Growth, 23
41
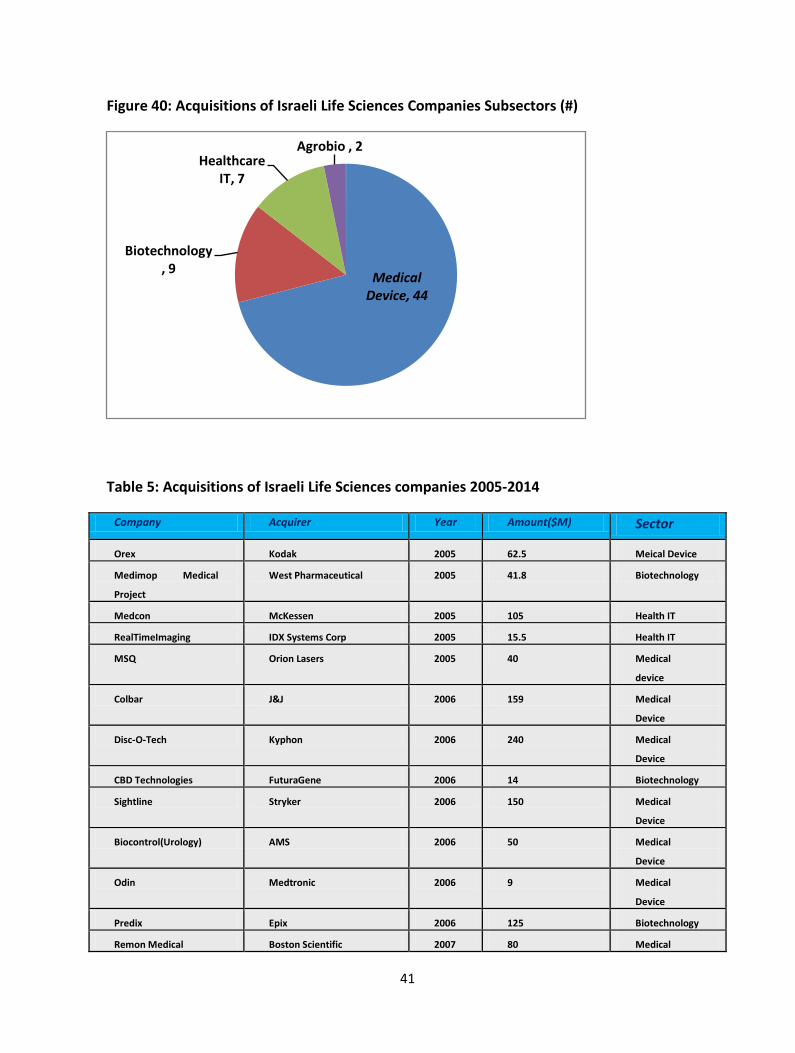
Figure 40: Acquisitions of Israeli Life Sciences Companies Subsectors (#)
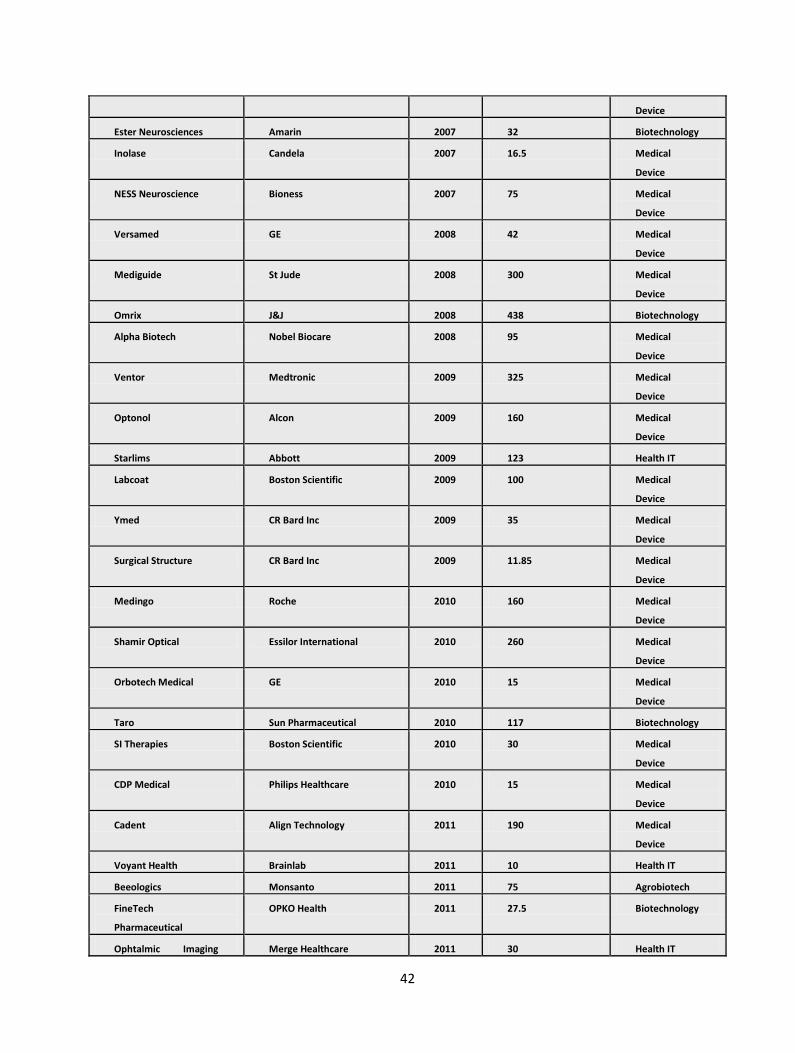
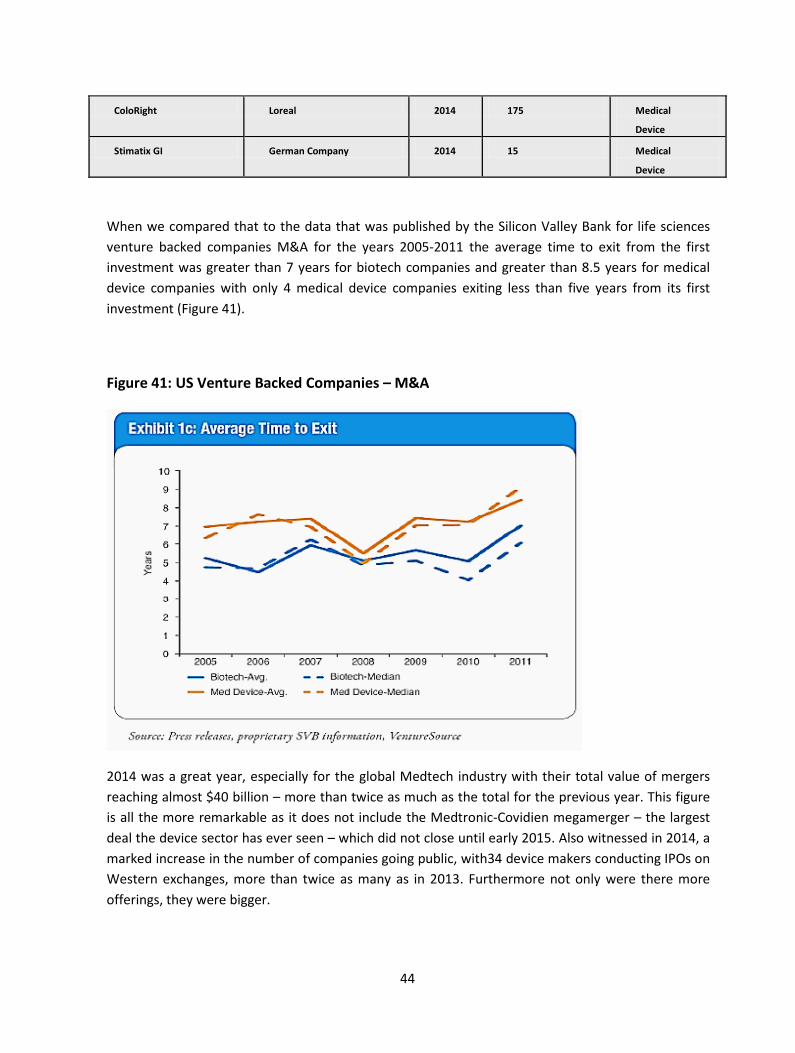
Table 5: Acquisitions of Israeli Life Sciences companies 2005-2014
Company Acquirer Year Amount($M) Sector
Orex Kodak 2005 62.5 Meical Device
Medimop Medical
Project
West Pharmaceutical 2005 41.8 Biotechnology
Medcon McKessen 2005 105 Health IT
RealTimeImaging IDX Systems Corp 2005 15.5 Health IT
MSQ Orion Lasers 2005 40 Medical
device
Colbar J&J 2006 159 Medical
Device
Disc-O-Tech Kyphon 2006 240 Medical
Device
CBD Technologies FuturaGene 2006 14 Biotechnology
Sightline Stryker 2006 150 Medical
Device
Biocontrol(Urology) AMS 2006 50 Medical
Device
Odin Medtronic 2006 9 Medical
Device
Predix Epix 2006 125 Biotechnology
Remon Medical Boston Scientific 2007 80 Medical
Medical Device, 44
Biotechnology, 9
Healthcare IT, 7
Agrobio , 2
42
Device
Ester Neurosciences Amarin 2007 32 Biotechnology
Inolase Candela 2007 16.5 Medical
Device
NESS Neuroscience Bioness 2007 75 Medical
Device
Versamed GE 2008 42 Medical
Device
Mediguide St Jude 2008 300 Medical
Device
Omrix J&J 2008 438 Biotechnology
Alpha Biotech Nobel Biocare 2008 95 Medical
Device
Ventor Medtronic 2009 325 Medical
Device
Optonol Alcon 2009 160 Medical
Device
Starlims Abbott 2009 123 Health IT
Labcoat Boston Scientific 2009 100 Medical
Device
Ymed CR Bard Inc 2009 35 Medical
Device
Surgical Structure CR Bard Inc 2009 11.85 Medical
Device
Medingo Roche 2010 160 Medical
Device
Shamir Optical Essilor International 2010 260 Medical
Device
Orbotech Medical GE 2010 15 Medical
Device
Taro Sun Pharmaceutical 2010 117 Biotechnology
SI Therapies Boston Scientific 2010 30 Medical
Device
CDP Medical Philips Healthcare 2010 15 Medical
Device
Cadent Align Technology 2011 190 Medical
Device
Voyant Health Brainlab 2011 10 Health IT
Beeologics Monsanto 2011 75 Agrobiotech
FineTech
Pharmaceutical
OPKO Health 2011 27.5 Biotechnology
Ophtalmic Imaging Merge Healthcare 2011 30 Health IT

43
Systems (IOS)
Radiancy PhotoMedix 2011 175 Medical
Device
SuperDimension Covidien 2012 300 Medical
Device
Oridion Covidien 2012 346 Medical
Device
Polytouch Covidien 2012 356 Medical
Device
Thrombotech D-Pharm 2012 16.6 Biotechnology
Sync-Rx Volcano 2012 17.3 Medical
Device
UltraShape Syneron 2012 12 Medical
Device
Surpass Medical Stryker Corp. 2012 135 Medical
Device
dbMotion Allscript 2013 235 Health IT
Rosetta Green Monsanto 2013 35 Agrobiotech
FlowSense Baxter 2013 9.5 Medical
Device
Spectrum Dynamics Biosensor International 2013 51 Medical
Device
JetPrep Cantel Medical 2013 5.4 Medical
Device
Given Imaging Covidien 2013 970 Medical
Device
Alma Lasers Fosum Pharma 2013 240 Medical
Device
Prolor OPKO Healthcare 2013 480 Biotechnology
Upstream Peripheral Spectranetics 2013 35.5 Medical
Device
ActiView Stryker 2013 20 Medical
Device
Eon Surgical Teleflex 2013 40 Medical
Device
Caesarea Medical
Electronics
CareFusion 2013 250 Medical
Device
Inspiro Medical OPKO Healthcare 2014 10 Medical
Device
Angioscore Spectrnetics 2014 230 Medical
Device
Simbionix 3D Systems 2014 120 Health IT
44
ColoRight Loreal 2014 175 Medical
Device
Stimatix GI German Company 2014 15 Medical
Device
When we compared that to the data that was published by the Silicon Valley Bank for life sciences venture backed companies M&A for the years 2005-2011 the average time to exit from the first investment was greater than 7 years for biotech companies and greater than 8.5 years for medical device companies with only 4 medical device companies exiting less than five years from its first investment (Figure 41).
Figure 41: US Venture Backed Companies – M&A
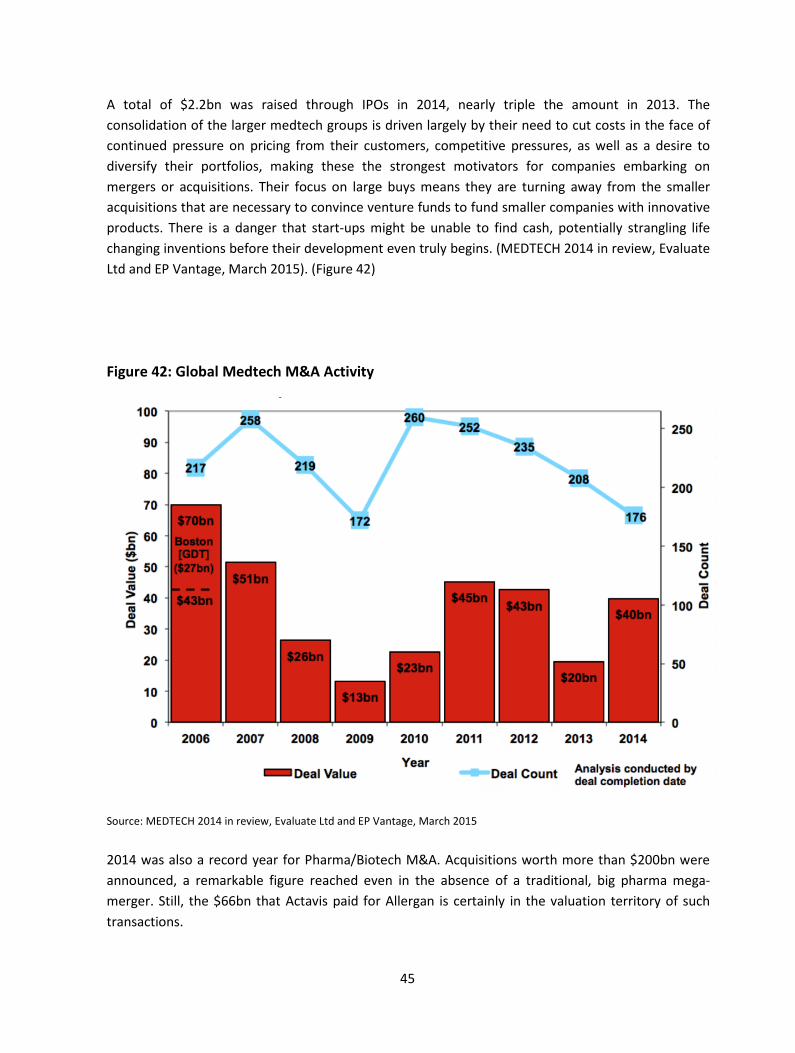
2014 was a great year, especially for the global Medtech industry with their total value of mergers reaching almost $40 billion – more than twice as much as the total for the previous year. This figure is all the more remarkable as it does not include the Medtronic-Covidien megamerger – the largest deal the device sector has ever seen – which did not close until early 2015. Also witnessed in 2014, a marked increase in the number of companies going public, with34 device makers conducting IPOs on Western exchanges, more than twice as many as in 2013. Furthermore not only were there more offerings, they were bigger.
45
A total of $2.2bn was raised through IPOs in 2014, nearly triple the amount in 2013. The consolidation of the larger medtech groups is driven largely by their need to cut costs in the face of continued pressure on pricing from their customers, competitive pressures, as well as a desire to diversify their portfolios, making these the strongest motivators for companies embarking on mergers or acquisitions. Their focus on large buys means they are turning away from the smaller acquisitions that are necessary to convince venture funds to fund smaller companies with innovative products. There is a danger that start-ups might be unable to find cash, potentially strangling life changing inventions before their development even truly begins. (MEDTECH 2014 in review, Evaluate Ltd and EP Vantage, March 2015). (Figure 42)
Figure 42: Global Medtech M&A Activity
Source: MEDTECH 2014 in review, Evaluate Ltd and EP Vantage, March 2015
2014 was also a record year for Pharma/Biotech M&A. Acquisitions worth more than $200bn were announced, a remarkable figure reached even in the absence of a traditional, big pharma mega-merger. Still, the $66bn that Actavis paid for Allergan is certainly in the valuation territory of such transactions.

46
The top line was inflated by a couple of large transactions – as well as Allergan, Actavis also bought Forest for $28bn, while the Novartis and Glaxo asset swap cost them each, respectively, $16bn and $7bn for oncology and vaccine franchises. Pharma& Biotech 2014 in review, Evaluate Pharma, March 2015 (Figure 43)
Figure 43: Pharma and Biotech M&A Activity
Source: Pharma & Biotech 2014 in review, EvaluatePharma, March 2015
Export of Israeli Life Sciences Products
According to Israel Export and International Cooperation Institute (IEICI) in 2014 the export of life sciences products from Israel reached $8.5 billion an increase of 4 percent compare to 2013 and it is 17.5 percent of all export from Israel (not including diamonds export). The most prominent markets for Israeli life sciences exports are still the US and Europe comprising more than 80 percent of the export.

47
Healthcare IT and Digital Health
The healthcare systems in many countries and especially in the U.S. are facing significant challenges such as increased cost, aging population, increase in the prevalence of chronic diseases, empowered consumers, fragmented care, insufficient use of information and shortage of healthcare professionals.
In addition, healthcare systems are also facing increased regulatory hurdles, difficult accessibility and more. Chronic diseases account for about 83% of healthcare expenditures with global healthcare cost reaching more than $4.2 trillion. The top 20 healthcare consuming countries contain 16% of the world population, yet spend nearly 90% of total global spending. The U.S. alone, with 5% of the world's population, spends over 45% of this sum. The remaining 84% of the world's population share 11% of global health spending, but account for nearly 95% of the diseases while allocating around 5% of their GDP to health.
A significant portion of global healthcare spending is non–value added, mostly due to unnecessary services, delay in care, excessive administrative costs, inflated prices and failure to prevent diseases. Many of these extra expenses are related to consumers’ misbehavior like obesity, smoking, medication non-adherence, alcohol abuse, non– adherence to wellness and exercise behavior etc. The challenges are to serve large patients’ populations with fewer resources.
On the other end, a new healthcare consumer is born – the Empowered Patients, who take an active role in their own disease management, and support that participation by acquiring knowledge about their disease or condition and treatment options. Patients are taking healthcare into their own hands by leveraging new technologies, using various devices to access health information anytime anywhere.
These developments are part of the evolution of the healthcare industry from reactive to proactive health management , which is based on empowering the patients, enabling the physicians, enhancing wellness and curing the well before they get sick, with an emphasize on personalization, prevention and patient responsibility.
Driven by this transformation, the healthcare IT market opportunity is huge, particularly as this industry was one of the least computerized with relatively limited use of IT in healthcare organizations. Quality and efficient healthcare delivery is highly dependent on information and communication, anytime and anywhere. On the other hand, mobile services are becoming the center of life. The mobile industry is a major enabling force and one of the biggest platforms in the history of mankind, resulting in the dramatic change in the way people live, work and play. Now, it also revolutionizes the way people receive medical care. IT is reimagining the ways we receive, experience, consume and deliver healthcare, enabling health and wellness to be delivered through mass personalization, anywhere and anytime. Thus, it makes healthcare delivery more valuable with better clinical outcomes in a cost efficient way.
48
Physician and consumers are ready to embrace a dramatic expansion of the High-Tech, personal wearable tech, smartphones-linked devices and mobile apps will become increasingly valuable in care delivery. A proliferation of approved and portable medical devices in patients’ home and on their phones, make diagnosis and treatment more convenient, reinforcing the dire necessity for strong information security systems. Privacy will lose ground to convenience in the near future as patients adopt digital tools and services that gather and analyze health information.
The healthcare IT market has been experiencing strong growth recently. This growth has been greatly driven by obvious healthcare needs such as described above, and also by the healthcare reform in the US with significant changes in regulation and legislation. Most notably, the HITECH Act (Health Information Technology for Economic and Clinical Health), was created to stimulate the adoption of electronic health records (EHR) and supporting technology in the U.S. healthcare system. In addition the move from fee-for-service reimbursement to value–based reimbursement is spurring hospitals to prevent readmission through the use of new technologies. As a result, more and more states cover remote consultation and in 2015, The Centers for Medicare & Medicaid Services (CMS) is expected to begin reimbursing physicians $42 per patient per month for providing virtual visits and other remote care.
As a leading innovation hub in information and communication technologies, mobile and cyber technologies, Israel can play a major role in this reform of healthcare services. With more than 20 years of expertise in implementing health IT, electronic medical records, business analytics and digital health in its four healthcare funds, this sector is thriving in Israel with at least 285 active companies in a variety of fields. (We are sure there are a few other companies that no available public data exists, so we could not analyze them)
Israel Healthcare IT and Digital Health Landscape
Number of companies
In this report we included active Israeli Health IT and digital health companies in the broader definition, including companies developing technologies for healthcare and medical applications, consumer-focused sports, fitness, and wellness solutions and provider and payer administration. Technologies like wireless devices, sensors and software sensing technologies, Telemedicine, social networking, Games for health, health information technology including Electronic Health Records (EHR), Personal Health Records (PHR), Analytics and Big Data technologies, genomics and personal genetic information.
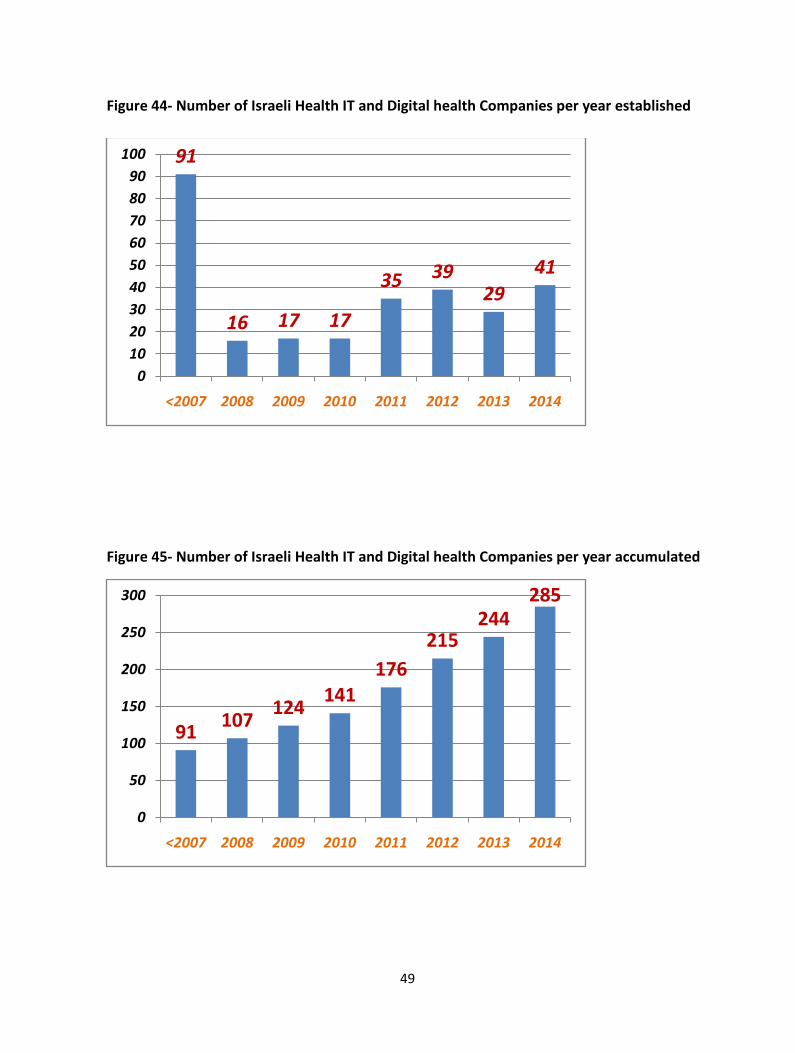
Half of the Israeli Health IT and Digital Health companies were established in the last four years, 144 (50%) with an average of 36 per year. (Figures 44, 45). Most of the companies are small with less than 10 employees 188 (66%), about a quarter are 10-50 employees 75 (26%) and very few are relatively large companies with more than 50 employees 22 (8%).
49
Figure 44- Number of Israeli Health IT and Digital health Companies per year established
Figure 45- Number of Israeli Health IT and Digital health Companies per year accumulated
91
16 17 17
35 3929
41
0102030405060708090
100
<2007 2008 2009 2010 2011 2012 2013 2014
91 107 124 141176
215244
285
0
50
100
150
200
250
300
<2007 2008 2009 2010 2011 2012 2013 2014
50
Subsectors
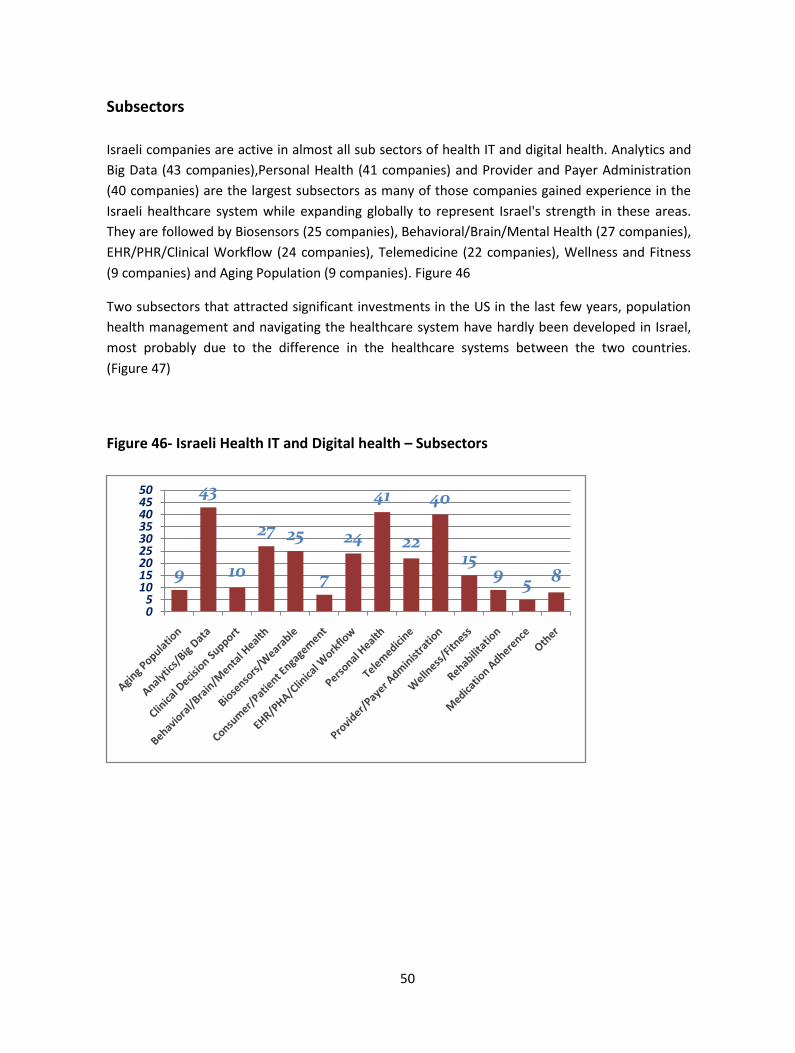
Israeli companies are active in almost all sub sectors of health IT and digital health. Analytics and Big Data (43 companies),Personal Health (41 companies) and Provider and Payer Administration (40 companies) are the largest subsectors as many of those companies gained experience in the Israeli healthcare system while expanding globally to represent Israel's strength in these areas. They are followed by Biosensors (25 companies), Behavioral/Brain/Mental Health (27 companies), EHR/PHR/Clinical Workflow (24 companies), Telemedicine (22 companies), Wellness and Fitness (9 companies) and Aging Population (9 companies). Figure 46
Two subsectors that attracted significant investments in the US in the last few years, population health management and navigating the healthcare system have hardly been developed in Israel, most probably due to the difference in the healthcare systems between the two countries. (Figure 47)
Figure 46- Israeli Health IT and Digital health – Subsectors
9
43
10
27 25
7
24
41
22
40
159 5 8
05
101520253035404550

51
Figure 47: Top most active Digital Health Sub sectors in US
The most prominent medical sub specialties are Neurology (16 companies), Psychology (12 companies), Cardiology, Genetics, Elderly, Obstetrics (10 companies each) and Diabetes (8 companies).
Israeli Health IT and Digital Health companies are offering different solutions in areas such as Big Data, business analytics and decision support systems. Few of thesecompanies areestablishedin the Israeli healthcare marketand want to expand globally like OpisoftCare and CliniWorks. Some are developing completely new technologies like MedCPU- that developed the medCPU Advisor which successfully improves documentation for billing purposes, adheres to payers’ and government requirements and can reduce the risk of clinical errors and the cost of care.

52
MediCloud which develops smart software layer above the electronic health record system that helps doctors make time critical decisions. Medial Research which develop predictive analytic models that accurately evaluate personal risk levels for serious diseases with the first application in colorectal cancer. MedAware uses big data analytics and machine learning algorithms to analyze how prescriptions largely deviating from the spectrum of standard treatment patterns. Treato identifies, aggregates and analyzes user-generated content from across the social health Web to generate "patient voice" insights that help drive health-related decisions for patients and providers. Zebra Medical develops Imaging Research Platform computer vision and deep learning that researchers can develop meaningful applications using best of breed computational power and large clinical data sets as well as many other companies.
In the telemedicine subsector Israeli companies have been able to establish positions as prominent global players, offering various services, devices, and software solutions. Among them are established companies like SHL Telemedicine, LifeWatch and Aerotel that are providing remote monitoring devices mainly in cardiology, but also in sleep disorders and asthma and also provide full patient monitoring software and monitoring services. Relatively new companies in remote patient monitoring include Tyto Care, Lifegraph, Kyma Medical, Sensible Medical, iMER Medical Services, MedicTouch, Doctome, Witalize Ltd (Beecardia) and others.
Based on the vast experience that Israeli companies gained in the local market for implementation of EHR (Electronic Health Record) they are also successful in the global market. Among them is dbMotion, a company that provides data aggregation and semantic interoperability by normalizing both data structure and content. The company stores or points to all the records of a patient while presenting a harmonized view to physicians in dbMotion's clinician portal. The company was acquired by U.S. healthcare IT company Allscripts in 2013 for $235 million. In another exit in this sub sector, iMDsoft, a provider of graphical clinical patient information systems for hospital intensive-care environments that automatically collect data, make calculations, generate reports, track costs, and provide analysis and querying tools, was acquired by U.S. private equity firm TPG Growth for $80 million in 2012. eWave MD offers a SaaS-based EHR as well as electronic diagnostic and monitoring devices, a patients' portal, and a disease management system. Also in this space are, MigrantHealth,Zoeticx, among others. Other companies such as LifeOnKey, Hello Doc and others are playing in the PHR (Personal Health Record) sub segment. Starlims, a company that developed an information technology suit for laboratories, was acquired by Abbott for $123M about two years ago.

53
Israeli companies are also demonstrating specific strength in biometric sensing and some of the technologies that were developed in Israel are based on military technologies. The abovementioned Kyma Medical and Sensible Medical are monitoring fluids in the lung in patients with congestive heart failure. There are several companies that monitor heart rate and other biometrics and have algorithms to remove the background noise like Early Sense, GluSense, Life Beam, Sensifree, Sport Tracker, Sleep Rate, Night Sense, Health Watch, Oxitone, HeartBeat Technologies, Hisense Medical, Temp-drop, Angel Sensor, MomSense, and others.
A recent trend within the healthcare IT market involves engaging consumers for healthier living and maintaining their treatments by using information and social tools. Among the Israeli companies that are active in this sub sector are Healarium, Wellness Layers, Cure My Way,Smoke Watchers, MediCope, Sweetch, Be-U, The MagicCapsule, Ethos, Telesofia and others. In the medication adherence sub sector there are a few Israeli companies like Medisafe, Telesofia Medical, Vaica Medical, MedPal Health Solutions, Irody and 2P2D Solutions.
Among the companies that are active in physical rehabilitation are Biogaming, Physihome, Libra@Home, Extreme Reality and ReAbility Online.In neurological rehabilitation are Intendo, AttenGo, myRay, Step of Mind, NeuroTrax, CogniFit, Abracadabra Robotics, SensoryTreat, Neurotech Solutions, Mindlift and others.
Another sub sector is providing health and wellness information and news to consumers and caregivers HealthTap, Medivizor, and Camoni.Israeli companies developing genomics-related IT solutions include Genoox, Genome Compiler and Nucleix.Other companies such as Kytera, Essence, Gestiphy, Perlis, Medilogi and others are aiming at the aging population, developing technologies to monitor adults at home.
Business Models
The digital health ecosystem is no longer just the patients, providers and health insurance companies but also includes the digital devices manufacturers, mobile operators, software companies, semiconductor makers and consumer brands. It is clear that new business models require collaborations between traditional healthcare providers and new entrants while aligning economic incentives. In the “traditional” Israel life science industry companies mainly developed products, medical devices and drugs, for the providers and very few developed directly to consumer products.
In the Health IT and Digital Health sector we see a relatively large number of Israeli companies developing products that are either B2C or B2B2C addressing the consumer/patient directly. As can be seen in figures 48, 54% (154 companies) of the Israeli companies are addressing the consumer/patient either directly or via a service provider while 46% (131 companies) are addressing the provider or payer.

54
Figure 48- Israeli Health IT and Digital health – Business Models
131
89
65 0
B2BB2B2C
B2C
129
25
131 00000
Consumer/Patient
Consumer/Patient/Provider
Provider/Payer/Company

55
Funding of the Healthcare IT and Digital Health Sub-Sector
Over the last two years there has been increased activity of Israeli and foreign venture capital funds in this sector. Among them are Tri-Ventures, OrbiMed, Lion- Bird, Fuerst Technology Innovations, LongTec China Venture and Horizons, as well as angel investors, accelerators and incubators.
In a recent report published by IVC Research Center (December 2014) the total amount invested in Israel Digital Health companies reached over $400 million in the last five years, out of this more than $200 million were invested in the last two years. $121 million were invested in 2013 and $85 million in 2014. The same trend of significantly increased investments going into the Digital Health sector is occurring globally as demonstrated by the $4.1 billion invested in 2014 according to Rock health Report (Figure 49)
Figure 49: Global investments in digital health
56
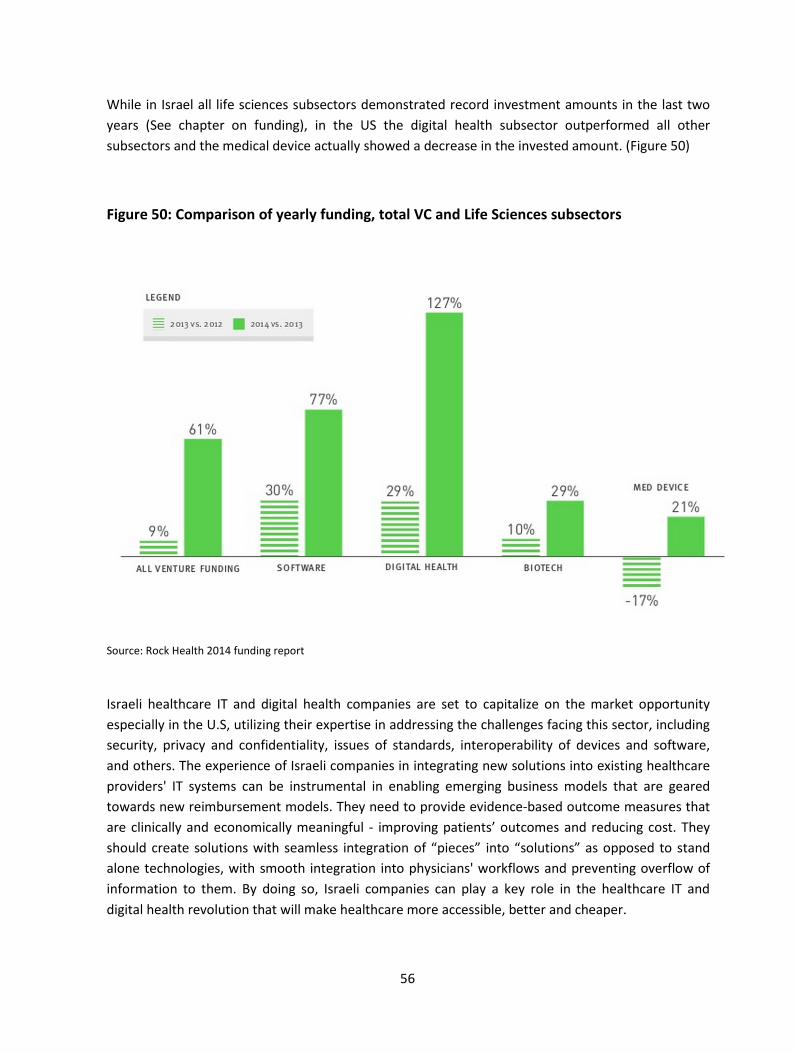
While in Israel all life sciences subsectors demonstrated record investment amounts in the last two years (See chapter on funding), in the US the digital health subsector outperformed all other subsectors and the medical device actually showed a decrease in the invested amount. (Figure 50)
Figure 50: Comparison of yearly funding, total VC and Life Sciences subsectors
Source: Rock Health 2014 funding report
Israeli healthcare IT and digital health companies are set to capitalize on the market opportunity especially in the U.S, utilizing their expertise in addressing the challenges facing this sector, including security, privacy and confidentiality, issues of standards, interoperability of devices and software, and others. The experience of Israeli companies in integrating new solutions into existing healthcare providers' IT systems can be instrumental in enabling emerging business models that are geared towards new reimbursement models. They need to provide evidence-based outcome measures that are clinically and economically meaningful - improving patients’ outcomes and reducing cost. They should create solutions with seamless integration of “pieces” into “solutions” as opposed to stand alone technologies, with smooth integration into physicians' workflows and preventing overflow of information to them. By doing so, Israeli companies can play a key role in the healthcare IT and digital health revolution that will make healthcare more accessible, better and cheaper.
57
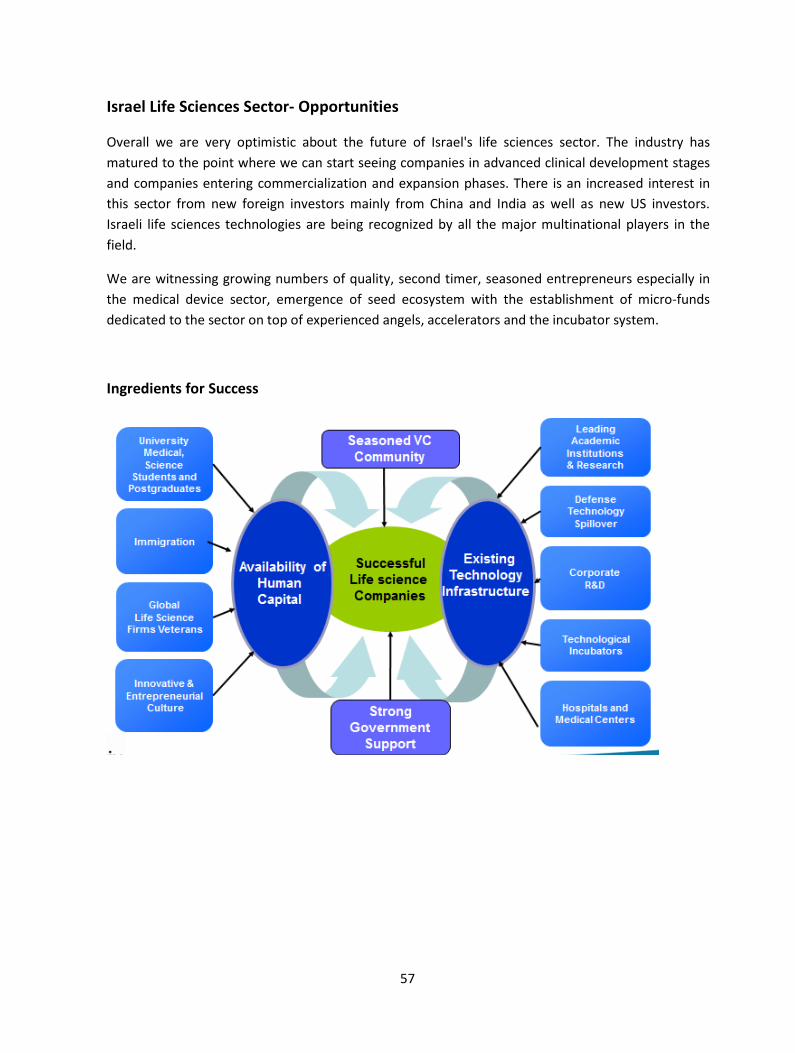
Israel Life Sciences Sector- Opportunities
Overall we are very optimistic about the future of Israel's life sciences sector. The industry has matured to the point where we can start seeing companies in advanced clinical development stages and companies entering commercialization and expansion phases. There is an increased interest in this sector from new foreign investors mainly from China and India as well as new US investors. Israeli life sciences technologies are being recognized by all the major multinational players in the field.
We are witnessing growing numbers of quality, second timer, seasoned entrepreneurs especially in the medical device sector, emergence of seed ecosystem with the establishment of micro-funds dedicated to the sector on top of experienced angels, accelerators and the incubator system.
Ingredients for Success
IATI - Israel Advanced Technology Industries
T 972-73-713-6313 | F 972-73-713-6314E iat i@iat i.co.il | W iat i.co.il


