Page 1
Deepthi A* et al. International Journal Of Pharmacy & Technology
IJPT| July-2015 | Vol. 7 | Issue No.1 | 8131-8145 Page 8131
ISSN: 0975-766X
CODEN: IJPTFI
Available Online through Research Article
www.ijptonline.com PREPARATION AND EVALUATION OF VALACYCLOVIR MICROSPHERES
Ramesh Y1, Deepthi A*
1, Madhavi C
1, Mamatha D
1, Gobinath M
1
Department of Pharmaceutics, Ratnam Institute of pharmacy, Pidathapolur (V & P), Muthukur (M),
SPSR Nellore (dist), Pin- 524346, A.P., India.
Email: [email protected]
Received on 29-06-2015 Accepted on 22-07-2015
Abstract:
The objective of the present study was prepared and evaluate valacyclovir microspheres by using emulsion solvent
diffusion technique.valacyclovir is loaded with ethyl cellulose & HPMC microspheres and it was prepared by emulsion
solvent diffusion method. The results of FTIR indicated the stable character of valacyclovir microspheres loaded with
ethyl cellulose microspheres and also absence of drug polymer interaction. The compatability studies like FTIR & DSC
were used to investigate there is no incompatability in the formulation. The Morphological particle size of valacyclovir
microspheres is carried out by SEM. The Microspheres were evaluated for total formulation codes is VM 1 to VM 9.
The Percentage Yield was found to be 73.33% to 88.88%.Drug content was 65.8 to 98.2. The Particle size of
microspheres 10 µm to 450 µm, Drug entrapment efficiency was 51.8% to 91.1 %, The drug loading capacity was
54.8% to 97.9%. The swellability studies was 0.2 sec to 1.5 sec. Invitro dissolution studies of best formulation VM8 was
found to be 88.92%. The invitro drug dissolution data obtained was fitted to various mathematical models such as zero
order, first order, Higuchi matrix & Krosmeyer peppas model. The valacyclovir microspheres follows model having
R2 value was 0.937,0.399,0.899,0.785 & m Value was 1593,0.061,11409,2.560 . The release of drug from the
microspheres extended up to 45 Mints. The valacyclovir loaded with ethyl cellulose & HPMC microspheres were
prepared under optimised conditions that shows good release characteristics.
Key words:
Valacyclovir, Microspheres, Invitro dissolution studies, FTIR & DSC.
Page 2
Deepthi A* et al. International Journal Of Pharmacy & Technology
IJPT| July-2015 | Vol. 7 | Issue No.1 | 8131-8145 Page 8132
Introduction
The Microsphere is defined as the spherical particle size varying with diameters in the micrometer ranges from 1μm to
1000μm, it containing a core substance. The microspheres containing synthetic polymers having characteristic free
flowing powders. They are biodegradable in nature, and also having a particle size is less than 200
micrometer.Microspheres is one of the multiparticulate drug delivery systems. It is prepared to obtain the prolonged (or)
controlled drug delivery, to improve the bioavailability or stability and to target the drug to specific sites. It is defined as
a solid spherical particles ranging from 1 to 1000μm, containing dispersed drug in microcrystalline form. Ethyl cellulose
is non-biodegradable, bio-compatible, non-toxic natural polymer. It is widely used in oral and topical formulation5.
Microspheres have gained wide acceptance as a means to achieve oral and parenteral controlled drug delivery systems.
Valacyclovir is an antiviral drug. It is used in the management of herpes simplex, herpes zoster (shingles), and herpes B.
It is a prodrug and it is being converted in vivo to acyclovir. Valacyclovir is a prodrug1. It incorporates the
monophosphate form into the viral DNA. It results in chain termination. It is also shown that the viral enzymes cannot
remove the aciclo-GMP from the chain, which results in the inhibition of further activity of DNA polymerase.
Valacyclovir is a nucleoside analogue DNA polymerase inhibitor. Valacyclovir hydrochloride is rapidly converted to
acyclovir which has been demonstrated the antiviral activity against HSV types 1 Herpes simplex virus (HSV-1) and 2
(HSV-2) and VZV (varicella zoster virus)both in cell culture and in vivo. The inhibitory activity of acyclovir is highly
selective due to its affinity for the enzyme thymidine kinase (TK). It is encoded by HSV and VZV2.
Materials
The pure drug of valacyclovir was obtained from Hetero drugs private limited, Hyderabad and the excipients like Ethyl
cellulose & HPMC were obtained from Tiny pharmaceuticals and the organic solvent Ethanol was obtained from
Himalaya pvt limited Nellore.
Methods
IR studies: In the preparation of drug and polymer may interact with each other, It leads to the instability of drug
preformulation studies regarding the drug and polymer interaction.They are very critical in appropriate polymer. FTIR
Spectroscopy was employed to ascertain the compatibility between Valacyclovir and the cellulose polymer3.
Page 3
Deepthi A* et al. International Journal Of Pharmacy & Technology
IJPT| July-2015 | Vol. 7 | Issue No.1 | 8131-8145 Page 8133
Differential scanning calorimetry: The output of a DSC is a plot of heat flux (rate) versus temperature at a
specified temperature rate. It provides information about the physical properties of the sample. It is in crys talline
or amorphous in nature .In formulations it demonstrates a possible interaction between the drug and
polymers,according to the thermograms4.
Morphology of the Particles:
Scanning Electron Microscopy: Scanning Electron Microscopy is a technique (SEM). It is very useful in ascetaing the
overall shape and morphology of the Microspheres. The morphology and surface appearance of both coated
microspheres and Ethyl cellulose microcapsules were found by Scanning Electron Microscopy (SEM)5. The particles
were freeze dried, and coated with gold palladium to achieve a film of 20nm thickness (Sputter coater, Balzers SCD 004,
Liechtenstein) and observed microscopically (SEM, JSM-6400, Tokyo, Japan).
Procedure of Valacyclovir Microspheres: The valacyclovir microspheres were obtained by the Emulsion solvent
Diffusion method by using distilled water as an external phase.The internal phase consists of a good solvent ethanol
including valacyclovir with concentration of polymers like HPMC& Ethyl cellulose.The drug and polymers were
codissolved in an organic solvent mixture with polymers with different ratio.The drug solution was slowly injected via
syringe in to the external water phase under agitating .The system was stirred at 800 rpm continuosly for about I
hr.Along with the good solvent diffusing in to the poor solvent. The droplets gradually solidified & formed
microspheres.The system was filtered to separate the microspheres from the preparation system.The resultant product
was washed with distilled water& dried.The whole process was carried out at room temperature6.
Evaluation of Microspheres
Percentage production yield (PY)
Practical mass of microspheres
PY (%) = × 100
Theoretical mass
Each formulation was carried out in triplicate and the PY (%) was calculated.
Entrapment efficiency: The Microspheres was prepared by Emulsion solvent diffusion technique .It was centrifuged at
14,000 rpm for 40 min at 10°C. The amount of Valacyclovir is encapsulated into the Ethyl cellulose & HPMC7. It was
Page 4
Deepthi A* et al. International Journal Of Pharmacy & Technology
IJPT| July-2015 | Vol. 7 | Issue No.1 | 8131-8145 Page 8134
the difference between the total amounts that are used to prepare the Microspheres and the amount was found in the
supernatant. The amount of free Valacyclovir in the supernatant was analyzed by UV-spectrophotometer at 250-255 nm.
It is calculated by the following equation
M Initial drug – M Free drug
%EE = X100
M Initial drug
Where
“MInitial drug” is the mass of initial drug used for the assay
“MFree drug” is the mass of free drug detected in the supernatant after centrifugation of the aqueous dispersion.
Drug loading efficiency: Drug loading efficiency was removed and the remaining sediments (precipitations) were
washed by distilled water.It is dispersed in a mixture of chloroform: acetone (2.5:2.5, v/v) in a 10 mL volumetric flask.It
is used to ensure the complete extraction of drug from Microspheres, then it was sonicated for 30 min.The volume was
made-up to 10 ml with chloroform8. The resulting solution was centrifuged at 14,000 rpm at 10°C for 30 min and
supernatants were obtained and analyzed in triplicate for the loaded drug by UV spectrophotometer at 250-255nm.
Particle size determination: Particle size of Microspheres was determined by using an optical microscopy method.
Approximately 100 microspheres were counted for particle size. The distribution of particle size was measured by
suspending in water9.
Equilibrium swelling studies of microspheres: A preweighed amount of microspheres was placed in Phosphate buffer
(pH7.4)10
. It is allowed to swell at a constant weight. The microspheres were removed and blotted with filter paper, and
their changes in weight were measured. The degree of swelling was calculated by the following formula.
α=wg-wo/wo
Where
Wo is the initial weight of the microspheres and
Wg is the weight of the microspheres at equilibrium swelling in the medium.
Page 5
Deepthi A* et al. International Journal Of Pharmacy & Technology
IJPT| July-2015 | Vol. 7 | Issue No.1 | 8131-8145 Page 8135
Drug content determination
50mg of Valacyclovir microspheres was crushed and suspended in water to extract the drug from the microspheres.
After 24 h, the filtrate was assayed spectrophotometrically at 234 nm for drug content against water as blank11
.
In-vitro drug release studies
In-vitro drug release studies were carried out by using USP XXIV dissolution apparatus type II, with 500 ml of
dissolution medium.It is maintained at 37±0.5 °C for 45 Mits, at 50 rpm, and pH 7.4 ± 0.2 phosphate buffers as
dissolution medium. It is also subjected to the In-vitro drug release studies. The results of In-vitro release
profile obtained for all the formulations were plotted in modes of data treatment as follows:
1. Log cumulative percent drug remaining versus time (first order kinetic model)
2. Cumulative percent drug release versus square root of time (Higuchi model)
3. Cumulative percent drug remaining versus time (zero order kinetic model)
4. Log cumulative Percent Drug released versus log time (korsmeyer’s model)
Results and Discussion:
Compatability studies for FT IR studies
The IR spectrum of the pure Valacyclovir sample is recorded by FTIR. This is compared with standard functional group
frequencies of Valacyclovir as shown in Table no 2. FTIR spectrum of formulation shown in Fig. 1 to 5.
Table No-1: Formulations of Valacyclovir Microspheres.
SI.
No
Ingredients VM1 VM 2 VM 3 VM 4 VM 5 VM6 VM 7 VM 8 VM 9
1 Valacyclovir 1.5 1 0.5 2 2.5 2 3 2.5 3
2 Ethyl
Cellulose
1 1.5 1 1.5 2 2.5 2 2 2.5
3 HPMC 0.5 0.5 0.5 1 1.5 1 0.5 1 1.5
4 Ethanol 10 ml 10 ml 10 ml 10 ml 10 ml 10 ml 10 ml 10 ml 10 ml
5 Distilled
water
100
ml
100
ml
100
ml
100 ml 100
ml
100
ml
100
ml
100
ml
100
ml
Page 6
Deepthi A* et al. International Journal Of Pharmacy & Technology
IJPT| July-2015 | Vol. 7 | Issue No.1 | 8131-8145 Page 8136
Table No-2: Interpretations of FTIR Spectra of Pure Drug and Excipients.
Observed
peak
Characteristic peak Bond Functional Groups
Pure Drug – VALACYCLOVIR
3462.22 3300-3500 -N-H- Amines
3342.64 3300-3500 -N-H- Amines
3236.55 2700-3300 C-H Stretch Aromatics
3101.54 2700-3300 C-H Stretch Aromatics
2933.73 2700-3300 C-H Stretch Aromatics
2883.58 2700-3300 C-H Stretch Aromatics
2850.79 2650-2880 C-H Stretch Aromatics
2802.57 2650-2880 C-H Stretch Aromatics
DRUG + ETHYL CELLULOSE + HPMC
3442.94 3300-3600
3000-3700
C=0 Stretch
O-H Stretch
Hydrogen bonded
alcohols and
phenols
3415.93 3300-3600
3000-3700
C=O Stretch
O-H Stretch
Hydrogen bonded
alcohols and phenols
3358.07 2700-3300
3000-3700
C-H Stretch
O-H Stretch
Aromatics
Hydrogen bonded
alcohols and phenols
3319.49 2700-3300
3000-3700
C-H Stretch
O-H Stretch
Aromatics
Hydrogen bonded
alcohols and phenols
3305.99 2700-3300
3000-3700
C-H Stretch
O-H Stretch
Aromatics
carboxylic acids or
H-Bonded alcohols
3269.34 2700-3300
3000-3700
C-H Stretch
O-H Stretch
Aromatics
Hydrogen bonded
alcohols and phenols
3130.47 2700-3300
3000-3700
C-H Stretch
O-H Stretch
Aromatics
Hydrogen bonded
alcohols and phenols
3111.18 2700-3300
3000-3700
C-H Stretch
O-H Stretch
Aromatics
Hydrogen bonded
alcohols and phenols
2972.31 2700-3300 C-H Stretch Aromatics
2873.94 2700-3300 C-H Stretch Aromatics
2856.58 2700-3300 C-H Stretch Aromatics
2816.07 2700-3300 C-H Stretch Aromatics
Page 7
Deepthi A* et al. International Journal Of Pharmacy & Technology
IJPT| July-2015 | Vol. 7 | Issue No.1 | 8131-8145 Page 8137
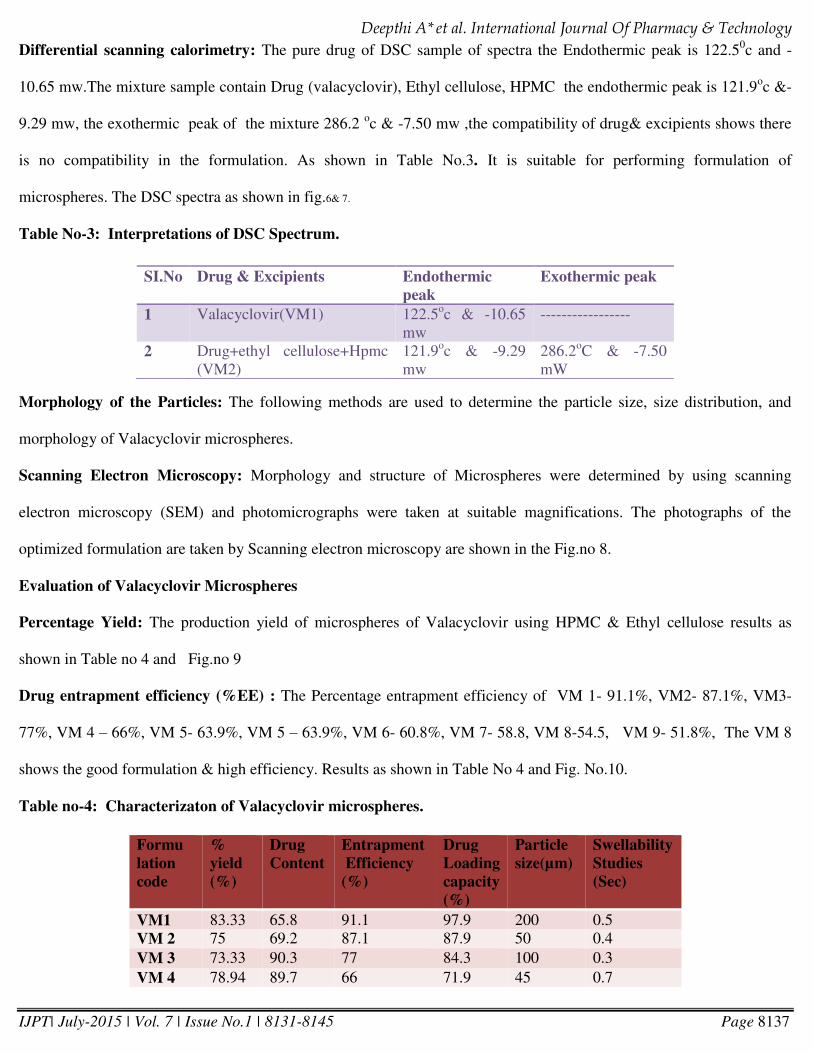
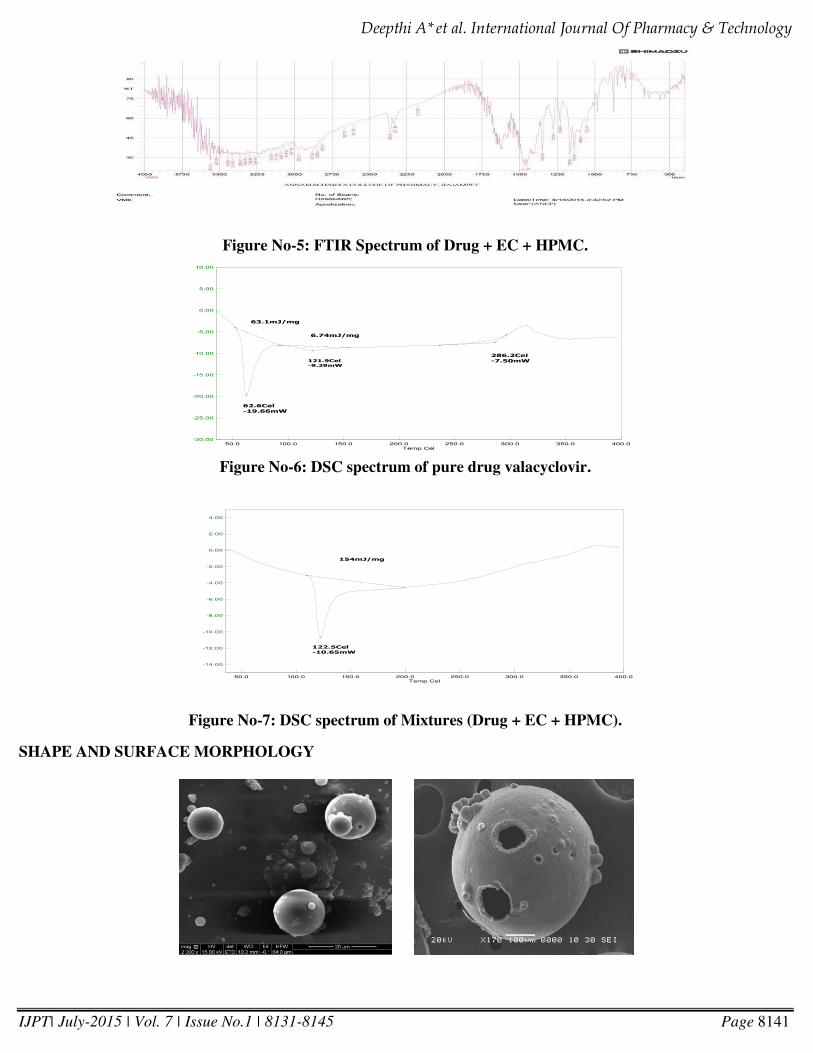
Differential scanning calorimetry: The pure drug of DSC sample of spectra the Endothermic peak is 122.50c and -
10.65 mw.The mixture sample contain Drug (valacyclovir), Ethyl cellulose, HPMC the endothermic peak is 121.9oc &-
9.29 mw, the exothermic peak of the mixture 286.2 oc & -7.50 mw ,the compatibility of drug& excipients shows there
is no compatibility in the formulation. As shown in Table No.3. It is suitable for performing formulation of
microspheres. The DSC spectra as shown in fig.6& 7.
Table No-3: Interpretations of DSC Spectrum.
Morphology of the Particles: The following methods are used to determine the particle size, size distribution, and
morphology of Valacyclovir microspheres.
Scanning Electron Microscopy: Morphology and structure of Microspheres were determined by using scanning
electron microscopy (SEM) and photomicrographs were taken at suitable magnifications. The photographs of the
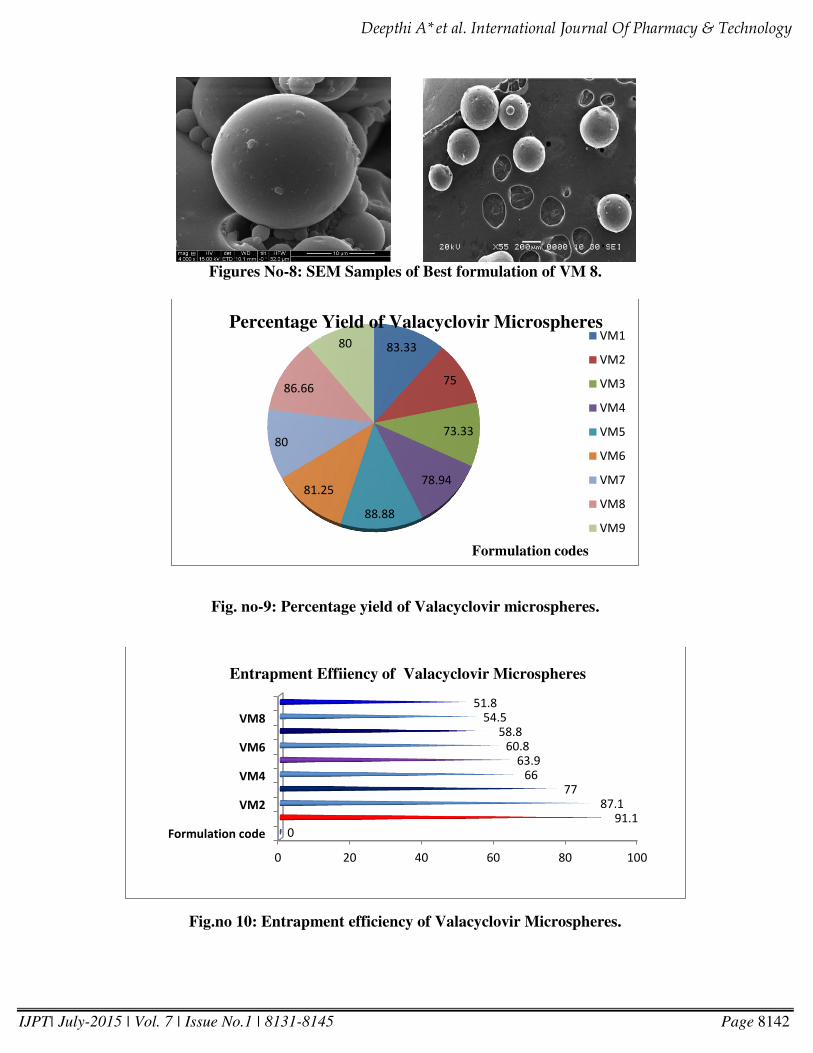
optimized formulation are taken by Scanning electron microscopy are shown in the Fig.no 8.
Evaluation of Valacyclovir Microspheres
Percentage Yield: The production yield of microspheres of Valacyclovir using HPMC & Ethyl cellulose results as
shown in Table no 4 and Fig.no 9
Drug entrapment efficiency (%EE) : The Percentage entrapment efficiency of VM 1- 91.1%, VM2- 87.1%, VM3-
77%, VM 4 – 66%, VM 5- 63.9%, VM 5 – 63.9%, VM 6- 60.8%, VM 7- 58.8, VM 8-54.5, VM 9- 51.8%, The VM 8
shows the good formulation & high efficiency. Results as shown in Table No 4 and Fig. No.10.
Table no-4: Characterizaton of Valacyclovir microspheres.
SI.No Drug & Excipients Endothermic
peak
Exothermic peak
1 Valacyclovir(VM1) 122.5oc & -10.65
mw
-----------------
2 Drug+ethyl cellulose+Hpmc
(VM2)
121.9oc & -9.29
mw
286.2oC & -7.50
mW
Formu
lation
code
%
yield
(%)
Drug
Content
Entrapment
Efficiency
(%)
Drug
Loading
capacity
(%)
Particle
size(µm)
Swellability
Studies
(Sec)
VM1 83.33 65.8 91.1 97.9 200 0.5
VM 2 75 69.2 87.1 87.9 50 0.4
VM 3 73.33 90.3 77 84.3 100 0.3
VM 4 78.94 89.7 66 71.9 45 0.7
Page 8
Deepthi A* et al. International Journal Of Pharmacy & Technology
IJPT| July-2015 | Vol. 7 | Issue No.1 | 8131-8145 Page 8138
Entrapment Loading (%EL): The Percentage entrapment loading of VM 1- 97.9%, VM2- 87,9%, VM3- 84.3%, VM
4 – 71.9%, VM 5- 70.4%, VM 6- 68.8%, VM 7- 64.8, VM 8-56.8, VM 9- 54.8%, The VM 8 shows the good
formulation & high efficiency. Results as shown in Table No.4 and Fig. No 11.
Particle size: The Particle size distribution of Microspheres represented by VM 1 (200µm ), VM 2 (50 µm), VM3
(100 µm), VM4 (45 µm), VM 5 (450 µm), VM 6 ( 300 µm), VM 7 (250 µm ), VM 8 ( 10 µm), VM 9 ( 100 µm),
Formula as shown in given Table No. 4 and Fig No 12.
Equilibrium swelling studies of microspheres: A preweighed amount (100 mg) of microspheres was placed in
Phosphate buffer (pH7.4) and allowed to swell to a constant weight. The microspheres were removed and blotted with
filter paper, and their changes in weight were measured results as shown in Table. no 4 and Fig. no .13.
Percentage drug content Determination: The Drug content distribution of Microspheres represented it indicated that
drug content is VM 1 ( 65.8%), VM 2 ( 69.2 %), VM3 ( 90.3%), VM4 (89.7%), VM 5 ( 75.2 %), VM 6 ( 85.2 %), VM
7 (88.5 %), VM 8 ( 98.2%), VM 9 (70.4 %), Formula as shown in given Table no 4 Fig.no 14.
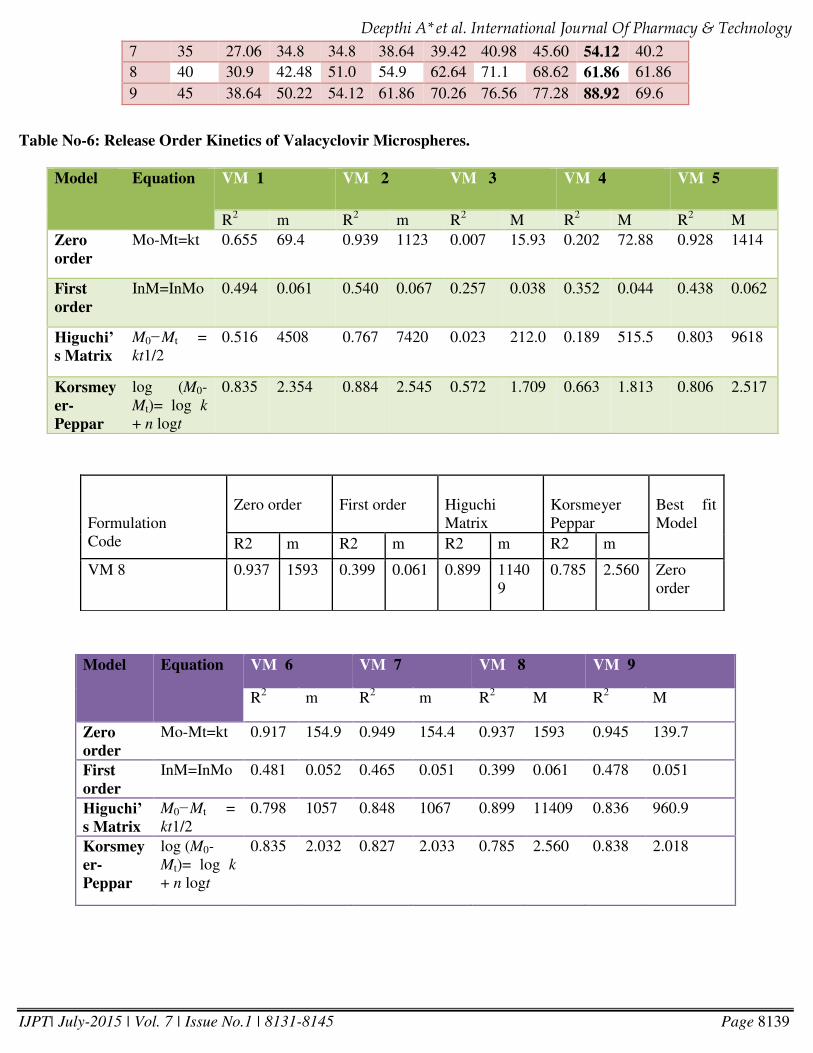
In vitro dissolution Studies:
For understanding the mechanism of drug release rate kinetics of the drug from dosage forms, the invitro drug
dissolution data obtained was fitted to various mathematical models such as zero order, First order, Higuchi matrix, and
Krosmeyer Peppas model. The values are complied in Table no 6. The % drug release with data to various kinetic
models for different microspheres formulations is presented in figure no. 15.
Table no-5: In Vitro dissolution Studies.
Sl.no Time % of Drug release
VM1 VM2 VM3 VM4 VM5 VM6 VM7 VM8 VM9
1 5 1.54 3.06 6.96 7.68 11.58 13.14 14.64 15.42 11.58
2 10 4.62 6.96 9.24 12.36 15.42 16.98 19.32 27.06 16.20
3 15 6.96 8.46 11.59 14.64 19.32 23.16 23.16 34.80 22.08
4 20 7.68 11.58 14.64 19.32 23.16 23.94 27.72 38.64 23.94
5 25 11.58 15.42 19.32 23.16 27.06 36.3 37.86 46.38 30.9
6 30 15.42 27.06 30.9 35.32 37.08 38.64 42.48 50.22 7.86
VM 5 88.88 75.2 63.9 70.4 450 0.2
VM 6 81.25 85.2 60.8 68.8 300 0.3
VM 7 80 88.5 58.8 64.8 250 0.2
VM 8 86.66 98.2 54.5 56.8 10 1.5
VM 9 80 70.4 51.8 54.8 100 1.5
Page 9
Deepthi A* et al. International Journal Of Pharmacy & Technology
IJPT| July-2015 | Vol. 7 | Issue No.1 | 8131-8145 Page 8139
7 35 27.06 34.8 34.8 38.64 39.42 40.98 45.60 54.12 40.2
8 40 30.9 42.48 51.0 54.9 62.64 71.1 68.62 61.86 61.86
9 45 38.64 50.22 54.12 61.86 70.26 76.56 77.28 88.92 69.6
Table No-6: Release Order Kinetics of Valacyclovir Microspheres.
Model Equation VM 1 VM 2 VM 3 VM 4 VM 5
R2 m R
2 m R
2 M R
2 M R
2 M
Zero
order
Mo-Mt=kt 0.655 69.4 0.939 1123 0.007 15.93 0.202 72.88 0.928 1414
First
order
InM=InMo 0.494 0.061 0.540 0.067 0.257 0.038 0.352 0.044 0.438 0.062
Higuchi’s Matrix
M0−Mt =
kt1/2
0.516 4508 0.767 7420 0.023 212.0 0.189 515.5 0.803 9618
Korsmey
er-
Peppar
log (M0-
Mt)= log k
+ n logt
0.835 2.354 0.884 2.545 0.572 1.709 0.663 1.813 0.806 2.517
Formulation
Code
Zero order
First order
Higuchi
Matrix
Korsmeyer
Peppar
Best fit
Model
R2 m R2 m R2 m R2 m
VM 8 0.937 1593 0.399 0.061 0.899 1140
9
0.785 2.560 Zero
order
Model Equation VM 6 VM 7 VM 8 VM 9
R2 m R
2 m R
2 M R
2 M
Zero
order
Mo-Mt=kt 0.917 154.9 0.949 154.4 0.937 1593 0.945 139.7
First
order
InM=InMo 0.481 0.052 0.465 0.051 0.399 0.061 0.478 0.051
Higuchi’s Matrix
M0−Mt =
kt1/2
0.798 1057 0.848 1067 0.899 11409 0.836 960.9
Korsmey
er-
Peppar
log (M0-
Mt)= log k
+ n logt
0.835 2.032 0.827 2.033 0.785 2.560 0.838 2.018
Page 10
Deepthi A* et al. International Journal Of Pharmacy & Technology
IJPT| July-2015 | Vol. 7 | Issue No.1 | 8131-8145 Page 8140
Figure No-1: FTIR Spectrum of Pure drug (Valacyclovir).
Figure No-2: FTIR Spectrum of Ethyl cellulose.
Figure No-3: FTIR Spectrum of HPMC.
Figure No-4: FTIR Spectrum of Drug + Ethyl cellulose.
Page 11
Deepthi A* et al. International Journal Of Pharmacy & Technology
IJPT| July-2015 | Vol. 7 | Issue No.1 | 8131-8145 Page 8141
Figure No-5: FTIR Spectrum of Drug + EC + HPMC.
Figure No-6: DSC spectrum of pure drug valacyclovir.
Figure No-7: DSC spectrum of Mixtures (Drug + EC + HPMC).
SHAPE AND SURFACE MORPHOLOGY
Temp Cel400.0350.0300.0250.0200.0150.0100.050.0
4.00
2.00
0.00
-2.00
-4.00
-6.00
-8.00
-10.00
-12.00
-14.00
122.5Cel
-10.65mW
154mJ/mg
Temp Cel400.0350.0300.0250.0200.0150.0100.050.0
10.00
5.00
0.00
-5.00
-10.00
-15.00
-20.00
-25.00
-30.00
62.6Cel
-19.66mW
63.1mJ/mg
6.74mJ/mg
121.9Cel-9.29mW
286.2Cel
-7.50mW
Page 12
Deepthi A* et al. International Journal Of Pharmacy & Technology
IJPT| July-2015 | Vol. 7 | Issue No.1 | 8131-8145 Page 8142
Figures No-8: SEM Samples of Best formulation of VM 8.
Fig. no-9: Percentage yield of Valacyclovir microspheres.
Fig.no 10: Entrapment efficiency of Valacyclovir Microspheres.
83.33
75
73.33
78.94
88.88
81.25
80
86.66
80 VM1
VM2
VM3
VM4
VM5
VM6
VM7
VM8
VM9
Formulation codes
Percentage Yield of Valacyclovir Microspheres
0 20 40 60 80 100
Formulation code
VM2
VM4
VM6
VM8
0
91.1
87.1
77
66
63.9
60.8
58.8
54.5
51.8
Entrapment Effiiency of Valacyclovir Microspheres
Page 13
Deepthi A* et al. International Journal Of Pharmacy & Technology
IJPT| July-2015 | Vol. 7 | Issue No.1 | 8131-8145 Page 8143
Fig. No-11: Drug Loading Capacity of Valacyclovir microspheres.
Fig. No-12: Particle Size of Valacyclovir microspheres.
Fig. no-13: Swelling index of Valacyclovir microspheres.
97.9
87.9 84.3
71.9 70.4 68.8 64.8
56.8 54.8
0
20
40
60
80
100
120
VM1 VM2 VM3 VM4 VM5 VM6 VM7 VM8 VM9
formulation codes
En
tra
pm
en
t lo
ad
ing
eff
icie
ncy
Drug loading capacity of valacyclovir Microspheres
0 100 200 300 400 500
VM1
VM2
VM3
VM4
VM5
VM6
VM7
VM8
VM9
200
50
100
45
450
300
250
10
100 PARTICLE SIZE OF VALACYCLOVIR MICROSPHERES
FO
RM
ULA
TIO
N C
OD
ES
Particle size
0
0.5
1
1.5
VM1 VM 2 VM 3 VM 4 VM 5 VM 6 VM 7 VM 8 VM 9
Swelling index of Valacyclovir microspheres
FORMULATION CODES
Sw
ell
ing
In
de
x
Page 14
Deepthi A* et al. International Journal Of Pharmacy & Technology
IJPT| July-2015 | Vol. 7 | Issue No.1 | 8131-8145 Page 8144
Fig. no-14: Percentage drug content of Valacyclovir microspheres.
Fig no-15: In vitro dissolution studies of valacyclovir microspheres.
Conclusion
The purpose of present work was to develop the microspheres of Valacyclovir for sustained drug delivery system. From
the results it seem that formulation VM 8 was found to be the excellent Morphological properties, % yield of
microsphere of best formulation was found to be VM 8 (86.66%), Entrapment efficiency of best formulation was found
to be (54.5 %) , Drug loading efficiency of best formulation was found to be (56.8 %), Swelling index best formulation
was found to be (1.5 sec),Particle size of best formulation was found to be(10 µm ) ,Drug content determination of best
formulation was found to be (98.2)and in vitro drug release was fitted with various Release kinetic studies of a
sustained manner with constant fashion over extended period of time for 45 Mints. It was observed that concentration of
0 20 40 60 80 100
VM1
VM2
VM3
VM4
VM5
VM6
VM7
VM8
VM9
65.8
69.2
90.3
89.7
75.2
85.2
88.5
98.2
70.4 DRUG CONTENT DETERMINATION OF VALACYCLOVIR MICOSPHERES
FO
RM
ULA
TIO
N C
OD
ES
Drug content Determination
0
10
20
30
40
50
60
70
80
90
100
0 10 20 30 40 50
VM1
VM 2
VM 3
VM 4
VM 5
VM 6
VM 7
VM 8
VM 9
In Vitro Dissolution studies of Valacyclovir Microspheres
Times (Mints)
% D
rug
Re
lea
se
Page 15
Deepthi A* et al. International Journal Of Pharmacy & Technology
IJPT| July-2015 | Vol. 7 | Issue No.1 | 8131-8145 Page 8145
Ethyl cellulose affected all the evaluation parameter significantly. Hence the prepared microspheres of Valacyclovir may
prove to be potential candidate for safe and effective sustained drug delivery.
Acknowledgement: The author are thankful to the Guide, HOD Principal, Ratnam Institue of Pharmacy, Pidathapolur,
Nellore for providing necessary facilities to carry out this work.
References
1. Pandya Ketul, Prajapati Ghanshyam, Dr. M. R. Patel, Dr. K. R. Patel, Dr. N. M. Patel, A Review On Microspheres,
Pandya Ketul et al., Internationale Pharmaceutica Sciencia ,Apr-June 2012 ,Vol 2 ,Issue 2, Page No 53-57,Issn 2231-
5896
2. S. M. Sarode, M. Mittal, R. M. Magar, A. D. Shelke, B. Shrivastava and G.Vidyasagar, Formulation and evaluation
of floating microspheres of Glipizide , S. M. Sarode et a.,J. Chem. Pharm. Res., 2011, 3(3):775-783, ISSN No:
0975-7384 .
3. R.Sathiya Sundar, A.Murugesan,P.Venkatesan,and R.Manavalan, Formulation Development and Evaluation of
Carprofen Microspheres, R.Sathiya Sundar et al., /Int.J. PharmTech Res.2010,2(3) July-Sept 201 ISSN: 0974-43040
,1674-1676.
4. Durgacharan A Bhaghwat, Mangesh A Bhutkar,Sachin S. Todkar, Shrinivas K. Mohite, Yogesh S. Gattani,
Formulation and evaluation of Controlled Release Microspheres of Isosorbide dinitrate, Durgacharan A. Bhagwat et
al.,Int.J. PharmTech Res.2009, 1(2), 125-128.
5. Nazia Khanam,Anupam K Sachan. Irshad Alam,Sudhir S Gangwar and Chinmay Anand, Design and
characterization of mucoadhesive microspheres of novel NSAID drug using algino-eudragit RS100 system, Nazia
Khanam et al., Der Pharmacia Sinica, 2011, 2(5):182-191, ISSN: 0976-8688.
6. Rajamanickam Deveswaran, Rajappan Manavalan, Varadharajan Madhavan, Srinivasan Bharath, formulation and
evaluation of albumin microspheres containing aceclofenac, Rajamanickam Deveswaran et al., International Journal
of Pharmaceutical Sciences Review and Research ,Volume 4, Issue 1, September – October 2010; pg no:112-117.
7. Patel Samirkumar, Tara Chand and Talsania Maulik, Formulation Development and Evaluation of Microspheres
Containing Duloxetine Hydrochloride, Patel Samirkumar et al.,International Journal of Research in Pharmaceutical
and Biomedical Sciences, ISSN: 2229-3701, Vol. 4 (2) Apr– Jun 2013,568-572
Page 16
Deepthi A* et al. International Journal Of Pharmacy & Technology
IJPT| July-2015 | Vol. 7 | Issue No.1 | 8131-8145 Page 8146
8. R.Sathiya Sundar, A.Murugesan,P.Venkatesan,and R.Manavalan, Formulation Development and Evaluation of
Carprofen Microspheres, R.Sathiya Sundar et al., /Int.J. PharmTech Res.2010,2(3) July-Sept 201 ISSN : 0974-43040
,1674-1676.
9. Vidhyaa Kumari,Vignesh Muruganandham, Formulation, Development & Characterization of Ofloxacin
Microspheres, Vidhyaa Kumari et al.,Indo Global Journal of Pharmaceutical Sciences, 2012; 2(2), pg no:130-141
10. Amitava Ghosh, Udaya Kumar Nayak, Prasant Rout, Tanusree Nag and Partha Roy, Preparation, Evaluation and
in vitro- in vivo Correlation (IVIVC) study of Lamivudine Loaded Microspheres, , Amitava Ghosh et al.,Research J.
Pharm. and Tech. 1(4oct.-Dec. 2008) I9 ISSN 0974-3618
11. Prasant K Rout, Bhabani S Nayak, Statistical Evaluation Of Losartan Microspheres Prepared By W/O Emulsion
Method Using Factorial Design And Responsesurface Methodology, Prasant K Rout et al.,Asian Journal of
Pharmaceutical and Clinical Research,Vol.2 Issue 4, October- December 2009 ISSN 0974-2441.
Corresponding Author:
Deepthi A*,
Email: [email protected]