Leveraging Best Practice Processes and Technology to Improve the Bottom Line Demonstrating the Business Value of Software Asset Management and Software License Optimization Featuring research from Issue 1
Transcript
Leveraging Best Practice Processes and Technology to Improve the Bottom Line
Demonstrating the Business Value of Software Asset Management and Software License Optimization
Software has become strategic to running nearly every type of business or organization and is pervasive in every facet of the business. The amount and variety of software running in most enterprises is staggering—from operating systems to middleware, virtualization software to all the business applications—databases, Office suites, ERP, procurement, HR, and CRM systems, and many more. Software represents 25 percent or more of the typical IT budget and for many organizations this budget item is increasing year-over-year. Even so, there has been very little oversight and control
over the software estate in many enterprises. Consequently, both over-spend and under-spend have been rampant. For these reasons alone, it’s imperative that enterprises implement software asset management and license optimization programs to gain visibility and control of their IT estate, reduce ongoing costs for software licenses and maintenance, and mitigate license compliance risk.
But, there are many challenges to achieving software license optimization, including increasing complexity in at least three areas: licensing, IT environments and the organization itself. Software licenses have been very complex all along and new license models continue to be developed by ISVs. Now we have sub-capacity licenses, for example, that come into play in virtual environments. And virtualization is a key aspect of the growing complexity of the IT environment. Lastly, today’s highly distributed, global organizations present additional license management challenges due to different rules applying to different locations, decentralized procurement processes, mergers, acquisitions and divestitures, and other issues. Software license management has become both more difficult and more critical, as a result.
2Introduction
4From the Gartner Files: How to Demonstrate the Business Value of SAM by Choosing the Right Metrics
9Software License Optimization Drives the Highest ROI
16About Flexera
Introduction
Mark Bishof CEO Flexera Software, LLC
3
Once a SAM and license optimization program has been implemented, it’s important for organizations to track metrics and key performance indicators (KPIs) to achieve three things. First, there must be a way to measure success in relation to business objectives so that management understands the value the program is delivering to the organization. Second, program costs should be tracked and measured against this value to demonstrate the return on investment (ROI) of the program. And third, organizations need to identify areas for continual process improvement.
Flexera Software has been pioneering Application Usage Management solutions for more than 20 years to help enterprises streamline the deployment of software and manage the full lifecycle of these critical assets. Our Software License Optimization solution, FlexNet Manager Suite for Enterprises, enables enterprises to track and manage hardware and software assets, manage contracts and optimize licenses to reduce software costs and maintain license compliance. Our solutions and services drive business value and deliver the highest return on investment through advanced license optimization technologies and best practice process expertise.
4
• Reporthonestly,identifyingissues and areas for improvement, as well as successes.
• Rememberthatgraphicalpresentationmake metrics more accessible to stakeholders who may not be familiar with the details.
What You Need to Know
As SAM matures and embeds itself within the IT organization, key performance indicators (KPIs) should be developed to track success against SAM objectives, and its contribution to the overall success of IT and the business.
Metrics should be selected to provide information about how and whether SAM objectives, and the business metrics SAM supports, are being met, and their measurement and reporting should be built into day-to-day processes to avoid the creation of further management overhead. Many elements of SAM can be measured, but this should not be done simply because it’s possible. Each metric that is reported on should be selected for the value it demonstrates relative to the cost of measuring the metric.
Analysis
IT asset managers struggle to obtain CIO or CFO support, and to justify investment in IT asset management (ITAM) in order to secure the permanency of the discipline, and to ensure that IT is continually run as a business. It can be difficult for organizations to understand why ITAM, and the SAM discipline that forms a core part of it, are necessary to the successful running of the business, when SAM
Software asset managers often ask Gartner for advice on how to demonstrate the value they deliver. We look at the metrics that should be used, how to select key metrics for your business and how to present the results effectively.
Key Findings
• Whatcanandshouldbemeasuredincreases with software asset management (SAM) capabilities and maturity.
• Thevalueofametricdependsontheorganizational objectives it supports.
• MetricsforSAMareoftenneglecteddue to the reactive nature of much of the initial activity.
• Somemetricsareeasytomeasureandoffer high value, while others may be hard to collate and offer low value.
Recommendations
• Softwareassetmanagersshould:
• Ensurethattheirmissionandobjectives are clearly documented and communicated.
• Provideaudience-appropriatereporting and be selective in what is communicated, tailoring reports to make them relevant to stakeholders and to the IT staff receiving them.
is associated with the need for unbudgeted spending to resolve compliance issues as a result of software vendor audits.
Without metrics, SAM is only reactive, dealing with audit threats as they arise to minimize the financial impact of the outcomes instead of preventing noncompliance, or removing unused software rather than ensuring that the installations are fully justified in the first place. Without metrics, there is no mechanism in place to measure success or identify areas for improvement, so SAM is often underresourced and underfunded.1
Gartner defines SAM as a framework and set of processes that strategically track and manage the financial, physical, licensing and contractual aspects during the life cycle of software assets. SAM plays an important role in the acquisition and retirement of software, including strategies to identify and eliminate underutilized software, the consolidation of licenses, or the move to new licensing models. The SAM discipline aims to create a dependable account of software asset costs and risks, providing support for software strategy, architecture, service management, funding and sourcing decisions.
Establish the Principles of MeasurementUse your mission statement for SAM to define the objectives that need to be measured, and to focus SAM activity and measure success. Software asset managers should put measurements in place that provide clear management information about SAM activity, demonstrating the contribution their activity makes to business objectives.2 Review the existing metrics to report compliance to IT SLAs
From the Gartner Files:
How to Demonstrate the Business Value of SAM by Choosing the Right Metrics
1In the 24 months to the end of January 2012, Gartner’s IT asset management and procurement team fielded 1,792 interactions with clients on the topic of SAM. 2ITIL includes performance metrics and continuous improvement as part of the overall management process for SAM: 5.1.5 “Performance Metrics and Continuous Improvement.” The overall management processes have responsibility for performance management of SAM processes, including:
From Chapter 5 — Process Overview ITIL V3 “Guide to Software Asset Management” by Colin Rudd.
5
5
or operating-level agreements in support of the business. Also keep a detailed record of the costs of supporting SAM (including people, tools, third parties and overheads) to demonstrate ROI, and to measure workloads for capacity planning purposes. However, these management metrics don’t always need to be reported.
In addition to being used to manage risk and cost, metrics can be used to demonstrate successes and identify necessary improvements and areas for investment.3 Present these metrics graphically when communicating with stakeholders, sponsors and auditors. When deciding what to measure, in each case consider:
• Howmeasuringitwillhelpmanagecost and risk to meet IT and business objectives
• Howmeasuringitcanhelpwithcycleof continuous improvement, and show progress
• Howyouwillmeasureit(andwhatyouneed to be able to do in order to measure it in the future if you can’t measure now)
• Howyouwillpresenttheinformation
• Whoyouwillpresenttheinformationto
Keep Measurements PracticalSAM involves the management of large volumes of data so there are many measurement points, including:
• Timetakentoapprovepurchaseorders
• Volumeofsoftwareinstalled
• Quantityofsoftwarecurrentlybeingused
• Numberoflicensekeysheld
• Typesoflicensemodels
• Numberoflicensekeysissued
• Subscriptionandsupportentitlements
• Excesslicenses/shelfware
• Numberofauditsundertaken
• Spendingonsoftwarelicenses
• Spendingonsoftwaresupportandmaintenance
• Numberofsupportandmaintenancerenewals
• Savingsandcostavoidance
• Noncomplianceandliabilities
• Changestoanyoftheabove:
• Forecastsforanyoftheabove
• Statusofanyprojectssupportingtheabove
• Costofcarryingouttheabove,andthe status of the human capital pool to support this
Whether these things can be measured will depend on the processes and tools you have in place. It is worth taking time to understand what you are capable of measuring before you make a decision as to what should be measured, as there is no value in deciding to report on something you have no data for, or that does not relate to your objectives.
In many cases, much of what you can measure can be used to support metrics and KPIs that add value to SAM. For example, measuring entitlement volumes will provide data that can be used to report on contract information, license holdings and software acquisitions.
Classify Measurement ImpactsMetrics by themselves aren’t necessarily performance indicators, so metrics should be aligned with SAM objectives in order to develop KPIs that have meaning for business stakeholders. These measures should be qualitative and quantitative.
Useful metrics to support cost and risk management include:
• Dataquantity—volumesoflicensesand raw consumption data under management
• Dataquality—unrecognizedfiles,entitlement grids and frequency of data validation checks
• Continuousimprovement—showingmonth-on-month changes (this is where graphs come in handy)
• Businessbenefits—auditriskreductionsand cost savings on licenses and maintenance against the budget
• Costmanagement—costavoidancethrough license reuse and recycling, and more appropriate license models
• Riskmanagement—risksidentifiedandrisks resolved (and tracking the progress from one to the other)
3”Gartner Survey Shows That ITAM’s Benefits Change in Importance as Maturity Increases” states that, “when combined with the analysis on cost savings that we covered in a previous note (“Gartner Survey Shows How to Save Money With ITAM”), the highest priorities for starting ITAM programs are not about cost savings per se, but more about gaining control over licensing and assets. This benefits ranking also reinforces our survey data which shows that many ITAM programs (40%) initially do not track savings from an ITAM program. Organizations that are looking to get better control of their licensing or assets are unlikely to use measuring cost savings as the reason to start a program.”
6
• Volumeofwork—tojustifycurrentresource levels or requests for increases or decreases, whether temporary or permanent through automation
KPIs are indicators of financial performance, and provide insight into the financial impact of operational activities. Table 1 divides KPIs for SAM into cost, risk and value indicators, and provides examples of how these might be calculated.
When calculating KPIs, software asset managers need to show progress on what they have been tasked to achieve. Although many organizations focus primarily on cost savings, software asset managers need to report on the activity that supports cost saving, and demonstrate the correlation between, for example, data quality and cost management. KPIs are calculated from base metrics, so once the KCI, KRI and KVI are established, you can return to the list of what you have the capability to measure, and select the metrics on which to base the KPIs. Where you do not currently have the data you need available, allow for it in your calculations, and establish what needs to be done to get the data. This will form part of the plan for continuous improvement.
If the KCI is management of software support and maintenance spending, and is calculated based on savings against budgeted and unbudgeted spending, you will need to gather data on the budget for all planned support and maintenance, and track what is actually spent, noting
the savings (and the reason why) and any unbudgeted spending (and the reason why). This will allow you to identify the activity that supports savings, the issues causing unbudgeted spending, which can then be tackled, and any concerns about the way budgets are set and managed.
Base Indicators on Base MetricsMetrics will evolve over time, but the basic sources remain the same. If the objective is to improve your inventory data until over 95% of executable files are recognized, once you reach that state, the metric may change to maintaining it. Effort can then be directed elsewhere, and focus would only return to this area if reports indicate a fall below this level, for example, for three months in a row (or a fall of more than 5%). There will be some improvement metrics and some that ensure the standard achieved does not slip.
It is unwise to have too many metrics, as this can mean spreading resources too thinly. Based on your objectives, prioritize the top six metrics to focus on, and ensure that they are constructive. Assessing your objectives using specific, measurable, attainable, relevant and timely (SMART) methodology4 can help you to develop KPI calculations that are focused, and have clear milestones or deadlines. Remember that an achievable target will never be 100%, as there are always factors that will prevent this. Even the most ambitious targets are rarely set at more than 99.9%; when they are, it is likely that there will be qualifications as to how they are measured.
Gartner’s definition of SAM provides a starting point for the development of metrics, and Table 2 shows what you might want to demonstrate from each type of metric, depending on the level of ITAM maturity in your organization. What you can measure will help you to establish your maturity level for the processes that support these metrics.
What to CommunicateIt is important to report both the good and the bad, always making sure the data supplied is relevant to the audience. Reporting on bad news enhances your credibility when you combine it with an analysis of why SAM did not achieve its objective and the corrective measures taken. Some of the more detailed information may only be used within the SAM team, or for selected use, such as building business cases or reporting to specific stakeholders. Some data may be extremely sensitive (such as the details behind the KRI about risk and liabilities, and what is being done to address them), so it may have a limited audience, and controls around its communication.
How to CommunicateConsider your audience at all times. Many organizations find that a traffic light system for headline reporting in a dashboard format is helpful. Graphical representations make information accessible, and simple traffic lights alert stakeholders to the elements they need to focus on. Much reporting is now available and managed online, which allows
SAM sponsors SAM costs Staff time Tool spending Data integration Process integration
Continuous improvement
Source: Gartner (April 2012)
Table 2. Basic Metrics
stakeholders to access the information at their own convenience, and to access the elements they need. Targeting reports ensures that stakeholders are engaged, as they do not have to read, or listen to, information that is not relevant to them. Sensitive or high-priority information may be reported during face-to-face meetings, rather than in standardized reports.
When to CommunicateIn general, scheduled monthly reporting of standard KPI data is sufficient, with progress and improvement reports on a quarterly basis. However, it is important to plan for any additional reporting requirements. Progress reports maybe required during project phases, and many software asset managers are also required to report regularly to their audit committee, risk management function and financial auditors at year end.
Show Continuous ImprovementReview your metrics and their management processes regularly, and assess where changes and improvements can be made based on stakeholder feedback to your communication and reporting processes. Visibility of metrics often increases stakeholder engagement, and the potential for proactive changes and improvement for all SAM activities.
IT and the business, and has traditionally been tasked with preventing risk and controlling expenditure. Although this is important, compliance is a byproduct of good SAM, and not the primary objective. Well-designed metrics can help to change this perception and present it as an enabler.
• Whenpresentingmetrics,donotoverwhelm your audience. You may need to present the data to different audiences, so develop management reports that can be tailored appropriately, presenting financial data to finance, risk data to risk and so on. Consider who your stakeholders are, and what information is relevant and of interest to them.
Source: Gartner Research, G00226468, V. Barber, S. Buchanan, 10 April 2012
4For more details on SMART goals and how to develop them, see SMART criteria.
9
Software License Optimization Drives the Highest ROI
Boosting the Bottom Line by Reducing Software Costs
Software license optimization delivers a number of very tangible benefits to the enterprise, including increased visibility and control over IT assets and reduced license compliance risk. The focus here is on business value and a key benefit of software license optimization is cost reduction and cost avoidance. In fact, organizations can achieve upwards of 5-30% savings in annual software spend by implementing a robust software asset management and software license optimization program. A Gartner survey on top CIO business priorities for 2012 had “reducing costs” among the top three priorities.
Yet, in spite of this, IT organizations have frequently struggled to get management buy-in for SAM programs and consequently, haven’t had the budget to implement one. One reason for this is that traditionally, SAM technologies and projects focused on counting assets – hardware and software inventory, and maybe doing some reconciliation against purchases. But the process was not very automated and was far from easy – it was a lot of work to bring in the purchase order data, figure out what was actually purchased and match that up with the inventory data.
For example, the organization may have purchased Adobe Creative Suite 5 (CS5) Design Premium, but the inventory data showed that Acrobat and Dreamweaver were on some machines and Photoshop and Illustrator were on some others. It took some real digging to figure out that the Creative Suite purchase covered some or all of those installations. At the end of the day, maybe all this hard work got the organization through a software audit or annual true-up event, but it didn’t help it dramatically reduce software costs or avoid the audit in the first place. In many cases, an audit resulted in a big unbudgeted true-up fee, since the organization was out of compliance and didn’t know it (or couldn’t prove otherwise) until the audit took place.
Furthermore, the traditional SAM process and tools didn’t take into account vendor-specific product use rights and other license optimizations. Consequently, the return on investment (ROI) was low and projects languished or died altogether, since they weren’t delivering enough value to the business.
But, software license optimization products have been developed that far exceed the capabilities of traditional SAM tools. Next generation solutions now have built-in Stock Keeping Unit (SKU) libraries, for example, that allow purchase order data to be automatically matched up with inventory data to help streamline the license reconciliation process. Now organizations can see their license position at “the push of a button” and maintain continuous license compliance – avoiding those costly license audits.
License optimization solutions also provide product use rights libraries that capture vendor license entitlements, which, when properly applied can reduce license consumption considerably – right of second use, multiple (versions) installation rights, virtual use rights, cold backup/failover rights, etc. all entitle organizations to have multiple installations covered under a single license. This type of
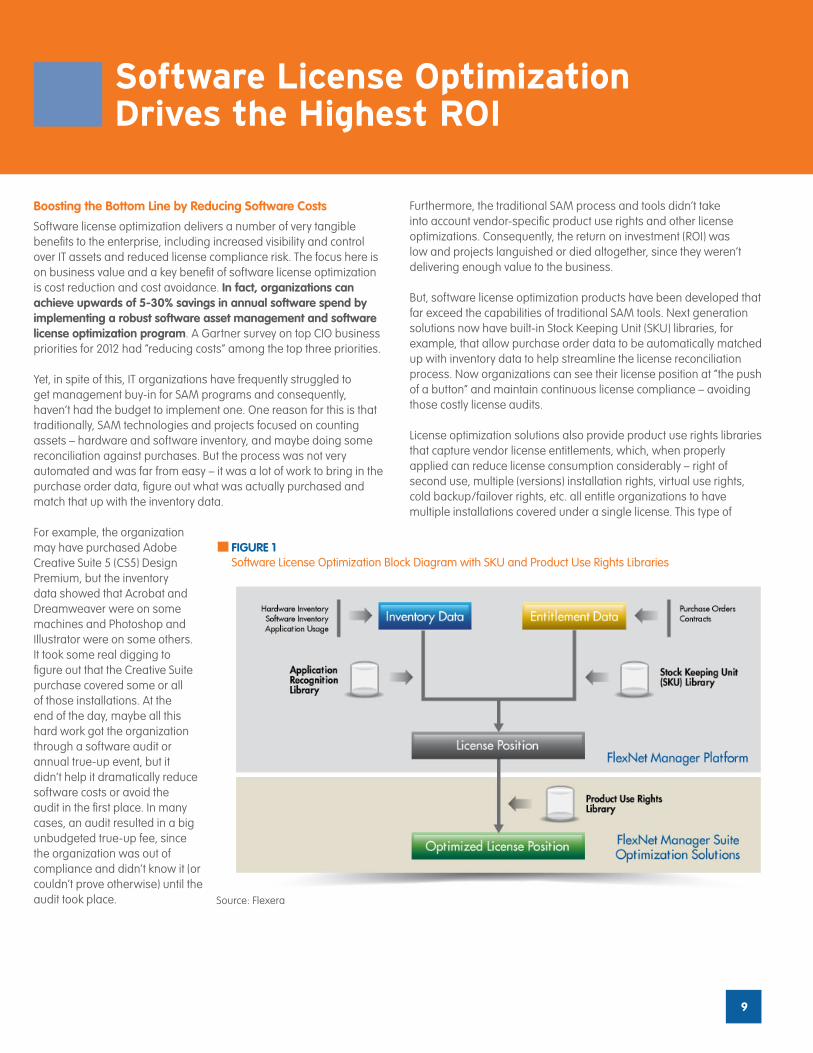
Source: Flexera
FIGURE 1Software License Optimization Block Diagram with SKU and Product Use Rights Libraries
10
optimization was very hard to do with manual processes, and as a result, companies over bought software licenses – ‘to be on the safe side.’
With these advances, the probability of success of the software asset management and license optimization program has been greatly increased, as has the potential return on investment. So, the first order of business is to build a credible business case that allows the organization to implement a program. It’s important to note that, as stated in Gartner’s Software License Optimization Vendor Overview report: “Software license management tools are a supplement to an IT asset management (ITAM) program, not a replacement.”
Building the Business Case
Here is a rudimentary business case for a SAM and license optimization program for a hypothetical financial services company that has $5 billion in revenue. The typical IT budget as a percentage of revenue varies by industry, with financial services coming in at about 4% of revenue:
Savings from SAM and License Optimization: $50M * 10% = $5 million
We estimate that the first year cost of their software asset management and license optimization program, including IT staffing (at 2.5 FTEs), consulting services and tools is about $850,000. Then the return on investment in the first year of implementation is:
We see that the return on investment is substantial, even at the 10% savings rate. And there is empirical evidence (see customer example below ) from existing customers that this savings rate is very realistic and in fact is at the low end of the range.
Pharmaceuticals - 5.8%
High Tech - 4.6%
Consumer Products - 2.6%
Automotive - 2.1%
Aerospace & Defense - 4.3%
Retail - 2.6%
Chemicals - 2.2%
Oil & Gas - 1.8%
Financial Services - 4%
Hypothetical Financial Services Company
Total IT budget: $5B * 4% = $200 million
If their software budget is say, 25% of their IT budget, then:
Total Software budget: $200M * 25% = $50 million
If, within the first year of implementation, the company can realize just a 10% savings on its software spend by implementing a SAM and license optimization program, the savings is:
The next order of business is to track metrics and key performance indicators to calculate business value, determine actual return on investment and identify areas for process improvement.
A multi-national company based in Europe has recently re-implemented its IT Asset Management program using FlexNet Manager Suite for Enterprises for software asset management and license optimization and leveraging the license management process expertise of the Flexera Software consulting services organization. The program is focused on five key vendors that represent the vast majority of their software spend: Microsoft, Adobe, IBM, Oracle and VMware. They have realized more than $35 million dollars in savings on just two of these vendors in the first year of the new program. The company’s annual software budget is about $200 million, so the savings represents about 17.5% of the budget.
Customer Savings Example
11
Source: Flexera
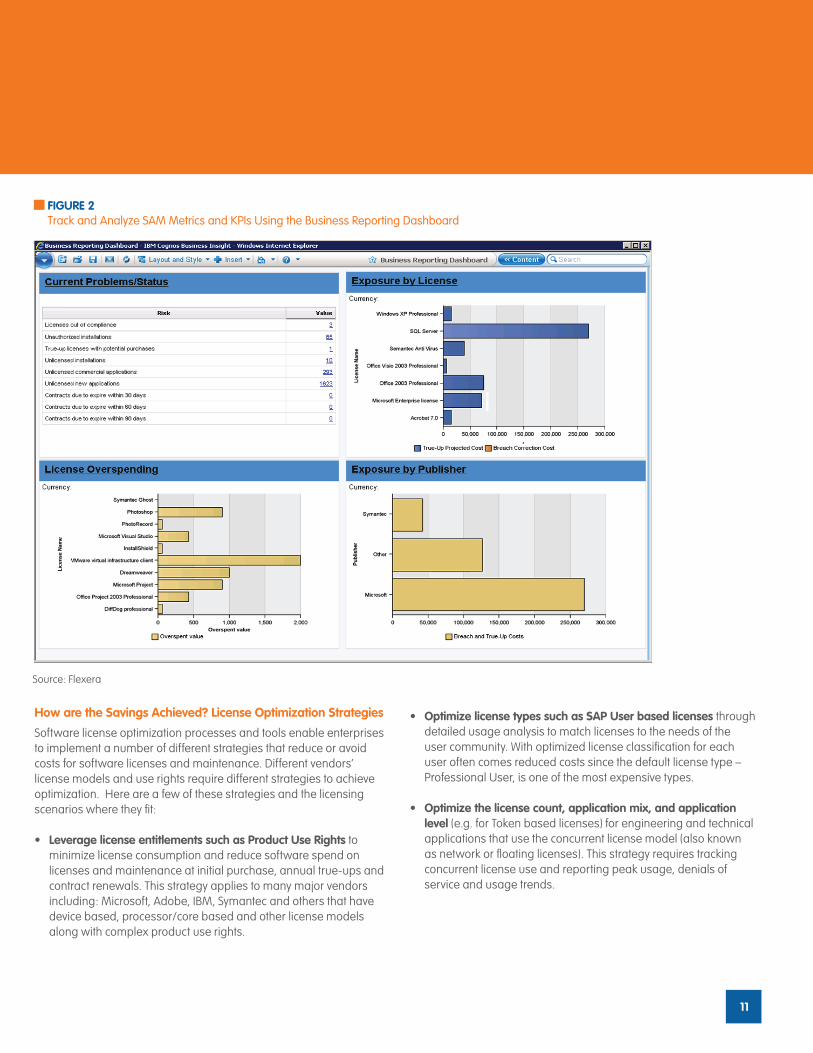
FIGURE 2Track and Analyze SAM Metrics and KPIs Using the Business Reporting Dashboard
How are the Savings Achieved? License Optimization Strategies
Software license optimization processes and tools enable enterprises to implement a number of different strategies that reduce or avoid costs for software licenses and maintenance. Different vendors’ license models and use rights require different strategies to achieve optimization. Here are a few of these strategies and the licensing scenarios where they fit:
• Leverage license entitlements such as Product Use Rights to minimize license consumption and reduce software spend on licenses and maintenance at initial purchase, annual true-ups and contract renewals. This strategy applies to many major vendors including: Microsoft, Adobe, IBM, Symantec and others that have device based, processor/core based and other license models along with complex product use rights.
• Optimize license types such as SAP User based licenses through detailed usage analysis to match licenses to the needs of the user community. With optimized license classification for each user often comes reduced costs since the default license type – Professional User, is one of the most expensive types.
• Optimize the license count, application mix, and application level (e.g. for Token based licenses) for engineering and technical applications that use the concurrent license model (also known as network or floating licenses). This strategy requires tracking concurrent license use and reporting peak usage, denials of service and usage trends.
12
Rentokil Initial is one of the largest business services companies in the world, operating in the major economies of Europe, North America, Asia Pacific and Africa. It employs 80,000 people in 49 countries. They needed to introduce a global software asset management (SAM) solution and selected FlexNet Manager Suite for Enterprises, including the FlexNet Manager for Microsoft solution. Martyn Howe, Director of IT Services at Rentokil Initial, said, “Once the implementation of FlexNet Manager for Microsoft was complete, we found we were significantly over licensed….Our over subscription in the UK alone represents a six figure sum and we have introduced a freeze on UK license purchasing until the over subscription has been consumed.”
• Reharvest unused licenses and recycle licenses allocated to hardware that is being retired. This strategy applies to many device based and user based licenses and is best used after the organization has arrived at a point where it can generate an accurate and optimized license position. This strategy is the “fine tuning” that allows organizations to defer new license purchases by better utilizing the software they already own. The license reharvesting strategy requires tracking usage of the application, which typically means that an inventory agent is installed on the device (desktop, laptop, or server).
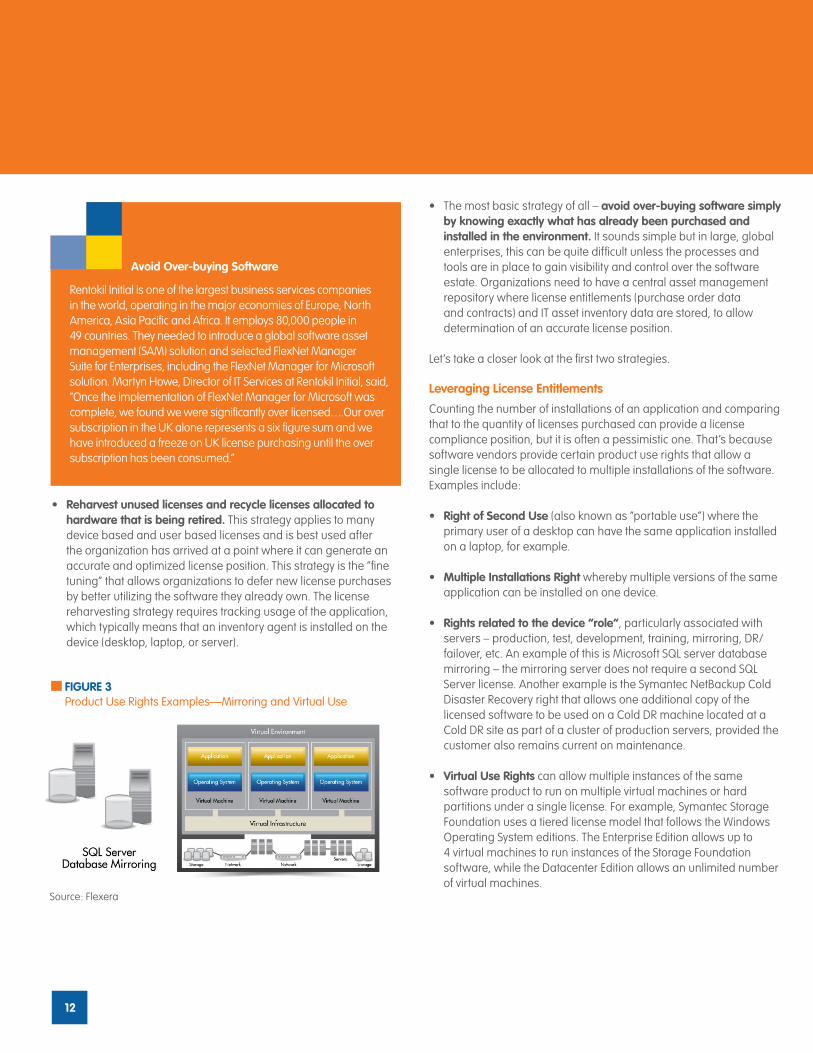
FIGURE 3Product Use Rights Examples—Mirroring and Virtual Use
Source: Flexera
• Themostbasicstrategyofall–avoid over-buying software simply by knowing exactly what has already been purchased and installed in the environment. It sounds simple but in large, global enterprises, this can be quite difficult unless the processes and tools are in place to gain visibility and control over the software estate. Organizations need to have a central asset management repository where license entitlements (purchase order data and contracts) and IT asset inventory data are stored, to allow determination of an accurate license position.
Let’s take a closer look at the first two strategies.
Leveraging License Entitlements
Counting the number of installations of an application and comparing that to the quantity of licenses purchased can provide a license compliance position, but it is often a pessimistic one. That’s because software vendors provide certain product use rights that allow a single license to be allocated to multiple installations of the software. Examples include:
• Right of Second Use (also known as “portable use”) where the primary user of a desktop can have the same application installed on a laptop, for example.
• Multiple Installations Right whereby multiple versions of the same application can be installed on one device.
• Rights related to the device “role”, particularly associated with servers – production, test, development, training, mirroring, DR/failover,etc.AnexampleofthisisMicrosoftSQLserverdatabasemirroring–themirroringserverdoesnotrequireasecondSQLServer license. Another example is the Symantec NetBackup Cold Disaster Recovery right that allows one additional copy of the licensed software to be used on a Cold DR machine located at a Cold DR site as part of a cluster of production servers, provided the customer also remains current on maintenance.
• Virtual Use Rights can allow multiple instances of the same software product to run on multiple virtual machines or hard partitions under a single license. For example, Symantec Storage Foundation uses a tiered license model that follows the Windows Operating System editions. The Enterprise Edition allows up to 4 virtual machines to run instances of the Storage Foundation software, while the Datacenter Edition allows an unlimited number of virtual machines.
Avoid Over-buying Software
13
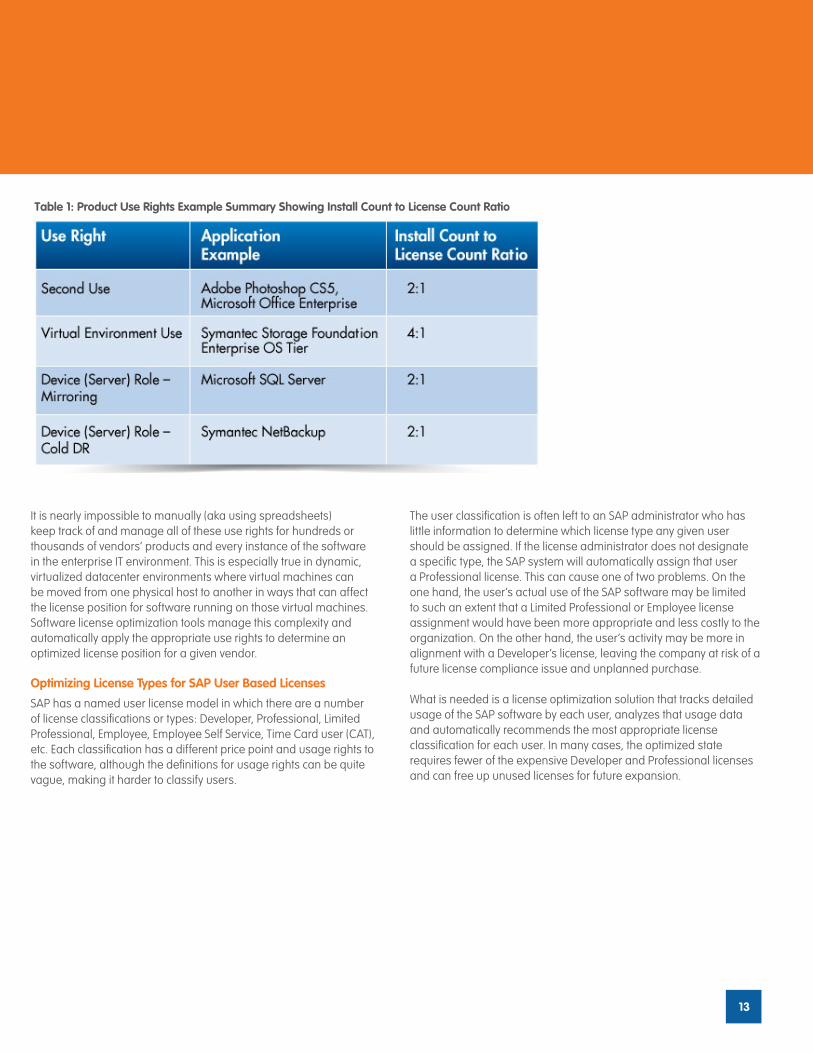
Table 1: Product Use Rights Example Summary Showing Install Count to License Count Ratio
It is nearly impossible to manually (aka using spreadsheets) keep track of and manage all of these use rights for hundreds or thousands of vendors’ products and every instance of the software in the enterprise IT environment. This is especially true in dynamic, virtualized datacenter environments where virtual machines can be moved from one physical host to another in ways that can affect the license position for software running on those virtual machines. Software license optimization tools manage this complexity and automatically apply the appropriate use rights to determine an optimized license position for a given vendor.
Optimizing License Types for SAP User Based Licenses
SAP has a named user license model in which there are a number of license classifications or types: Developer, Professional, Limited Professional, Employee, Employee Self Service, Time Card user (CAT), etc. Each classification has a different price point and usage rights to the software, although the definitions for usage rights can be quite vague, making it harder to classify users.
The user classification is often left to an SAP administrator who has little information to determine which license type any given user should be assigned. If the license administrator does not designate a specific type, the SAP system will automatically assign that user a Professional license. This can cause one of two problems. On the one hand, the user’s actual use of the SAP software may be limited to such an extent that a Limited Professional or Employee license assignment would have been more appropriate and less costly to the organization. On the other hand, the user’s activity may be more in alignment with a Developer’s license, leaving the company at risk of a future license compliance issue and unplanned purchase.
What is needed is a license optimization solution that tracks detailed usage of the SAP software by each user, analyzes that usage data and automatically recommends the most appropriate license classification for each user. In many cases, the optimized state requires fewer of the expensive Developer and Professional licenses and can free up unused licenses for future expansion.
14
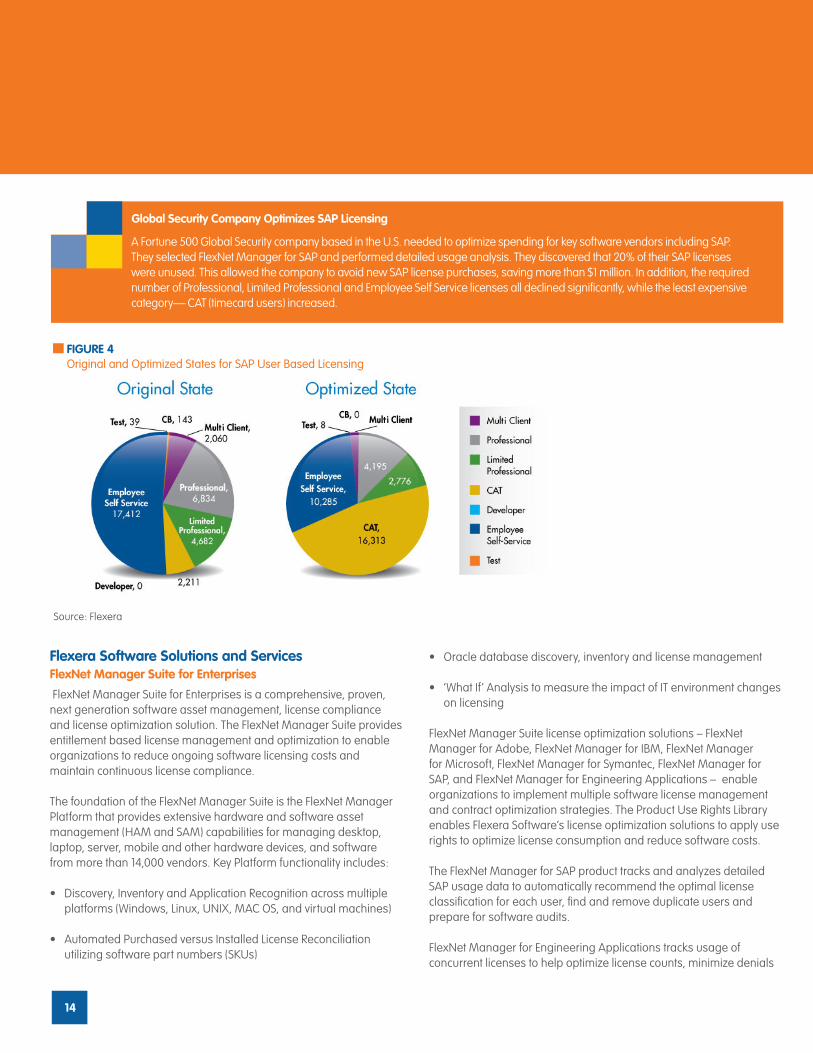
FIGURE 4Original and Optimized States for SAP User Based Licensing
Source: Flexera
Flexera Software Solutions and ServicesFlexNet Manager Suite for Enterprises
FlexNet Manager Suite for Enterprises is a comprehensive, proven, next generation software asset management, license compliance and license optimization solution. The FlexNet Manager Suite provides entitlement based license management and optimization to enable organizations to reduce ongoing software licensing costs and maintain continuous license compliance.
The foundation of the FlexNet Manager Suite is the FlexNet Manager Platform that provides extensive hardware and software asset management (HAM and SAM) capabilities for managing desktop, laptop, server, mobile and other hardware devices, and software from more than 14,000 vendors. Key Platform functionality includes:
• Discovery,InventoryandApplicationRecognitionacrossmultipleplatforms (Windows, Linux, UNIX, MAC OS, and virtual machines)
• AutomatedPurchasedversusInstalledLicenseReconciliationutilizing software part numbers (SKUs)
A Fortune 500 Global Security company based in the U.S. needed to optimize spending for key software vendors including SAP. They selected FlexNet Manager for SAP and performed detailed usage analysis. They discovered that 20% of their SAP licenses were unused. This allowed the company to avoid new SAP license purchases, saving more than $1 million. In addition, the required number of Professional, Limited Professional and Employee Self Service licenses all declined significantly, while the least expensive category— CAT (timecard users) increased.
FlexNet Manager Suite license optimization solutions – FlexNet Manager for Adobe, FlexNet Manager for IBM, FlexNet Manager for Microsoft, FlexNet Manager for Symantec, FlexNet Manager for SAP, and FlexNet Manager for Engineering Applications – enable organizations to implement multiple software license management and contract optimization strategies. The Product Use Rights Library enables Flexera Software’s license optimization solutions to apply use rights to optimize license consumption and reduce software costs.
The FlexNet Manager for SAP product tracks and analyzes detailed SAP usage data to automatically recommend the optimal license classification for each user, find and remove duplicate users and prepare for software audits.
FlexNet Manager for Engineering Applications tracks usage of concurrent licenses to help optimize license counts, minimize denials
15
of service and prevent over-spending on licenses for critical, high-spend engineering and technical applications.
The FlexNet Manager Suite solutions enable organizations to:
Flexera Software SAM and License Optimization Consulting Services
Every software asset management and license optimization solution begins with a series of business challenges. The Flexera Software approach is not simply to implement a tool, but to align existing processes with best practice methodologies, to identify gaps and integrate a solution around specific business requirements. Flexera Software’s Global Consulting Services organization provides an extensive array of services to enable customers to successfully implement or improve their SAM and license optimization program and achieve the highest return on investment.
These services include:
• Strategy Consulting Services, including SAM and License Optimization ROI Workshop, SAM and License Optimization Process Workshop and Snapshot / Audit Preparation Workshop services
• Business and Technical Implementation Services
• Rationalization, Reconciliation and Optimization Services
• Management Methodologies and Value Realization Services
Flexera Software’s goal is to help customers achieve optimum results and rapid ROI by addressing key business goals as well as technology requirements. Our consultants do this by establishing a clear vision of where a company is, where they need to be, and what they should do to get there.
Our experience has shown that:
• Organizationsthatinvestinreviewingandupdatingassetmanagement processes as part of the technology solution will see an ROI up to 100% more quickly than those that don’t
• Organizationsthatinvestinservicesaroundsoftwarelicenseoptimization and compliance risk mitigation will generally realize savings of 20% or more on software spend in ‘year 1’ alone.
Flexera Software Calendar of Events
Gartner IT Financial, Procurement and Asset Management Summit, Orlando, FL September 12-14, 2012 Please visit us at booth S9 and come see a case study presentation by Luis Peluffo Johansen from A.P. Moller-Maersk, who will be discussing their IT Asset Management Program and the savings they have realized from software license optimization for two key vendors. Mr. Johansen will be speaking in the Flexera Software Solution Provider Session on Thursday, September 13, 2012 at 4:15pm ET; location: Osceola A.
Gartner IT Financial, Procurement & Asset Management Summit, London (Park Plaza Westminster Bridge), 10-11 October 2012 Attend our solution provider session on 10 October where Jim Ryan (Flexera Software COO) will discuss how businesses are Achieving Software Licence Optimisation - gaining unprecedented control of their software estate, minimising audit risk and reducing IT spend. (Time 14:45, Westminster A). Visit the Flexera Software booth for a demonstration of FlexNet Manager Suite, and talk with our SAM solution experts.
IAITAM CXO and ACE Conference, Palm Springs, CA October 16-19, 2012 At the CXO event, please attend to hear Randy Littleson, SVP Marketing at Flexera Software, speak about Software Audits and Compliance- as Active as Ever, on Tuesday October 16th at 11:00am and 3:30pm ET.
Please visit us at booth 39 and come see a presentation by Michele Hirsch from CSC and John Emmitt from Flexera Software on Wednesday, October 17th at 3:30pm (Track 5). The presentation is on: Creating a SAM Program That Scales – How a Major Managed Service Provider Delivers the Goods.
More Information
Readers may also be interested in reading the Gartner Software License Optimization Vendor Overview report. In this research report, Gartner analyst Patricia Adams discusses the reasons why “Asset managers continue to struggle with issues related to software entitlement and license compliance. Gartner provides basic information about some of the vendors that can help you address these issues.”
To access the full report, please click here.
Please visit the Flexera Software website for more information on our products and services.
Flexera Software is the leading provider of strategic solutions for Application Usage Management; solutions delivering continuous compliance, optimized usage and maximized value to application producers and their customers. Flexera Software is trusted by more than 80,000 customers that depend on our comprehensive solutions- from installation and licensing, entitlement and compliance management to application readiness and enterprise license optimization - to strategically manage application usage and achieve breakthrough results realized only through the systems-level approach we provide.
For more information, please go to: www.flexerasoftware.com