17 January 2022 ISTITUTO NAZIONALE DI RICERCA METROLOGICA Repository Istituzionale Calibration procedures and uncertainty analysis for a thermal mass gas flowmeter of a new generation / Cascetta, Furio; Rotondo, Giuseppe; Piccato, Aline; Spazzini, Pier Giorgio. - In: MEASUREMENT. - ISSN 0263-2241. - 89(2016), pp. 280-287. [10.1016/j.measurement.2016.03.073] Original Calibration procedures and uncertainty analysis for a thermal mass gas flowmeter of a new generation Publisher: Published DOI:10.1016/j.measurement.2016.03.073 Terms of use: Visibile a tutti Publisher copyright (Article begins on next page) This article is made available under terms and conditions as specified in the corresponding bibliographic description in the repository Availability: This version is available at: 11696/54972 since: 2019-09-03T12:15:15Z Elsevier This is the author's accepted version of the contribution published as:
Transcript
17 January 2022
ISTITUTO NAZIONALE DI RICERCA METROLOGICARepository Istituzionale
Calibration procedures and uncertainty analysis for a thermal mass gas flowmeter of a new generation / Cascetta, Furio;Rotondo, Giuseppe; Piccato, Aline; Spazzini, Pier Giorgio. - In: MEASUREMENT. - ISSN 0263-2241. - 89(2016), pp.280-287. [10.1016/j.measurement.2016.03.073]
Original
Calibration procedures and uncertainty analysis for a thermal mass gas flowmeter of a new generation
Publisher:
PublishedDOI:10.1016/j.measurement.2016.03.073
Terms of use:Visibile a tutti
Publisher copyright
(Article begins on next page)
This article is made available under terms and conditions as specified in the corresponding bibliographic description inthe repository
Availability:This version is available at: 11696/54972 since: 2019-09-03T12:15:15Z
Elsevier
This is the author's accepted version of the contribution published as:
Accepted Manuscript
Calibration procedures and uncertainty analysis for a thermal mass gas flow-
meter of a new generation
F. Cascetta, G. Rotondo, A. Piccato, P.G. Spazzini
cp specific thermal heat at constant pressure kJ kg-1K-1
𝑚 mass flowrate kg s-1
Q heat power W
R electric resistance Ohm
T Temperature K
A Cross section m2
a diffusivity m2 s-1
V measured gas volume L
𝑉 Volume flowrate L min-1
Greek letters
gas density kg m-3
Subscripts
thermal conducibility Wm-1K-1
th thermal
el electrical
0 reference state
c capillary
m meter
Keywords: smart gas meter; calibration; flowmeter.
1. INTRODUCTION
The use of natural gas as a fuel has been commonplace in most industrial countries for decades
now, and the market for this commodity has a value of several billion Euros worldwide [1]. The
advantages of this kind of fuel are its extreme facility of transportation, widespread distribution of
reserves, ease of use, essentially no solid residual after the burn. Applications range from very small
kitchen burners to large industrial boilers, including water heaters for large thermoelectric power
stations.
Of course, such a wide range of applications implies an equally wide range of flow rates at the final
customer; such flow rates must be measured as accurately as possible for the correct invoicing.
Instruments for the measurement of the flown volume of gas (gas meters) are thus present at every
end-user connection point, in addition to the ones used across the distribution lines for monitoring
and cross-checking, and the ones used for the international trade between producing countries and
user countries.
Traditional end-user instruments are based on a mechanical measurement principle, called
volumetric positive displacement technology. Several practical developments were introduced
during the years, but the measurement principle of these instruments, which presently represent the
large majority of the installed units, is still based on a measurement of a fixed (determined) volume,
which is cyclically filled and emptied. This technology, although improved (e.g. using suitable
material, such as composite, and new manufacturing techniques) and consolidated, intrinsically
3
suffers from two major drawbacks, i.e. the aging of the moving parts (wear and mechanical
deterioration) and the sensitivity of the measurement to the ambient conditions.
The respect of the compliance with legal metrology error limits (usually called Maximum
Permissible Error = MPE) guarantees the correctness of commercial transactions: legal metrology
ensures the quality and credibility of measurements that are used directly in regulation and in areas
of commerce. In order to assess and ensure the metrological reliability of gas meters, they are
initially verified at the manufacturer, then in most Countries are subject to further periodical
verifications. The full and deep characterization of meters (metrological reliability) is performed by
an experimental activity called ‘‘calibration’’, in which errors, standard deviations, uncertainties
and confidence levels are determined [2-8].
The calibration procedures are based on the comparison, for a same quantity (measurand: quantity
intended to be measured; International Vocabulary of Metrology, item 2.3), of the metering values
provided by the meter under test and the values provided by a suitable (traceable) measurement
standard.
In the field of legal metrology, the conformity assessment of a meter is called verification [9]: it
consists in a periodic (at fixed intervals) calibration of the meter, carried out in an accredited
laboratory (in conformity with the stated legal requirements).
In the field of industrial or scientific metrology, instead, the assessment of the meter’s reliability is
called metrological confirmation [10]: it consists in a periodic calibration of the metering
instrument in order to assess the match of the meter’s performance with the needed requirements for
specific use (for example the conformity to ISO 9000 quality assurance standards).
In recent years, new laws and the European directive 2012/27/EU [11], have introduced the concept
of smart meter, with the aim of improving the invoicing process and of providing more services to
the end user, such as the real-time transmission of measurement data to the distributor [12-14] .
Gas meter producers readily answered the call; essentially two approaches were taken. The first
approach was to patch once more the old technology, by adding temperature probes to the
measuring volume and operating a correction on the measured volume via computation. The
alternative was to develop new concepts of gas meters, based on more up-to-date, digital and static
technologies. One of these is the thermal mass meter; a complete description of the principle will be
given in par. 2. The main advantage of this technique is that the quantity actually measured is the
mass flow rate, which allows to overcome the problem of the temperature volume correction [15].
These instruments are based on a totally different approach with respect to the volumetric positive
displacement technology,therefore the calibration and verification process shall have to take into
account such difference[16-18].
In the present paper we shall analyse the implications on the calibration procedures of the
technological innovations recently introduced, showing that, although the general process remains
the same, some fine tuning is necessary in order to get the best of such innovations. The specific
example of meters for domestic/residential applications (G4 gas meters) will be studied, but of
course the same general principles will remain valid also for other sizes. The main technical
4
adaptation are a direct consequence of the new static measurement principles (see Par. 2) as
opposed to the full mechanical dynamic flowmeters adopted to date.
Indeed, traditionally natural gas is metered by means of volumetric measurement techniques, while
the modern, static gas flow meters (thermal and ultrasonic ones) are based on electronic flow
sensors. This implies that the gas volume through the meter is measured by sampling the flow rate
at selected time points and integrating the flow rate in time. The measurement time becomes
therefore an important parameter, thus requiring a thorough rethinking of the calibration procedure.
In order to analyse the effects of the various parameters, a series of ad-hoc calibrations were
performed. Specifically, one set of calibrations was performed with constant totalized volume,
while the other required a constant measurement time.
The implications of the aforementioned technological differences on the calibration and conformity
assessment of gas meters will be analysed, together with a theoretical (generic) evaluation of the
uncertainty associated to the different types of flow metering technologies. Measurements were
carried out at the test facility of INRIM, the Italian National Metrology Institute.
2. MEASURING PRINCIPLE OF THERMAL MASS METER
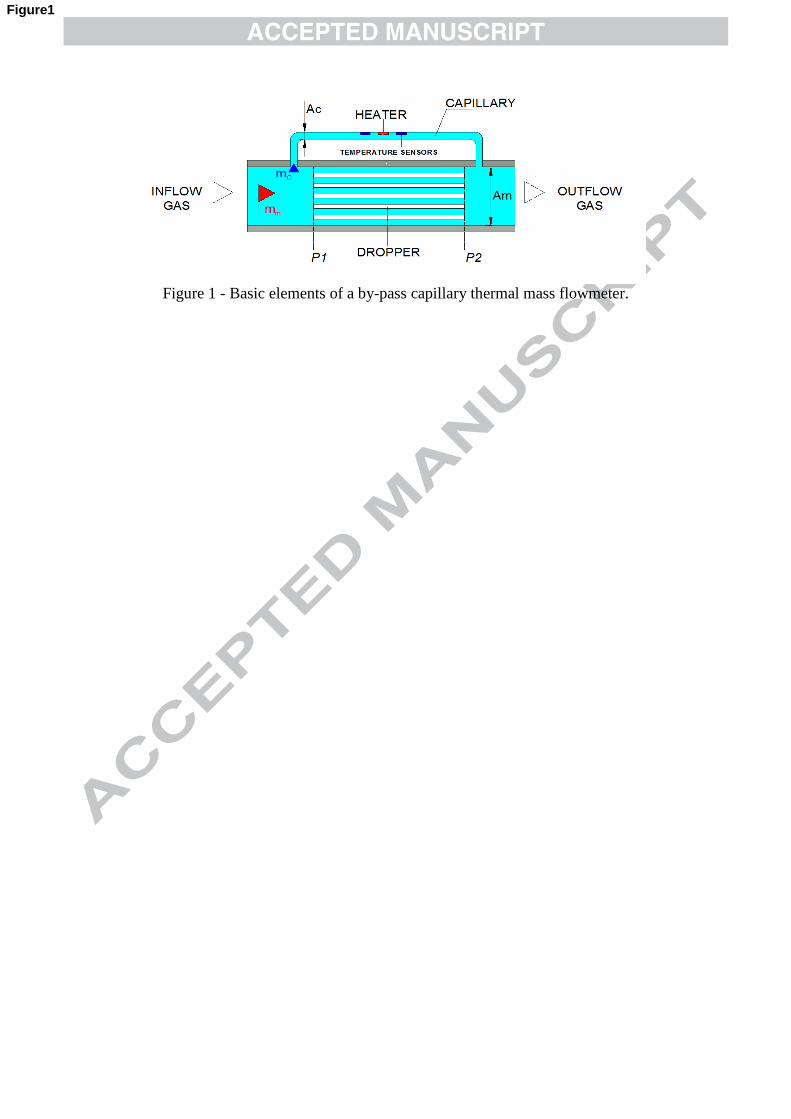
The CTTMFs (Capillary Type Thermal Mass Flowmeters) are based on a MEMS micro-thermal
mass flow sensors built using CMOS technology. The sensor is composed of a central micro heater
and two temperature sensors placed symmetrically upstream and downstream of the micro heater,
both the heater and the sensors are controlled by a suitable electronic module.
Gas enters the meter and is divided into two flow paths - main flow and capillary sensing path - in
both of which laminar flow regime is ensured (in the capillary tube because of the very small
diameter, and in the main tube by means of a pressure dropper/laminar flow element). Figure 1
displays a schematic of the overall arrangement of the meter.
The micro-thermal mass flow sensor is positioned within the capillary as shown in Figure 1.
The measurement principle is based on the analysis of the modifications to the heat exchange
between the heater and the sensors due to the flow in the capillary: when no gas is flowing over the
sensor, the two thermo-elements measure the same rise in temperature (see Figure 2, symmetrical
curve). Conversely, when gas flows through the capillary the temperature symmetry is disturbed,
and the asymmetry can be expressed as a temperature difference between the two temperature
sensors (see Figure 2). This temperature difference signal, which is measured as a voltage
difference (thermopile), is processed in the analogue part of the sensor chip and then digitalized in
the digital part. This measurement signal (voltage difference) is proportional to the mass flowrate of
gas over the sensor-chip.
Basically, the micro-thermal mass flow sensor uses the thermal properties of the gas to directly
measure the mass flow rate (considering the electric power supply, Qel, provided to the micro heater
as being equal to the thermal power, Qth, generated by the Joule’s effect (RI2) and lost to the gas
flow by means of forced convective heat transfer (see ISO 14511:2001): Qel = RI2 = Qth = mccpT.
The sensor chip detects the mass flow rate in the capillary tube (mc): if the flow regime is laminar in
both the circuits (the capillary one and the main one) the ratio mc/mm (mass flow rate in the
capillary circuit/mass flow rate in the main pipe) is constant (typically equal to the ratio between the
cross section areas Ac/Am). The sensor uses the basic principle that each gas molecule has the
5
specific ability to pick up heat (forced convective heat transfer). This property, called the specific
heat for a constant pressure (cp), directly relates to the mass and physical structure of the molecule
and can be determined experimentally. The physical structure of molecules varies widely from gas
to gas, as does the specific heat, cp, which varies depending on the gas composition and temperature
(for a gas with a “real” behaviour, not ideal gas). Changes in cp also imply changes in the thermal
conductivity of the gas, since the thermal diffusivity a of the gas is a = /(cp), where is the gas
density.
The gas sensitivity (or gas identification/recognition) represents a crucial feature for the
measurement reliability. Nowadays, the new and improved generations of CTTMF are able to sense
gas composition, providing possible corrections to all current gas families (compliant to EN
437:2009).
It is important to observe that, since the sensor is directly sensitive to the mass flow, the meter will
not require temperature and pressure sensors since the mass can be directly converted to
corresponding volume at the established thermodynamic conditions.
2.1.MEASUREMENT AND SAMPLING
In order to reduce battery consumption, measurements are not carried out continuously; on the
contrary, the flow is evaluated at discrete time intervals (sampling), i.e. a sampling is performed.
The meters calibrated in this work perform acquisitions of the mass flowrate every 0.4 seconds
when calibration mode (also called test mode) is set, every 2 seconds in operation mode. The
totalized gas volume is obtained by summing the discrete product (flowrate * sampling time t.
For each sample, the volume passed through the meter Vm,sample is calculated by multiplying the
mass flowrate “𝑚 ” measured as before described during the sample time by the reciprocal density
( where is the gas density at reference conditions) and by the time sampling interval
“t“ : ; the total volume is the sum of the samples: .
The CTTMF meter resolution depends on the flowrate sensitivity of the sensor and the sampling
time. Typically, the sensitivity of a thermal mass flow meter is extremely high, in the order of 10-3
L. This high resolution implies that the minimum calibration volume is significantly reduced as
compared to a traditional diaphragm gas meter: this implies that the calibration volume influence on
the measurement calibration error/uncertainty is significantly reduced, but on the other hand for the
CTTMFs the sampling time is crucial to curtail the measurement error. In Figure 3 the behavior of
the gas flow profile at the startup of the meter is represented together with the CTTMF sampling
points. It can be observed that the flow integration with the trapezoidal rule leads to an error in the
computation of the measured volume, which depends on the final flow rate and the steepness of the
growing ramp. Of course, a similar situation will be present at the shutdown. Notice that this
uncertainty contribution can be avoided in calibration by starting the measurements once the steady
state is reached; on the other hand, this contribution will also be present in the field applications.
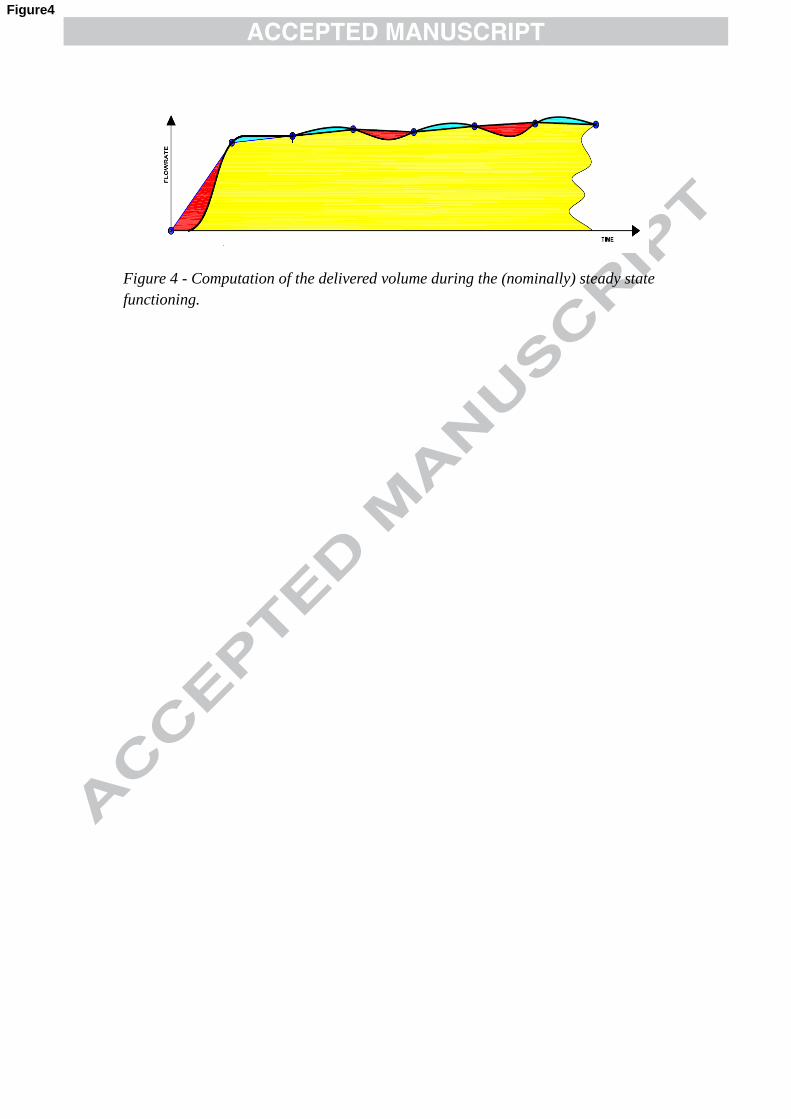
Similarly, Figure 4 represents the behavior during the (nominal) steady state functioning. Again, due
to the finite time resolution, the integration causes an error in measurement. This contribution can
be minimized by increasing the number of samplings (and therefore the total calibration time) since
the various contribution will cancel each other.
6
3. CALIBRATION AND MEASUREMENT UNCERTANTIES
3.1. Comparison between static vs. positive displacement techniques uncertainty analysis
In order to highlight the basic differences expected in the behaviour of the different types of meters,
an uncertainty analysis of the CTTMF and of the positive displacement gas meters was performed;
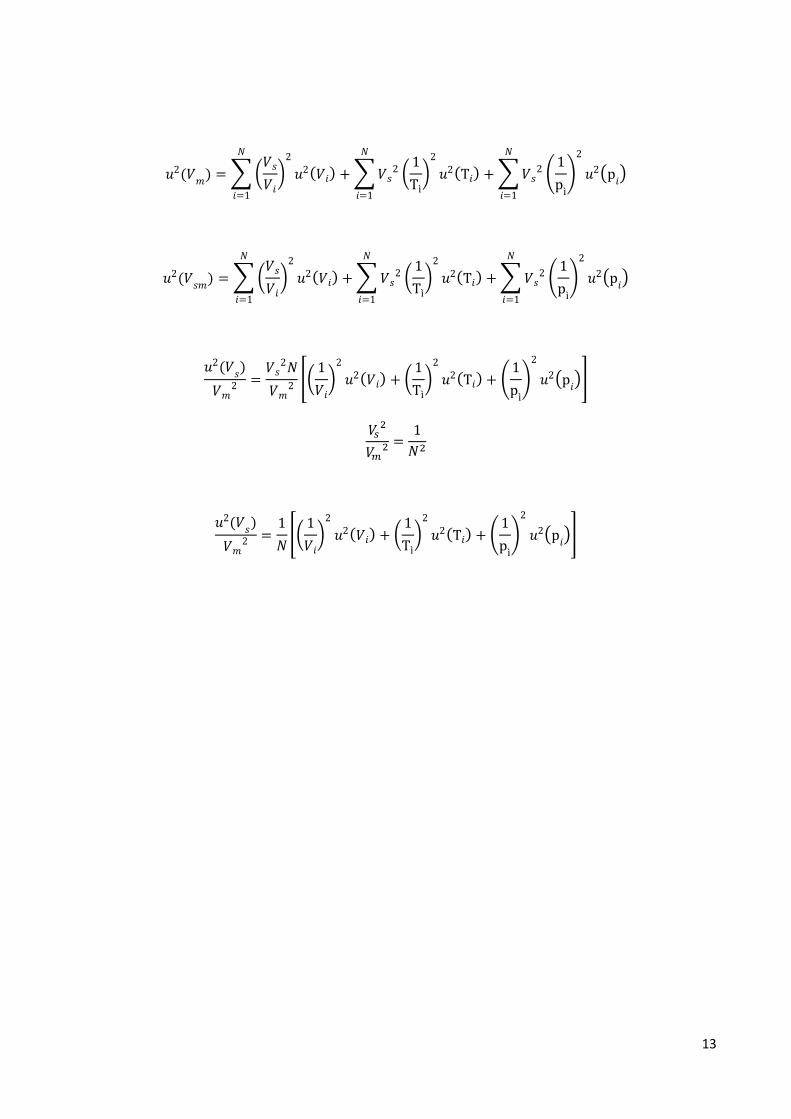
the full computations are reported in Appendix A.
The quantity considered is the totalized volume measured by the meter, 𝑉𝑚; of course, developing
the expression for this quantity leads to different formulations, due to the fact that the measurement
principles of the two meters are radically different. Notice, that in both cases a reference density is
required for the determination of the measured volume, although for different reasons1,but this
value is immaterial in the evaluation of the uncertainty since it is determined through assigned (and
therefore univocally defined) values of thermodynamic conditions and thermodynamic constants2;
on the other hand, the measured quantities are radically different: the CTTMF employs the instant
flow rate and the time interval, while the constant displacement meter requires the unit volume and
the actual thermodynamic conditions. This difference translates quickly in a completely different
uncertainty evaluation. Indeed, when developing the calculations, (see appendix A), it comes out
that the uncertainty on the measured volume in the case of the CTTMF depends on the relative
uncertainty on the measured mass flow rate and on the time interval, while in the case of the
positive displacement meter the relevant quantities are the internal volume of the meter and the
actual thermodynamic conditions. In addition, in both cases the overall uncertainty depends on N,
the number of samplings, but it has to be noticed that this value has different meanings – and
different values – in the two cases: indeed, while for the CTTMF N is the number of acquisitions
from the sensor (and is therefore connected to the total time of acquisition), for the positive
displacement meter N is the number of cycles, and is therefore connected to the total measurement
volume. Since the time interval is quite small, it is possible in the case of the CTTMF to raise the
value of N easily (a one-minute calibration implies 150 samplings with a typical time interval of 0.4
seconds), while the typical value for N is of the order of 10 to 50 with typical positive displacement
meters; it is therefore possible to reduce the final uncertainty with little effort.
Another important observation is that, in the CTTMF, the uncertainty on the time interval is very
small3 with respect to the other uncertainty sources, therefore the only uncertainty source of
importance is the measured flow rate. The uncertainty of this quantity is relatively small and most
of all can be considered as quite stable, since the mass flow sensor is not subject to wear or other
mechanical processes; also, it is quite protected within the meter, therefore it can be expected to
perform almost in design conditions throughout the life of the instrument. On the other hand, the
positive displacement involves at least three major uncertainty sources, namely the uncertainty on
1 In the case of the CTTMF, the reference density is required to convert the measured mass to volume, while in the case of the positive displacement meter this quantity allows to convert the measured volume to the reference volume through the measured to reference density ratio. 2 Actually, the gas constant and the gas molar mass involve an uncertainty, but its value is so small that it can be neglected. 3 The is provided by a clock, and even low-quality clocks can easily provide uncertainties better than 0.01 %.
7
the volume (subject to mechanical stresses, therefore to wear), the uncertainty on the pressure
measurement and the one on the temperature measurement.
In conclusion, the main result of relevance to the present paper of the uncertainty analysis is that the
parameter of importance in the calibration of the CTTMF is the measurement time (since an
increase in this parameter increases the value of N), as opposed to the classical positive
displacement meter where the parameter of importance was the total measured volume. This fact
has several implications in the definition of a correct calibration procedure. First of all, the
prescriptions will have to be on the minimum calibration time, which will be the same for all flow
rates; this has the additional implications of making it much easier to forecast the required total time
of calibration. On the other hand, for the higher flow rates this will lead to an increase in the total
volume required to complete the calibration, but this is hardly a problem with modern reference
facilities. Another implication is that the measurement uncertainties will tend to be lower, and the
reduction of the meter uncertainty will increase the importance of the calibration facility uncertainty
on the final result uncertainty. This will of course lead to a requirement for improvement in the
calibration facilities and procedures, and possibly to an ultimate reduction in the prescriptions on
acceptable uncertainties of the meters, which in turn will mean fairer billing for the final user.
4. TEST FACILITY AND PROCEDURE
The test facility employed for taking the measurements was INRIM’s test rig BELLGAS. This
facility is used for the definition of the Italian National Standard of gas flow rate in the flow range
between 1 L/min and 120 L/min.
The test rig is a modified American Standards bell prover with a nominal volume of 160 L. The
baseline instrument was modified at INRIM during the ‘80s and ‘90s to boost its accuracy and data
monitoring. To reach this aim, the main improvements were the following:
replacement of the bell cap, which was substituted by a brass flat top provided with fittings
for the insertion of a Pt100 thermal sensor.
modification of the reading system, which is now constituted by an encoder connected to
the bell cap through a steel ribbon; the encoder has a resolution of 360000 steps per rotation
and allows a volume resolution of about 0.6 mL per step;
addition of vertical guides provided with low friction bearings to avoid bell oscillations;
hydrostatic pull compensation by a weight suspended on an involute-of-circle device;
control of the gas entrance/exit through pneumatic valves controlled by an electronic
device;
With this set of improvements, the test rig can now measure volumes and flow rates in the said flow
rate range with an uncertainty of 0.12% or better for differential volumes larger than 20 L.
The test rig was calibrated with a gravimetric method, using an oil substitution procedure.
4.1.Test procedure
8
The procedure employed for taking the measurement is a modification of the standard INRIM
procedure for gas meter calibration.
In particular, three CTTMFs were connected in series downstream of the bell prover, which
functioned in this case as the gas source. The bell was loaded with a constant load, which produced
an internal pressure of about 800 Pa, and the flow rate was regulated using the bell exit valve. Leaks
were checked by closing the exit of the last meter in the series, then opening full the bell valve and
monitoring the bell vertical position through the encoder reading while checking that the internal
pressure remained at the set value. After a transient of stabilization, it was observed that the encoder
reading was stable to within 1 step/minute; recalling now that the volume corresponding to 1
encoder step is of about 0.6 mL, it can be stated that leaks, if present, influence the measurement by
less than this quantity.
To perform measurements, the bell is filled with ambient dry air through the dedicated fan, then the
inlet is closed and the exit valve is opened enough to provide the selected flow. The flow is checked
on the bell reading display and, when it reaches stability, readings are launched (almost)
simultaneously on the bell control device and on the gas meters software. In the normal procedure,
the flow is stopped after at least 20 L have been delivered and at least 1 minute has elapsed since
these parameters allow guaranteeing the stated uncertainty of the bell measurements. For the
measurements described here, timings and volumes were selected differently with the aim of
analyzing the effects of these parameters on the meter performance. Of course, these variations also
influence the bell uncertainty, which was recomputed for every measurement according to the
complete uncertainty analysis.
The meters under test were a set of 3 CTTMF meters, G4 sized (full scale flowrate of 6 m3/h),
model DomusnextTM
, produced by the Company MeterSIT.
First of all, a baseline (steady state, 3 repetitions, 8 nominal flow rates: 1%-5%-10%-20%-30%-
50%-75%-100% of Full Scale Reading) calibration was carried out for each of the meters.
To analize the effects of sampling times on the CTTMF meter calibration, further measurements
were then performed for different acquisition time periods at some of the baseline calibration
nominal flow rates (1-5-10-20 L/min); the flow rates were selected so that they allowed to attain at
least 5 minutes of continuous and stable measurements and therefore to build a solid
(representative) set of comparison data. The complete matrix of flow/time points is reported in
Table 1.
In the Appendix B, data from all three tested meters were collected and reduced for each point in
the matrix ; such data were then used for the analysis reported in the following.
5. RESULTS AND DISCUSSION
Results are presented in terms of average percentage deviation of the meter,
where:
and Vm and Vref are respectively the volume measured from meter under test
and the reference meter. In particular, in the Figure 5 the data were plotted with the measurement
flowrate as parameter, instead in Figure 6 the data were plotted with the measurement
measurement time as parameter. The calibration curves for all meters, as showed in Figure 5, are
full satisfactory with a good repeatability (see appendix B). All calibration points are within MPE
9
limits and the values of the experimental standard deviation are always less than 0.45 for low
flowrate ( Q<Qt) and less than 0.3 for high flowrate except for a few calibration points ( see
appendix B). The exception in repeatability could be due at not appropriate ratio between the gas
volume passed through the meter under test and the number of samples.
Figure 6 reports the relative percentage error of measurement in function of flowrate, for different
time acquisition. It can be seen that then percentage errors decrease as the number of sampling
increases. Also in this case, the tested meters show to be a good measurement repeatability (MSD
less than 1%). Btesides, it can be observed that the results are essentially the same independent of
the flow rate, which also means independent of the delivered volume. Consider now the 1 min
acquisition time data; for the 1L/min rate, this means a delivered volume of 1 L, while e.g. at 20
L/min the delivered volume would be 20 L. Now, it can be seen that the data dispersion (indicative
of the measurement uncertainty) is essentially the same for the two extreme cases, in contrast with
what would happen with traditional diaphragm meters for which the expectation is of a much
larger dispersion at the lowest volumes. This indicates that the delivered volume is not an issue in
the calibration of CTTMFs, while the number of samples might be. Therefore, as also shown by
the uncertainty analysis (par. 3.1), the leading parameter in this type of measurement is the
measurement time calibration in opposition of what happens with diaphragm gas meter where the
total gas volume is more important.
6. CONCLUSIONS
This paper focuses on the implications of the innovative measurement principle of CTTMF gas
meters on the procedures to be adopted for the calibration of such meters. In particular, the
uncertainty balance of calibration for this type of meters was analysed and compared to the
equivalent balance relative to the traditional diaphragm gas meters. A set of calibrations performed
on a set of meters was also presented to support the computations.
The main result of the study is that the leading parameter in CTTMF calibration is the sampling
time, in contrast to the delivered volume which is to be considered for the traditional meters. This
result indicates that a review of the calibration procedures is required for the correct quality
assessment of the new generation gas meters. In particular, the measurement acceptability
parameter will have to be based on the measurement time instead of the measurement volume.
Results presented here suggest that the minimum calibration time could be of the order of 1 minute,
which would imply a significant reduction of overall calibration times, with important
consequences on the productivity and economic assessment of calibration laboratories.
Another important feature of CTTMF meters, which will be the object of future work, lies in their
increased accuracy with respect to traditional meters. Such increased accuracy leads to a lower
uncertainty, which in turn poses more pressing requirements on the process of laboratory alignment,
with the aim of maintaining calibration compatibility between laboratories.
ACKNOWLEDGMENT
10
The Authors wish to thank the Company MeterSIT for providing the meters used in the present
work and for technical support (meters software and setup) provided during the tests.
REFERENCES
[1] Word gas meter report, 6th edition, 2007, ABS Energy Research, London.
[2] ISO 10012:2003 Measurement Management Systems – Requirements for Measurement Processes and
Measuring Equipment.
[3] OIML 2000, International Vocabulary of Terms in Legal Metrology: VIML 2.13.
[4] Directive 2004/22/EC of The European Parliament and of the Council OF 31 March 2004 on Measuring