ISWA Beacon Conference: “THE GLOBAL CHALLENGE: OPTIMISING THE C CYCLE” Biological treatment of biowaste 22-23 May 2008 Session 5 – a toolkit: strategies and practice in Session 5 – a toolkit: strategies and practice in Separate Collection Defining strategies, implementing and optimising separate collection: the case of Catalunya Francesc Giró i Fontanals Departament de Gestió de Matèria Orgànica Agència de Residus de Catalunya
Transcript
ISWA Beacon Conference: “THE GLOBALCHALLENGE: OPTIMISING THE C CYCLE”
Biological treatment of biowaste22-23 May 2008
Session 5 – a toolkit: strategies and practice in Session 5 – a toolkit: strategies and practice in Separate Collection
Defining strategies, implementing and optimising separate collection: the case of Catalunya
Francesc Giró i FontanalsDepartament de Gestió de Matèria Orgànica
• Collection of RESIDUAL WASTE:– Mechanical-Biological Treatments [MBT]
• Grey Composting. • Stabilisation before landfilling• Bio-drying before incineration
• How to get an optimised approach for separate collection of Biowaste ?– TARGETS– MANDATES– ECONOMIC PRESSURE– A MIX OF ALL THEM
6. Tools & strategies for the implementation & optimisation of
Biowaste separate collection
8
– A MIX OF ALL THEM
• High captures of biowaste• High quality of biowaste (low % impurities)• To avoid the increase of waste generation• Contention of costs• Fulfil diversion targets of biodegradable
waste of the Landfill Directive
What does mean OPTIMISATION?
6. Tools & strategies for the implementation & optimisation of
Biowaste separate collection
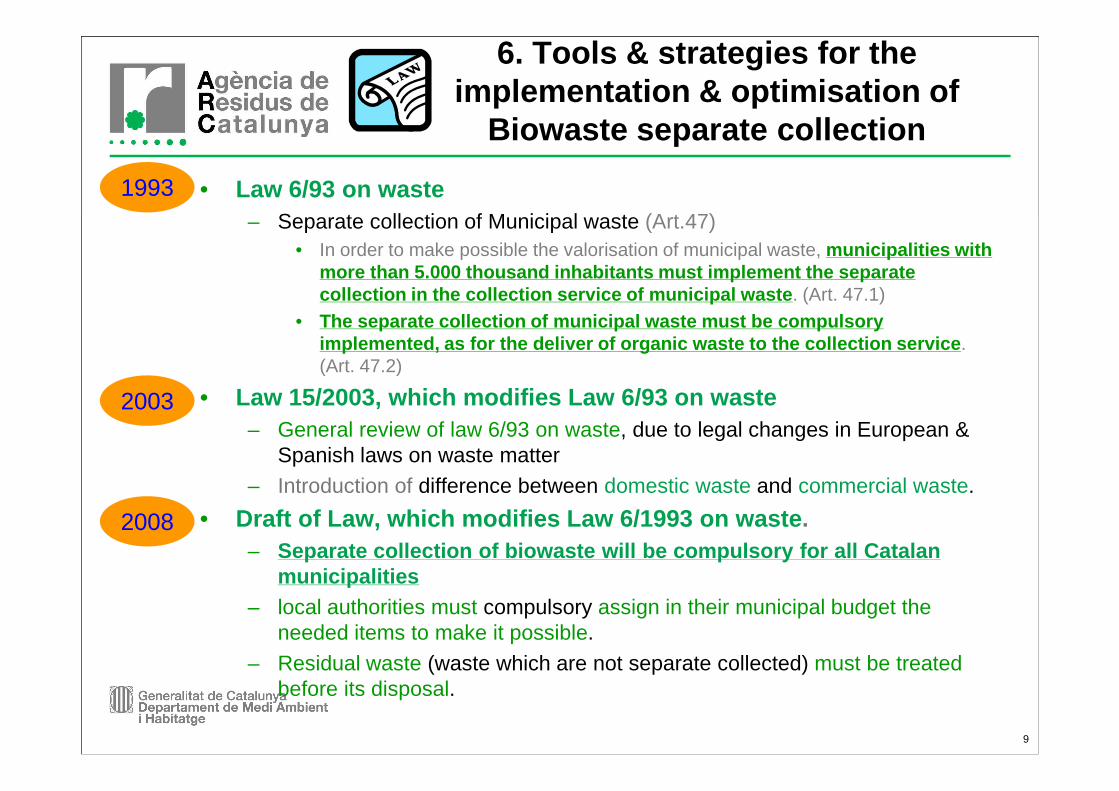
• Law 6/93 on waste– Separate collection of Municipal waste (Art.47)
• In order to make possible the valorisation of municipal waste, municipalities with more than 5.000 thousand inhabitants must implement the separate collection in the collection service of municipal w aste . (Art. 47.1)
• The separate collection of municipal waste must be compulsory implemented, as for the deliver of organic waste to the collection service . (Art. 47.2)
• Law 15/2003, which modifies Law 6/93 on waste
1993
2003
9
• Law 15/2003, which modifies Law 6/93 on waste– General review of law 6/93 on waste, due to legal changes in European &
Spanish laws on waste matter – Introduction of difference between domestic waste and commercial waste.
• Draft of Law, which modifies Law 6/1993 on waste . – Separate collection of biowaste will be compulsory for all Catalan
municipalities– local authorities must compulsory assign in their municipal budget the
needed items to make it possible.– Residual waste (waste which are not separate collected) must be treated
before its disposal.
2003
2008
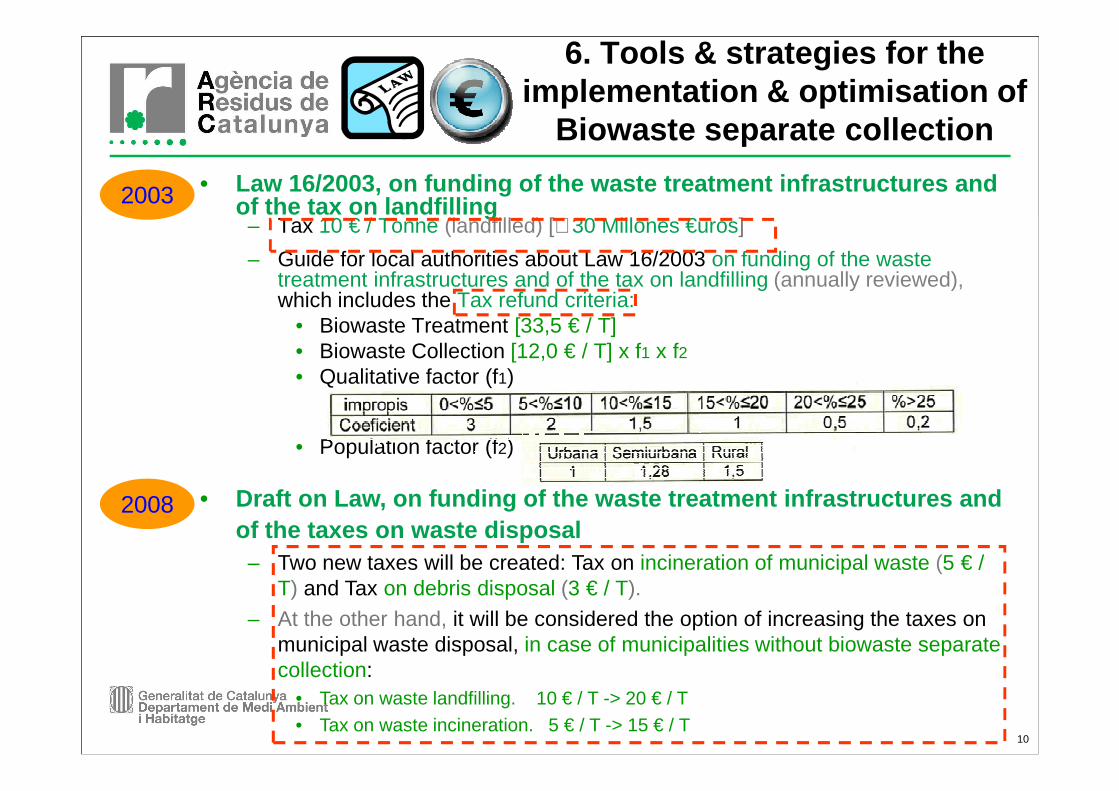
• Law 16/2003, on funding of the waste treatment infr astructures and of the tax on landfilling
– Guide for local authorities about Law 16/2003 on funding of the waste treatment infrastructures and of the tax on landfilling (annually reviewed), which includes the Tax refund criteria:
• Biowaste Treatment [33,5 € / T]• Biowaste Collection [12,0 € / T] x f1 x f2• Qualitative factor (f1)
6. Tools & strategies for the implementation & optimisation of
Biowaste separate collection
2003
10
• Population factor (f2)
2008 • Draft on Law, on funding of the waste treatment inf rastructures and of the taxes on waste disposal
– Two new taxes will be created: Tax on incineration of municipal waste (5 € / T) and Tax on debris disposal (3 € / T).
– At the other hand, it will be considered the option of increasing the taxes on municipal waste disposal, in case of municipalities without biowaste separate collection:
• Tax on waste landfilling. 10 € / T -> 20 € / T• Tax on waste incineration. 5 € / T -> 15 € / T
TARGETS PGRMC 1995-2000
PROGREMIC 2001-2006
PROGREMIC 2007-2012
Separate Collection/ Valorisation of Biowaste (% in weight)
10 % (1996-1997)50 % (1998-2000)
40 % (2003)55 % (2006)
55 %With < 15 % impurities
Infrastructure construction (investment)
46 composting plants
(138 M€)
+ 15 composting or AD plants
(210 M€)
+ 9 composting or AD plants + 30 MBT
(707 M€)
6. Tools & strategies for the implementation & optimisation of
Biowaste separate collection
11
(investment) (138 M€) (210 M€) (707 M€)
Biowaste collection system
Road Container Road container, Door to Door, etc.
Road container, Door to Door, etc.
Other specific targets
- Diversion of OM from landfill & fulfil Law 6/93-Improve the operation of composting plants-Establish a quality framework for compost
-Revision of Law 6/93 and of Law 16/2003-Reduction of Biowaste generation-Home composting promotion-Separate collection in all municipalities
6. Tools & strategies for the implementation & optimisation of
Biowaste separate collection
• PROGREMIC 2007-2012• Sub-programme for the management of biodegradable fractions
– Promotion of Backyard composting (at home / in community)– Promotion of measures for the reduction of food squandering– Promotion of prevention on organic waste generation thorough
the use of food surplus in order to fight against hunger (Food banks ).
– Extension of separate collection of biowaste in all municipalities.
12
– Extension of separate collection of biowaste in all municipalities.
– Consolidation of biowaste separate collection .– Promotion of biodegradable bag .– Promotion of aerated buckets (jointly with biodegradable bag);
it can produce an overall reduction of 5-10 % of we ight.– Promotion of more efficient separate collection systems , which
allow to get bigger captures of biowaste and best quality.– Implementation of biowaste separate collection for large
biowaste producers .
6. Tools & strategies for the implementation & optimisation of
Biowaste separate collection
13
170.000 persons were feeded with 7.500 Tonnes of food
6. Tools & strategies for the implementation & optimisation of
Biowaste separate collection
14
6. Tools & strategies for the implementation & optimisation of
Biowaste separate collection
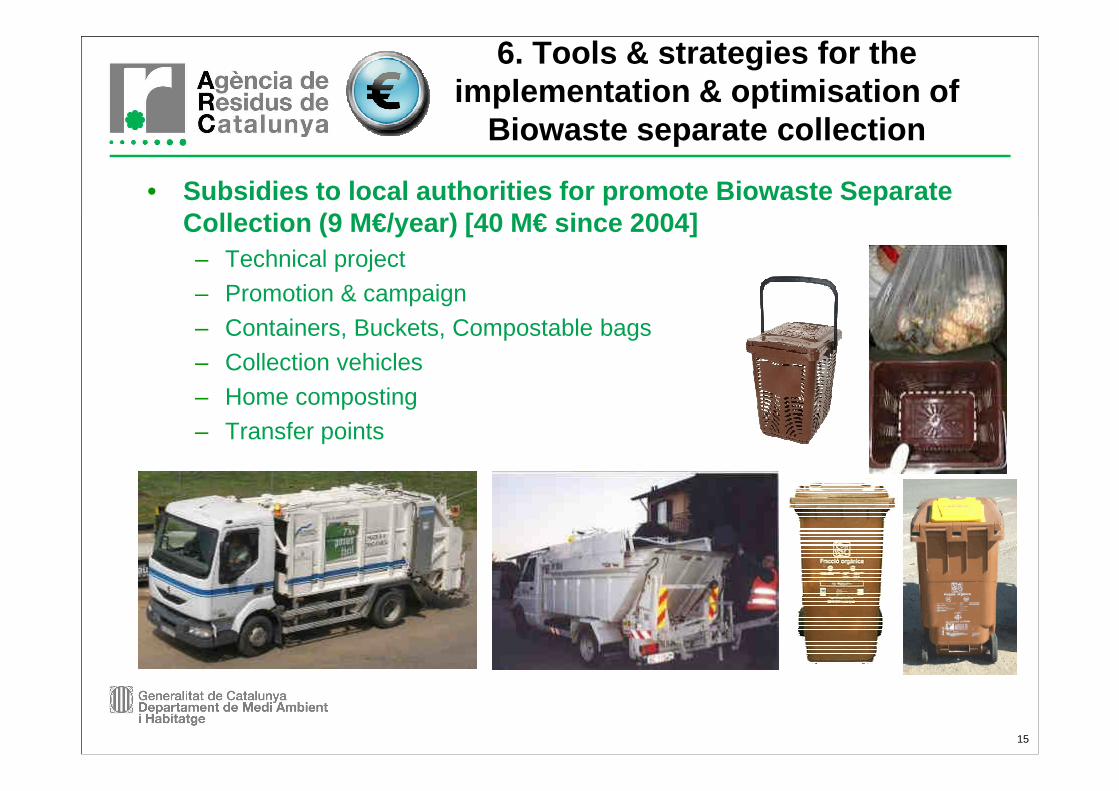
• Subsidies to local authorities for promote Biowaste Separate Collection (9 M€/year) [40 M€ since 2004]– Technical project– Promotion & campaign– Containers, Buckets, Compostable bags– Collection vehicles– Home composting
15
– Home composting– Transfer points
6. Tools & strategies for the implementation & optimisation of
– Overall Capacity Treatment of Biowaste:• Composting 240.000 T
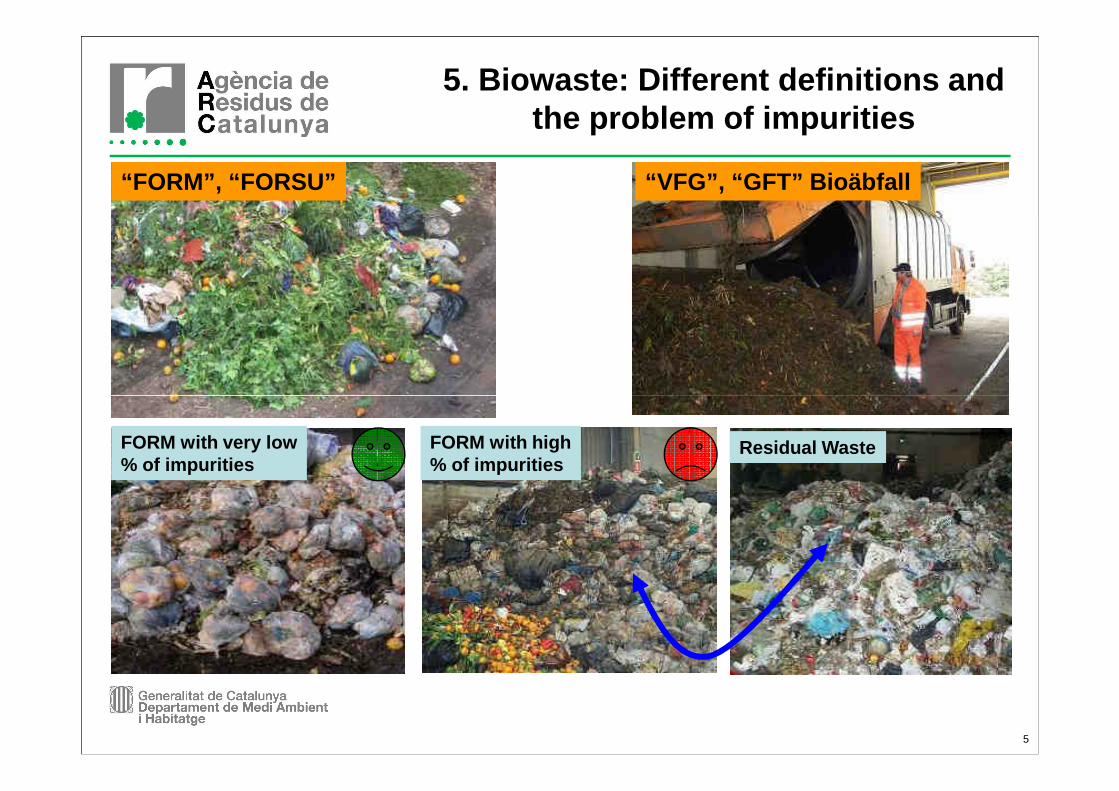
8. Biological treatment of Biowaste: Infrastructures & Treatment capacity
29
• Composting 240.000 T• Anaerobic Digestion 135.000 T
– Treatment Capacity range: 3.000-35.000 T/year
– Biowaste treated in 2007: 300.000 T– Green waste treated in 2005: 50.000 T– Compost traded in 2005: 35.000 T
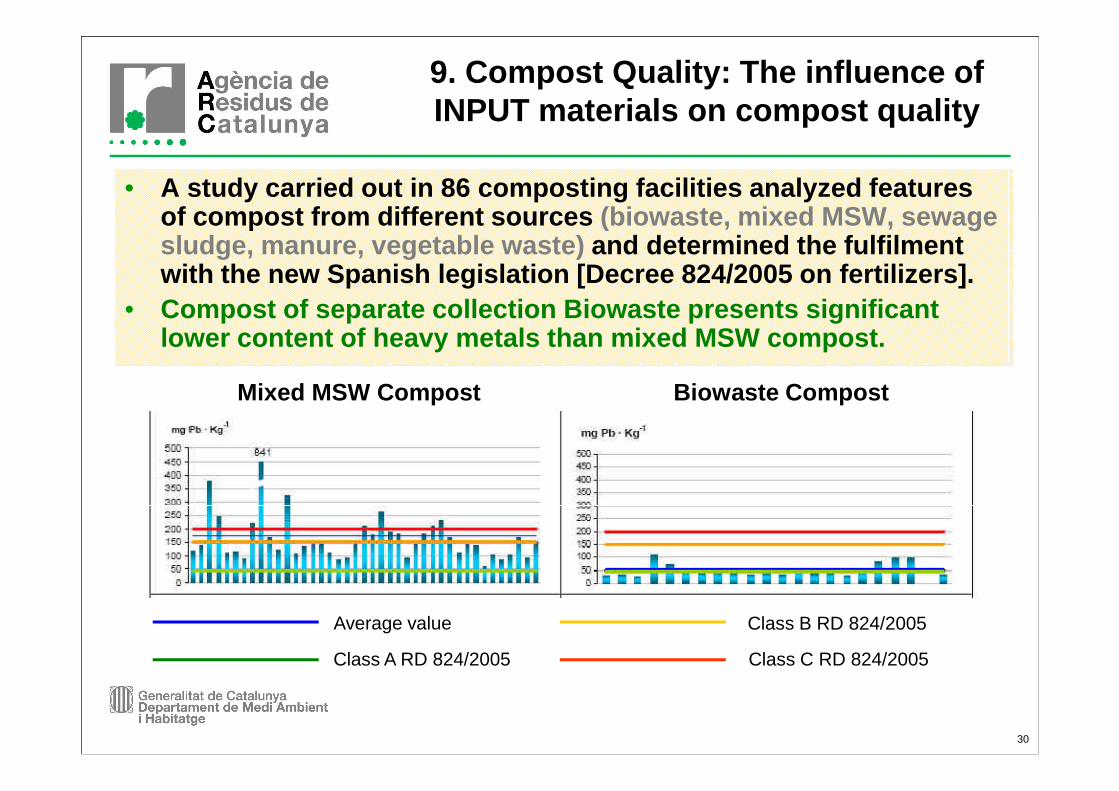
• A study carried out in 86 composting facilities ana lyzed features of compost from different sources (biowaste, mixed MSW, sewage sludge, manure, vegetable waste) and determined the fulfilment with the new Spanish legislation [Decree 824/2005 o n fertilizers].
• Compost of separate collection Biowaste presents si gnificant lower content of heavy metals than mixed MSW compos t.
Mixed MSW Compost Biowa ste Compost
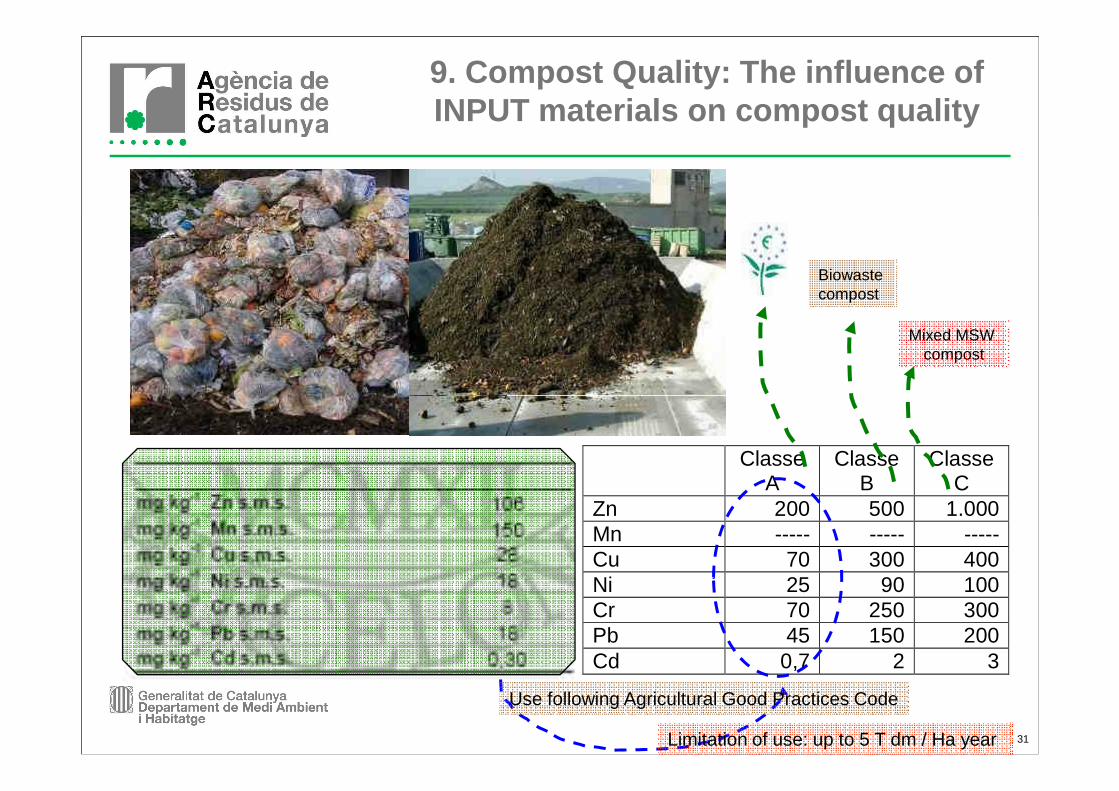
9. Compost Quality: The influence of INPUT materials on compost quality
30
Mixed MSW Compost Biowa ste Compost
Average value
Class A RD 824/2005 Class C RD 824/2005
Class B RD 824/2005
9. Compost Quality: The influence of INPUT materials on compost quality
Biowaste compost
Mixed MSW compost
31
Classe A
Classe B
Classe C
Zn 200 500 1.000 Mn ----- ----- ----- Cu 70 300 400 Ni 25 90 100 Cr 70 250 300 Pb 45 150 200 Cd 0,7 2 3
Use following Agricultural Good Practices Code
Limitation of use: up to 5 T dm / Ha year
• According to the experience of Catalunya it can be assumed that:– The adoption of specific legislation on biowaste separate collection and Tax
on landfilling has been essential for developing Biowaste recycli ng– Separate collection of Biowaste can be seen as a co mfortable & friendly task
when compostable bags and small ventilated buckets are used– Separate collection of Biowaste should be implemented thorough an
integrated way to optimize sorting schemes and avoid the increase of collection costs
– The continuous evaluation of biowaste separate collection performance is an important tool to improve the system
Conclusions
32
– The continuous evaluation of biowaste separate collection performance is an important tool to improve the system
– Both the tax refund criteria and the treatment fees -linked to quality of biowaste- , have contributed to improve biowaste quality
– The implementation of biowaste separate collection in Catalunya will allow the fulfilment of the biodegradable reducing target s of Landfill Directive
– Separate collection of Biowaste allows for a significant increase the overall separate collection rates of paper, glass, packaging, etc. Door to Door collection has shown to be the most efficient system
– Compost from separate collection of Biowaste presen ts significantly lower content of heavy metals than mixed MSW compost or Residual waste