+ All Categories
Home > Documents > IT and Firm Performance: Roles of Internal and External...

IT and Firm Performance: Roles of Internal and External...

Date post: 28-Mar-2018
Category:
Upload: dinhnhi
View: 222 times
Download: 1 times
Share this document with a friend
17
IT and Firm Performance: Roles of Internal and External Specialists 1 Mika Maliranta ETLA, The Research Institute of the Finnish Economy; University of Jyväskylä Petri Rouvinen ETLA, The Research Institute of the Finnish Economy Aarno Airaksinen Statistics Finland September 25, 2012 VERY PRELIMINARY AND VERY INCOMPLETE, PLEASE DO NOT QUOTE!! Abstract: We study labor productivity effects of employees’ information technology (IT) use with par- ticular interest on the support provided by both internal and external IT specialists (outsourcing). The labor share of internal IT specialists has grown steadily from about 4% in 1995 to about 7% in 2010. In 2004 some 42% of employees were exposed to the efforts of external IT specialists; in 2010 the corres- ponding share was 53%. Our pooled estimation results suggest that using a computer at work makes a worker about 20% more productive. Users with access to external IT specialists are considerably more productive than those accessing internal IT specialists. The latter observation is confirmed by our fixed- effects estimates that remove all time-invariant firm-specific factors. We also find some indication of complementarity between the efforts of internal and external IT specialists JEL codes: D23, D24, L14, L24 Keywords: Labor productivity, Information technology, External labor, Outsourcing; Finland Acknowledgements: [ to be competed ] Rouvinen has contributed to this paper as a part of BRIE-ETLA collaborative research. 1 Addresses for correspondence: Airaksinen: Statistics Finland. Maliranta: ETLA, The Research Institute of the Finnish Economy. Address: Lönnrotinkatu 4B, 00120 Helsinki, Finland. E-mail: [email protected] . Rouvinen: ETLA, The Research Institute of the Finnish Economy. Address: Lönnrotinkatu 4B, 00120 Helsinki, Finland. E-mail: pet- [email protected] .
Transcript

IT and Firm Performance:

Roles of Internal and External Specialists 1

Mika Maliranta – ETLA, The Research Institute of the Finnish Economy; University of Jyväskylä

Petri Rouvinen – ETLA, The Research Institute of the Finnish Economy

Aarno Airaksinen – Statistics Finland

September 25, 2012

VERY PRELIMINARY AND VERY INCOMPLETE, PLEASE DO NOT QUOTE!!

Abstract: We study labor productivity effects of employees’ information technology (IT) use with par-

ticular interest on the support provided by both internal and external IT specialists (outsourcing). The

labor share of internal IT specialists has grown steadily from about 4% in 1995 to about 7% in 2010. In

2004 some 42% of employees were exposed to the efforts of external IT specialists; in 2010 the corres-

ponding share was 53%. Our pooled estimation results suggest that using a computer at work makes a

worker about 20% more productive. Users with access to external IT specialists are considerably more

productive than those accessing internal IT specialists. The latter observation is confirmed by our fixed-

effects estimates that remove all time-invariant firm-specific factors. We also find some indication of

complementarity between the efforts of internal and external IT specialists

JEL codes: D23, D24, L14, L24

Keywords: Labor productivity, Information technology, External labor, Outsourcing; Finland

Acknowledgements: [ to be competed ] Rouvinen has contributed to this paper as a part of BRIE-ETLA

collaborative research.

1 Addresses for correspondence: Airaksinen: Statistics Finland. Maliranta: ETLA, The Research Institute of the Finnish

Economy. Address: Lönnrotinkatu 4B, 00120 Helsinki, Finland. E-mail: [email protected]. Rouvinen: ETLA, The

Research Institute of the Finnish Economy. Address: Lönnrotinkatu 4B, 00120 Helsinki, Finland. E-mail: pet-

[email protected].

1. INTRODUCTION

This paper studies the labor productivity consequences of the support provided by both internal and

external IT specialists. The labor input of the latter group is often referred to as IT outsourcing. In this pa-

per we use the term outsourcing upon referring to earlier literature but not in the context of our own

work, as outsourcing implies substitutability between internal and external labor, which is ultimately

an empirical question.

Our main data source is Statistics Finland’s IT and e-commerce survey. We extend our earlier work

(Maliranta, Rouvinen, & Airaksinen, 2008) by considering changes over time and by adding the consid-

eration of internal IT specialist. We also report some international findings of the ESSlimit project.

The consequences of outsourcing (and offshoring) in general have been studied from many points of

view, including employment (Falk & Wolfmayr, 2008; Ohnemus, 2011), productivity (Falk, 2012;

McCann, 2011) and subjective well-being (Böckerman & Maliranta, 2012; Geishecker, 2008). Lacity et al.

(2010) examine 164 information technology outsourcing articles published between 1992 and 2010 in scho-

larly journals. While a small fraction of these articles do consider the effects of IT outsourcing on firm

performance, none of the articles in their review explicitly consider productivity. However, few such

studies exist. Bertschek and Müller (2006) use a semi-parametric endogenous switching model to study

IT outsourcing. They find that, while IT outsourcing does not seem to make firms too different in ob-

served dimensions (partial production elasticities of key inputs), firms without IT outsourcing produce

more efficiently than those with IT outsourcing, which they attribute to coordination costs. Knittel and

Stango (2008) examine the effect of IT outsourcing with a panel of US credit unions. They find that IT

outsourcing has significant productivity benefits primarily towards the end of their 1992–2005 observa-

tion period. The effect is present only when studied within-firm and switching to outsourcing is endo-

genous. In cross-section they find that less productive firms are more likely to outsource. Ohnemus

(2011, Chapter 1) estimates an endogenous switching model upon studying the labor productivity ef-

fects of IT outsourcing. He finds computer use has a higher productivity impact in IT outsourcing

firms. His evidence also suggests a complementarity between IT use and IT outsourcing. Kite (2012)

estimates a stochastic frontier model upon studying the effects of IT outsourcing on total factor produc-

tivity. She finds that productivity is higher in firms that outsource more and that outsourced IT has a

larger impact than in-house IT.

2. DATA

Our data on IT originates from two Statistics Finland’s Use of Information Technology in Enterprises sur-

veys2 conducted in 2005 and 2011 and primarily referring to statistical years 2004 and 2010.

In the 2005 survey section 7.1 and in the 2011 survey section 9.1 asks: To what extent are the following

information technology functions performed by your firm’s own (hired) labor / outside labor? 3 In

the 2005 survey answers are requested in the following ten categories:

a. Design/development of Internet homepages,4

b. Maintenance of Internet homepages,5

c. Internet marketplace for private/retail customers,6

d. Internet or extranet marketplace for businesses,7

e. Other business to business commerce application (for example EDI),8

f. Development and maintenance of applications,9

g. Development of other information technology systems,10

h. Operation/maintenance of servers,11

i. Operation/maintenance of a PC environment,12 and

j. User support,13

The 2011 survey has in essence the same wording and categories, albeit in a somewhat more aggre-

gated manner (the above ten categories are aggregate to seven by, e.g., combining a and b to De-

sign/development/maintenance of Internet homepages). In this paper we use the arithmetic mean of a–j to

measure the support contribution of external IT specialist (see below).

In both surveys, the above questions were given one of the following mutually exclusive answers:

– Completely performed by external labor,14

– Mostly performed by external labor,15

– Equally performed by external and own labor,16

– Mostly performed by own labor,17

– Completely performed by own labor,18 and

– I am unable to say / Irrelevant.19

2 In Finnish: Tietotekniikka ja sähköinen kauppa yrityksissä. 3 In Finnish: Missä määrin seuraavat tietotekniikkatoiminnot tehdään yrityksenne omalla työvoimalla / ulkopuolisella työvoimalla? 4 In Finnish: Internet-kotisivujen suunnittelu/kehittäminen. 5 In Finnish: Internet-kotisivujen ylläpito. 6 In Finnish: Internet-kauppapaikka yksityis/vähittäisasiakkaille. 7 In Finnish: Internet tai extranet kauppapaikka yrityksille. 8 In Finnish: Muu yritystenvälisen liiketoiminnan sovellus (esim. EDI). 9 In Finnish: Sovellusten kehittäminen ja ylläpito. 10 In Finnish: Muu tietotekniikkasysteemien kehittäminen. 11 In Finnish: Palvelinten käyttö/ylläpito. 12 In Finnish: PC-ympäristön käyttö/ylläpito. 13 In Finnish: Käyttäjätuki. 14 In Finnish: Kokonaan ulkopuolisella työvoimalla. 15 In Finnish: Pääosin ulkopuolisella työvoimalla. 16 In Finnish: Yhtä paljon ulkopuolisella ja omalla työvoimalla. 17 In Finnish: Pääosin omalla työvoimalla. 18 In Finnish: Kokonaan omalla työvoimalla. 19 In Finnish: En osaa sanoa / Ei relevantti.

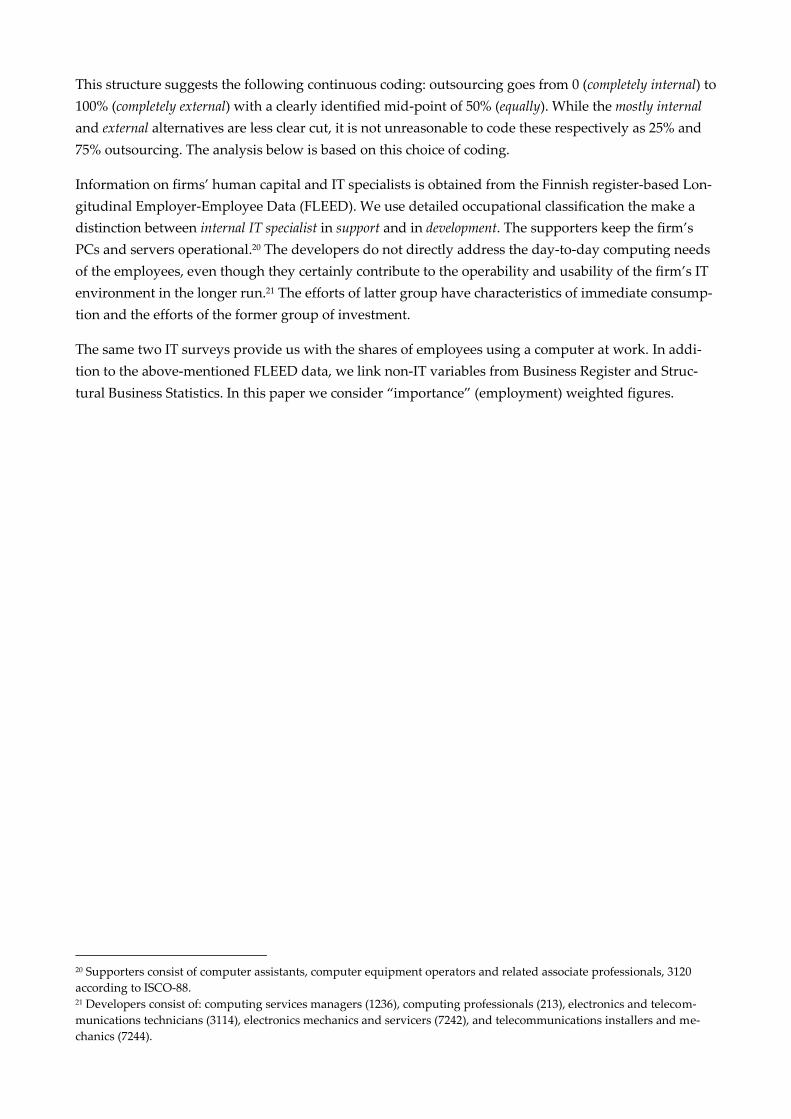
This structure suggests the following continuous coding: outsourcing goes from 0 (completely internal) to

100% (completely external) with a clearly identified mid-point of 50% (equally). While the mostly internal

and external alternatives are less clear cut, it is not unreasonable to code these respectively as 25% and

75% outsourcing. The analysis below is based on this choice of coding.

Information on firms’ human capital and IT specialists is obtained from the Finnish register-based Lon-

gitudinal Employer-Employee Data (FLEED). We use detailed occupational classification the make a

distinction between internal IT specialist in support and in development. The supporters keep the firm’s

PCs and servers operational.20 The developers do not directly address the day-to-day computing needs

of the employees, even though they certainly contribute to the operability and usability of the firm’s IT

environment in the longer run.21 The efforts of latter group have characteristics of immediate consump-

tion and the efforts of the former group of investment.

The same two IT surveys provide us with the shares of employees using a computer at work. In addi-

tion to the above-mentioned FLEED data, we link non-IT variables from Business Register and Struc-

tural Business Statistics. In this paper we consider “importance” (employment) weighted figures.

20 Supporters consist of computer assistants, computer equipment operators and related associate professionals, 3120

according to ISCO-88. 21 Developers consist of: computing services managers (1236), computing professionals (213), electronics and telecom-

munications technicians (3114), electronics mechanics and servicers (7242), and telecommunications installers and me-

chanics (7244).

3. MODEL

Basic idea

The basic idea of our model is illustrated in Figure 1 below. The in-house employment of each firm is

split between those that use a computer at work (IT users) and those that do not (IT non-users). IT users

in turn are split into three groups (some or all of which may be empty ones): two groups of internal IT

specialists – IT supporters and IT developers – as well as IT production users (IT non-specialists). The efforts

of both supporters and developers aim at enhancing the computer use of production users (possibly

with some time lag).

As figure 1 illustrates, the firm may also choose to purchase the effort of external IT specialists. Just like

in the case of internal ones, the (possible) fruits of their efforts are taken up by IT production users. Below

we device a model that jointly considers the productivity impacts of computer use as well as internal

and external IT specialists.

Figure 1: An illustration of the basic idea of our model

Deriving the model

Below we derive a model at the individual level (but will ultimately employ data that is “grouped” da-

ta at the level of a firm; thus we will use labor-weighted regressions). Our specification assumes that

workers are similar after controlling their observable qualities. The specification uncovers, e.g., an em-

ployee’s “excess” productivity associated with using a computer at work that may vary by the type and

intensity of the labor effort by internal and external IT specialists.

An extended Cobb-Douglas production function for firm i at time t can be written as follows:

it it it it it itY A K E L Z (1)

Developers

Supporters

IT production

users

Where Y is the net output, A is disembodied technology, K is capital, L is labor, and Z is a vector of oth-

er relevant qualities of the firm and its employees.

Labor consists of two main groups, those who work with IT, IT users, and those how do not. The former

group includes those who use IT in production, IT production users, and those who provide IT support

to IT production users, internal IT specialists.

Formally this can be expressed as:

production

0, , ,

specialist

it it IT it IT itL L L L

(2)

As discussed in the previous section, specialists consist of IT supporters (who provide immediate IT

support to the IT production users) IT developers, formally

specialist supporter developer

, , ,   IT it IT it IT itL L L (3)

The relative efficiency of workers (measured by ) may depend on whether or not s/he uses a computer

and what is her/his occupation (IT production user or IT specialist) at work

support

0, , , ,exp 1 1 1 1

production developer

it IT it IT it IT itproduction supporter developer

it IT IT IT

it it it it

L L L LE

L L L L

(4)

The above yields an estimable labor productivity specification:

producer

,

ln ln( ) ln ln

ln

itit it

it it

supporter developer

IT itproducer supporter developerIT,it IT,it

IT IT IT it

it it it

KYA L

L L

L L LZ

L L L

(5)

Finally, we examine the roles of IT support provided by internal or external IT specialists in determining

the productivity effects of IT production use. For this analysis, we use related but slightly different ap-

proach, applied in Maliranta, Rouvinen, and Airaksinen (2008). More specifically, one could argue that

the productivity effect of IT production use is dependent on whether it is supported by internal or ex-

ternal IT specialists. This can be written as follows:

, ,

, ,

ln ln( ) ln ln

1 ln

itit it

it it

supporter developer

supporter developerIT,it IT,it

IT IT

it it

production production

IT it IT it

use INT use EXT it

it it

KYA L

L L

L L

L L

L Lexternal external Z

L L

(6)

where external indicates the proportion of the total IT support provided by external IT specialists.

4. DESCRIPTIVE STATISTICS

As can be seen in Table 1, in 2004 about 72% and in 2010 about 75% of workers in Finnish businesses

used a computer at work (IT: Users). The share of internal IT supporters grew from 2.0% to 2.2% (IT:

Internal supporters) and internal IT developers from 5.1% to 5.3% (IT: Internal developers). The share of

“production” workers using a computer, i.e., excluding internal IT supporters and developers, grew

from 65% to 67% (IT: Production users). The share of employment exposed to the labor efforts of external

IT specialists grew from 42% to 53% (IT: External specialists).

Table 1: Descriptive statistics (weighted, separately for the two points in time)

Year = 2004 Obs. Mean Std. dev. Min. Max.

ln(net output/labor input) 1,532 11.072 .535 9.829 13.648

IT: Users 1,532 .717 .285 .010 1.000

IT: Production users 1,532 .647 .287 .003 1.000

IT: Internal supporters 1,532 .020 .046 .000 .626

IT: Internal developers 1,532 .051 .136 .000 .960

IT: External specialists 1,532 .422 .194 .000 1.000

Ed.: Associate degree 1,532 .180 .078 .000 .700

Ed.: Bachelor degree 1,532 .124 .091 .000 .771

Ed.: Master degree 1,532 .089 .104 .000 .755

Ed.: PhD degree 1,532 .048 .067 .000 .733

Age: Youngest, 16-24 yrs 1,532 .100 .098 .000 .828

Age: Younger, 25-34 yrs 1,532 .246 .104 .000 .842

Age: Older, 45-54 yrs 1,532 .251 .091 .000 .722

Age: Oldest, 55-70 yrs 1,532 .132 .067 .000 .526

Gender: Woman 1,532 .353 .236 .000 1.000

Year = 2010 Obs. Mean Std. dev. Min. Max.

ln(net output/labor input) 1,322 11.137 .545 9.644 14.018

IT: Users 1,322 .748 .294 .010 1.000

IT: Production users 1,322 .673 .304 .001 1.000

IT: Internal supporters 1,322 .022 .071 .000 .685

IT: Internal developers 1,322 .053 .144 .000 .981

IT: External specialists 1,322 .532 .222 .000 1.000

Ed.: Associate degree 1,322 .142 .070 .000 .750

Ed.: Bachelor degree 1,322 .148 .095 .000 .835

Ed.: Master degree 1,322 .104 .124 .000 .814

Ed.: PhD degree 1,322 .060 .088 .000 .733

Age: Youngest, 16-24 yrs 1,322 .107 .121 .000 .773

Age: Younger, 25-34 yrs 1,322 .261 .093 .000 .821

Age: Older, 45-54 yrs 1,322 .234 .088 .000 .750

Age: Oldest, 55-70 yrs 1,322 .148 .075 .000 .593

Gender: Woman 1,322 .385 .255 .000 1.000

Table 2 shows pairwise correlations of the variables (if significant at or above 10% level). In the earlier

survey firms with a higher share of IT users employed the efforts of external IT specialists less inten-

sively (-.103), but this unconditional pairwise correlation is no longer present in the later survey. IT

support and development appear to be positively correlated (.292 and .353). Internal and external sup-

port appear to be negatively correlated (-.157 and -.179 in 2004 as well as -.108 and -.220 in 2010).

Table 2: Pairwise correlations (not shown, if not statistically significant at 10% level)

Year = 2004ln

(ou

t/in

)

IT: U

sers

IT: P

rod

.

IT: I

nt.

su

p.

IT: I

nt.

dev

.

IT: E

xte

rna

l

Ed

.: A

ss.

Ed

.: B

ach

.

Ed

.: M

ast

er

Ed

.: P

hD

ln(net output/labor input) 1

IT: Users .293 1

IT: Production users .238 .916 1

IT: Internal supporters .107 .196 -.047 1

IT: Internal developers .135 .233 -.154 .292 1

IT: External specialists -.103 -.157 -.179 1

Ed.: Associate degree .258 .368 .318 .116 .121 1

Ed.: Bachelor degree .262 .334 .233 .162 .244 -.169 .169 1

Ed.: Master degree .362 .394 .278 .122 .311 -.142 .083 .329 1

Ed.: PhD degree .268 .335 .250 .085 .234 -.100 .121 .167 .858 1

Year = 2010

ln(o

ut/

in)

IT: U

sers

IT: P

rod

.

IT: I

nt.

su

p.

IT: I

nt.

dev

.

IT: E

xte

rna

l

Ed

.: A

ss.

Ed

.: B

ach

.

Ed

.: M

ast

er

Ed

.: P

hD

ln(net output/labor input) 1

IT: Users .335 1

IT: Production users .265 .837 1

IT: Internal supporters .054 .184 -.187 1

IT: Internal developers .118 .242 -.295 .353 1

IT: External specialists .098 -.108 -.220 1

Ed.: Associate degree .258 .289 .238 .058 .075 1

Ed.: Bachelor degree .239 .381 .195 .155 .322 -.151 .116 1

Ed.: Master degree .419 .379 .185 .154 .342 -.150 .364 1

Ed.: PhD degree .339 .317 .186 .111 .225 -.098 .051 .197 .868 1

5. RESULTS

Below we only report our weighted results exploiting both surveys. Later versions will provide a more

comprehensive set of results (that largely confirm the observations below). Table 3 pools the two sur-

veys and reports our (robust) ordinary least squares estimates.

Table 3: Estimation results of a labor productivity equation – Pooled OLS

Column 1 has the IT variables of interest in their most basic forms. Internal IT use is simply measured

by the share of employees using a computer at work (IT: Users) without separate internal IT supporters

and developers. The use of external IT specialists (IT: External specialists) – or “IT outsourcing intensity”

– is measured as the share of various IT activities performed by outside labor (see Section 2 for details).

As can be seen, a computer-equipped worker is about twenty per cent more productive than an other-

wise similar one without a computer (the more commonly reported IT capital’s output elasticity is

about half of this coefficient). External IT specialists seem to add a good ten per cent to this productivity

effect.

In Column 2 the level of IT use is interacted with the intensity of using external IT specialists. The vari-

able IT: Users with internal specialists refers to the following interaction:

IT: Users × ( 1 – IT: External specialists )

LHS: ln(net output/labor input) 1. 2. 3. 4. 5.

IT: External specialists .140 **

IT: Users .184 ***

IT: Users with internal specialists .086 +

IT: Users with external specialists .291 ***

IT: Production users .193 ***

IT: Internal supporters .297 ** .301 ** -.152

IT: Internal developers .536 *** .504 *** .309 **

IT: Prod. users with internal spec. .085 + .113 **

IT: Prod. users with external spec. .285 *** .260 ***

IT: Internal × External specialists .943 ***

Ed.: Associate degree 1.086 *** 1.086 *** 1.044 *** 1.039 *** 1.022 ***

Ed.: Bachelor degree .650 *** .636 *** .575 *** .595 *** .547 ***

Ed.: Master degree 1.215 *** 1.237 *** 1.110 *** 1.201 *** 1.129 ***

Ed.: PhD degree .527 ** .509 * .548 ** .496 * .556 **

Age: Youngest, 16-24 yrs -.046 -.064 -.068 -.055 -.027

Age: Younger, 25-34 yrs .246 .250 .223 .225 .255

Age: Older, 45-54 yrs .036 .047 -.004 .035 .097

Age: Oldest, 55-70 yrs -.070 -.085 -.045 -.036 .032

Gender: Woman -.506 *** -.500 *** -.490 *** -.493 *** -.495 ***

ln(capital/labor) .107 *** .107 *** .108 *** .106 *** .104 ***

ln(labor) .011 .011 .006 .009 .008

Also: A constant term, industry controls (17), a control for the reference year (2010)

Observation 2,854 2,854 2,854 2,854 2,854

R-squared .680 .680 .690 .690 .690

Robust (het.-cons.) weighted OLS. ***, **, *, + indicate signif. at 1%, 5%, 10%, 15% level.

and the following one, IT: Users with external specialists, to this one:

IT: Users × ( External specialists )

The idea being that users are split between internal and external support. As can be seen, computer use

clearly boosts productivity only in the case of externally supported users.

In Column 3 we split internal IT use to support, development, and production use without considering

the effort of external IT specialists. As can be seen, both types of internal IT support seem to have an

independent positive productivity effect.

In Column 4 we add the same interaction as in Column 2 but now assuming that the efforts of external

IT specialists are geared towards boosting the productivity of IT production workers. The coefficients

are virtually identical to those in Column 2.

In Column 5 we add the interaction of internal (both supporters and developers) and external IT spe-

cialists – there efforts seem to be complementary.

The estimator in Table 3 exploits the available information to the fullest. The results are driven by a mix

of cross-section and time-series information. Despite our extensive set of controls it may well be that the

above observations are driven by the fact that better (higher productivity) firms engage in computer

user and its internal/external support and that there is no causal relation between these factors and

productivity. In order to shed light on these issues the fixed-effects estimator in Table 4 removes any

time-invariant firm-specific factors.

Table 4 replicates the setup in Table 3 but, since the overall of the two surveys is only 480 firms, with

considerable loss of data. As can be seen, the variables of interest are not statistically significant at con-

ventional levels. The signs of the coefficient estimates are mostly the same, even though the estimates

are often smaller in magnitude. Note, however, that in the last two columns the difference between the

internally and externally supporter production users are statistically significant at conventional levels

(F-tests are to be added).

Table 4: Estimation results of a labor productivity equation – Fixed effects

LHS: ln(net output/labor input) 1. 2. 3. 4. 5.

IT: External specialists .078

IT: Users .043

IT: Users with internal specialists -.031

IT: Users with external specialists .155 +

IT: Production users .053

IT: Internal supporters .158 .159 .587

IT: Internal developers -.166 -.225 -.320

IT: Prod. users with internal spec. -.057 -.074

IT: Prod. users with external spec. .189 * .193 *

IT: Internal × External specialists -.643 +

Ed.: Associate degree 1.226 ** 1.197 * 1.196 * 1.177 * 1.106 *

Ed.: Bachelor degree 2.025 *** 1.984 *** 1.948 *** 1.961 *** 1.981 ***

Ed.: Master degree .154 .103 .174 .123 .200

Ed.: PhD degree -.268 -.273 -.318 -.336 -.446

Age: Youngest, 16-24 yrs 1.132 ** 1.096 ** 1.198 ** 1.092 ** 1.102 **

Age: Younger, 25-34 yrs 1.300 *** 1.312 *** 1.342 *** 1.337 *** 1.330 ***

Age: Older, 45-54 yrs 1.366 *** 1.347 *** 1.410 *** 1.367 *** 1.436 ***

Age: Oldest, 55-70 yrs .173 .214 .129 .245 .286

Gender: Woman .256 .226 .287 .212 .222

ln(capital/labor) -.039 ** -.037 ** -.034 * -.036 * -.037 **

ln(labor) -.189 *** -.188 *** -.194 *** -.192 *** -.202 ***

Also: A constant term and a control for the reference year (2010)

Observation 960 960 960 960 960

R-squared .210 .210 .220 .220 .220

Robust (het.-cons.) weighted OLS. ***, **, *, + indicate signif. at 1%, 5%, 10%, 15% level.

6. COMPARISON ACROSS COUNTRIES

This section uses the results obtained from the firm-level regressions estimated by the harmonized

common code distributed within the Eurostat’s ESSLimit project. The analysis is based on the ITOUT

variable (firms classified by their combination of internal IT specialists, external IT specialists, and IT

education). The specification for labor productivity (LPV) based on value added was used, controlling

for human capital that is not available for all 15 countries that were involved in the project.22

Based on ITOUT the results are reclassified into two categories, in accordance to the classification we

used in our analysis with the Finnish data above. A distinction is made between IT support provided

by internal and external IT (“outsourced”) specialists. This gives four different combinations: (none,

only internal, only external, both). Figure 2 shows the distribution of the number of observations over

these combinations. There is a tendency towards IT support by internal specialists, especially in Finland

and Slovenia, although UK firms tend to have both types of support, and there are also countries where

firms have neither, especially in France. Figure 3 shows the average labor productivity (and Figure 4

TFP) by combination, in deviation from the overall averages. Clearly, firms with no IT support by spe-

cialists tend to have lower productivity in all countries. The evidence on support by internal and exter-

nal IT specialists is suggestive at best and somewhat mixed. But it is striking that firms combining both

types of IT support tend to have higher productivity. This could also reflect complementarity between

the internal and external IT specialists. This is especially the case in France, but not for instance in Slo-

venia, and the evidence in Finland is also quite weak.

22

For more information on the harmonized code and data, see the final report of the project.

Figure 2. Distribution of observation by combination of types of support.

Figure 3. Average labor productivity by combination of support (deviations from overall average).

0%

10%

20%

30%

40%

50%

60%

DK FI FR NO SE SI UK

External IT specialists

0%

10%

20%

30%

40%

50%

60%

DK FI FR NO SE SI UK

Internal IT specialists

0%

10%

20%

30%

40%

50%

60%

DK FI FR NO SE SI UK

Both types of IT specialits

0%

10%

20%

30%

40%

50%

60%

DK FI FR NO SE SI UK

No IT specialitst

-10%

-5%

0%

5%

10%

DK FI FR NO SE SI UK

External specialist

-10%

-5%

0%

5%

10%

DK FI FR NO SE SI UK

Internal specialists

-24 %

-10%

-5%

0%

5%

10%

DK FI FR NO SE SI UK

Both types of specialists 14 %

-10%

-5%

0%

5%

10%

DK FI FR NO SE SI UK

No specialists

Figure 4. Average TFP by combination of support (deviations from overall average)

-10%

-5%

0%

5%

10%

DK FI FR NO SE UK

External specialists

-10%

-5%

0%

5%

10%

DK FI FR NO SE UK

Internal specialists

-10%

-5%

0%

5%

10%

DK FI FR NO SE UK

Both types of specialists

-10%

-5%

0%

5%

10%

DK FI FR NO SE UK

No specialists

7. DISCUSSION AND CONCLUSIONS

Three-fourths of employees in Finnish business use a computer at work. IT “production” users are at-

tended to by an increasing number of both internal (in-house) and external (outsourced) IT specialists.

The labor share of internal IT specialists has grown from about 4% in 1995 to current about 7%. In 2004

some 42% of employees were exposed to the efforts of external IT specialists; in 2010 the corresponding

share was 53%.

Our pooled estimation results suggest that using a computer at work makes a worker about 20% more

productive. Users with access to external IT specialists are considerably more productive than those

accessing internal IT specialists. The latter observation is confirmed by our fixed-effects estimates that

remove all time-invariant firm-specific factors (with considerable loss of data and efficiency). We also

find some indication of complementarity between the efforts of internal and external IT specialists.

REFERENCES

Bertschek, I., & Müller, M. (2006). Productivity Effects of IT-Outsourcing: Semiparametric Evidence for

German Companies. In S. Sperlich, W. Härdle & G. Aydinli (Eds.), The Art of Semiparametrics (pp.

130-154). Heidelberg and New York: Physica-Verlag, Springer.

Böckerman, P., & Maliranta, M. (2012). Globalization, Creative Destruction, and Labour Share Change:

Evidence on the Determinants and Mechanisms from Longitudinal Plant-Level Data. Oxford

Economic Papers, 64(2), 259-280.

Falk, M. (2012). International Outsourcing and Productivity Growth. Review of Economics and Institutions, 3(1).

Falk, M., & Wolfmayr, Y. (2008). Services and Materials Outsourcing to Low-Wage Countries and

Employment: Empirical Evidence from EU Countries. Structural Change and Economic Dynamics,

19(1), 38-52.

Geishecker, I. (2008). The Impact of International Outsourcing on Individual Employment Security: A Micro-

level Analysis. Labour Economics, 15(3), 291-314.

Kite, G. (2012). The Impact of Information Technology Outsourcing on Productivity and Output: New

Evidence from India. Procedia Economics and Finance, 1(0), 239-248. doi: 10.1016/s2212-5671(12)00028-7

Knittel, C. R., & Stango, V. (2008). The Productivity Effects of IT Outsourcing. Mimeo.

Lacity, M. C., Khan, S., Yan, A., & Willcocks, L. P. (2010). A review of the IT outsourcing empirical literature

and future research directions. Journal of Information Technology, 25(4), 395-433. doi: 10.1057/jit.2010.21

Maliranta, M., Rouvinen, P., & Airaksinen, A. (2008). IT Outsourcing in Finnish Business. In T. Clayton (Ed.),

Information Society: ICT Impact Assessment by Linking data from Different Sources (pp. 240-255). London:

UK Office for National Statistics.

McCann, F. (2011). The Heterogeneous Effect of International Outsourcing on Firm Productivity. Review of

World Economics/Weltwirtschaftliches Archiv, 147(1), 85-108.

Ohnemus, J. (2011). Empirical Analysis of Information Technology and Business Process Outsourcing. Doktor der

Wirtschaftswissenschaft Dissertation, Humboldt-Universität, Berlin.

APPENDIX

Figure A. Proportion of ICT support occupations in the Finnish business sector

Note: Years 1996-1999 and 2001-2003 are computed by linear interpolation. Shares of occupations are

computed from the register-based Finnish Longitudinal Employer-Employee data (FLEED).

0%

1%

2%

3%

4%

5%

6%

7%

1995 1996 1997 1998 1999 2000 2001 2002 2003 2004 2005 2006 2007 2008 2009

Extended ICT support

Direct ICT support


Recommended