32
Itay Ben-Lulu & Uri Goldfeld Instructor : Dr. Yizhar Lavner Spring 2004 23/9/2004
| Date post: | 17-Dec-2015 |
| Category: |
Documents |
| Upload: | samantha-barnett |
| View: | 216 times |
| Download: | 0 times |

Itay Ben-Lulu & Uri Goldfeld
Instructor : Dr. Yizhar Lavner
Spring 2004 23/9/2004
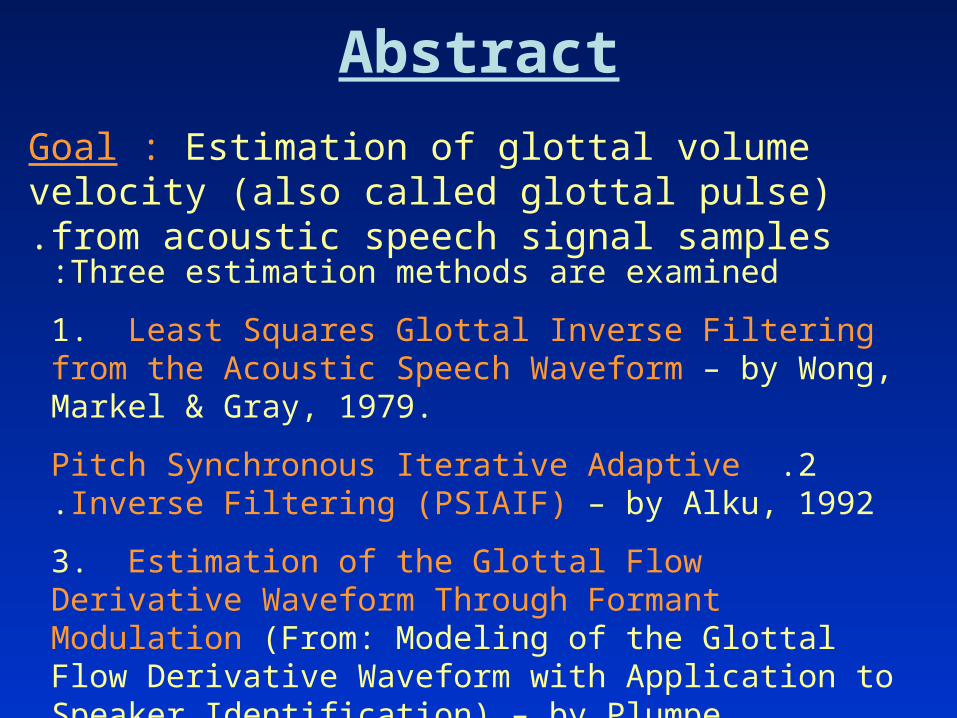
Abstract
Goal : Estimation of glottal volume velocity (also called glottal pulse) from acoustic speech signal samples.
Three estimation methods are examined:
1. Least Squares Glottal Inverse Filtering from the Acoustic Speech Waveform – by Wong, Markel & Gray, 1979.
2 .Pitch Synchronous Iterative Adaptive Inverse Filtering (PSIAIF) – by Alku, 1992.
3. Estimation of the Glottal Flow Derivative Waveform Through Formant Modulation (From: Modeling of the Glottal Flow Derivative Waveform with Application to Speaker Identification) – by Plumpe, Quatieri & Reyndols, 1997.

Applications• Speech synthesis – knowledge of the glottal
frequency is important to produce a synthetic speech that sounds natural.
• There are explicit differences between male and female glottal pulses.
• Different glottal excitations produce different phonation types: normal, pressed, breathy.
• Glottal pulse has great importance in determining speech types : angry voice, soft voice, happy voice, etc.

Impulse train
generator
Glottal pulse model
G z
Vocal tract model
V z
Radiation model
R z
Random noise generator
e n Gu n
Lu n s n
Discrete-Time System Model for Speech
Production
Voiced/unvoiced switch
( ) - glottal volume velocity (glottal pulse)Gu n
( ) - speech pressure wave signals n
For voiced speech : the input to is the glottal pulse,
For unvoiced speech : the input to is a random noise
( )Gu n( )V z
( )V z
( ) - glottal volume velocity derivativeq n
Denote:

Least Squares Glottal Inverse Filtering from the Acoustic
Speech Waveform (Wong, Markel and Gray)
• The vocal-tract model is assumed to be an all-pole model :
1
1( )
1K
ii
i
V zc z
where K is an even integer.
• The lip radiation model is given by a differencing filter :1( ) 1 , 0.98 1R z z

• Then, we can estimate the glottal volume velocity transfer
function : ( ) ( )ˆ ( )( )G
S z A zU z
R z
where is an all-zero filter:( )A z1ˆ( )( )
V zA z
• Assume that an M-th order analysis filter of the form
0
( ) , M
ii
i
A z a z M K
is to be obtained using covariance method of linear prediction
of the speech signal.
• Z-Transform gives:( )
(*) ( )( ) ( )G
S zU z
V z R z
The problem is estimating the vocal-tract transform, ( )V z
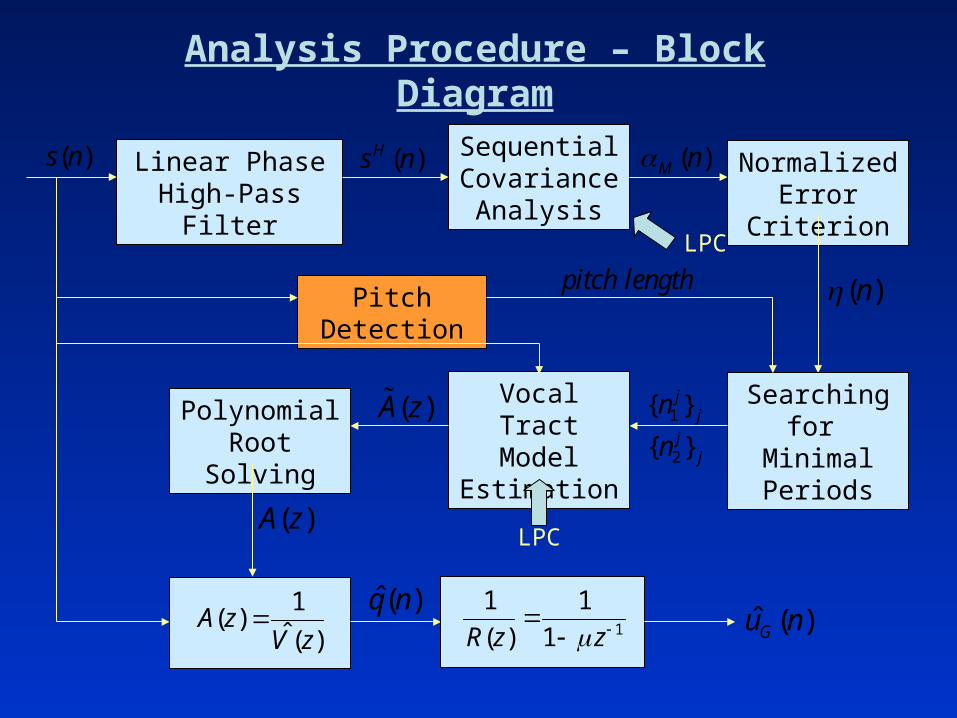
Analysis Procedure – Block Diagram
Linear Phase High-Pass Filter
( )s n Sequential Covariance
Analysis
Normalized Error Criterion
Pitch Detection
Searching for Minimal Periods
( )n
( )M n( )Hs n
Vocal Tract Model
Estimation
1{ }j jn
2{ }j jn
pitch length
Polynomial Root Solving
( )A z
( )A z
1( )
ˆ( )A z
V z 1
1 1
( ) 1R z z
ˆ( )q nˆ ( )Gu n
LPC
LPC

3. Normalized Error Criterion – Obtaining by :
2. Sequential Covariance Analysis –
An N-length analysis window is sequentially moved one sample
at a time throughout . we obtain the total squared error :
1. Linear Phase High-Pass Filter –
The speech signal is passed through an high pass filter.( )s n
( )Hs n1
2( ) ( )n N M
Mj n
n j
when:1
( ) ( ) ( )M
i ii
n a c s n i
Algorithm Stages
n-M n n-M+N-1
0 M-1 N-1M N-M
( )n0
( )( ) ( )M nn n
where is defined by:0 ( )n1
20 ( ) ( )
n N M
j n
n s j
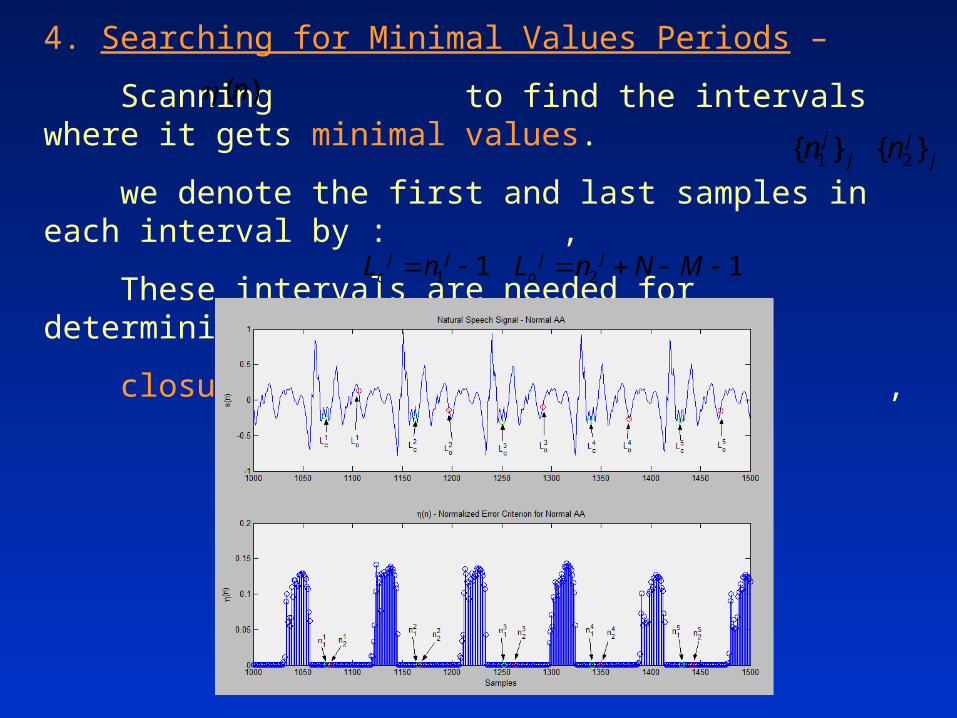
4. Searching for Minimal Values Periods –
Scanning to find the intervals where it gets minimal values.
we denote the first and last samples in each interval by : ,
These intervals are needed for determining the points of glottal
closure and opening : ,
( )n
1{ }j jn 2{ }j jn
1 1j jcL n 2 1j j
oL n N M
6. Polynomial Root Solving –
Removing real poles (close to zero frequency) and high
bandwidth poles, from the filter .
5. Vocal Tract Model Estimation –
The prediction error filter is estimated using LPC at
each closed phase interval, determined by , .
( )A z
( )A z
{ }jcL { }joL
7. Inverse Filtering + Integration –
The original speech signal is passed through the inverse
filter of , and then through an integrator
.
Finally, we obtain the estimation for the glottal pulse - .
ˆ( ) 1 ( )A z V z
11 1
( ) 1R z z
ˆ ( )Gu n
( )s n
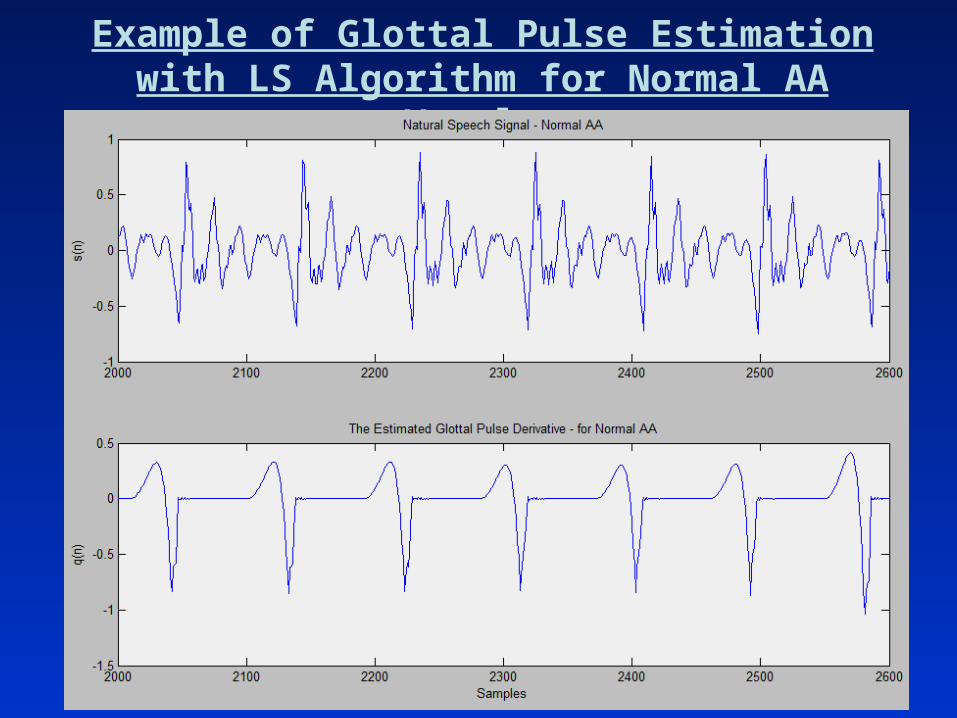
Example of Glottal Pulse Estimation with LS Algorithm for Normal AA
Vowel :

Example of Glottal Pulse Estimation with LS Algorithm for Pressed AA
Vowel :

Algorithm Drawbacks
• Normalized Error Criterion Calculation -
In long voice signals a problem of over-complexity may appear.
• Closed Period Identification –
In noisy voice signals it may be difficult to determine where the
normalized error criterion, , gets its minimal values (phase 4).
An insufficiently accurate closed period identification causes
poor glottal pulse estimation.
• Minimal Values Periods Criterion –
The numerical criterion for determining the minimal values periods
of may need to be adapted to some voice signals.
( )n
( )n

PSIAIF - Pitch Synchronous Iterative Adaptive Inverse
Filtering (Alku) • A reliable response to some drawbacks in the first Inverse
Filtering algorithm.
• This algorithm is based on the speech production model:
Glottal Excitation Lip RadiationVocal Tract Speech
• Assumptions for this model:
1. the model is linear and time-invariant during a short time
interval.
2. the interaction between different processes is negligible.
3. the lip radiation effect is modeled with a fixed differentiator.

The PSIAIF Analysis Method
• The main idea: we can estimate the vocal tract accurately
enough with LPC analysis, if the tilting effect of the glottal
source is eliminated from the speech spectrum.
• Estimation of the glottal pulse is computed in the IAIF-
algorithm with an iterative structure that is repeated twice.
IAIF Method:
PSIAIF Method:
• In order to improve the performance of LPC analysis in the
estimation of the vocal tract transfer function, the final glottal
wave estimate is computed pitch synchronously.

Structure of the IAIF Algorithm
LPC analysis of order 1
IntegrationInverse Filtering
LPC analysis of order
Inverse Filtering1t
( )s n 1( )gH z
1( )vtH z
1( )g n2 ( )u n
1( )u n
IntegrationInverse Filtering
LPC analysis of order
Inverse Filtering2t
2( )vtH z
( )ag n4 ( )u n
3( )u n
LPC analysis of order 2g
2( )gH z

Structure of the PSIAIF Algorithm
High-Pass Filtering
Pitch SynchronismIAIF-1
IAIF-2
( )s n ( )hps n ( )pag n
( )gu n
0 1{ , ,...}n n
The speech signal to be analyzed is denoted . ( )s n
The estimated glottal excitation is denoted . ( )gu n
• The speech signal is high-pass filtered. ( )s n
• The high-pass filtered signal, , is used as an input to the
first IAIF-analysis. The output is one frame of a pitch
asynchronously glottal wave estimate, . ( )pag n
( )hps n

• The time indices of maximum glottal openings, ,
are computed for each frame of . This computation requires
the knowledge of - the average length of pitch period.
Preliminary knowledge of helps us focusing the search of
maximum glottal openings on short time periods.
( )pag n
0 1{ , ,...}n n
M
• The final estimate for the glottal excitation is obtained by
analyzing the high-pass filtered speech signal, , with
the IAIF-algorithm pitch synchronously.
( )hps n
M

Example of Glottal Pulse Estimation with PSIAIF Algorithm for Normal AA
Vowel :

Example of Glottal Pulse Estimation with PSIAIF Algorithm for Breathy AA
Vowel :

Estimation of the Glottal Flow Derivative Waveform Through Formant Modulation (Plumpe)
• This algorithm is similar to Wong’s Least-Squares algorithm,
with few differences (principles and implementation).
• The vocal-tract model is assumed to be an all-pole model :
1
1( )
1K
ii
i
V zc z
where K is an even integer.
• The main goal is to estimate the vocal-tract transfer function,
using the covariance method of linear prediction.
When we obtain the vocal-tract model estimation, we can easily
estimate the glottal flow derivative :( )ˆ ( )
ˆ( )
S zQ z
V z

Analysis Procedure – Block Diagram
Linear Phase High-Pass Filter
( )s n Speech Waveform Whitening
Peak Picking
Pitch Detection
Measuring Formant
Frequencies
{ }jp
( )g n( )Hs n
Formant Tracking
( )F n
pitch length
Setting Initial Stationary Region
1( )F n
1 2[ , ]j jn n
1( )
ˆ( )A z
V zˆ( )q n
LPC
LPC
Extending Initial Stationary Region
Vocal Tract Model
Estimation
Polynomial Root Solving
1 2[ , ]j jN N ( )A z
LPC( )A z

1. Linear Phase High-Pass Filter –
The speech signal is passed through an high pass filter.( )s n
Algorithm Stages
2. Speech Waveform Whitening –
The high-pass filtered speech signal is whitened by inverse
filtering with covariance method solution, using a one pitch-period
frame update and a two pitch-period analysis window. Real zeros
are removed from LPC solution. A rough estimation of the glottal
flow derivative is obtained - .
( )Hs n
( )g n
3. Peak Picking –
The obtained rough estimation, , is scanned to identify the
approximate time of glottal pulses through negative peak picking.
The negative peaks are marked by : .
( )g n
{ }jp
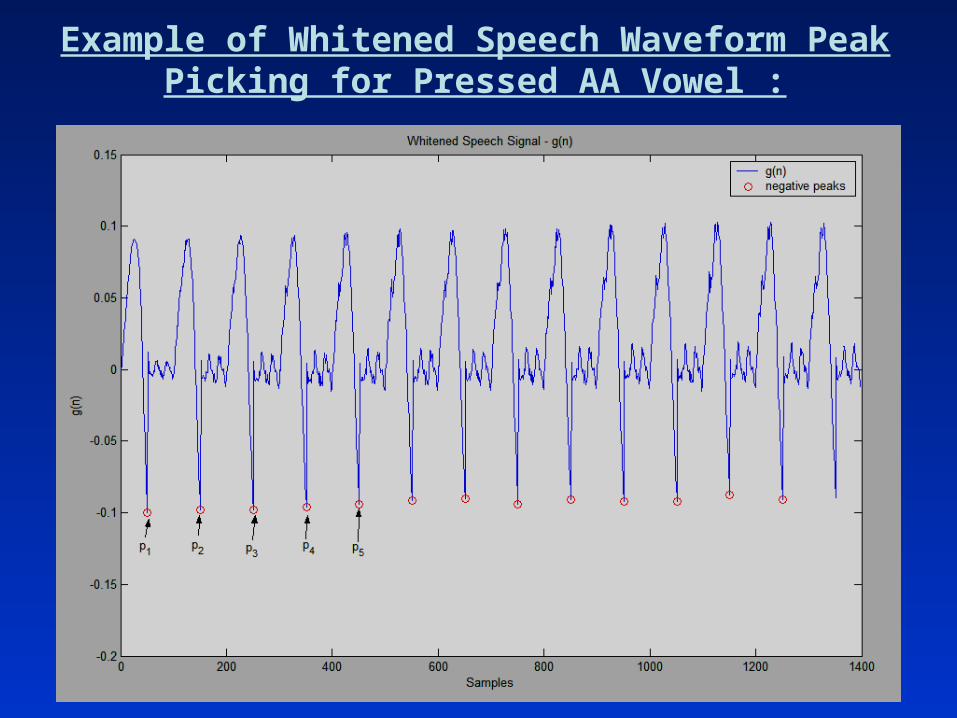
Example of Whitened Speech Waveform Peak Picking for Pressed AA Vowel :
4. Measuring Formant Frequencies –
At each glottal cycle, a sliding covariance-based linear prediction
analysis with a one-sample shift is used. The size of rectangular
analysis window is , where is linear prediction order.
A vocal-tract estimate is found for each window.
2M M
5. Formant Tracking –
At each glottal cycle, the four lowest formants - calculated from the
vocal-tract estimates - are tracked by their frequency using a Viterbi
search. The cost function is the variance of the formant track
including the proposed pole to be added to the end of the track.
We obtain the formant track, . 1( )F n

Example of Formant Tracking for Pressed AA Vowel :

6. Setting Initial Stationary Region –
Within each glottal cycle, we define a formant change function as:0
0
1
0 1 1 0( ) ( ) ( 1) ; 1 3n M
i n
D n F i F i n N M
The argument is varied to minimize :
where is linear prediction order, is glottal cycle length.M N
0n 0( )D n0
*0min ( )
nn D n
The initial stationary formant region is set to be :
This region is denoted by : .
* *[ , ]n n M
7. Extending Initial Stationary Region –
The initial stationary formant region is extended to
obtain the stationary formant region - .
The extension to right is based on the following procedure :
1 2[ , ]j jn n
1 2[ , ]j jn n
1 2[ , ]j jN N

Identify Initial Stationary Region .
Calculate Average and Standard Deviation over
Interval .
Is Include the Point in the Stationary Region
Extend the Region to Left
1 2[ , ]n n
avgF
F1 2[ , ]n n
2 1n
2 2 1n n 1 2( 1) 6avg FF n F
NO
YES
Extending to Left : The final mean and standard deviation are kept constant.

9. Polynomial Root Solving –
Removing real poles (close to zero frequency) and high
bandwidth poles, from the filter .
8. Vocal Tract Model Estimation –
The prediction error filter is estimated using LPC at
each stationary formant region, determined by , .
( )A z
( )A z
1{ }jN 2{ }jN
10. Inverse Filtering –
The original speech signal is passed through the inverse
filter of , to obtain the estimation for the glottal pulse
derivative - .
ˆ( ) 1 ( )A z V z
ˆ( )q n
( )s n
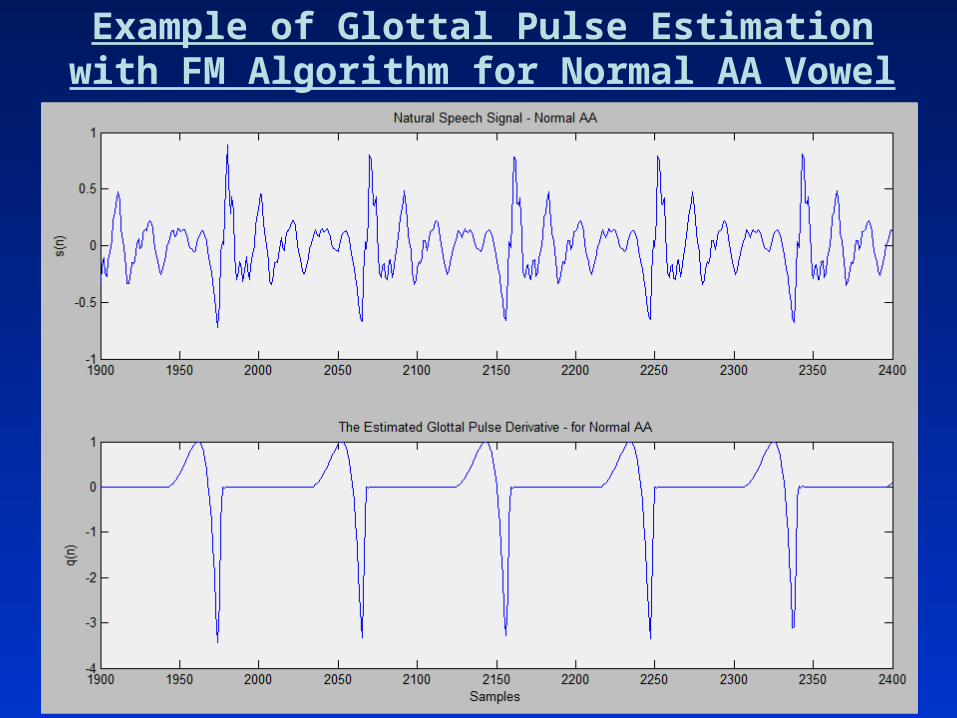
Example of Glottal Pulse Estimation with FM Algorithm for Normal AA
Vowel :
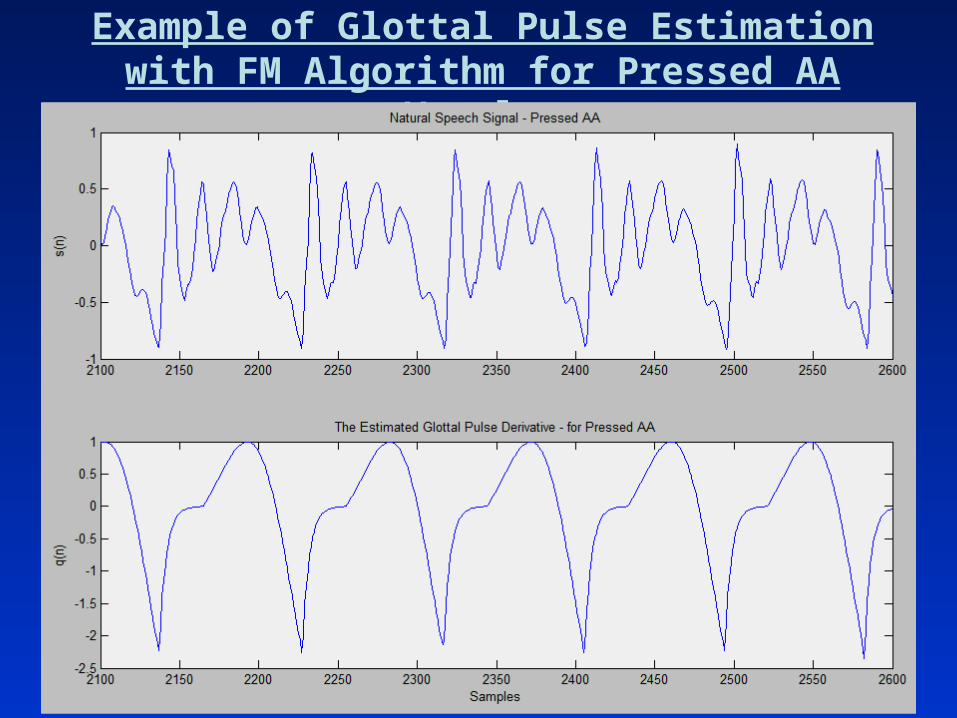
Example of Glottal Pulse Estimation with FM Algorithm for Pressed AA
Vowel :

Algorithm Drawbacks
• Initial Stationary Region Extension -
In some voice signals, the first formant frequency is not stable
during the closed phase. Hence, an accurate determination of a formant
stationary region is depended on a single numerical parameter.


