40
ITC Jan 2017 - Revision Prepared by Elles Mukunyadze CA (Z)

ITC Jan 2017 - Revision
Prepared by Elles Mukunyadze CA (Z)

Slide 2
Bridging the Gap
From SA CTA to Zim ITC :
What is different (Manfin Perspective)
1. The context is Zim – currency, places and names (Important in strategy and risk questions)
2. Tax rate – 25.75% and tax rules as they apply to Manfin
3. Risk management and strategy questions

Slide 3
Our Approach
• Cover Exam Techniques
• Look at an example
Slide 4
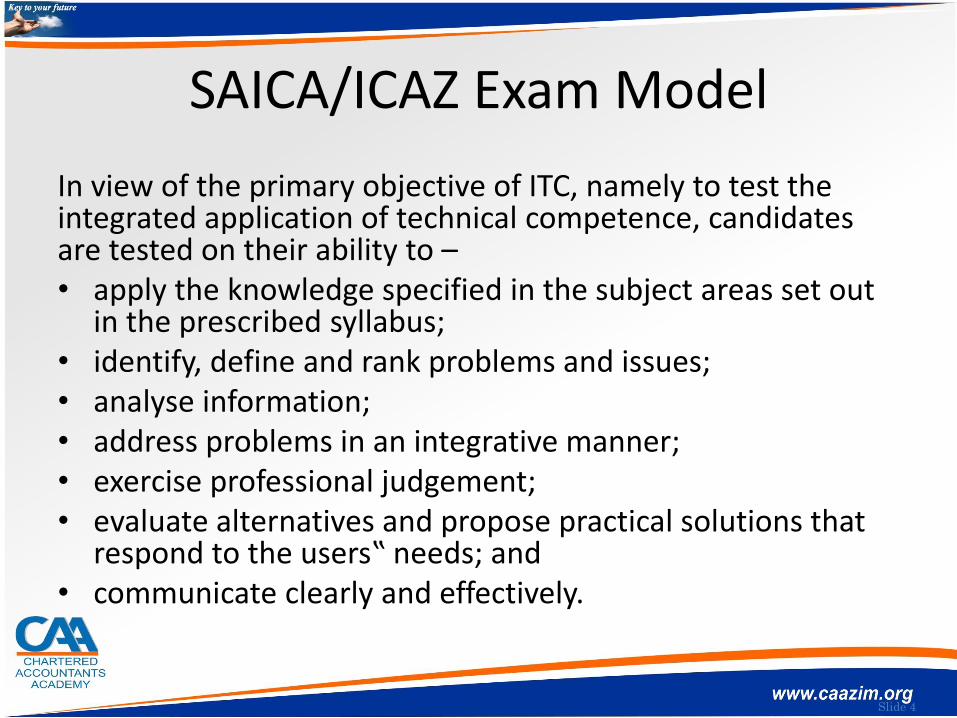
SAICA/ICAZ Exam Model
In view of the primary objective of ITC, namely to test the integrated application of technical competence, candidates are tested on their ability to –• apply the knowledge specified in the subject areas set out
in the prescribed syllabus; • identify, define and rank problems and issues; • analyse information; • address problems in an integrative manner; • exercise professional judgement; • evaluate alternatives and propose practical solutions that
respond to the users‟ needs; and • communicate clearly and effectively.
Slide 5
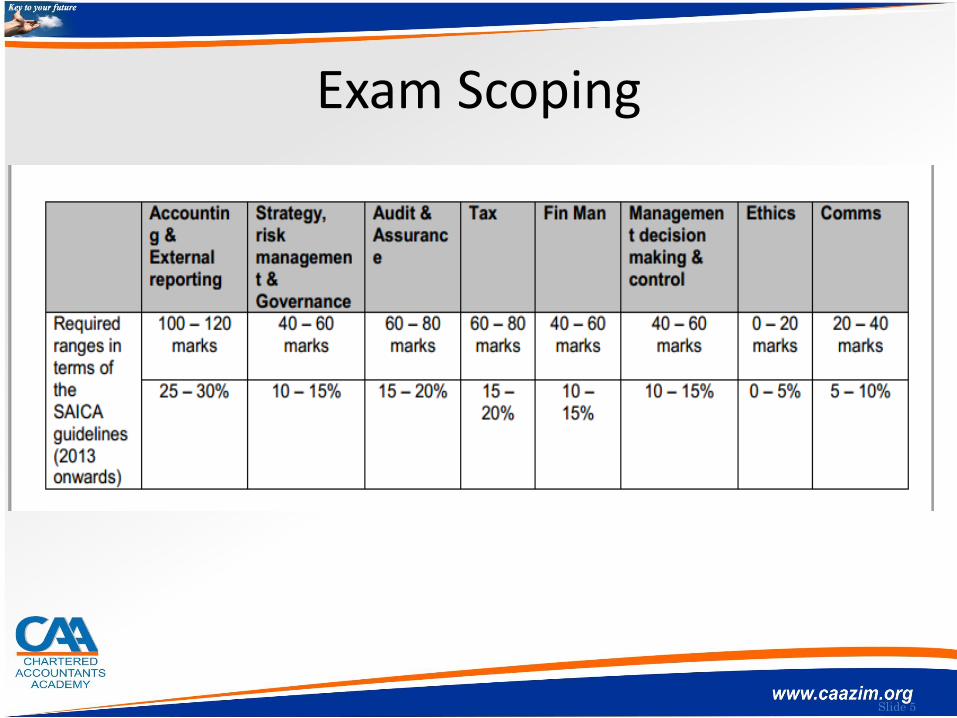
Exam Scoping
Slide 6
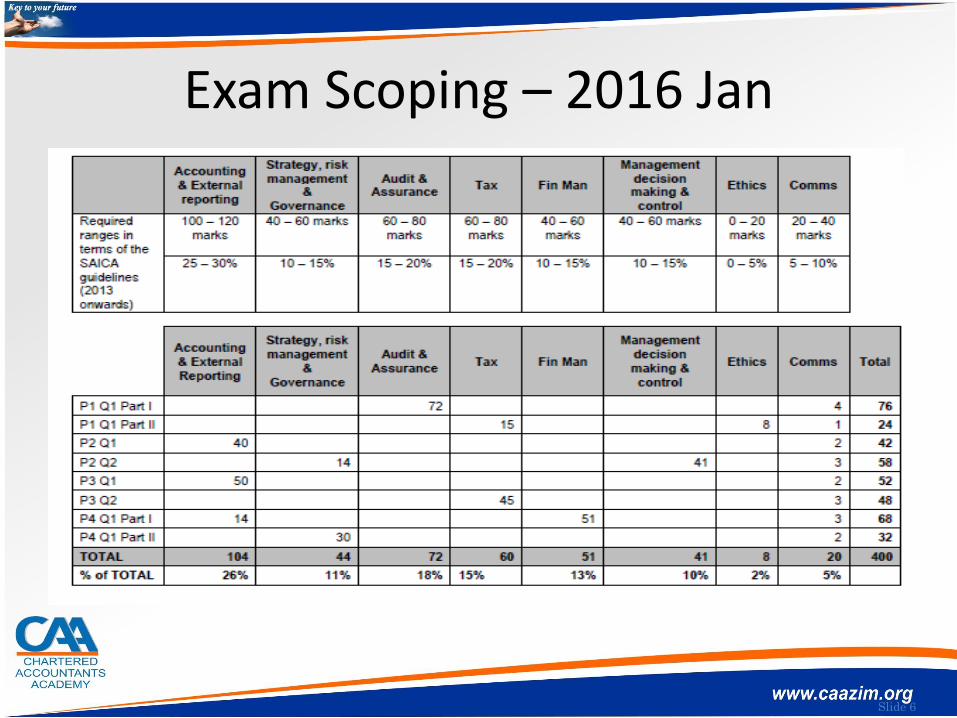
Exam Scoping – 2016 Jan

Slide 7
Overall comments on the papers
• The January 2016 ITC examination was considered overall challenging, yet fair and at appropriate level for the ITC.
• From result statistics, it was evident that candidates found paper 4 easier and paper 2 the hardest amongst all 4 papers

Slide 8
Key Issues
• Application of knowledge
• Workings
• Communication
• Time management
• Layout and presentation
• Irrelevancy
• Drilling down
• Recommendations / interpretations

Slide 9
Paying equal attention to all the competency areas
• I draw your attention to the following regulation:
• “4.2 A minimum of 200 marks (thus 50%) are required to pass the ITC.
• 4.3 Candidates need to demonstrate an appropriate level of competence in ALL areas and disciplines, and therefore the overall pass mark of 50% shall be subject to the candidate achieving a sub-minimum of 40% in at least three of the four professional papers.”

Slide 10
2017 Exam Possible Scope
Costing
• ABC
• Absorption and Variable costing technique
• Relevant costing
• CVP Analysis
• Standard Costing
• Divisional Performance & Transfer pricing
Slide 11
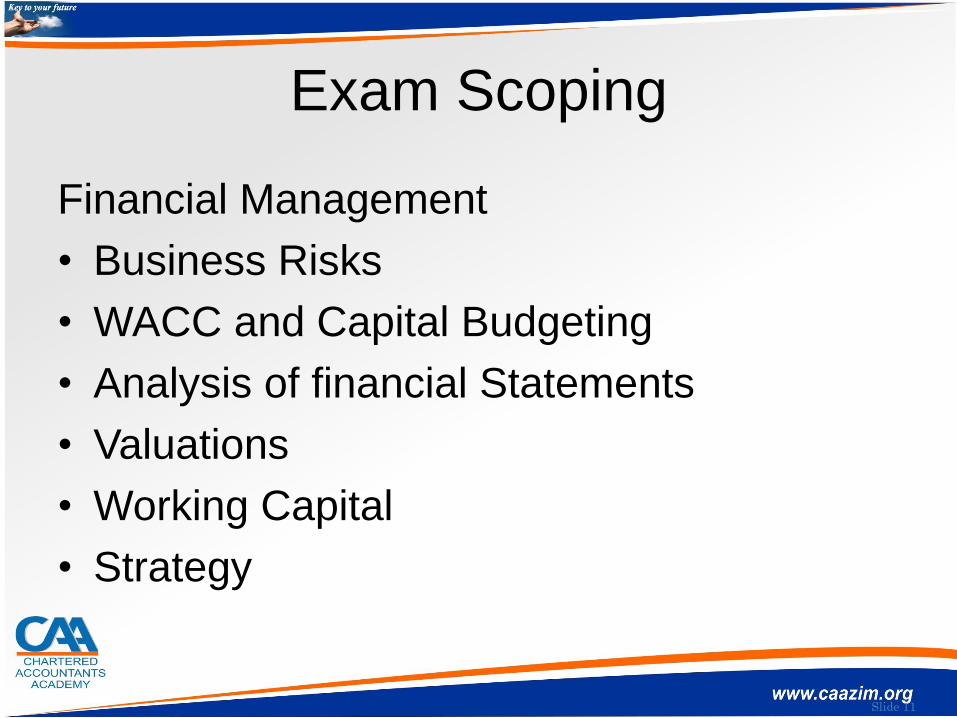
Exam Scoping
Financial Management
• Business Risks
• WACC and Capital Budgeting
• Analysis of financial Statements
• Valuations
• Working Capital
• Strategy
Slide 12
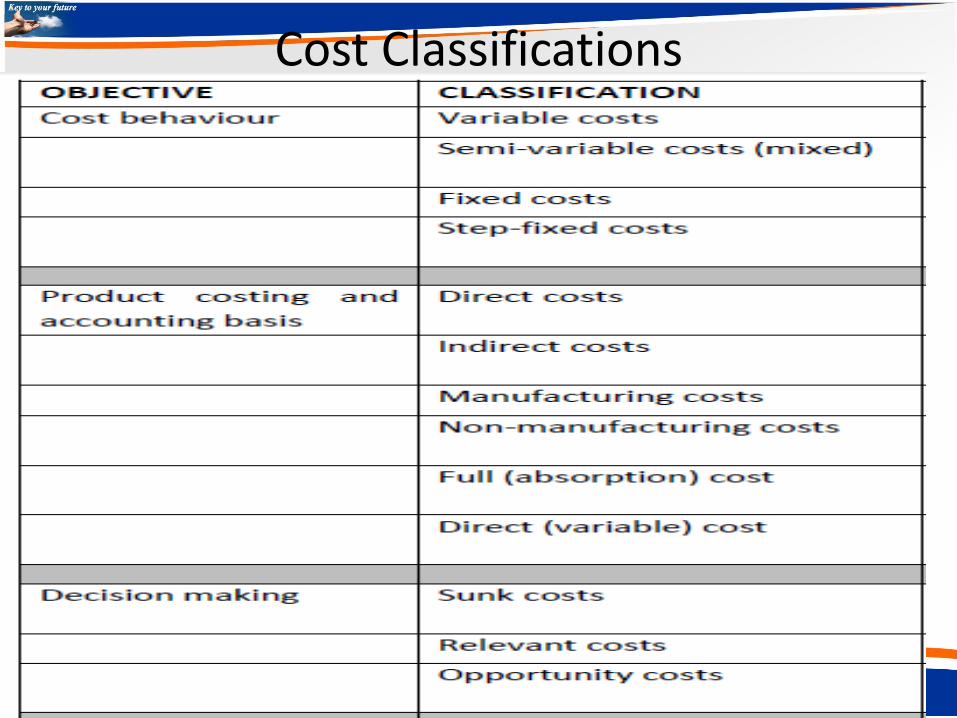
Cost Classifications
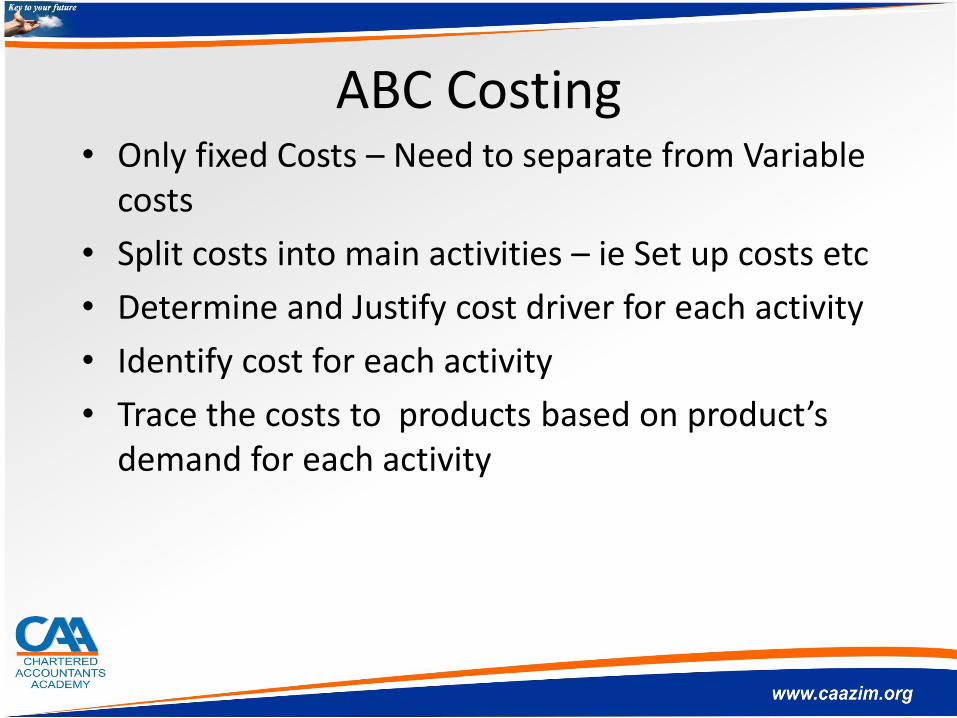
ABC Costing• Only fixed Costs – Need to separate from Variable
costs
• Split costs into main activities – ie Set up costs etc
• Determine and Justify cost driver for each activity
• Identify cost for each activity
• Trace the costs to products based on product’s demand for each activity
Slide 14
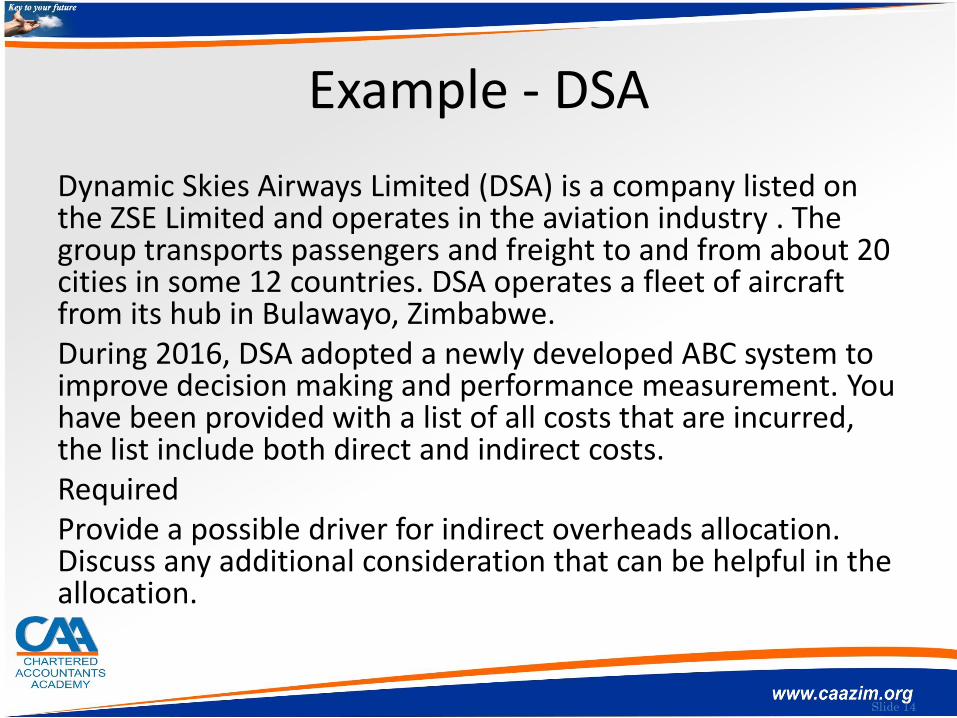
Example - DSA
Dynamic Skies Airways Limited (DSA) is a company listed on the ZSE Limited and operates in the aviation industry . The group transports passengers and freight to and from about 20 cities in some 12 countries. DSA operates a fleet of aircraft from its hub in Bulawayo, Zimbabwe.During 2016, DSA adopted a newly developed ABC system to improve decision making and performance measurement. You have been provided with a list of all costs that are incurred, the list include both direct and indirect costs.RequiredProvide a possible driver for indirect overheads allocation. Discuss any additional consideration that can be helpful in the allocation.

Slide 15
Cost contents Cost object Airplane Cost object flight
Outsourcing maintenance pPart and component costs pFuel costs pPilot salaries pAirports costs pSalaries of cabin crew pPassenger service costs (i.e. in-flight catering etc.) p
Insurance of airplanes pLeasing cost of airplanes pDepreciation of airplanes pSalaries of maintenance and repair employees p
Machine equipment costs pQuality checking costs pHangar costs (maintenance space) p
Costs of dispatching/monitoring flights p
Costs of rental/office equipment/supplies p
Salaries of financial planning and cabin allocation employees/promotion costs
p
Costs of rental/office equipment/supplies p
Salaries of ground staff pCosts of rental/office equipment/supplies p
Other p

CVP Analyis• Costs Classifications
• Once off costs
• Two or more products
• Discussion question involving new intiatives
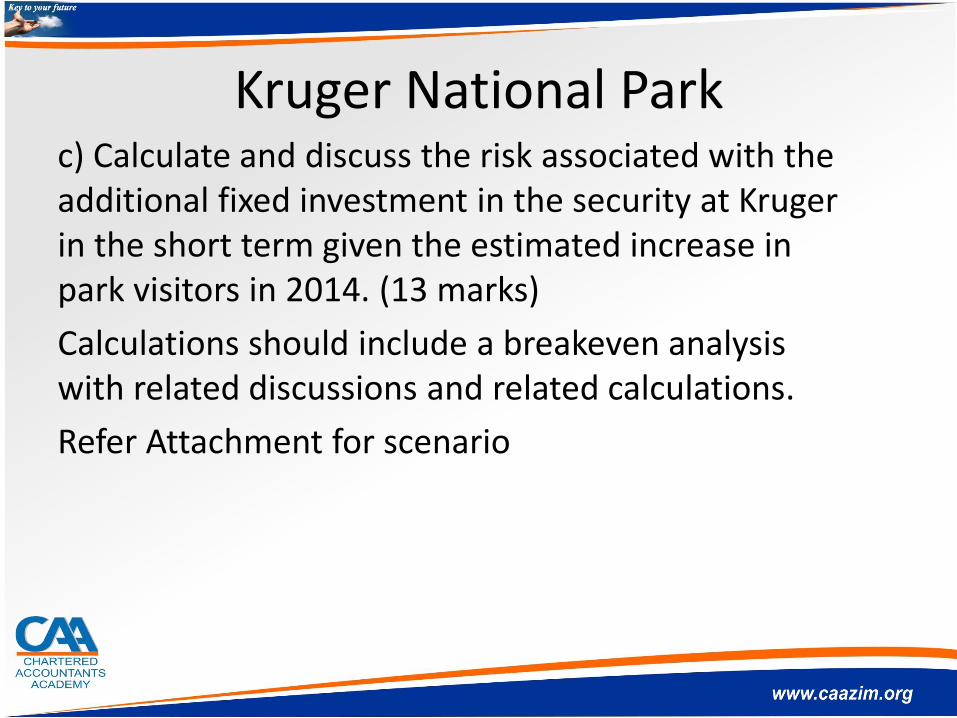
Kruger National Parkc) Calculate and discuss the risk associated with the additional fixed investment in the security at Kruger in the short term given the estimated increase in park visitors in 2014. (13 marks)
Calculations should include a breakeven analysis with related discussions and related calculations.
Refer Attachment for scenario

Relevant costing• Special Order
• Make or buy decisions
• Sell or process further
• Constraint optimization
• Closing a Division, Timing of closing
• Quotation
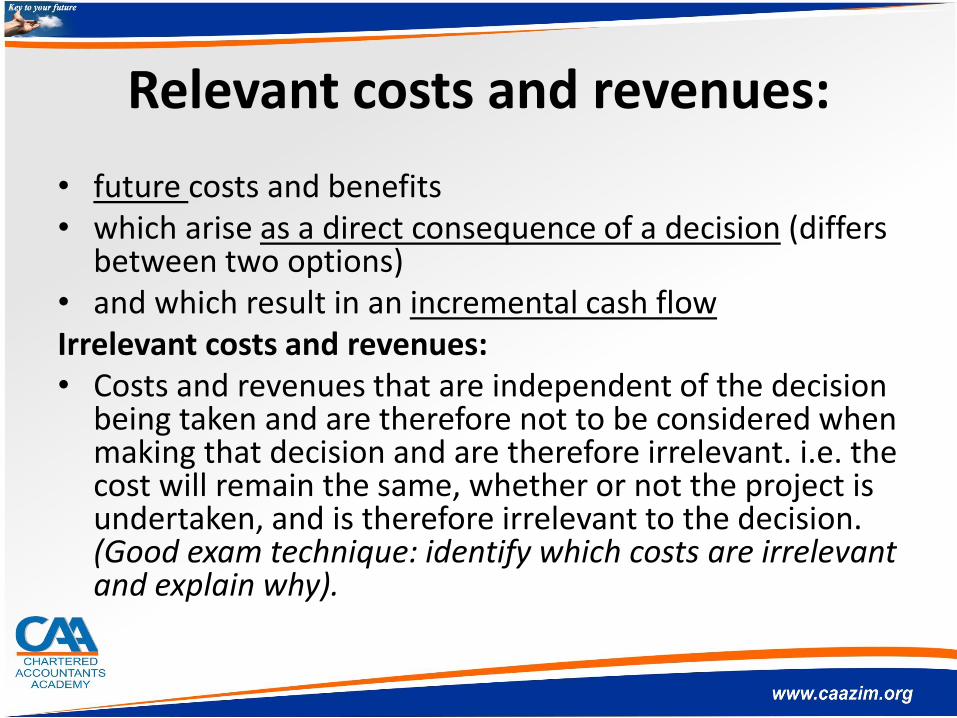
Relevant costs and revenues:
• future costs and benefits• which arise as a direct consequence of a decision (differs
between two options)• and which result in an incremental cash flowIrrelevant costs and revenues:• Costs and revenues that are independent of the decision
being taken and are therefore not to be considered when making that decision and are therefore irrelevant. i.e. the cost will remain the same, whether or not the project is undertaken, and is therefore irrelevant to the decision. (Good exam technique: identify which costs are irrelevant and explain why).
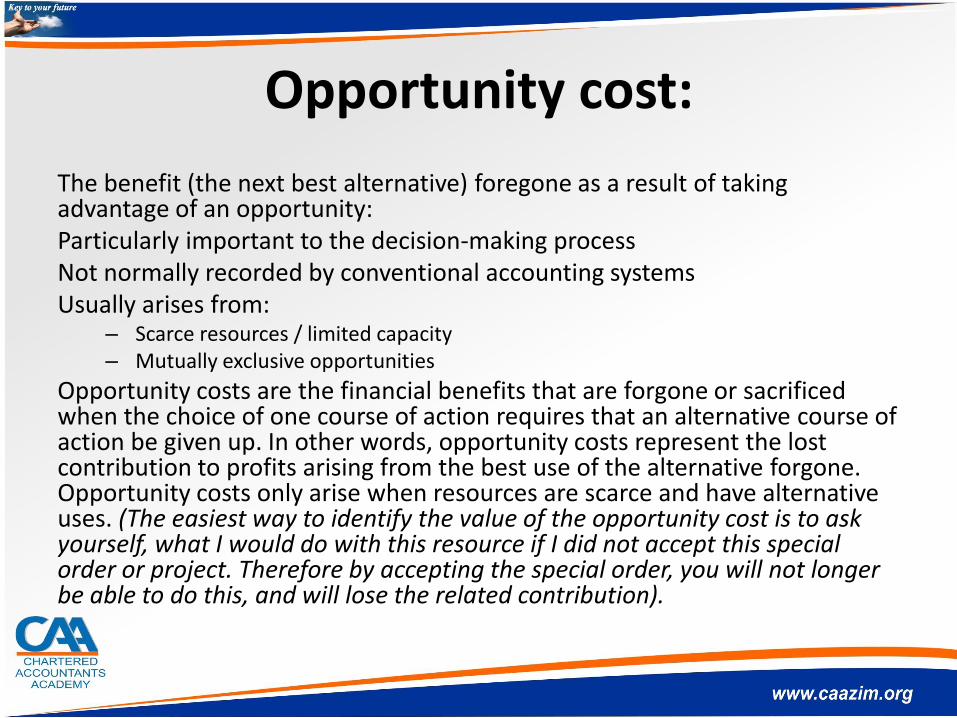
Opportunity cost:
The benefit (the next best alternative) foregone as a result of taking advantage of an opportunity:Particularly important to the decision-making processNot normally recorded by conventional accounting systemsUsually arises from:
– Scarce resources / limited capacity– Mutually exclusive opportunities
Opportunity costs are the financial benefits that are forgone or sacrificed when the choice of one course of action requires that an alternative course of action be given up. In other words, opportunity costs represent the lost contribution to profits arising from the best use of the alternative forgone. Opportunity costs only arise when resources are scarce and have alternative uses. (The easiest way to identify the value of the opportunity cost is to ask yourself, what I would do with this resource if I did not accept this special order or project. Therefore by accepting the special order, you will not longer be able to do this, and will lose the related contribution).

Other Costs
• Sunk Costs
• Committed costs
• Common costs
• Attributable costs
Approach to answering questions
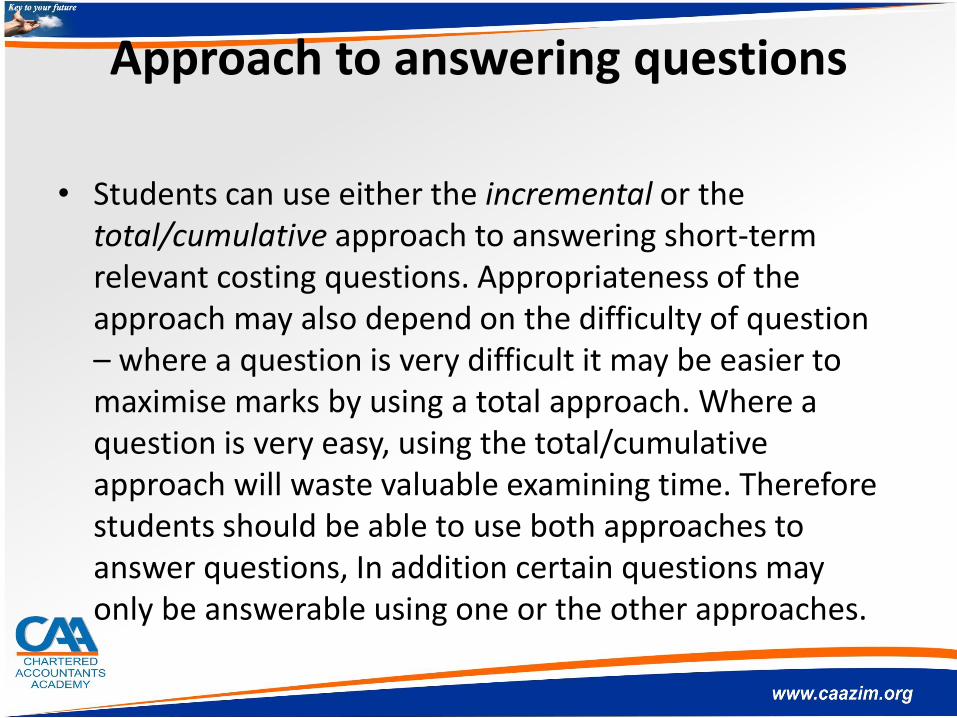
• Students can use either the incremental or the total/cumulative approach to answering short-term relevant costing questions. Appropriateness of the approach may also depend on the difficulty of question – where a question is very difficult it may be easier to maximise marks by using a total approach. Where a question is very easy, using the total/cumulative approach will waste valuable examining time. Therefore students should be able to use both approaches to answer questions, In addition certain questions may only be answerable using one or the other approaches.

Constraint Optimization

Standard Costing and Variance Analysis • Example – AA Airbus

Slide 25
Raw materials Mix and Yield Variances
• 3 Things before you can have a mix and yield variance:– More than one raw material input– There is an optimal mix of raw materials that minimises cost while still meeting the
quality standards– A change in mix affects the yield (normal loss).
Only arises when you use different amounts of the inputs compared to budget
• Mix variance = inputsA mix variance arises when the actual mix differs from the predetermined standard mix.
(AQ in budgeted proportions - AQ ) SP for each unit of input
• Yield variance = outputsA yield variance arises when the actual output differs from what should have come out the
process, based on what we put in.
(What should have come out the process - Actual production ) SP for each unit of output(Actual quantity*standard yield – actual yield)*SR (where SR is budgeted average
contribution per unit)Example: expect a 15% loss, if produce 1 000 000l, expect output of 850 000l

Slide 26
Example – adapted from example 19.23
• Standard ingredient of 1kg of product FDN is:– 0.65kg of F @ R4.00
– 0.3kg of D @ R6.00
– 0.2kg of N @ R2.50
1.15kg
• Budgeted production of product X is 4000 kg
• Actual production is 4200kg
• Actual material costs:– 2840kg of F
– 1210kg of D and Total used: 4910kg
– 860kg of N
– Total cost R20380
Standard proportions:
F = 57%D = 26%N = 17%

Slide 27
Raw materials Mix and Yield Variances: Example
Mix variance
A mix variance arises when the actual mix differs from the predetermined standard mix.
(AQ in budgeted proportions - AQ ) SP for each unit of input
Yield variance
A yield variance arises when the actual output differs from what should have come out the process, based on what we put in.
(What should have come out the process - Actual production ) SP
– ) x =
(AQ in budg prop - AQ)SP
F ( - 2840) £ 4.00
D ( - 1210) £ 6.00
N ( - 860) £ 2.50
4910 £ 150.87 F
2775.22
1280.87
853.91
4910
£ 259.13
£ 425.22
£ 15.22
F
A
A
£4.942004910kg x 1/1.15 = 4270kg
R340.87 A
£4*0.65kg+ £6*0.3kg+
£2.5*0.2kg
Slide 28
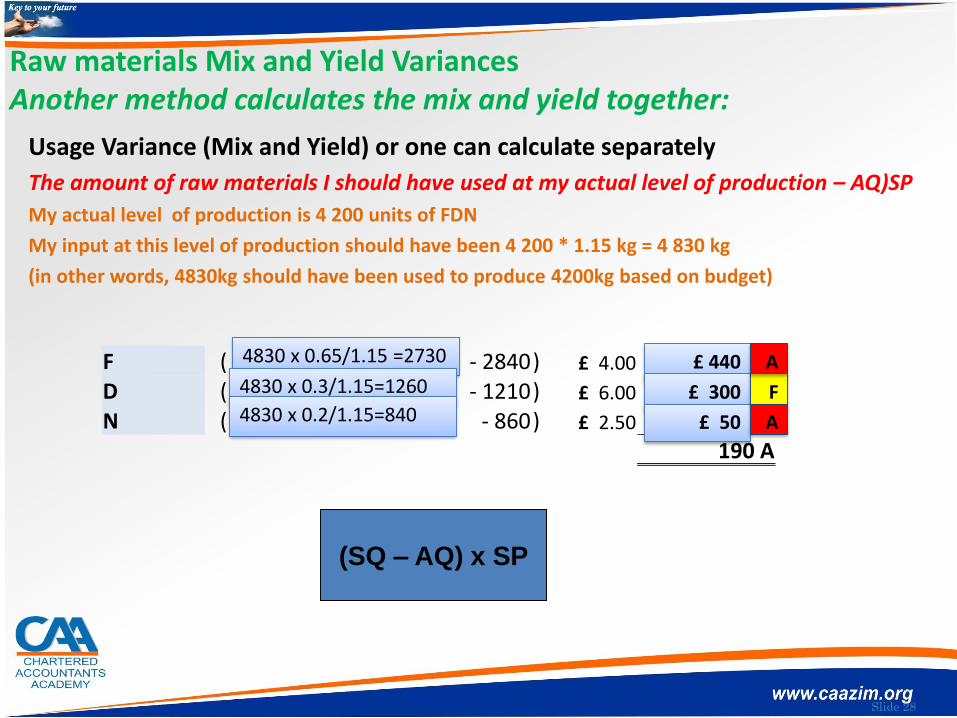
Raw materials Mix and Yield VariancesAnother method calculates the mix and yield together:
Usage Variance (Mix and Yield) or one can calculate separately
The amount of raw materials I should have used at my actual level of production – AQ)SP
My actual level of production is 4 200 units of FDN
My input at this level of production should have been 4 200 * 1.15 kg = 4 830 kg
(in other words, 4830kg should have been used to produce 4200kg based on budget)
F ( - 2840) £ 4.00
D ( - 1210) £ 6.00
N ( - 860) £ 2.50
190 A
4830 x 0.65/1.15 =2730
4830 x 0.3/1.15=1260
4830 x 0.2/1.15=840
£ 440
£ 300
£ 50
F
A
A
(SQ – AQ) x SP

Slide 29
Fixed Overhead Variances
Allocated FMC
Budgeted FMC
ActualFMC
SR = Budgeted FMCBudgeted allocation base
AP x SR BP x SRExpenditureVolume
Volume Efficiency
Variance
(SH- AH) x SR
Volume Capacity
Variance
(AH – BH) x SR
AHSH BH
SR = Budgeted FMCBP
(AP-BP) x SR
SR = Budgeted FMCBudgeted labour hours
F when absorb more than actual
F when actual exceeds budgeted,
otherwise indication failed to
use capacity

Slide 30
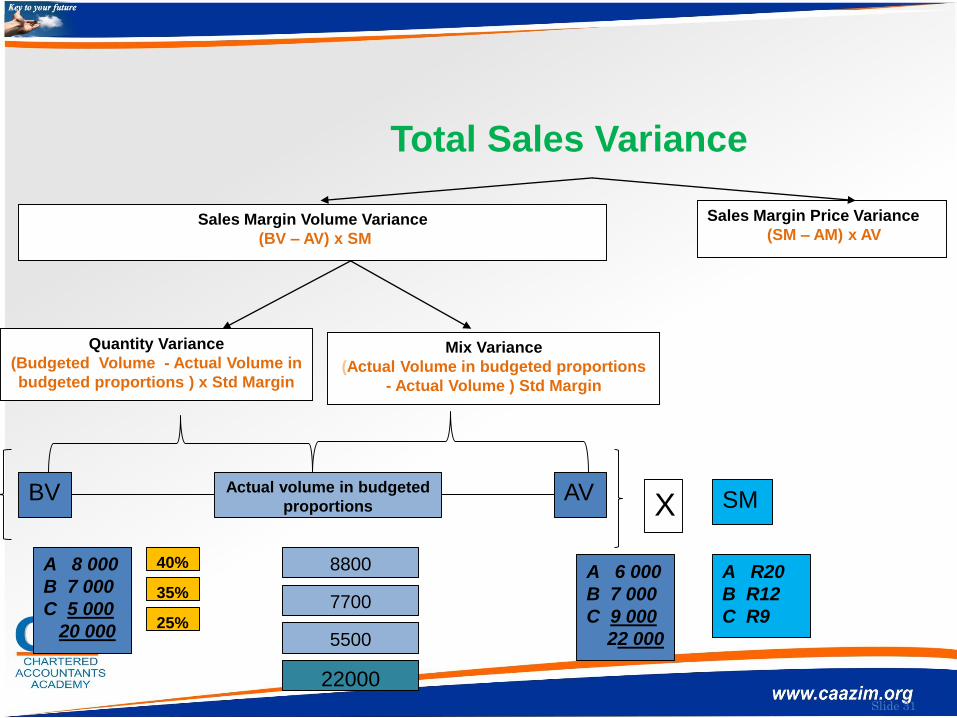
Sales mix and quantity variances
Where a company sells several different products that have different profit
margins, it is possible to divide the sales volume variance into a quantity and mix
variance.
Example:
Budgeted sales R
A = 8 000 units at R20 contribution = 160 000
B = 7 000 units at R12 contribution = 84 000
C = 5 000 units at R9 contribution = 45 000
20 000 289 000
Actual sales R
A = 6 000 units at R20 contribution = 120 000
B = 7 000 units at R12 contribution = 84 000
C = 9 000 units at R9 contribution = 81 000
22 000 285 000
Therefore, AQ*std %=A: 40% = 8 800B: 35% = 7 700C: 25% = 5 500
Slide 31
Sales Margin Price Variance
(SM – AM) x AVSales Margin Volume Variance
(BV – AV) x SM
Mix Variance
(Actual Volume in budgeted proportions
- Actual Volume ) Std Margin
Quantity Variance
(Budgeted Volume - Actual Volume in
budgeted proportions ) x Std Margin
Total Sales Variance
BV AVX SM
Actual volume in budgeted
proportions
A 6 000
B 7 000
C 9 000
22 000
A 8 000
B 7 000
C 5 000
20 000 5500
40%
35%
25%
7700
8800
22000
A R20
B R12
C R9

Slide 32
Sales Variances
Sales Volume Variance: (BV – AV )SM
A (8000 – 6000) 20 = 40 000A
B (7000 – 7000) 12 = 0
C (5000 – 9000) 9 = 36 000F
4 000A
Sales Mix Variance: = (AQ in budgeted proportions - AQ) × Standard margin
A (8 800 – 6 000 ) × R20 = R56 000 A
B (7 700 – 7 000 ) × R12 = R 8 400 A
C (5 500 – 9 000 ) × R9 = R31 500 F
22 000 22 000 R32 900 A
Quantity variance: = (BQ - AQ in budgeted proportions ) × SM
A (8 000 – 8 800) × R20 = R16 000 F
B (7 000 – 7 700) × R12 = R 8 400 F
C (5 000 – 5 500) × R9 = R 4 500 F
R28 900 F
Slide 33
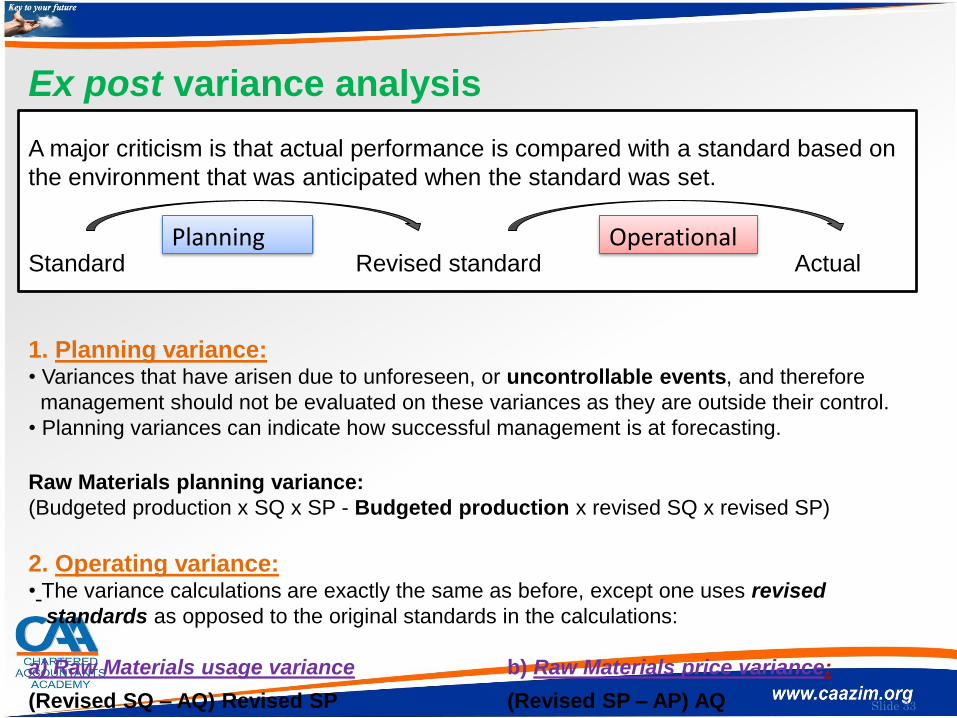
Ex post variance analysis
A major criticism is that actual performance is compared with a standard based on
the environment that was anticipated when the standard was set.
Standard Revised standard Actual
1. Planning variance: • Variances that have arisen due to unforeseen, or uncontrollable events, and therefore
management should not be evaluated on these variances as they are outside their control.
• Planning variances can indicate how successful management is at forecasting.
Raw Materials planning variance:
(Budgeted production x SQ x SP - Budgeted production x revised SQ x revised SP)
2. Operating variance:• The variance calculations are exactly the same as before, except one uses revised
standards as opposed to the original standards in the calculations:
a) Raw Materials usage variance b) Raw Materials price variance:
(Revised SQ – AQ) Revised SP (Revised SP – AP) AQ
Planning Operational
Slide 34
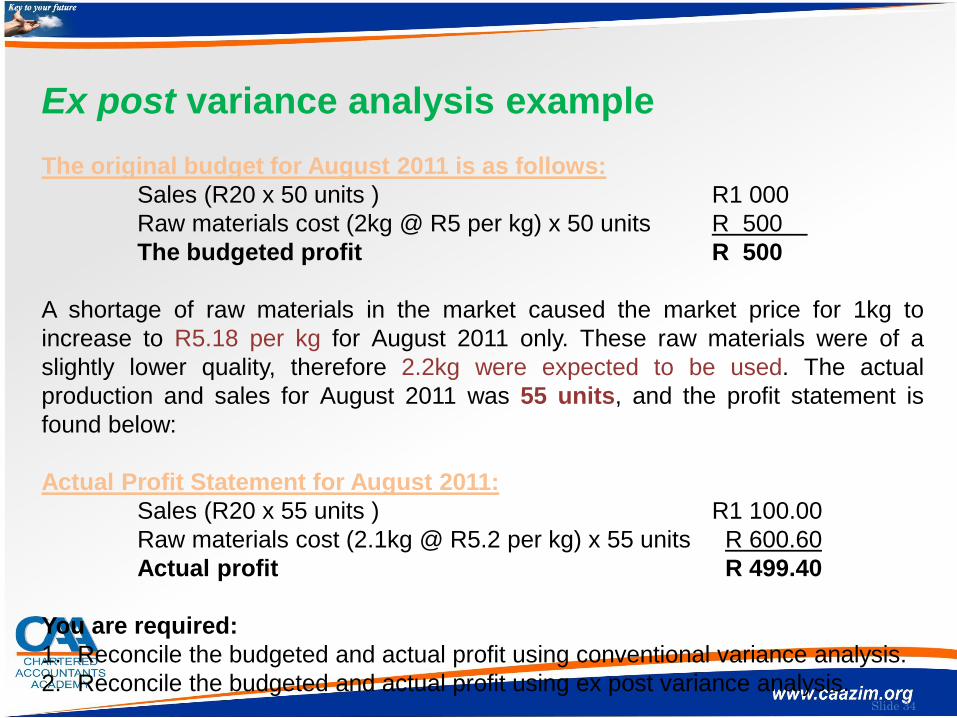
Ex post variance analysis example
The original budget for August 2011 is as follows:
Sales (R20 x 50 units ) R1 000
Raw materials cost (2kg @ R5 per kg) x 50 units R 500
The budgeted profit R 500
A shortage of raw materials in the market caused the market price for 1kg to
increase to R5.18 per kg for August 2011 only. These raw materials were of a
slightly lower quality, therefore 2.2kg were expected to be used. The actual
production and sales for August 2011 was 55 units, and the profit statement is
found below:
Actual Profit Statement for August 2011:
Sales (R20 x 55 units ) R1 100.00
Raw materials cost (2.1kg @ R5.2 per kg) x 55 units R 600.60
Actual profit R 499.40
You are required:
1. Reconcile the budgeted and actual profit using conventional variance analysis.
2. Reconcile the budgeted and actual profit using ex post variance analysis.
Slide 35
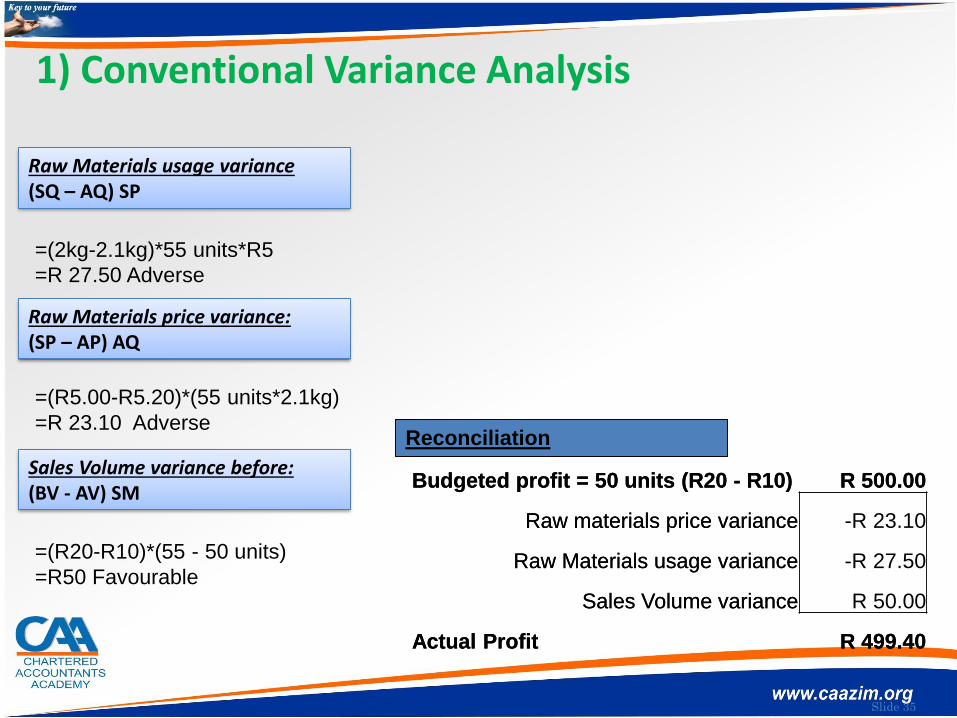
Raw Materials usage variance
(SQ – AQ) SP
=(2kg-2.1kg)*55 units*R5
=R 27.50 Adverse
Raw Materials price variance:
(SP – AP) AQ
=(R5.00-R5.20)*(55 units*2.1kg)
=R 23.10 Adverse
Sales Volume variance before:
(BV - AV) SM
=(R20-R10)*(55 - 50 units)
=R50 Favourable
Reconciliation
Budgeted profit = 50 units (R20 - R10) R 500.00
Raw materials price variance
Raw Materials usage variance
Sales Volume variance
Actual Profit R 499.40
1) Conventional Variance Analysis
Raw Materials usage variance(SQ – AQ) SP
Raw Materials price variance:(SP – AP) AQ
Sales Volume variance before:(BV - AV) SM
Reconciliation
Budgeted profit = 50 units (R20 - R10) R 500.00
Raw materials price variance -R 23.10
Raw Materials usage variance -R 27.50
Sales Volume variance R 50.00
Actual Profit R 499.40
Slide 36
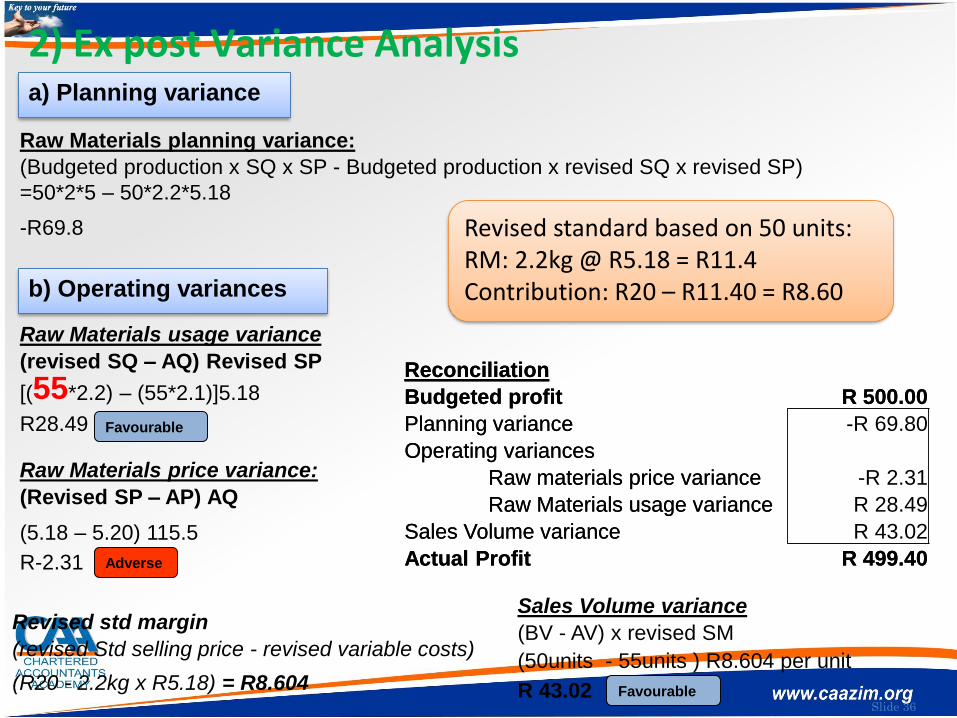
2) Ex post Variance Analysis
-R69.8
Raw Materials usage variance
(revised SQ – AQ) Revised SP
Raw Materials price variance:
(Revised SP – AP) AQ
Sales Volume variance
(BV - AV) x revised SM
Reconciliation
Budgeted profit R 500.00
Planning variance
Operating variances
Raw materials price variance
Raw Materials usage variance
Sales Volume variance
Actual Profit R 499.40
(R20 - 2.2kg x R5.18) = R8.604
b) Operating variances
a) Planning variance
Raw Materials planning variance:
(Budgeted production x SQ x SP - Budgeted production x revised SQ x revised SP)
=50*2*5 – 50*2.2*5.18
[(55*2.2) – (55*2.1)]5.18
R28.49
Adverse
(5.18 – 5.20) 115.5
R-2.31
(50units - 55units ) R8.604 per unit
R 43.02
Revised std margin
(revised Std selling price - revised variable costs)
Favourable
Reconciliation
Budgeted profit R 500.00
Planning variance -R 69.80
Operating variances
Raw materials price variance -R 2.31
Raw Materials usage variance R 28.49
Sales Volume variance R 43.02
Actual Profit R 499.40
Favourable
Revised standard based on 50 units:RM: 2.2kg @ R5.18 = R11.4Contribution: R20 – R11.40 = R8.60
Slide 37
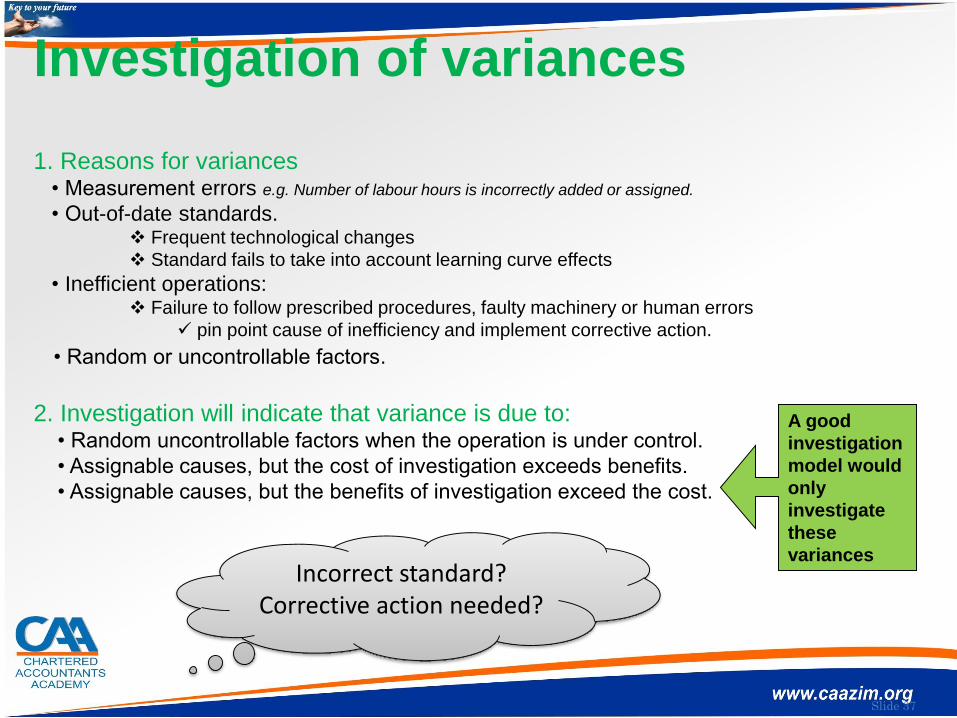
Investigation of variances
1. Reasons for variances• Measurement errors e.g. Number of labour hours is incorrectly added or assigned.
• Out-of-date standards. Frequent technological changes
Standard fails to take into account learning curve effects
• Inefficient operations: Failure to follow prescribed procedures, faulty machinery or human errors
pin point cause of inefficiency and implement corrective action.
• Random or uncontrollable factors.
2. Investigation will indicate that variance is due to:• Random uncontrollable factors when the operation is under control.
• Assignable causes, but the cost of investigation exceeds benefits.
• Assignable causes, but the benefits of investigation exceed the cost.
A good
investigation
model would
only
investigate
these
variancesIncorrect standard?
Corrective action needed?

Slide 38
Paper 2 Q 2
Key areas examined
• (a) Budgeting
• (b) Break even
• (c) Variance analysis
• (d) NPV & IRR calculations
• (e) Risk identification & discussion
• 2 presentation marks were available for this paper. These marks were clearly and separately stated in the ‘required’ sections of each question.
Slide 39
In what respect candidates’ answers are considered to fall short of requirements.
• In part (c) a number of candidates were not explicit with identifying variances that could be calculated and therefore did not adequately address the required.
• A number of candidate‟s answers in part (e) were vague and did not adequately describe the risks that they had identified.

Slide 40
Common mistakes made by candidates
• In general examination technique were lacking as was evident from the following: • - Many candidates did not read and consider the information in the scenario carefully, or
applied it in answering the question. • - A number of candidates failed to provide the answer in a memorandum format (as was
specifically required), or provided memorandums which rather resembled a letter or an email.
• - Many candidates did not present their answer in a logical way; they did not link the key business risks to the mitigating actionsThe most common mistake in part (a) was the ommision of the 20% share of revenue that was deducted by Ubex.
• - In part (b), most candidates did not treat the tyres and service and maintenance costs as stepped costs that would only be incurred every 25 000 kilometres (for tyre costs) and every 25 000 kilometers after the 50 000 kilometre service plan had expired (for the service costs).
• - The most common mistake in part (d) was candidates failing to realise that the revenue generated and costs incurred by the partnership were irrelevant to the NPV and IRR calculations as the only income attributable to Mr Umkahi was his fixed profit share and the costs incurred by Mr Umkahi were recovered from the partnership. In addition, many of the candidates who followed the alternative approach incorrectly ommited the recovery of the loan repayments from the partnership. Some candidates who calculated after tax cashflowsincorrectly used a pre-tax discount rate in calculating the NPV.


