TRADE IMPACT FOR GOOD ITC WORKING PAPER SERIES DO WE NEED DEEPER TRADE AGREEMENTS FOR GVCS OR JUST A BIT? WP-02-2017.E October 2017 Mauro Boffa International Trade Centre, Geneva Marion Jansen International Trade Centre, Geneva Olga Solleder International Trade Centre, Geneva Disclaimer Views expressed in this paper are those of the authors and do not necessarily coincide with those of ITC, UN or WTO. The designations employed and the presentation of material in this paper do not imply the expression of any opinion whatsoever on the part of the International Trade Centre or the World Trade Organization concerning the legal status of any country, territory, city or area or of its authorities, or concerning the delimitation of its frontiers or boundaries. Mention of firms, products and product brands does not imply the endorsement of ITC or the WTO. This is a working paper, and hence it represents research in progress and is published to elicit comments and keep further debate.
Transcript
TRADE IMPACTFOR GOOD
ITC WORKING PAPER SERIES
DO WE NEED DEEPER TRADE AGREEMENTS FOR GVCS OR JUST A BIT?
WP-02-2017.E
October 2017
Mauro BoffaInternational Trade Centre, Geneva
Marion Jansen International Trade Centre, Geneva
Olga SollederInternational Trade Centre, Geneva
Disclaimer
Views expressed in this paper are those of the authors and do not necessarily coincide with those of ITC, UN or WTO. The designations employed and the presentation of material in this paper do not imply the expression of any opinion whatsoever on the part of the International Trade Centre or the World Trade Organization concerning the legal status of any country, territory, city or area or of its authorities, or concerning the delimitation of its frontiers or boundaries. Mention of firms, products and product brands does not imply the endorsement of ITC or the WTO. This is a working paper, and hence it represents research in progress and is published to elicit comments and keep further debate.
DO WE NEED DEEPER TRADE AGREEMENTS FOR GVCS OR JUST A BIT?
October 2017
Mauro Boffa, Marion Jansen, Olga Solleder, International Trade Centre, Switzerland
Disclaimer
Views expressed in this paper are those of the authors and do not necessarily coincide with those of ITC, UN or WTO. The designations employed and the presentation of material in this paper do not imply the expression of any opinion whatsoever on the part of the International Trade Centre or the World Trade Organization concerning the legal status of any country, territory, city or area or of its authorities, or concerning the delimitation of its frontiers or boundaries. Mention of firms, products and product brands does not imply the endorsement of ITC or the WTO. This is a working paper, and hence it represents research in progress and is published to elicit comments and keep further debate.
DO WE NEED DEEPER TRADE AGREEMENTS FOR GVCS OR JUST A BIT?
ii WP-02-2017.E
DO WE NEED DEEPER TRADE AGREEMENTS FOR GVCS OR JUST A BIT?
Mauro Boffa
International Trade Centre
Marion Jansen
International Trade Centre
Olga Solleder
International Trade Centre
October 20171
Abstract
The paper looks at the role of two policies geared toward stimulating and shaping Global Value Chains (GVCs), namely deep Regional Trade Agreements (RTAs) and Bilateral Investment Treaties (BITs). In an augmented gravity model, we test the impact of both policies on a variety of trade in value-added indicators. We find that both policies are likely to increase GVC trade, although their transmission channels differ. While backward linkages are stimulated through both BITs and deep RTAs, forward linkages respond only to deep RTAs.
1 We thank, without engaging them, Ben Shepard, Loe Franssen, Valentina Rollo and participants at the ETSG 2017 conference in Florence for their comments and suggestions.
ITC WORKING PAPER SERIES
Introduction
North-South trade in parts and components results from the reorganization of supply chains between countries (R. Baldwin & Lopez-Gonzalez, 2015). As trade costs fell, and the digital revolution allowed for better monitoring, firms reorganized their production structures. The ensuing paradigm is a production chain that is fragmented across borders aimed to exploit lower costs of factors of production. The mix between flows of know-how and capital between high income countries and low income economies is known as Global Value Chains (GVCs) (R. E. Baldwin, 2016).
For low income countries, one of the benefits of participating in GVCs is the favorable structural transformation push generated by the technological cooperation with high income economies. The restructuration results in reallocating labor to higher value-added activities, which in turn increase real wages for the local workforce. From an economic development perspective, it is important to ask what trade policies might help firms in developing countries to participate into GVC trade.
Trade in GVCs obeys to different contractual settings than trade in final goods. For example, firms deciding to outsource production processes might opt for foreign ownership (Taglioni & Winkler, 2016). However, an unknown foreign legal apparatus could worry the firms about the safety of their investment. If in contrast firms look for technical cooperation, they need to ensure that their intellectual property is respected and that violations are well punishable (Antràs, 2005). Both Regional Trade Agreements (RTAs) - including investment provisions and intellectual property provisions - and Bilateral Investment Treaties (BITs) play a role in reducing legal uncertainties and homogenizing procedures.
From their inception, BITs have been designed for protecting investment from developed countries into developing countries (Vandevelde, 2005). BITs where handed to developing countries mostly as a template with little room to negotiate, where the burden of enforcement was on them because they are, most often, net receivers of Foreign Direct Investment. The negotiation framework is different in the case of deep RTAs, as the payoff of the deal hinges on both investment and trade.
The paper examines the two policies in a common framework. The goal is to highlight the different channels though which trade in GVCs benefits from RTAs and BITs. We define trade in GVCs along two dimensions, using the standard GVC decomposition of value added in gross exports (Johnson & Noguera, 2012; Koopman, Wang, & Wei, 2014; Wang, Wei, Yu, & Zhu, 2017a). In particular, we focus on the bilateral level, and we seprate between GVC integration as a “buyer” and as a “seller” of value-added. Subsequently, we focus on asymmetric deals, splitting the effect of the trade policy according to the development level of the countries.
We find that the policies have two types of heterogeneous effects. First, both deep RTAs and BITs appear to have an effect on the bilateral foreign content of exports. Therefore, both policies affect backward linkages. Second, we do not find any of BITs on forward linkages. The ratification of a BIT does not increase the domestic value added in intermediates re-exported. In contrast, deep trade agreements play a role in this front too. Concerning North-South and South-South agreements, we find that a stronger effect on foreign value added for BITs than RTAs.
To test the impact of deep trade agreements on Global Value Chains we make use of three databases. First, we compute measures of integration into GVCs from the EORA input-output tables. The measures are based on the standard value-added decomposition that decomposes gross exports into domestic value added and foreign value added and various double counted items. We do that with the techniques introduced by (Wang et al., 2017a) and implemented by (Quast & Kummritz, n.d.). We gather the information on deep agreements from the World Bank Content of Preferential Trade Agreements database (Hofmann, Osnago, & Ruta, 2017). Lastly, we use the UNCTAD database on bilateral investment treaties (UNCTAD, 2009).
The paper contributes to an increasingly prolific strand of literature. We contribute to studies on the effect of deep trade agreements on international trade (Kohl, Brakman, & Garretsen, 2016; Limão, 2016; Mulabdic, Osnago, & Ruta, 2017; Osnago, Rocha, & Ruta, 2015, 2016) by extending the analysis to key GVC indicators and by doing a horse race between deep RTAs and BITs.
The remainder of the paper is structured as follows. Section 1 presents the data of our empirical analysis. Section 2 shows the econometric specification. Section 3 and 4 discuss the results. Section 5 concludes.
DO WE NEED DEEPER TRADE AGREEMENTS FOR GVCS OR JUST A BIT?
4 WP-02-2017.E
1. Data Description
We carry out our econometric analysis using three major main sources. First, we use the EORA multi-regional input-output tables (Lenzen, Moran, Kanemoto, & Geschke, 2013), the World Bank database on the Content of RTAs (Hofmann et al., 2017) and the UNCTAD database on Bilateral Investment Treaties (UNCTAD, 2009).
The input-output tables from EORA have the advantage of providing the greatest country coverage available for this type of data. They cover intra and inter-industry trade flows for 26 industries and 189 economies. In contrast to other multi-regional input-output tables, EORA covers many developing countries. However, such a large coverage comes at a cost. For countries where national input-output tables are not available, they are imputed from countries with similar economic characteristics. In spite of this caveat, they are the only tables with enough reportage to make some inference on developing countries. We apply to the EORA tables the algorithm from Quast & Kummritz, (2015) to extract the bilateral trade in value added indicators presented by (Wang, Wei, Yu, & Zhu, 2017; Wang, Wei, & Zhu, 2013).2 We end up with four indicators of forward and backward GVC integration. For the rest of the analysis we focus mainly on four outcome variables, described in Table 1.
Table 1. Key GVC variables
Variable name Variable Description Interpretation
MVA
Foreign value added in final and intermediate goods exports sourced from direct importer
Integration as a "buyer" of value added from the direct partner
DVA_INTrex Domestic value added in intermediate exports re-exported to third countries
Integration as a "seller" of value added via the direct partner
EXP_INT Exports of intermediate goods absorbed by the direct importer
In gross terms, this is trade in parts and components, and indicator of “seller” GVC trade
FVA Foreign value added in final and intermediate goods exports
Integration as a "buyer" of value added form all partners across the world
Note: Variables extracted form EORA multi-regional input-output tables using the R statistical package decompr from
Quast and Kummritz (2015). We compute the variables according to the procedure in developed by Wang, Wei, Yu and Zhu (2017).
2 See the appendix for a detailed explanation on the methodology.
ITC WORKING PAPER SERIES
The network of value-added in 2013 according to the GVC indicators consists of three main hubs (Figure 1): Germany, the United States and China. In addition, some countries such as Korea, Japan, France, Great Britain and Italy are also big players. The observation is consistent with the findings of Taglioni & Winkler, (2016) using the OECD Trade in Value-added (TiVA) database. Overall, the image shows that there are similar patterns in the EORA and TiVA databases.
Figure 1 Network of vertical trade
Note: Included are all the 179 country pairs in out estimation sample. The size of the arrows is proportional to the amount
of vertical trade. Vertical trade is the sum between domestic value-added re-exported and foreign content of exports. We plot flows that are at least 1% as large as the largest flow. Source: ITC based on EORA multi-regional input-output tables.
The second source of information is the database put together by the World Bank on the content of deep trade agreements (Hofmann et al., 2017). The database shows the provisions of 261 agreements in 189 countries.3 The provisions are arranged in 52 areas and classified according to their legal enforceability. As already pointed out by the authors there has been a surge in regional trade agreements over time (Figure 2).
3 We exclude all the partial scope agreements from the analysis, which reduced the number of agreements considered from 279 to 261.
DO WE NEED DEEPER TRADE AGREEMENTS FOR GVCS OR JUST A BIT?
6 WP-02-2017.E
Figure 2. Proliferation of RTAs
Source: World Bank Content of Deep Trade Agreements Database (Hofmann et al., 2017). In the figure, we include all the
agreements still in force in 2015.
In Figure 3, we show the type of provisions in the database separated in areas the fall under the WTO mandate (WTO-plus) and areas that go beyond the WTO mandate (WTO-extra). One can notice that WTO-extra provisions are far from common. 40 % of the agreements in the sample cover investment issues, which justifies looking at RTAs by their composition when comparing them to BITs. We also notice that the on average customs unions and economic integrated unions cover more provisions than most free trade agreements (Figure 4).
Figure 3. Content of RTAs
“Deeper-than-WTO” (WTO plus)
“Beyond-WTO”(WTO-extra)
Note: Included are all the 261 agreements still in force in 2015. Averages are by agreement. Only legally enforceable
provisions are plotted. Source: ITC based on World Bank. Content of Deep Trade Agreements; Hoffman, Osnago and Ruta (2017).
ITC WORKING PAPER SERIES
Figure 4. Type of Agreement and Number of Provisions
Note: Included are all the agreements still in force in 2015. FTA stands for Free Trade Agreement, EIA for Economic
Integrated Area, CU for Customs Union. Source: ITC based on World Bank. Content of Deep Trade Agreements; Hoffman, Osnago and Ruta (2017).
The web of trade agreements is also very interesting, as countries and regions with high value-chain activity are also well integrated in terms of the number of policy areas covered (Figure 5). The European Union countries are the most integrated with respect to that. Korea, Peru, Mexico and Chile also have on average agreements that cover more policy areas than the average.
Figure 5 Network of deep trade agreements
Note: Included are all the 261 agreements still in force in 2015. Averages are by agreement. Only policy areas with
legally enforceable provisions are plotted.
DO WE NEED DEEPER TRADE AGREEMENTS FOR GVCS OR JUST A BIT?
8 WP-02-2017.E
Source: ITC based on World Bank. Content of Deep Trade Agreements; Hoffman, Osnago and Ruta (2017).
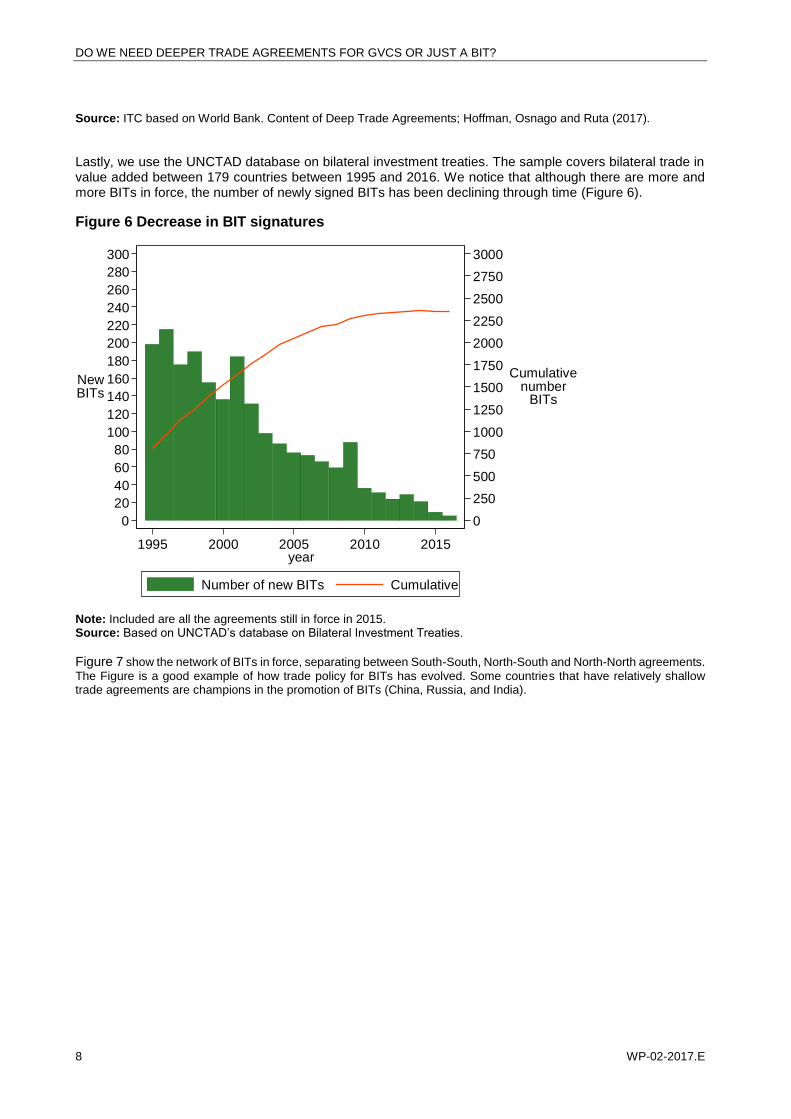
Lastly, we use the UNCTAD database on bilateral investment treaties. The sample covers bilateral trade in value added between 179 countries between 1995 and 2016. We notice that although there are more and more BITs in force, the number of newly signed BITs has been declining through time (Figure 6).
Figure 6 Decrease in BIT signatures
Note: Included are all the agreements still in force in 2015. Source: Based on UNCTAD’s database on Bilateral Investment Treaties.
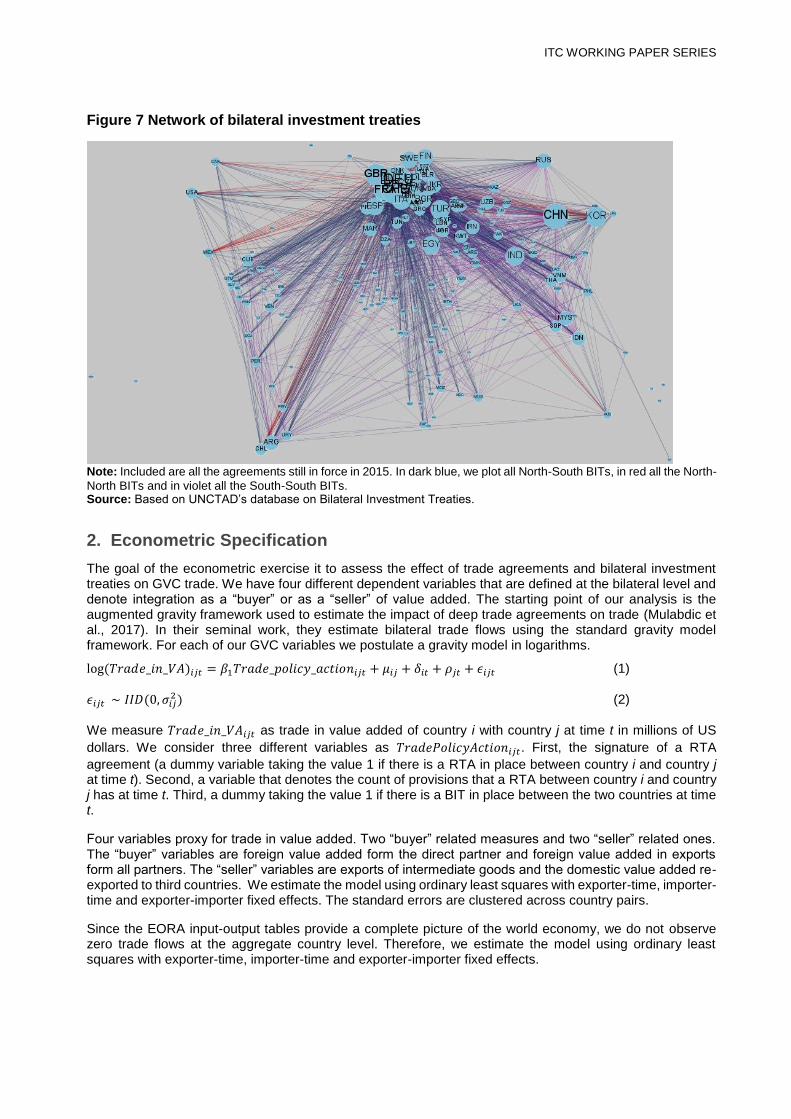
Figure 7 show the network of BITs in force, separating between South-South, North-South and North-North agreements.
The Figure is a good example of how trade policy for BITs has evolved. Some countries that have relatively shallow trade agreements are champions in the promotion of BITs (China, Russia, and India).
0
250
500
750
1000
1250
1500
1750
2000
2250
2500
2750
3000
Cumulativenumber
BITs
0
20
40
60
80
100
120
140
160
180
200
220
240
260
280
300
NewBITs
1995 2000 2005 2010 2015year
Number of new BITs Cumulative
ITC WORKING PAPER SERIES
Figure 7 Network of bilateral investment treaties
Note: Included are all the agreements still in force in 2015. In dark blue, we plot all North-South BITs, in red all the North-
North BITs and in violet all the South-South BITs. Source: Based on UNCTAD’s database on Bilateral Investment Treaties.
2. Econometric Specification
The goal of the econometric exercise it to assess the effect of trade agreements and bilateral investment treaties on GVC trade. We have four different dependent variables that are defined at the bilateral level and denote integration as a “buyer” or as a “seller” of value added. The starting point of our analysis is the augmented gravity framework used to estimate the impact of deep trade agreements on trade (Mulabdic et al., 2017). In their seminal work, they estimate bilateral trade flows using the standard gravity model framework. For each of our GVC variables we postulate a gravity model in logarithms.
We measure 𝑇𝑟𝑎𝑑𝑒_𝑖𝑛_𝑉𝐴𝑖𝑗𝑡 as trade in value added of country i with country j at time t in millions of US
dollars. We consider three different variables as 𝑇𝑟𝑎𝑑𝑒𝑃𝑜𝑙𝑖𝑐𝑦𝐴𝑐𝑡𝑖𝑜𝑛𝑖𝑗𝑡. First, the signature of a RTA
agreement (a dummy variable taking the value 1 if there is a RTA in place between country i and country j at time t). Second, a variable that denotes the count of provisions that a RTA between country i and country j has at time t. Third, a dummy taking the value 1 if there is a BIT in place between the two countries at time t.
Four variables proxy for trade in value added. Two “buyer” related measures and two “seller” related ones. The “buyer” variables are foreign value added form the direct partner and foreign value added in exports form all partners. The “seller” variables are exports of intermediate goods and the domestic value added re-exported to third countries. We estimate the model using ordinary least squares with exporter-time, importer-time and exporter-importer fixed effects. The standard errors are clustered across country pairs.
Since the EORA input-output tables provide a complete picture of the world economy, we do not observe zero trade flows at the aggregate country level. Therefore, we estimate the model using ordinary least squares with exporter-time, importer-time and exporter-importer fixed effects.
DO WE NEED DEEPER TRADE AGREEMENTS FOR GVCS OR JUST A BIT?
10 WP-02-2017.E
3. Results
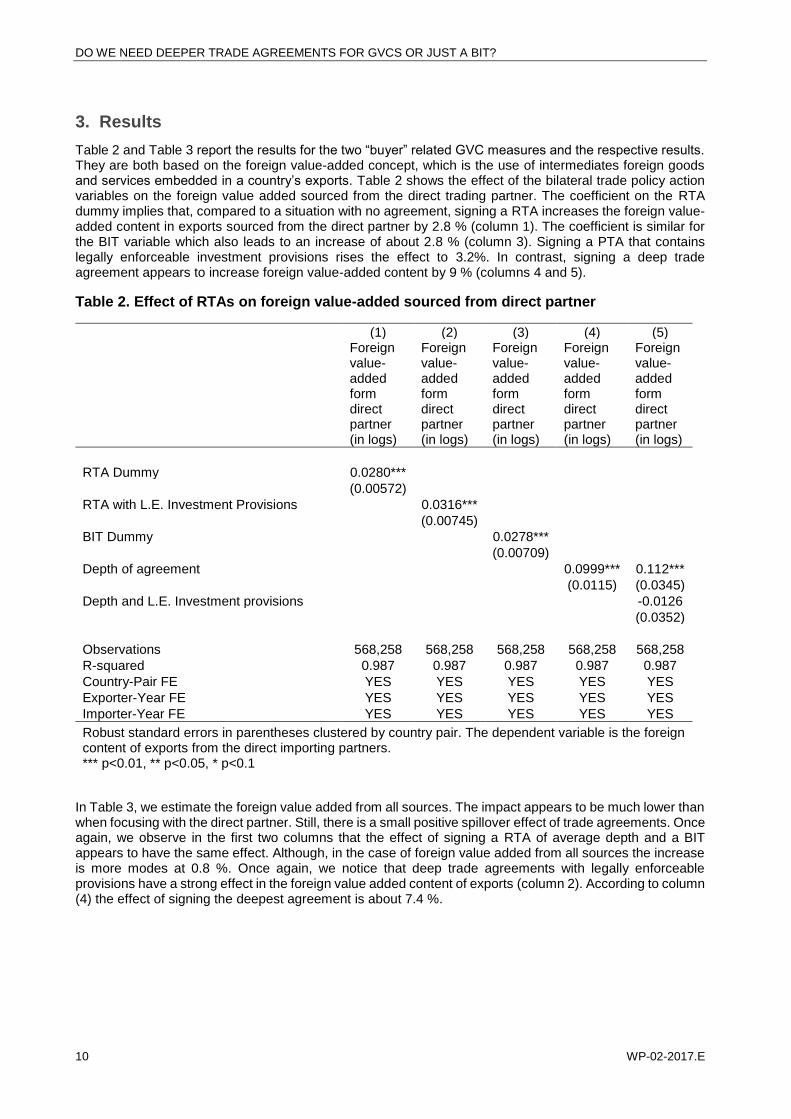
Table 2 and Table 3 report the results for the two “buyer” related GVC measures and the respective results. They are both based on the foreign value-added concept, which is the use of intermediates foreign goods and services embedded in a country’s exports. Table 2 shows the effect of the bilateral trade policy action variables on the foreign value added sourced from the direct trading partner. The coefficient on the RTA dummy implies that, compared to a situation with no agreement, signing a RTA increases the foreign value-added content in exports sourced from the direct partner by 2.8 % (column 1). The coefficient is similar for the BIT variable which also leads to an increase of about 2.8 % (column 3). Signing a PTA that contains legally enforceable investment provisions rises the effect to 3.2%. In contrast, signing a deep trade agreement appears to increase foreign value-added content by 9 % (columns 4 and 5).
Table 2. Effect of RTAs on foreign value-added sourced from direct partner
(1) (2) (3) (4) (5)
Foreign value-added form direct partner (in logs)
Foreign value-added form direct partner (in logs)
Foreign value-added form direct partner (in logs)
Foreign value-added form direct partner (in logs)
Foreign value-added form direct partner (in logs)
RTA Dummy 0.0280***
(0.00572) RTA with L.E. Investment Provisions 0.0316***
Robust standard errors in parentheses clustered by country pair. The dependent variable is the foreign content of exports from the direct importing partners. *** p<0.01, ** p<0.05, * p<0.1
In Table 3, we estimate the foreign value added from all sources. The impact appears to be much lower than when focusing with the direct partner. Still, there is a small positive spillover effect of trade agreements. Once again, we observe in the first two columns that the effect of signing a RTA of average depth and a BIT appears to have the same effect. Although, in the case of foreign value added from all sources the increase is more modes at 0.8 %. Once again, we notice that deep trade agreements with legally enforceable provisions have a strong effect in the foreign value added content of exports (column 2). According to column (4) the effect of signing the deepest agreement is about 7.4 %.
ITC WORKING PAPER SERIES
Table 3. Effect of RTAs on foreign value-added
(1) (2) (3) (4) (5)
VARIABLES
Foreign value added in exports (in logs)
Foreign value added in exports (in logs)
Foreign value added in exports (in logs)
Foreign value added in exports (in logs)
Foreign value added in exports (in logs)
RTA Dummy 0.00847*
(0.00441) RTA with L.E. Investment Provisions 0.0233***
Robust standard errors in parentheses *** p<0.01, ** p<0.05, * p<0.1
In Table 4 and Table 5, we report the seller related measures. As expected, there is only a modest increase and BITs appear to have no effect in value added that is re-exported by the direct partner. In Table 4, we evaluate by how much the policy action increases domestic value-added re-exported to third countries. We find that the impact for an average RTA is to increase the domestic value-added re-exported to third countries by 1.3% (column 1). If the agreement contains legally enforceable investment provisions, the effect increases to 2% (column 2). Once again, signing the deepest agreement in the sample has a strong effect, with an increase of 6.8%. The BITs do not have any effect in this type of flows.
Table 4. Effect of Trade Agreements on domestic value added re-exported to third countries
(1) (2) (3) (4) (5)
Domestic Value Added re-exported (in logs)
Domestic Value Added re-exported (in logs)
Domestic Value Added re-exported (in logs)
Domestic Value Added re-exported (in logs)
Domestic Value Added re-exported (in logs)
RTA Dummy 0.0132***
(0.00410) RTA with L.E. Investment Provisions 0.0195***
(0.00551) BIT Dummy 7.65e-05
(0.00489)
DO WE NEED DEEPER TRADE AGREEMENTS FOR GVCS OR JUST A BIT?
12 WP-02-2017.E
Depth of agreement 0.0684*** 0.0361
(0.00874) (0.0243) Depth of agreement with investment provision 0.0350
Robust standard errors in parentheses *** p<0.01, ** p<0.05, * p<0.1
The summarized findings of all estimation tables in this section are streamlined in Table 6. We notice that the strongest effect of trade agreements is to strengthen backward linkages with the direct partner. Deep agreements have an effect that is at least 3 times as large the one of an average BIT.
ITC WORKING PAPER SERIES
Table 6. Summary of findings, RTAs and GVC trade
Trade Policy Action
Increase in Foreign Value Added from partner
Increase in Foreign Value Added in exports
Increase in Intermediate Goods' Exports to partner
Increase in Domestic Value Added re-exported by partner
RTA signature, average depth 2.8% 0.80% 1% 1.3%
Deep trade Agreement 9.9% 7.4% 7.6% 6.8%
BIT ratification 2.8% 0.80% Not significant Not significant
Estimates from gravity model. GVC indicators using Wang, Wei, Yu and Zhu (2017) decomposition implemented by Quast and Kummritz (2015)
4. Results on North-South RTAs and BITs
In this section, we attempt to estimate if the effect of trade agreements and bilateral investment treaties is greater for North-South than for North-North and South-South agreements. The intuition would be that since institutions are different in the south, a deep trade agreement might reduce policy uncertainty of firms’ in the North willing to develop GVC trade with countries in the South. We compute the effect by interacting the BIT and the deep trade agreements variables with a dummy that indicates the importer and exporter development groups. We proxy the North by OECD membership. Non-OECD countries are considered as part of the South.
In Table 7, we separate the effects of deep trade agreements and BITs whenever the trading partners belong to different income groups. We find that the effect of deep trade agreements is greater between South-South and North-North partnerships for direct backward linkages in gross exports. BITs sill appear to play a role but only in North-North and North-South trade relationships. The effect of deep trade agreements is of 17 % for North-North
Table 7. BITs, RTAs and North-South GVCs, effect on value-added sourced from direct partner
(1) (2) (3)
Explanatory Variables
Foreign value-added form direct partner (in logs)
Foreign value-added form direct partner (in logs)
Foreign value-added form direct partner (in logs)
BIT North-North 0.0822***
0.0597***
(0.0184)
(0.0164)
BIT South-South 0.00474
0.00277
(0.0123)
(0.0123)
DO WE NEED DEEPER TRADE AGREEMENTS FOR GVCS OR JUST A BIT?
14 WP-02-2017.E
BIT North-South 0.0352***
0.0393***
(0.00920)
(0.00923)
Deep Agreement North-North
0.159*** 0.160***
(0.0154) (0.0154)
Deep Agreement South-South
0.0963*** 0.0962***
(0.0339) (0.0339)
Deep Agreement North-South
0.0504*** 0.0459***
(0.0163) (0.0163)
Observations 568,258 568,258 568,258
R-squared 0.987 0.987 0.987
Country-Pair FE YES YES YES
Exporter-Year FE YES YES YES
Importer-Year FE YES YES YES
Estimates from gravity model. GVC indicators using Wang, Wei, Yu and Zhu (2017) decomposition implemented by Quast and Kummritz (2015). Robust standard errors clustered by country pair.
*** p<0.01, ** p<0.05, * p<0.1
In Table 8, we notice that the effect is smaller for forward linkages than for backward linkages. In particular, we do not notice any effect for both deep trade agreements and BITs in South-South domestic value added re-exported to third countries. Once a deep trade agreement is in place, we do not notice any effect from BITs. In column (3) we estimate the effect of North-South trade agreements to increase direct forward linkages of about 3 %. North-North deep agreements appear to have a stronger effect at 14 %.
Table 8. BITs, RTAs and North-South GVCs, effect on domestic value-added re-exported by the partner
(1) (2) (3)
Explanatory Variables
Domestic Value Added re-exported (in logs)
Domestic Value Added re-exported (in logs)
Domestic Value Added re-exported (in logs)
BIT North-North 0.0331**
0.0140
(0.0132)
(0.0117)
BIT South-South -0.00595
-0.00655
(0.00822)
(0.00823)
ITC WORKING PAPER SERIES
BIT North-South -0.000219
0.00351
(0.00650)
(0.00650)
Deep Agreement North-North
0.135*** 0.135***
(0.0122) (0.0123)
Deep Agreement South-South
-0.00150 -0.000487
(0.0232) (0.0232)
Deep Agreement North-South
0.0260** 0.0255**
(0.0122) (0.0122)
Observations 567,768 567,768 567,768
R-squared 0.965 0.965 0.965
Country-Pair FE YES YES YES
Exporter-Year FE YES YES YES
Importer-Year FE YES YES YES
Estimates from gravity model. GVC indicators using Wang, Wei, Yu and Zhu (2017) decomposition implemented by Quast and Kummritz (2015). Robust standard errors clustered by country pair.
*** p<0.01, ** p<0.05, * p<0.1
5. Conclusion
The proliferation of RTAs is nothing new. Nowadays, the contents of regional trade agreements go beyond provisions traditionally regulated by the WTO. A growing percentage of new agreements deals with investment, government procurement and competition policy (R. E. Baldwin, 2011). In the paper, we find that for GVC, deep RTAs have a greater effect than standalone shallow RTAs and BITs. The role of investment provisions seems to be particularly important. This could explain the slowdown on signatures of BITs in favor of more comprehensive trade deals.
The comparison between BITs and deep RTAs reveals different patterns that appears to offer different policy strategies for countries. Both BITs and deep RTAs appear to increase GVC trade. However, BITs act only on backward linkages and hence on the use of foreign inputs. Instead deep trade agreements act along the two dimensions of GVC integration.
From the current political landscape, we may appreciate a revival of mercantilist policies. In such context, negotiations of deeper regional integration might face temporary setbacks. BITs exhibit a lower political cost in negotiations because of their narrower coverage. In the present paper, we attempt to show that this more contained policy can also yield substantial gains, which may fit the bill of the current political landscape.
DO WE NEED DEEPER TRADE AGREEMENTS FOR GVCS OR JUST A BIT?
16 WP-02-2017.E
References
Antràs, P. (2005). Property Rights and the International Organization of Production. American Economic
Review, 2(95), 25.
Baldwin, R. E. (2011). 21st Century Regionalism: Filling the gap between 21st century trade and 20th century
trade rules. WTO Staff Working Paper, No. ERSD-2011-08. Retrieved from
www.hdl.handle.net/10419/57613
Baldwin, R. E. (2016). The Great Convergence: Information Technology and the New Globalization. Harvard
University Press.
Baldwin, R., & Lopez-Gonzalez, J. (2015). Supply-chain Trade: A Portrait of Global Patterns and Several
Testable Hypotheses. The World Economy, 38(11), 1682–1721.
Hofmann, C., Osnago, A., & Ruta, M. (2017). Horizontal depth: a new database on the content of preferential
trade agreements. World Bank Policy Research Working Paper 7981. Retrieved from
Taglioni, D., & Winkler, D. (2016). Making Global Value Chains Work for Development. The World Bank.
https://doi.org/10.1596/978-1-4648-0157-0
UNCTAD (Ed.). (2009). The role of international investment agreements in attracting foreign direct
investment to developing countries. New York, NY: United Nations.
Vandevelde, K. J. (2005). A brief history of international investment agreements. UC Davis J. Int’l L. & Pol’y,
12, 157.
Wang, Z., Wei, S.-J., Yu, X., & Zhu, K. (2017). Measures of Participation in Global Value Chains and Global
Business Cycles. National Bureau of Economic Research. Retrieved from
www.nber.org/papers/w23222
Wang, Z., Wei, S.-J., & Zhu, K. (2013). Quantifying international production sharing at the bilateral and sector
levels. National Bureau of Economic Research. Retrieved from www.nber.org/papers/w19677
DO WE NEED DEEPER TRADE AGREEMENTS FOR GVCS OR JUST A BIT?
18 WP-02-2017.E
Appendix
We extract the value added measures using the decomposition of gross exports in 16 terms pioneered by Wang, Wei and Zhu. The technique uses input-output tables to extract the value added components in gross exports. The starting point (Figure 8) is to separate gross exports in four major categories: domestic value-added absorbed abroad, domestic value-added first exported then returned home via imports, foreign value added and pure double counted items. Then we proceed to the split of domestic and foreign value added according to their final use (Figure 9 and Figure 10). Using the three aforementioned diagrams, we define integration as a seller as the domestic value added in intermediate goods re-exported to third countries. Integration as a buyer is the foreign value added from either the direct partner of third countries.
Figure 8. Decomposition of Gross Exports
Source: Wang, Wei and Zhu (2013)
ITC WORKING PAPER SERIES
Figure 9. Components of domestic value-added
Source: Wang, Wei and Zhu (2013)
Figure 10. Components of foreign value added in gross exports