Page 1
:":14 ;
Itil,f88 087
AUTHOR1ITLE
PUB DATENOTE .
,BDES'PRICEDESCRIPTORS
. IDENTIFIERS.
l'ESTRACT. The hypothesis that negative emotional ife states
accoMpanving life-stresses ate associated with overeating'-and weightgain carknot be adequately tested solely by laboratory analoOle.siudies. Naturalistic, short-term longitudinal designs are needed inwhich individual' susceptible to mood,eating can'be identified priorto 'a stressful event and follcwed up.,to determine weight changes.College stidents in two samples comple'ted-questionnaires on be;ght,weight, restraint, eating hatits,*seif-image, and life events. Moodeating tendenciesp.which were more frequently reported by bothtoverlieight and normal-weight females than miles, were associated with3me1f-monitared dysphoric moods and negative self-Avaluations.,Sublects vfth high scores on the Mood'Eating Scale were likely to be
-11..., !, ",
1 .
. .
/ DOCOUNT RHONE
CG.014 464
amtkion Linda J.: Hawkins. Raymond C.Stress ;elated Overeating Among College Students:Development of a Mood Eating Scale.8037p..: Piper-presented at the Annual Convention of theSouthwestern, Psychologici'l Associaion (26th,Oklahoma City, OK,.April 10-12, 1980) . For relateddocuments see CG 014 451 and CG 014 419.
Mi01/PCO2 PiWS Postage..*Affective Behavior: Beklavior Patterns: BehaviorRating Scales: *Holly Weight: college Students:*Eating 'Habits: Life Style: Self Control: *SelfEsteem: *Sex Differences: *Stress VAriables: TestConstruction*Mood 2ating Scale.
ratlxictive dieters reporting bingereating tendencies anddissatisfaction with weight-related tppearance. Results suggest thatthe Mood E4tin§ Scale is a viatle measure n'of a vediating variable, a
, ,cognitive appraisal process intervening'.between life and weightchanges. (Author/HLM)
v.I
.,---
s*********************************p**IN**41*******.************************* Reproductions supplied by VAS are the best that can be made *
* . fru the original document. *
***********************************************************************
Page 2
-1
Stress related overeating among college students:
Development of a Mood Eating Stale
ti
Linda J. Jackson
University of Houston
Raymond. C. HawkinsII
University of,Texas,at Austin
4.
U S DEPARTMENT OF HEALTHEDUCATION &WELFARENATIONAL INSTITUTE OF
EDUCATION
THIS DOCUMENT HAS BE N RF PRODUCE() E XA( IL Y AS OF.CF IVE ; ROMTHE PE RSON OR ORGAN.ZATIONoRIcerNATING IT PO:NTS OT VIEIN OR ORIN.6NSSTATED DO NOT NEC ESSARIL v REPRE-SENT OF F ICIAL NATIONAL ASTI TUTE OFEDUCATION POSITION OR POlICY
F.
r.F.
F.
<2.
"PERMISSION TO REPRODUCE THISMATE.RIAL HAS BEEN GRANTED BY
TO THE EDUCATIONAL RESOURCESINFORMATION CENTER (ERIC)."
4
Page 3
0,
Jackson & Haw.kins 2
Stress related overeating among college students:
Development of0a Mood Eating Scale
F
According to the psychPsomatic theory of obesity (Kaplan & Kaplan, 1957),
obese individuals overeat in response to-emotional states (e.g., anxiety, bore-
. doe, anger; depression) and this eating alleviates,the dysphoric mood.. This
pattern'of "mood eating" :hastbeen viewed as a learned coping response usually
established in childhood (Bruch, 1961). Clinical reports of mood eat'ing are
abundant (Atkinson g Ringuete, 1967; 8,-1, 1964; Clancy, 1965; Holland,
Masling, & Copley, 1970; Leckie & Withers, 1967; Leon & Chamberlain, 1973;
Silverstone, 1968; Sjoberg & Persson, 1979;).Stunkard, 1976; Weintraub &
Aronson, 1969,' but experimental tests of the theory have yielded contradictory.
findings (AbramsonA Stinson, 1977; Abramson & Wunderlich, 1972; Antelman &
Rowland, 1976; Herman & Polivy, 1975iledn & Chamberlain, 1973a, 1973b;4-
McKenna. 1972; Meyer & Pudel, 1972; Schacter, GoldMan, & .Gordon, 1968; Slochower,4.
1976). .In general, overweight and normal weight subjeqt not exhibiting "re-
straint" (t.e., restrictive dieting efforts) eat less when rendered anxious-.
thro6bh tqreat of electric shoCk or unfavorable social compar4sons, while 'ov6r-
weight and restrained subjects tend to eat more (e.g., Herman & Polivy, 1975).
Abramson and Stinson.(1977) found boredom to increase consumption for both
obese ahd normals. Although Ely, Goolkasian, Frost, & Blanchard (1979) have
reported that "restrained" female subjects in the "depressed" mood induction,
condition ate more candy but reported less depression than their unrestrained ,
counterparts, there is no conclusive experimental evidence that overeating in
response tct life stres.ameliorates dysphoric moods (cf., Rodin, 1977).
f
44").
lase
FAW.
0
Page 4
1
6.
vs.
-1
Jackson & Hawk4nt, 3
4 ,
. ,.
.,
,
The miked and inconclusive findings 'of these laboratorr, studies should be
v1ewe0 Within the context of recent'systematic clinical investigations of the
relapse pattern5-0 articipants of weitht control programs. Leon & Chamber-,
lain (1973a kb) foun that regainds.reported a greater number:of emotional
aro4al. states eliciting eating . Rosenthal Marx, & Adams (1979), .folkowing
Marlatt &'Gordon's (1980) relapse model for addictive behiviors, noted that re-(
gainers experienced more guilt during an initial dietary "slip". One third
of all slips were categorized as due to-"copying With negatiVe emotional
states.': Setty & Hawkins (Note 1.) foam, that regainth reported highee anger-.
hostility scale scores 4n the SCL-90 at pretreatment; while binge eaters were
more likely to drop out of treatment.,
The hypothesis that negative emotional states accompanyinyife stresses
are associated with Dvereating and weight gain cannot be adequately tested
.solely by laboratory analogue studies.\Natbralistic, short-term longitudinal
designs are needed in which,individuals susceptible to mood eatihg can be
.identified prior to a stressful event (e,g., exams, divorce)'and then followed
up subsequently to determine weight changes. Preliminary correlational studies
have suggested that arousable persons are particularly susceptable to psycho-
somatic and psychological dysfunctions following life'stresSs (Mehrabian & Rois,
1979). fs:
In the.present study we propose an alternative-iersion of the psychOsomatic
hypothesis to describe stress related eating in college students of varying
body weights. Furthermore,.we,descrtbe the devel'opment of a self4report masure
of emotional,eating tendencies (the "Mood Eating Scale") and examine the rela-
tionship between mood eating, restrictive dieting tendencies, binge eatihg, and
weight fluctuation during one academic semester.
4
0
k
Page 5
Jackion & Hawkins 4
A rpformulation of'the plycholomi's hypothesis for overeatint:
flhere appears to be a subpopulation 'Of individuals, both those ostensibly
'overweight and those Of normal-weight, who have the tendency to eat under stress
or emotional aTsal. "flood eaters". who try to conform to ideai weight standards
will exhibit strong dietary "restraint" in an effort to both compensate forot
mood eating and to lose weight if they believeythat they are overweight. De-
spite daify emotional fluctuations, then,, these persons will.most,likely be
able,to maintain their weight or even 'lose weight on a day-to-day basis. How-.
ever, periods of substantie life stress should serve to disinhibit restrained
eating as well as augment the intensity of their emotional states. Life stress
may also increase the tendency forka doirlinant response such as eating to occur
more frequently (Antelman St./Rowland', 1976). At any rate, mood eatirt is pre--
dicted at such times to become more frequent and unSmpensated by restrictive
dieting efforts. The mood eater, in effedt, overeats apegains weight until
the stressful perioll is over`' 1
Certain p.arts of thfs formulatioa re-quire additional comments. First, we
have Maintained that most mood eaters will be restrained 4ieters. We predict
th s assuming that the majority of mood eaters wish tia achieve andbaintain .
! "
"idear'weight standards. As a.group, normal weight mood eaters ar probably
moreslikely ta be restrained than they are to be unrestrained betause-they must
comPensate for minor "mood eating - overeatingr tendencies. Overweight mood
eaters should be even more characterized by restraint because they must re-.
strain their intake enough to actually rose weight in addition to compensating
for mood eating.. However, we do not believe that all restraiped individuals
are mobd eaters. Mood eating would have to be the sole determinant of.over-
eating for this to be the case.4
Page 6
I.
Jackson & Hawkins
From this preliminary model sevei-al specific hypotheses %.:re derived.t
First, individuals scoring high on the state medsure of mood eating stiou.ld re-
port more frequent negative moods associatea 'with self-monitoredmeals and
1 snacks, as well as a greater frequency of negative self-avaluations,. Mood'eat-
.ing .t.enden-Cles were.predicted to be more frequently'reriprted by females than .
by males. Mood eating scores were Predicted to be positively correlated with
restrictive dieting tendencies (although not.isomorphic With this "restraint"
meaiurg) and pesitAvely correlated with each individual's percent&ge deviation
-
fraChis/her "ideal" weight as defined by the individ6l, not as defined
by the desirable weights for given heights in insurance tablesY. Binge eating
was hypothesized to be as:more severe variant of mood eating, involvin6 stress
related eattng and degree of.dissatisfaction with weight-related physical ap-
pearanc.? (j:e., with body image disturbance).. High mood eaters were predicted
to-differ from non-mood-eatars in their self-reported age of onset of concern
about being overweight. Finally,'restrained mood eaters were expected to main-.
tain a relatively stable body weight or even lcise weight during the senester,
unless they reported experiencing periods of life stress, which would disinhibit
their restraint thereby tri4gering stress related eating and subsequent weight ,.
gain.
Method
Subjects
Two samples of college undergraduates of varying body weights participated
in this study. The first sample comprised.1-45 females and .55 maks from the
second author's abnormal psychology class, who completed the questionnaires
for extra credit. The second sample contained 188 females Prom several intro-
ductory psycholoqy classes who completed the queetionnaires to fulfill a coUrse
Page 7
Jackson & Hawkins 6
requirement for research participation: Body'weight percentages were calculated
$ as a deviation percentne frorille desirable'weight for males or felnales with
. a medium body frame (Metropolitan Life Insurance' Company, 1959; Wollersheim,
1970). Five women and eight menln the second sample were at least 20% over-
Weight, Whilelil.of the'femalesnin the second sample were overweight to this
.degree.
Procedure
'Subjects in both samples,received a %packet of questionnaires which included
a Height-Weight Survey (Hawkins, Jpublished), eliciting inform.ation about current
4
height and weight, desired "ideal" weight, age of onset of concern about being,s
overweight (if applicable) and other demograp.hic information. The packet also
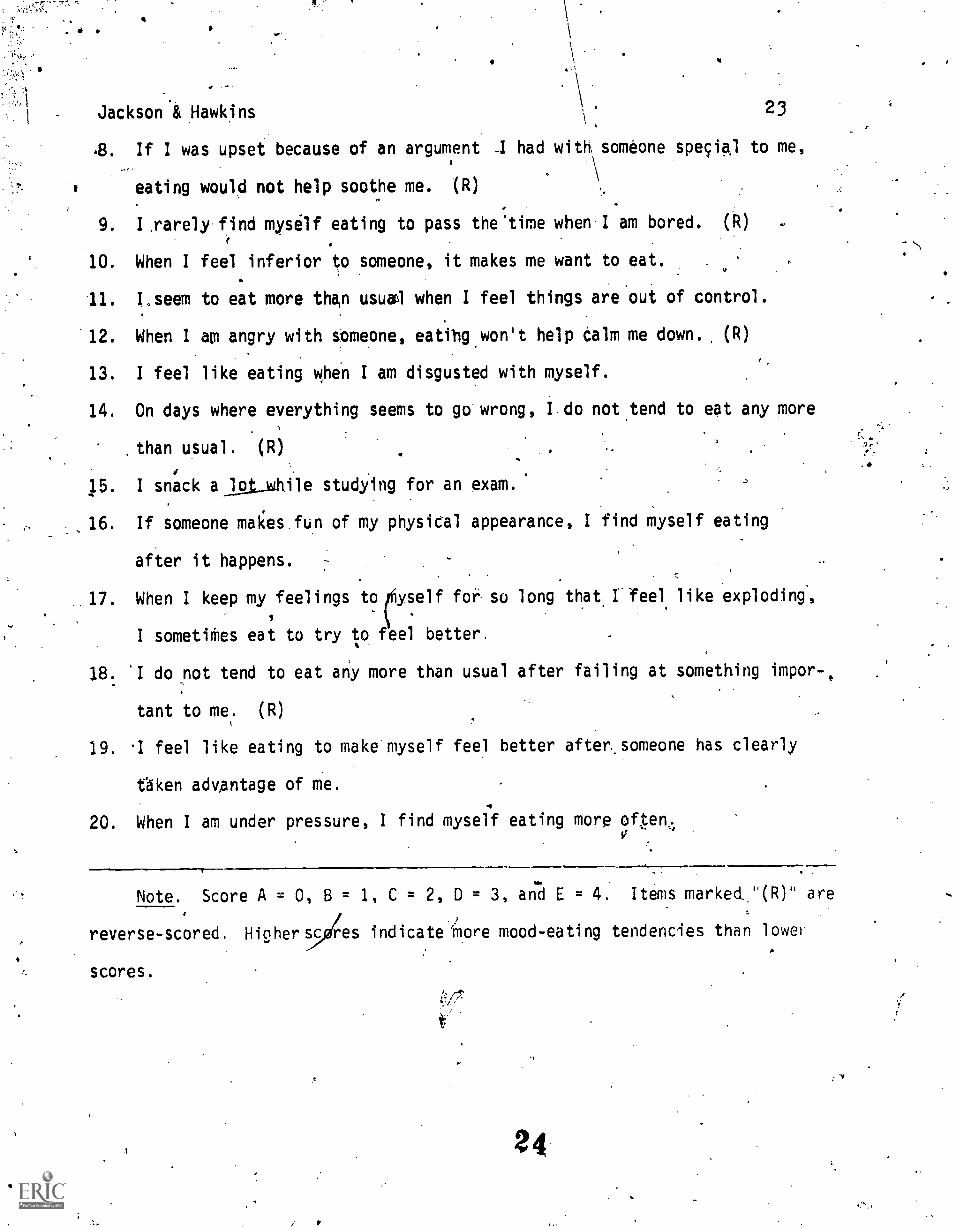
contained the.20-item Mood Eating Scaqe ,(Table 1) which was developed to assess
the tendency to report eating in response to various emotions as well as the
.belief that eating under these circumstances offers comfort. Additional measures
included the revised Restraint Scale (Herman, Pliner, Threlkeld & Munic, 1978)*, .
which measures restrictive dieting tendencies, the Binge Scale (Hawkins &4
Clement, in press), po Negative Self-Image Scale (Hawkins & Clement, in press),
which.is a measure of dissatisfaction with weight related appearance,',snd a
Life Events Scale'(Price & Price, 1934). Both the Binge Scale and till Negative
Self-Image Scale Have been found to have adequate internal cOnsistehcy reliability
(Cronbach alphas of .68 and .96, respectively). 4'
In addition to completing these questionnaires subjects in the first sam-
ple self-monitbred their eating behadVior for two week days and two weekend days
(cf., Hawkins, 1979). Weight change dUring the month subsequent to tilling the
surveys was also obtained. The procedure was slightly different for the women
in tht second sample% During pretesting two months prior to their participation
1.0
Page 8
Jackson & Hawkins 7
in this survey most of these subjects had completed the Height-Weight Question-
naire. Thus for the second sample the weight change measura was retrospective.
- Results.0
Quantifying self-perceived stress related eating.tendencies
The internal consistency of the 20-item Mood Eating Sca!e was satisfactory
-'for a pilot instrument (Cronbach's alpha =.88, for the sample of-188*women).
Examination of the relationship.between the tOtaY score on the Mood Eating
Scale and the emotion-al and attitudinal measure& from the self-monitored food
records kept by the male end female subjects in the first sample revealed sig-.
nificant poitive correlations be4gen mood eating and the percentage of nega-,
ttve self-evaluations associated with ingestions (r = ,36, p .001), and a
trend for mood eating to be correlated with the percentage of dysphoric moods
.during ingestions (r-= .18, p = .06). Mood eating was.not significantly cor-
*related with self-reported body we404 percentage or with the percentage of
positive self-statements.
The Mood Eating Scale scores of 145 females'in.the ftrst sample (M = 33.99,
SD = 15.15) were significantly higher than those of the 55 malei (M = 26.59,
SD = 12.34), t(208) = 3.44, II< .001): Subjects who were at least 20% in
excess of their desilble weight percentage did not obtain signifitantly_bigher
mood eating scores relative to those of their normal weight counterparts, when
gender and restrictive dieting tendencies were statistically controlled. Re-
ported age of onset of overweight concern (childhood, ado3escence) was not sig-
nificantly correlated with mood eating scores for either the first or the second
samples.
Psychological cqrrelates of Mood Eating
The interrelationship among total scores on the Mood Eating Scale, the
Restraint Scale,.the'Binge Scale, the Negative Self-Image Scale and the Life
Page 9
-Jackson & Hawkins
Changes Scale, along with'current body weight percentage,meig
, 8
percentage
t change auring the semester, and the percentage deviation between current weight
and each individual's self-determined "ideal" weight are presented in Table 24,
(for the,first saMple) and Table 3 (for the second sample. Degree of mad
eating was significantly poSitixely correlated with restricitive dieting ten-
dencjes, binge eating, dissatisfaction with weight related appearance and the.
degree to which body weight percentage exceeded self-deiermined ideal weight
(r'= .37, p < .01 for the first sample, a trend for the second sample). The
pattern of correlations was Similar aCross the two samples, in mosl instances.
A double median split procedu're was next carried out on the Tiata from the
Y88 women in'the second sample to investigate the relationship between mood
eating and.dieting "restraint% The median score for the Mood tating Stale
was 39i while that for the Restraint Scale was 15. Fifty-eight women's scores
exceeded the medians on both scales. Sixty-four percent of the mood eaters
were restrained dieters,,while 67% of the restrained dieters were mood eaters.
As predicted, most mood eaters were engaged in r4ettrictive dieting efforts,
and many---but not all---restrained.dieters were mood eaters. All nine Over-
weight (+20) mood eaters were restrained, as were the other 5 overweight women.,
whose scores did not exceed the median on'the MdochEating Scale.
A series of hierarchical multiple regression analyses (Nie et al., .1V5)
was then performed to provide some preliminary tests'for the- hypotheses derived
from our model of stress related eating. The results of each analysis are re-
ported first for the sample of male and female students, and second, for the
sample of college woMen.
With Mood Eating Scale scores as the dependent, or criterion, measure, the
linear combination of the predictor variables "Restraint Scale score" and "per-
Page 10
t.t
Jackson-8i Hawkins 9
centage deviation from self-determined weight" was expected to account
for significant amounts of variance, while the addition of current body weight
was not expected.to produce a sigtlifiCant increment in R2.' Table 4 provides
- descriptive statistics lor.the regression of mood eating scores on these pre-
dictor sariables for each salle. Equations 1 and 2 summailze the regression
analyses of the mood eattng measure for the first and second Samples, respe ive-r,4
ly. The "Beta" coefficients in th-ese and subsequent equations Nye been compu .
a
for standardized variables; thus the magnitudes of the coefficients for the
'. various significant e,ffects are indicatve of the relative strength of these, .. .
.Q.\
predictor variables.. .
.
,--"a. (1) Mood Eating = +.42 Restraint + .11,Percentage discrepancy from ideal weight
+.02 Body weight percentage
(2) Mood Eating = +.,13 Restraint +.15 Percentage discrepancy from ideal weight1
-.07 Body weight percentage
The R2
values for Equations 1 4nd 2, adjusted for sample size and number of°pre-
dictors, were .23 and .02. Of the predictor variables, deting restraint showed
the strongest ass.pCiation with mood eating, while body weight percentage did not
add sivificantly to the explained variation in this criterion.
Binge eating was hypothesized to be a more severe variant of mood eating,
involving both stress related eating and degree of dissatisfaction with weight
related appearance. Table 5 provides descriptive statistics for the regression
of binge eating:scores on the predictor variables for each sample. Equations 3
and 4 summarize.the regression analyses 'of th'is dependent measure for the first
and second samples, respectively.
(3) Binge eating = +.35 Mood eating +.29 Negative self-image
,(4) Binge eating = +.08 Mood eating +.80 Negative self-image
10
Page 11
T
Jackson & Hawkins 10
The R2 values foe Equations 3 and,4, adjusted for sample size and number of.pre-
dictors were .43 4.32. Both predictor variables,imood eating and negative
.self-image, separaeely accounted for significant proportions of variance in ihe
I.
criterion measure.,/, 4
"Ikestrained7mobd eaters" were hypothesized to maintain a'relatively stable
body weight or even Toge weight during the semester,'unless they reportedex-
perieneing many major life changes. For the first simple of males and females
the criterion measLY:e waA-the difference between the body weights reported be-
fore and.after the one month interval subsequent to the subjects' completion of
the self-report questionnaires and their self-monitoring of meals and snacks.
For the second sample, however, the dependent Measure was the difference ih
body Weights reported before and after the two.month interval prior to comple-
tibn of the self-report questionnaires. In this latter case, body weights had
been obtained during pretesting, before the subjects participated in the survey.
Table 6 Provides descriptive statistics for the regression of this weight change
mewre on several predictor variablei for the first sample. Equation 5 sum-
marizes these regression analyses. A "dummy" variable to encode for gender
classification was entered iryto,the hierarchical multiple regression equation
on_the first inclusion step,-iince women reported significantly greater weight
loss during the subsequent one month'period than did the men, t(24) = -2.60, p = .01.
(5) Prospective Wgt. = -.28 Sex (males=0, females=1) -.40 Mood eating-1-.36 Restraint
Change (%) -.1Q Binge eating -.17 Life Change total score
+.50 Life Change X MoOdeating - .20 Percentage
discrepancy from ideal weight -.24 Preweight percentage
A negative (-) sign for the standardized regression coefficients indicates that
the higher the score on the predictor variables the more weight was lost during
0
'the one month follow-up interval. The adjusted R2 value for Equation 5 was .27.
11
Page 12
.
Jackson & Hawkins. 1;
The duMm; variable, "sex", and the "percentage discrepancy.from ideal%weight"4
accounted for significant varianCe in the criterion (p < .01), while Life chang4s,
(during the past month) and the' interaction between mood eating and life changes
accounted for additional variance (p's < .10).
Subjects in the first sample who wanted te lose weight (i.e:, for whom there
was a deviation from self-determined ideal weigh0 lost more weight in the sub.-
sequent month, while subjects viho reported many recent lifq,changes along with
more mood eating tended not to.lose'weight.. To clarify this interaction between
mood eafing tendencies and reported life changes a' discriminant function analysitz.!
(Nie et al., 1975) was performed for subjects grouped as follows: those losing .
at leaSt 4 pounds (n=7), those gaining at least 4 pounds (n..5), and th9se in be-:
tween t(n.49). Table 7 presents the means (t SD), the univariate F values and
the 2.1 .values for the several predictor vartables as,:a.function of this post-hoc,
grouping. A weight fluctuation of 4'pounds/was approximately equal to + 1 SO.
(see Tables.2 and 3). Inspection of this table reveals the same pattern of rela-
tionshis that obtained in the multiple regression analyses: subjects who lost
the most weight had beforehand reported more mood eating, more restrictive diet-
ing tenAncies, more binge eating, more dissatisfaction with weight related
appearance, had wanted to lose more weight, and had expertenced more negative
self-evaluations associated with meals and snacks than had the subjects who had
subsequently gained weight. The first discriminant function enabled a signi-
ficant separation of the group centroids (Wilk's Lambda = .43, Chi-Square (24) =
44.5, p < .01). The variables contributing most to the function {lOading at
least .5) were life changes, ideal weight discrepancy, percentage of negative
self-evaluations and negative moods associated with eating and smacking percen-
tage. There were significant sex differences in the proportion of subjects
12
S.
,
Page 13
V
A 0 a
Jackson & HiWtins 12
whose weight change exceeded four pounds, Chi-square (2) = 6.0, p < .05, with
4
females more likely to have loist 4 pounds than were males.:
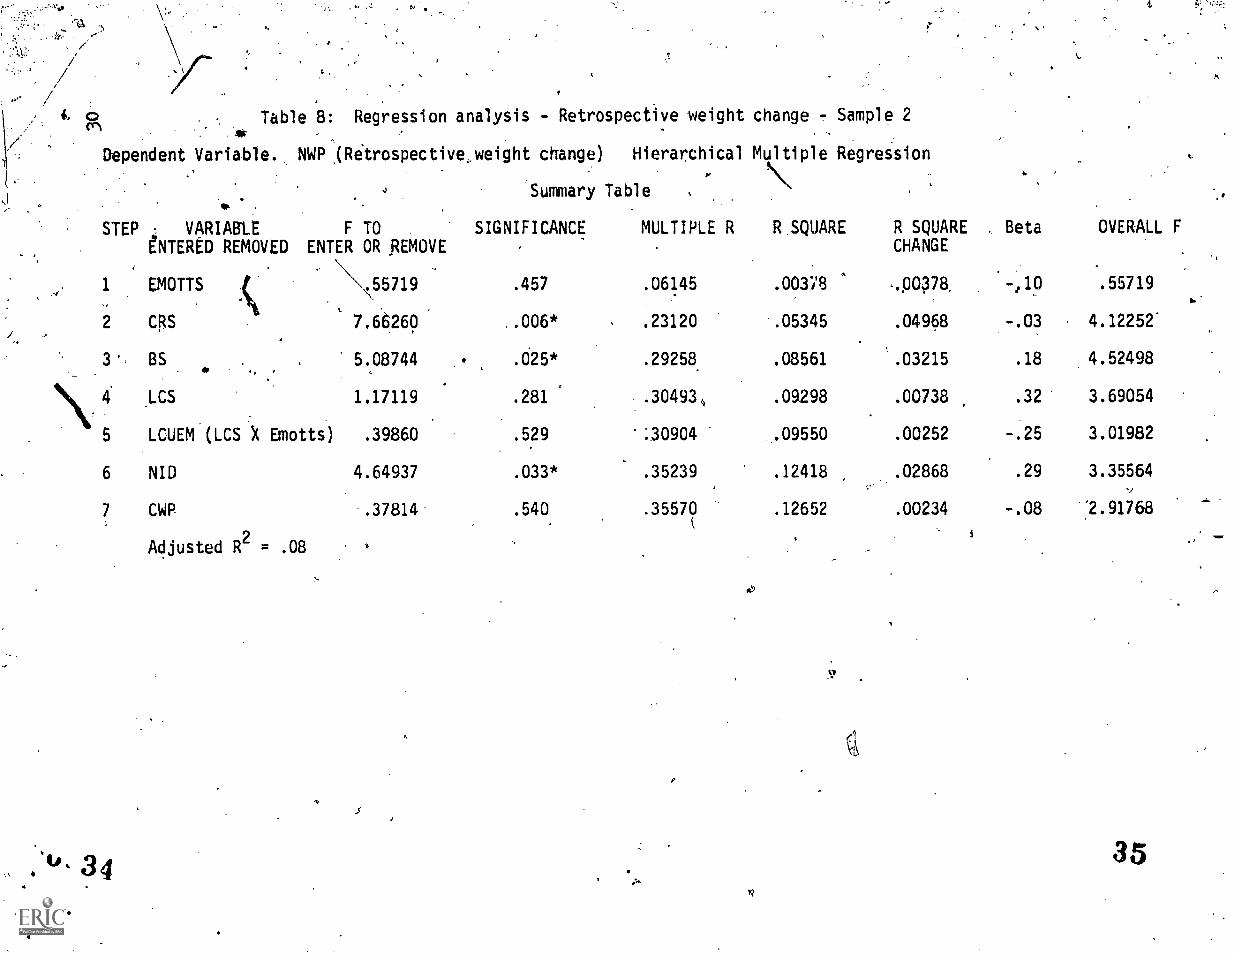
Table 8. provides the descriptive Astatiitics for the regression of prior
weight change upon the predictor variables in the tecond sample f women.
Equatfon'6 1.4mmarizes the hjerirchical multiple regression arialysis:I.
1 .(6) Retrospeatve = -.10 Mood eating -.03 Restraint +.18 Binge eating
Weight change.%. +.32 Life changes -.25 Life changes X Mood eating
lk +.29 Percentage deviation from ideal weight
-.08 current body weight perOentage
. A positive, (41 sign for the standardized regression coefficients indicates that
the higher the score on the predictor variable the more'weight gain had been re-
ported during the preceding twO months! The adjusted R2value for Equation 6
.
was .08.1 'eh; pedictor variables accounting for significant amounts of varlance
in the'crjterion measure included:. dieting 'restraint (p < .01), binge eating
J
tendencies (p <..05), and percentage deviation from ideal wieght (4) < .05).,
A discriminant function analysis was also performed for subjects grouped
into three categories: those who had.lost at least 4 pounds (n=11), those who
had gained at least 4 pounds (n=15), and those in between (n=112). Table 9 pre-
sents'the means (+ SD), the univariate F's, and the k values for several pre-
dictor variables as a function of this post-hoc grouping. Women who reported
they.had gained weight also reported more current binge eating behavior and more
_deviation from their ideal weight. The first and second discriminant functions
enabled significant separation of the group centroids (Wilk's Lambda . .55,
Chi-square (14) = 77.8, p < .001; Wilk's Lambda = .83, Chi-square (6) . 25,
p < .001).
13
Page 14
A1
..
'
,
\
Jackson! Hawkfns2 ? 4 13 ,
. v
. /,
\
The Ireth!sis that,restrained mood eaters would lose weight except durtng1periods ofj life str'dts\at which time disinhibition of mbod eating would occur,
implies the occurrence pf an interaction between reporte4 life changes and
mood eating in jointly determining weight change. 'Regression Equation 5, for
the first sample, revealed a trend for this interaction., Further 2 X 2 ANOVAs
were conducted on the weight change dependent measures in both saWes. Four,
groups of subjects were formed on the basis of median splits on mood eating //
scores and reported life changes. FoP the first sample, the interaction between
life changes and/Mood eating attained statistical significance, F(1,66) = 6.13)
p < .02. (hé triple interaction, Life.changes X Mood eating X Subject's sex,
was found to be non-significant (pi< .9) in a preliminary analysis). Similarly,
for the second all female sample the life changes and wood eating interaction
was also significant, F(1 146) := 4.10, p < .05. The cell means for weight change
represented, in these two-way interactions are presented, separately for ihe two
samples, in Table 10. For the first sample, subjects reporting high mood eating
tendencies and few life changes subsequently lost the most weight (Mean = 3.94
pounds). For the second sample, subjects who reported having experienced many
major life changes, but little mood eating, gained the most weight (Mean'= 2.1
pounds).
D*ussion
These findings suggest that self-perceptions of mood eating may be reliably
measured and demonstrably related to measures of eating behavior, other attitudes
of interest, and to weight changes reported both retrospectively and prospective-
Mood eating tenden'cies, which were more frequently reported by college women
(both overweight and normal weight) than by college men, were associated with
self-monitored dysphoric moods and negative self-evaluations during daily ingestions
F.
14 /
Page 15
1 Jackson & Hawkins 14
in naturalistic settings. Subjects obtaining high scones on the Mood Eatiog
I"
Scale were likely to be restrictive dieters reporIpg binge eating tendencies,
41 and dissatisfaction with weight related appearance, but not-all dietersor over-
4weight subjects reported stress'nelated. eating.
4.
A preliminarkMadel of stress related eating mioog college students is
proposed, which postulates that restrained mood eaters would be expectel o
maintain their weight or even fose weight on a day to day basis. During periods .
1
of substantial life stress; however, restrictive dieting efforts ,would Skssen
or cease and weight would be,gained. Preliminary findings showing that-mood
eating and dieting tendencies were associated with.subsequent weight loss 'during
the semester, unless the individual repOrted.many concurrent life.stresses
were consistent wittilltis formulation. -.The. Mood iating Scale thus shgws promise.
as a measure of a mediating variable,'a cognitive appraital proces intening
between lfe changes and weight changes. The.predictive 'Validity of the Mood.
Eating Scale needs replication and,extension to longitudinal studies using both,
normative and clinical salL4lein addition.to experimental investigations jiing
.laboritory anatogues of individual differences in arousal induced eating.
Of immedia6 interest is verifying that the apparently different.patterns of
,..
relationships between the self-report measures of stres related eating. and weight
change depends upon whether the weigAt fluctuation criterion is prospective or
rdlcospective. The well-known riacttve effects of self-monitoring have been
found to have adaptive functions (ct., Hawkins, 1979; Doell & Aawkins, unpublished
paper). Self-awareness and.witlktngness to self-attribute loss of control of
health habits may constitute a cognitive preparation for a change of phase in the
alternating cycle,of weight loss and regain. Awareness of weight gainl perhaps
related to strqssfulm life events, may increase self-attribution of feeltng of
i
1 5
Page 16
.Jackson & Hawkins 4 15
contrnl oven eating, yet the acknowledgment of thes'e dissatisfactions with
behavior and self may facilitate subsequent weight loss efforts, provided thatAw
AMP
alternative,stress-coping resources are available to'aid adjusiMent to mijor
,life changes:
44.
16
-,s
-
a
Page 17
.Jackson & Hawkins
Reference Notes
S/ R., & Hawkins, R. C. II. Vulnerability to stress related overeating:
An eramination of the frequency.and enj9yability of.pleasant aêtivities ex--
. perienced by college students with weight;concerns. Paper presented at the
Annual Convention of the Southwestern Psychological AssociatfonOklata
1City, April, 1980.
2. Setty, R. M., & Hawkins, R. C. II. Relevance of mood eating pattern to
maintenance of weight loss after treatment. Paper presented at the An al
Convention of the Southwestern Psychological Association, Oklahoma City,
April, 1980.
7.0
I
Page 18
A
Jackson,& HaWl(ins
f
pp
Referendtg'9
OK Abramson, E. L & Stinson, S. G. Boredom and eating in obese an6 non-obeSe \
individuals. Addictive Behaviors, 1977 2 181-185.-
4. ...AAbramson, E..E., & Wunderlich, R. A. Anxiety, falm4and eatingiA test of the'
t. .
, .9.
psychosOmatic concept of obesiO. Journarof Abnormal Psy4ho1o9yIN1.972,'
79, 317-321.
Antelman, S., A Rowland, N. Stress-induced hyperphagia and obesity in rats:
, &possible model 'for understanding human,obesity. Science, 1976,3191,
310-311.
Atkinson, R. M., & Ringuette, E. L. A survey of biographical andpsychological
\ features in extraordinary fatness. Psychosomatic Medicine, 1967; 29,
\\\ 121-133:
, .
ir
Bruch, H. Trans7ormation of oral impulses in eating disorders: A conceptual ,
approach. Psychiatric QuarterLy.,'1961, 35, 458-481:.
.Bruch, H.A cholopftsal aspects of overeating and obesity. Psychosomatics,
1964, 5, 269-274;
Clancy, J. Other aspects of depressions. Geriatrics, 1965, 20, 92-98.
Ely, R. 'J.., Goolkasian, G.', Frost, R. O., & Blanchard, F. A. Dieting, depression,
and eating behavior! Paper presented at the Annual Convention of the
Pherican Psychological Association, New York City, August, 1980.
Hawkins, R. C. II. Meal/snack frequencies of college students: A normative
study. Behavioral Psychotheraa, 1979, 7., 85-90.
Hawkins, .R. C. II, & Clement, P. F. Development and construct vaiidltion of a
self-report measure of binge eating tendencies. Addictive Behaviors,
in press.
1 8
C.
Page 19
(, . . .
.
Jackson & Hawkins . . 18, 7,.
II,,- '
,
:
.Herman, C. P., & Polivy, J. Anxi, ety; restraint, and eating behavior. Joifrnal
of 'Abnort, 1975; 84, 666-672.3
.7
Herman, O. P., niner, P., Threlkeld, J., & Munic, D. Distractibility in
dieterp and non7dieters: An lternative view Qf "externali*." Journal
of Personality and Soelal Psychology, 1978, 36(5), 536-548.
Holland, J., Masling, J., & Copley, D. Mental illness in.lower classvormal,
obese.and hyper-obeseNwomen. Psychosomatic Medicine, 1970, S2', 351-357.
4kaplan, & Kaplan, H(S. The psychosomatic concept of obesity. Journal
of Nervous and Mental Disease% 1957, 125, 181-201.
k.`
Leckie, E. V., & Withlls, R. F. A.% Obesity and depression. Journal of Pachq-
'somatic Research, 1967, 11, 107-115.
Leon., G. R., Chamberlain, K. Emotional;arousa), eating patterns, d tiody
image is differential factors'associated with varying success in main-
taining a weight loss. Journal _of Consulting and Clinical Psycholo9y, 1973.,
40, 474-480. (a),
Leon, G. R., id Chamber K. Comparison of daily eating habits and emotional.
states of overweigh persons
\successful or unsuccessful in maintaining a
weight loss. Journal of Consulting and Clinical Psycholo9y, 1973 41,
108-115. (b)
Marlatt, G. A., & Gordon, J. R. Determinants of relapse: Implicattqns for the
maintenance of.behavior chAnge. In P. Davidson (Ed.), Behavioral Medicine:
Changing health lifestylest New Yok: Brunner/Mazel, 1979.
McKenna, R. J. Some effects-of anxiety l vel and food cues on the eating be-.
havior of obese and normal 'subjects: \A comparison of the Schacterian and
psychosomatic conceptions. Journal of Personality and Social Psychology,
1972, 22, 311-319.
19
Page 20
11
Iwo
/ " 1.
Jackson'&"Hawkins . 19
, ..
Mehrabian, A., &.Ros;, M. Illnesses, accidents, and alcohol use as foctions..
a
of the arousing qualtty and pl,easantness of life changes. PsycholoalbiOw
1.1(20111s_.1979,45, 31-43.
Metropolitan Life Insurance.Company. New weight standards for men and women.
Statistical Bulletin, 1959, 401 1-4. .
_Meyer, J. E., & Pudel, V. Experimentl studies on food intake in obese tnd
normal weighPsulljcts. Journal of psychosomatic Research, 197Z, 16,
305.-308.
,Nie, N. H., Hu1l,C. H.., Jenkins, J.-G., Steinbrenner,'K., & Bent, D. H.
Statistical package for the social sciences (2nd ed.). New York:
McGraw-Hill, 1975.4
Rodin, J. Research on eating behavior, and obesity: Where does it ftt in
prsonalit4 and social psychology? Personality and Social Psychology
Bulletin, 1977, 3, 333-355.
Aosenthal, B. S., Marx, R. 0., kAdams, C. Determinants of refapse for parti-.
cipants in a wei4ht reduction provam. Paper7presented at the Anrival
Convention of the American Psychological Association, , Oklahoma City,-
As
April, 1980.
0 hachter, S.., Goldman, R., & Gordon, A. Effects of fear, food deprivation, and
obesity on eatinp. Journal of Personality and Social Psychology, 1968,
10, 91-97.
Silverstone, J. T. Obesity. Proceedinasof the Royal Society:of Medicine,
1968, 61, 37005.
Sjoberg, L., & Persson, L. A study of attempts by obese patients to regulate
eating. Addictive Behaviors, 1079., 49'349-359.
20
r
Page 21
A
,Jackson & Hawkins 20.
Slochower, J. Emotional labeling and overeating in obese anal normal weight
individuals. Psycliosomatic Medicine, 1976, 23, 131-139..*
Stunkard, A. J. ThePairt)esii. Californfa: Bull IYU6lishing.Co., 10
Weintraub, W., & Aronson, H. 'Application of verbal behavior analysis to the
study of.psychaiNicai defense mechanisms, Archives of General Psychiatny,
. 1969, 21, 739-744.
Wollersheim, J. Effectiveness of group th&apy based upon learning principles
1
I.
in the treatment.of overweight women. Journal of AbnormallE6±112a,
1970, 76, 462-474.
0
21
aft
r
.10
1
Page 22
0
Jackson & Hawkins4 / .
1
0
PootnoteEL..,'
,. ..
_Reprint requests should be sent to Dr. Raymond C. Hawkins,
215
Department. of Psychology, the University of Texas, Austin,. Texas,
78712.
Linda J. Jackson is currentiY working toward her Ph.D. in'
clinical psychology at the University of Houston.
;
fib
444,
22
Page 23
4
.
.Jackson & Hawkins
Table I
22
The,E-Scale: A keasure of Obodeating Tendencieskg
Instructions: Indicate how itrongly you agree or disagree with each of the
following stateMents by choosing the appropriate letter oe the scale A, B, C,
D, E:
,:Strongly
igreeA
I.
J
1StronglyDisagree
E
Tor example, if you strogly agree with a statement you would Markdown chOice
'A On your answer sheet. If you strongly disagree you would choose.E, while^if
yoU agree somewhat you mfght ahoose C, and so forth. Blacken the letter
D, or E on your answer sheet for each questton, depending on your choice.
I. Eating can make me feel somewhat relieved when I am overwhelmed with things
to do.
2. When I am nervous, eating something will not help calm me down. (R)
3. When someone important does something that clgarly shows their dislike for
me,.I find myself.eating..dfter it happens.
4. Eating something does not help soothe me when I'm feeling frustrated. (R)
5. When I am extremely happy, eating something seems to a'dd to the.good feeling.
6. If I eat a certain food and I feel very guiltxrabout eating it, I continue
to eat more of that food or other foods.
7. I find myself eating more than usual during periods of great stress (e.g.,
breaking up with a lover, final exam week, starting college or a new job,
getting married, etc.).
23
Page 24
Jackson & Hawkins 23
.8. If I was upset because of an argument I had with someone special to me,
eating would not help soothe me. (R)
9. I.rarely find myself eating to pass the'time when I am bored. (
10. When I feel inferior to someone, it makes me want to eat.
)
11. Ioseem to eat more than usue when I feel things are'out of control.
12. When I am angry with someone, eatibg.won't help Calm me down. (R)
13. I feel like eating when I am disgusted with myself.
14. On days where evenything seems to go wrong, I do not,tend to eat any more
.than usual. (R)
15. I snack algt_while studying for an exam.
16. If someone malices fun of my physical appearance, I find myself eating
after it happens.
17. When I keep my feelings to(yself for so long that.I feel like exploding',
I sometifts eat to try to feel better.
18. 'I do not tend to eat any more than usual after failing at something impor-,
tant to me. (R)
19. .I feel like eating to make myself feel better after.someone has clearly
taken advantage of me.
20. When I am under pressure, I find myself eating more ofun.
Note. Score A = 0, B = 1, C = 2, D = 3, arid E = 4. Items marked "(R)" are
reverse-scored. Higher s9ates indicate bore mood-eating tendencies than lowei
scores./.,
'
24
Page 25
JacksOn & Hawkins
Measure
Mood Scale
Binge Scale
Restraint .
Neg. Self-Image
Life Changes
Initial Wgt.
Weight Chgi
Ideal Wgt.
Means (n=65)(+50)
.
fp.
** p < .01 /* p < .05
Table 2
24
1 2 3 4 5 6 7 ,J6
".51** .48** .52** .26* .17 .24* .37**
.61** .57** .08 .06 -.14 .29*
.62** .26* .27* -.05 .55**
.13 .17 -.01.
.11 .20 .14
-.30* .73**
(
31.9 4.5 14.7 5.7 94.3 102.6 -.7 3.8
13.8 4.7 6.6 4.4 76.2 13.4 5,.2 9.0
Page 26
t>
Jackson & Hal4ins
.' Measure,
.Mood Scale
Binge Scale,
Restraint
kNeg,.. Self-Image
Life Changes
Initial Wgt. c*
. . .
i4-ht Chg.
Ideal W t.
'Means (n=149)
(S0+)
** p <.01* P <.Q5
, 1
Table 3
2 3- 4 5 6
25
7 8
,
,
,
.21** .16w
.68**.
.31** .10
.58**..10
.62** .06
11
.08 .-.06
.42**
.51**
49**
:18*
.13
.26** .55**,
.21** .61**,
.12
.10 .12
.22** .83**..'
.30**
39..7
6.0!
5.9° 16.1
5.2% 5.8
7. 86.06.1 88.4
100.311.7
.7 -6.9
3.7 8.0
4
.$4
26
CI
Page 27
-ty
,
Dependent Variable. EMOTTS
Table 4
i Sample #1
Summary Table
STEP VARIABLE' F TO SIGNIFICANCE 'MULTIPLE R .
ENTERED REMOVED ENTER.OR REMOVE" 4
1 RSTOT -28.73726 .000 .49196
2 NID 1..29807_........,
.258 .50291
3 PREWGT .02581 .873 ..50313
Adjusted R2
= .23
Sample #2
Dependent Variable.. EMOTTS Summary Table
-
74TEP VARIABLE F TO SIGNIFICANCEENTERED REMOVED ENTER OR REMOVE
1 CRS 5.31331 .023,
2 NID .77744 .379
3 CWP .25649 .613
Adjusted R2
= .02
MULUPLE R
R SQUARE R SQUARE Beta OVERALL FCHANGE
.24202 .24202 .42 28.73726'
.25292 .0109 -.11 15.66525
.25314 .00022 .02 9.94227,
R SQUARE R SQUARE Beta OVERALL FCHANGE
.18496 .03421 .03421 .13 5.31331
.19805 .03922 .00501 .15 3.14144
.20220 .04089 .00166 -.07 2.10300
28
Page 28
7
9
. Dependent Variable. BSTOT
Table 5
Sample #1
Summary Table
c
STEP VARIABLE F TO SIGNIFICANCE MULTIPLE R R SQUAREENTERED REMOVED ENTECOR REMOVE
1
,
1 EMOTTS 97.24241 .600 .57488 .33048
.
` 2 SITS 38'.52919 .000 .66368 .44047
3 SISEM (Interaction .42468 .515 '.66460 .44169
between SIS & EMOTTS) .
2Adjusted R = .43
,
, SQUARECHANGE
.
Beta
.33048 .35
.10999 .29
.00122 .12
OVERALL F
A7.24241,
77.14831
51.42280
Sample #2.1
. t
Dependent Variable. BS Summary Table
.STEP VARIABLE F TO SIGNIFICANCE MULTIPLE R R SQUARE R SQUARE, Beta OVERALL F
ENTERED REMOVED ENTER OR REMOVE CHANGE
1 'EMOTTS 7.28379 .008 .21588 .04661 .04661 .08 ,7.28379
2 SIS ' 63.38342 .000 .57661 .33248 .28588 .80 36.85839.
3 SISEM .31814 .574 .57F86 .33392 .00144 -.26 24.565101
21
Adjusted R2 = .32
11,
30
Page 29
.
T?)e 6: Regression analysis: Prospective weight change.
,.Dependent Variable. NFP (keight than9e-prospectively)
Sample #1
SumillaryeTable
STEP ; VARIABLE F TO SIGNIFICANCE MULTIPLE R R SQUAREENTERED REMOVED ENTER OR REMOVE
1 Dl(Dummy for "sex"0=females
. 1=nia1es)
2 EMOTTS .
3 RSTOT ,
4 BSTOT
5 LCU
0
6 LCUEM (LCU X Emotts)
7 NID
8 PREWGT,-
Adjusted R2 = .27
7.42482 .008 . .32470 .10543.
41. 3007 . .292 .34849 .12144
1.9169§ .171J .38498 .14821
.06417 .801 .38616 .14912
3.29947 .074 .44066 .19418
2.64757 .109 .47892 .22936
,
984569 .003 .58555 .34287
,
1.69464 .1,98 .60181 .36217
R SQUARECHANGE
Beta OVERALL F
.10543 -.28 7.42402
.01601 -.40 4.28511
.02677 .36 3.53798
.00091 -.10 2.62882
.04506 -.17 2.84355
.03518 .50 2.87706
.11351 -.20 4.24868
.01930 -.24 3.97473
32
Page 30
:rare c
MEANS Lost > 4 lbs. . Gained > 4lbs.40 ,4
Group '1.1,,,
GrouP 2 Group 3
(n = 7) (n if 49) (n = 5).,
EMOTTS 43.85714 30.55102 34.00000
RSTOT'' 21,28571 14.63265 13.00000
BSTOT 8.85714 4.42857 3..00000 ,
SITS 10.14286 '5:42857 .. 4:,60000
LCU . 79.00000 92.69388 163.60000
PREWGT 110.-57143 102.53061 *95.20000
NI_Ak 13.57143 . 3.26531 -3.00000 .
SNACPERC .3482119t 8
.56718
NMOODPER .33759 .22756.
NEGSSPER .26316 ,.11512 .05087
POSSSPER .55029 .61636 .70225.
.STANDARD DEVIATION
GiO1 1 GROltP 2
4
GROUP 3
EMOTTS 1 n23967 12.93906 18.26198
RSTOT 6.84871a
6.09540 4.30116
el BSTOT. 4.94734
.
4.56435 4.24264
SITS '' 4.05909 4.29146 1.94936
LCU , 46.23130 69.45298 143.31888
PREWGT 13.48897,
13.24151 11.38859
NID 9.98093 8.09263 10.48809 ,
SNACPERC .09432 .16618 .12749
NEGSSPER .09275 .13691 .063.17443 .26806NMOODPER .25324
POSSSPER .19,320 .33948 .16 4
WILKS LAMBDA.(U-STATUTIC) AND UNIVARIATE F
VARIABLE r WILKS LAMBDA' F (2,58 df.)
\EMOTTS .9033 3.1039
RSTOT .8774 4.0539
BSTOT .8982 3.2872'
SITS .8729 4.2234
LCU .9279 2.2518
PREWGT .9334 2.0678
NID .8209 6.3286 .1
SNACPERL . 9 11 2 2.8261
NMOODPERNEGSSPERPOSSSPER
.9835 .4878
.5838 4.9668
.9886 .3332
33
4
. .
29
I.
.
Page 31
L
c) Table 8: Regression analysis - Retrospective weight change - Sample 2itr
Dependent Variable. NWP (Retrospective,.weight change) Hierarchical Regreision
*
STEP .; VARIABLE F TOENTERED REMOVED ENTER OR _REMOVE
1 EMOTTS(t
55719
2 CRS 7.65260
3' BSt.
5.08744
4 LCS 1.17119
5 LCUEM (LCS ) Emotts) .39860
6 NID 4.64937
7 CWP .37814.
Adjusted R2 = .08
3 4
'Summary Table t
SIGNIFICANCE MULTIPLE R R SQUARE R SQUARECHANGE
Beta OVERALL F
.457 .06145 .00378 .po78 -,10 .55719
.006* .23120 .05345 .04968 -.03 4.12252'
.025* .29258 .08561 .03215 .18 4.52498
.281 .30493 .09298 .00738 .32 3.69054
.529 .30904 .09550 .00252 -.25 3.01982
.033* .35239 .12418t
.02868 .29 3.35564
.540 .35570 .12652 .00234 -.08 :2.91768
35
Page 32
0.
MEANS Lost > 4\ lbs.
iv
11Group 1(n = 11) ;
a
Table 9
Group 2(n = 112)
EMOTTS 38.00000 40.0080CRS 17409091 15.54464
3.81818 5.56250
SIS 6.18182 7.57143
LCS 103.18182 81.05357
% PWP 112.18182 97.56250
NID 5.54545' 5.57143
,STANDARD.AVIATIONS
31
Gained > 4 lbs.it
Group 3(n = 15)
39.40000. 18.40000
8.6000011.20000
127.93333106.7333315.60000
AO* :" GROUP ^1 GROUP 2 .
1.1
GROUP 3
EMOTTS 3.76829 5.98130 5.94979
CRS . / 6.62502 5.47704 5.75450
BS 5.03623 4.91877 6.43428
SIS ' 4.87480 6.13910 6.71033
tCS' 120.25624 84.5160 100.:)5542
PWP 11.17871 10.77600 11.60337
NID 6.18650 7.23071 10.29424
VARIABLE
WILKD LAMBDA (UrSTATISTIC) AND UNIVARIATE F-RAT
WILKS LAMBDA' F (2.135)
EMOTTS .9908
CRS .9718 1.9561
BS .9547 3.2001
SIS .9605 2.7745
LCS .9713 1.9940
PWP .8438 12.4999.
NID .8508 11.8392
3(3
P
4
Page 33
Lb'
1'4
1
V.t
Table 10 - )04
. f '1 .*
,
Cell means Ior weight change as a joint Ifunctionof moodeating and life changes
. Life Changes 2.
Life Changes
Low
High
Low .
High
Sample #1(Prospective weight change)
males & females
/5
Moodeating
Low High
SD = 3.31
+.913 lbs.
1
sp = 7:87'
-3.94 lbs.
=
-.437 lbs.sip = 1.75
n = 15
+.400 lbs.SD = 3.99
i
d Sample #2(Retrospective weight change)
, i
females
'c
LowMoodeating
High
. 77
-.077 lbs.
A I
SD = 2.49
+.605 lbs.
.I
37
+ 2.10 lbs.
= J J
n=39
.410 lbs.
1 = .
37
1
,
32