41
Energy and Emission Reduction Opportunities for the Cement Industry Prepared for: Industrial Technologies Program

Energy and EmissionReduction Opportunitiesfor the Cement Industry
Prepared for:
Industrial Technologies Program

Energy and EmissionReduction Opportunitiesfor the Cement Industry
December 29, 2003
Prepared Under Contract for:
Industrial Technologies Program
Cover: Rotary kilns represent the largest energy consumer and carbon dioxide emission source of thecement/concrete industry. The cover diagram shows a thermal image of an operating kiln. The hightemperature of the kiln surface (300°F to 400°F) accounts for about a 5% energy efficiency loss. Thediagram on the cover depicts a kiln that has lost insulating refractory material and shows hot spots and ahot ring that will require future repair.
Prepared by:William T. Choate
BCS, Incorporated5550 Sterrett Place, Suite 306
Columbia, MD 21044
Acknowledgments
We gratefully acknowledge the support of the U.S. Department of Energy’s Office ofEnergy Efficiency and Renewable Energy, Industrial Technologies Program. We especiallythank The Portland Cement Association and the National Ready Mixed Concrete Association fortheir valuable input and information.
This document represents the valuable input of many individuals and organizations. Weparticularly want to recognize Anne Klontz (BCS, Incorporated) for the graphic design of thefigures and tables.
DisclaimerThis report was prepared as an account of work sponsored by an Agency of the United States
Government. Neither the United States Government nor any Agency thereof, nor any of theiremployees, makes any warranty, expressed or implied, or assumes any legal liability orresponsibility for the accuracy, completeness, or usefulness of any information, apparatus, product,or process disclosed, or represents that its use would not infringe privately owned rights. Referenceherein to any specific commercial product, process, or service by trade name, trademark,manufacturer, or otherwise does not necessarily constitute or imply its endorsement,recommendation, or favoring by the United States Government or any Agency thereof. The viewsand opinions expressed by the authors herein do not necessarily state or reflect those of the UnitedStates Government or any Agency thereof.

Table of ContentsExecutive Summary . . . . . . . . . . . . . . . . . . . . . . . . . . . . . . . . . . . . . . . . . . . . . . . . . . . . . . . . . . -i-
Introduction . . . . . . . . . . . . . . . . . . . . . . . . . . . . . . . . . . . . . . . . . . . . . . . . . . . . . . . . . . . . . . . -1-ENERGY AND EMISSION METRICS . . . . . . . . . . . . . . . . . . . . . . . . . . . . . . . . . . . . -2-OVERALL ENERGY USE AND EMISSIONS . . . . . . . . . . . . . . . . . . . . . . . . . . . . . . -3-
The U.S. Cement Industry . . . . . . . . . . . . . . . . . . . . . . . . . . . . . . . . . . . . . . . . . . . . . . . . . . . . -6-
Cement . . . . . . . . . . . . . . . . . . . . . . . . . . . . . . . . . . . . . . . . . . . . . . . . . . . . . . . . . . . . . . . . . . . -9-CEMENT MANUFACTURING PROCESS . . . . . . . . . . . . . . . . . . . . . . . . . . . . . . . . -11-
Quarrying . . . . . . . . . . . . . . . . . . . . . . . . . . . . . . . . . . . . . . . . . . . . . . . -11-Raw Material Preparation . . . . . . . . . . . . . . . . . . . . . . . . . . . . . . . . . . -12-Kiln Operations . . . . . . . . . . . . . . . . . . . . . . . . . . . . . . . . . . . . . . . . . . -13-Cement Milling . . . . . . . . . . . . . . . . . . . . . . . . . . . . . . . . . . . . . . . . . . -16-Storage and Dispatch . . . . . . . . . . . . . . . . . . . . . . . . . . . . . . . . . . . . . . -17-
Concrete . . . . . . . . . . . . . . . . . . . . . . . . . . . . . . . . . . . . . . . . . . . . . . . . . . . . . . . . . . . . . . . . . -18-
Opportunities for Improving Energy Efficiency and Reducing CO2 Emissions . . . . . . . -21-PYROPROCESSING OPPORTUNITIES . . . . . . . . . . . . . . . . . . . . . . . . . . . . . . . . . . -24-
Upgrading Existing Technology . . . . . . . . . . . . . . . . . . . . . . . . . . . . . -26-Adopting New Technology . . . . . . . . . . . . . . . . . . . . . . . . . . . . . . . . . -26-Cogeneration . . . . . . . . . . . . . . . . . . . . . . . . . . . . . . . . . . . . . . . . . . . . -26-Biomass Fuels . . . . . . . . . . . . . . . . . . . . . . . . . . . . . . . . . . . . . . . . . . . -26-Alternate/Waste Fuels . . . . . . . . . . . . . . . . . . . . . . . . . . . . . . . . . . . . . -27-
GRINDING AND MILLING OPPORTUNITIES . . . . . . . . . . . . . . . . . . . . . . . . . . . -28-PRODUCT FORMULATION CHANGES TO IMPROVE ENERGY EFFICIENCY -29-
Pozzolan . . . . . . . . . . . . . . . . . . . . . . . . . . . . . . . . . . . . . . . . . . . . . . . . -29-
Endnotes . . . . . . . . . . . . . . . . . . . . . . . . . . . . . . . . . . . . . . . . . . . . . . . . . . . . . . . . . . . . . . . . . -31-
Appendix A - Energy Data and Calculation TablesAppendix B - Portland Cement TypesAppendix C - Major Components of Cement

Table of Diagrams, Figures and ChartsDiagram A – Energy Use Distribution for Quarrying, Cement Manufacturing and ConcreteProduction . . . . . . . . . . . . . . . . . . . . . . . . . . . . . . . . . . . . . . . . . . . . . . . . . . . . . . . . . . . . . . . . -i-
Diagram B – Carbon Dioxide Emissions for Quarrying, Cement Manufacturing and ConcreteProduction . . . . . . . . . . . . . . . . . . . . . . . . . . . . . . . . . . . . . . . . . . . . . . . . . . . . . . . . . . . . . . . -ii-
Table 1 – Annual On-site Energy Use and CO2 Emissions Associated with Cement and ConcreteProduction . . . . . . . . . . . . . . . . . . . . . . . . . . . . . . . . . . . . . . . . . . . . . . . . . . . . . . . . . . . . . . . . . 3
Table 2 – 2001 U.S. Cement Industry . . . . . . . . . . . . . . . . . . . . . . . . . . . . . . . . . . . . . . . . . . . . 6
Diagram 1 – U.S. Kiln Locations . . . . . . . . . . . . . . . . . . . . . . . . . . . . . . . . . . . . . . . . . . . . . . . . 6
Table 3 – On-site Fuel Consumption for Cement Manufacturing (excluding Quarrying) . . . . 7
Table 4 – Final Composition of Typical Portland Cement . . . . . . . . . . . . . . . . . . . . . . . . . . . . 9
Diagram 2 – Phase Diagram of Major Cement Components . . . . . . . . . . . . . . . . . . . . . . . . . 10
Diagram 3 – Quarrying for Cement Limestone . . . . . . . . . . . . . . . . . . . . . . . . . . . . . . . . . . . . 11
Table 5 – Energy Consumption for Surface Limestone Quarrying . . . . . . . . . . . . . . . . . . . . . 12
Diagram 4 – Raw Material Preparation . . . . . . . . . . . . . . . . . . . . . . . . . . . . . . . . . . . . . . . . . . 12
Diagram 5 – Preheater Precalciner Kiln . . . . . . . . . . . . . . . . . . . . . . . . . . . . . . . . . . . . . . . . . 13
Diagram 6 – Preheater Precalciner Section . . . . . . . . . . . . . . . . . . . . . . . . . . . . . . . . . . . . . . . 15
Table 6 – Average Energy Consumption in U.S. Kilns by Number and Process . . . . . . . . . . 16
Diagram 7 – Clinker and Gypsum Milling . . . . . . . . . . . . . . . . . . . . . . . . . . . . . . . . . . . . . . . 16
Diagram 8 – Concrete Production . . . . . . . . . . . . . . . . . . . . . . . . . . . . . . . . . . . . . . . . . . . . . . 18
Table 7 – Typical Concrete Mix . . . . . . . . . . . . . . . . . . . . . . . . . . . . . . . . . . . . . . . . . . . . . . . 18
Table 8 – Annual Energy Use and CO2 Emissions Associated with Cement and ConcreteProduction . . . . . . . . . . . . . . . . . . . . . . . . . . . . . . . . . . . . . . . . . . . . . . . . . . . . . . . . . . . . . . . . 21
Table 9 – Thermal Energy Balances to Produce Clinker in Process Kiln . . . . . . . . . . . . . . . . 24

Limestone Quarrying
Primary
Secondary
Crushing
Pre CastAggregate Ready Mix
Dispatch
Cement
Exhaust Gas to TreatmentRaw MealInlet
Blending
Quarried Raw Materials
Grinding
Raw Meal Storage
PREHEATER CYCLONES
Precalcine Burner
Cooler Air
ROTARY KILN
Burner
CLINKER COOLER
Finish Milling
Cement Storage
Gypsum
Clinker
Clinker
Clinker
QUARRYING
CEMENT MANUFACTURING
CONCRETE
Aggregate Quarrying
Crushing

-i-
Executive SummaryCement is a gray, finely ground combination of minerals which, when mixed with water,
sand, gravel, and other materials forms concrete. Cement provides the chemical bonds that holdthe other materials together to form a dense rocklike substance. Concrete is the world’s mostcommonly used construction material and second only to water as the most-consumed substanceon Earth. Demand for cement is directly tied to the use of concrete in building construction andpublic works projects. It closely follows GDP growth in the United States and in developingcountries. Nearly all cement is used to produce concrete. Cement manufacturing and concreteproduction are bound together in the Life Cycle Analysis of energy use and emissions of theseindustries.
The United States has 118 cement manufacturing facilities operating 192 kilns. Theseplants manufactured over 88,900,000 tonnes of cement in the year 2001. On average, theyrequired 4,982,000 Btu to produce one metric ton (tonne) of cement, not including the energyrequired for quarrying raw materials. The production of concrete consumes nearly allmanufactured cement. Ready Mixed Concrete is produced in more than 2,700 plants andaccounts for over 75% of all concrete production. Over 390,646,000 cubic yards (687,000,000tonnes) of ready mixed concrete were produced in 2002. Concrete blocks and precast productsaccount for 13%, on-site concrete mixing accounts for 6%, and the remaining 6% of concreteproduction is used in well lining, mining operations, and other activities. Concrete accounts forabout 20% of the energy and 12% of the CO2 emissions associated with cement/concrete.
The cement/concrete industry operates at less than 40% thermal efficiency. This lowefficiency suggests that there are significant opportunities to improve energy efficiency andreduce emissions. Diagram A shows the proportion of the more than 550 x 1012 Btu (0.55 quad)that were consumed in 2000 for U.S. quarrying, cement manufacturing, and concrete production.Cement manufacturing requires very high temperatures, 2,700°F (1,500°C), to initiate thereactions and phase changes necessary to form the complex mineral compounds that give cementits unique properties. Pyroprocessing inlarge rotary kilns is the operational stepthat provides the energy andenvironmental conditions necessary forthe reactions and phase changes. Thisoperation dominates the energyconsumption and environmental impactsassociated with the manufacture ofcement and use of concrete and accountsfor 74.2% of the industries’ energyconsumption. U.S. pyroprocessingsystems, on average, operate at roughly34% energy efficiency.

-ii-
More than 104 x 106 tonnes of CO2 emissions were associated with U.S. quarrying,cement manufacturing and concrete production. Diagram B shows the proportion by source ofthese emissions. The raw materials used in cement manufacturing undergo chemical reactionsduring pyroprocessing that result in the generation of carbon dioxide (CO2). These chemicalreactions produce 0.54 tonnes of CO2 per tonne of cement, about 48 x 106 tonnes annually.Nearly 60% of the 68.9 x 10⁶ tonnes of CO2 produced annually in the United States from non-combustion industrial sources (chemical reactions) originate from cement manufacturing.1 Industrial non-combustion CO2 sources account for approximately 1.2% of all U.S. CO2emissions. In addition, the fuels burned to supply the energy necessary for pyroprocessingproduce roughly 0.43 tonnes of CO2 pertonne of cement. In total, pyroprocessinggenerates nearly 0.97 tonnes of CO2 foreach tonne of cement produced (86 x 106
tonnes annually) and accounts for 81% ofthe CO2 emissions associated with theuse of cement/concrete. The CO2produced from the chemical reactions isnot influenced by changes in technology,equipment, or pyroprocessing energyefficiency. A consequence of the largeportion of CO2 generated from chemicalreactions is that a 25% reduction inpyroprocessing energy use results in onlyan 11% reduction of total CO2 emissions.
The greatest gains in reducing energy consumption and lowering emissions in thecement/concrete industry will be obtained with improvements in pyroprocessing. Processimprovement will come from better energy management, upgrading existing equipment,adopting new pyroprocessing technologies, and in the longer term, performing the research anddevelopment (R&D) necessary to develop new cement manufacturing processes. Pyroprocessingis ideally suited to utilizing biomass and other non-traditional alternative fuel sources. Itsextremely high operating temperature and long residence time ensure complete combustion ofthese fuel sources. Biomass fuels are considered to provide energy with near net-zero carbon-based emissions. R&D directed at developing the systems necessary to prepare and feed biomassfuels into pyroprocessing equipment will dramatically lower carbon-based emissions. Manyindustrial, manufacturing and consumer wastes are suitable alternate fuels for pyroprocessing(e.g., used oils, solvents, tires, and other wastes). R&D directed at safely increasing the use ofalternate fuels provides an indirect means of improving energy efficiency. Alternate fuels arefrequently assumed to have no energy requirement for their manufacture and their feedstockenergy (energy inherent to the material) is normally associated with the finished product not theused product. Hence, when alternate fuels that are typically disposed of in landfills are utilized asfuels they provide a source of “free” energy.
Energy efficiency improvements and emission reductions can also result from changes in

-iii-
the Product Formulation of cement. Research has shown that modifications to the cementformula are possible without a loss in desired properties or performance. These modificationsinclude the addition of cement-like (pozzolanic) materials (e.g., fly ash, furnace slag, or othermaterials) that do not require the large energy inputs associated with pyroprocessing. Changes tocement product formulations require significant time to be incorporated into ASTM standardsand be accepted in the marketplace. Concrete producers specify cement based on ASTMstandards in order to guarantee the performance characteristics of concrete. Changes to theseformulations are perceived as “risky” because change represents a move away from standardsthat have a very long and well-documented performance history. There is a trend in public worksprojects of specifying newer “low-energy” product formulations.
This report describes the cement industry and its technology. It provides backgroundinformation necessary to develop realistic work plans to reduce energy usage and to lower CO2emissions. This report finds that opportunities exist both in the near-term and in the long-termfor reducing energy usage and lowering emissions. Immediate and near-term improvements canbe achieved by implementing demand-side energy management measures to improve energyefficiency and reduce electricity and fuel use. These improvements can come from utilizing freeand low-cost options that include: motor, compressed air and process heater optimizationsoftware tools; participating in local and regional energy management training, workshops, andseminars; and conducting university-based energy assessments. Other site-specific near-termenergy and environmental improvements can be achieved with contracted formal energy audits.Changes in product formulation also offer significant near-term energy and environmentalimprovements. Longer-term improvements could come from advanced research anddevelopment programs. However the cement industry, like most of the commodity materialsindustries, does not have the resources or incentives to conduct advanced and significant R&Don their own. Successful research and development programs will require significantcollaboration between industry, government, and academia.

-1-
Concrete is second only to water asthe most consumed substance onEarth, with almost one ton of itbeing used for each human everyyear. - Lafarge Coppee SA. Globeand Mail, October 20, 2000
Annual global production ofconcrete hovers around 5 billioncubic yards. Twice as muchconcrete is used in constructionaround the world than the total ofall other building materialsincluding wood, steel, plastic andaluminum. - Cement Association ofCanada.
IntroductionCement is a gray, finely ground combination of
minerals which, when mixed with water, sand, gravel, andother materials forms concrete. Cement provides thechemical bond that holds the other materials together.Concrete, when newly mixed, is plastic and malleable,which allows it to be cast into shapes to build homes,sidewalks, superhighways, dams, skyscrapers and manyother objects. Concrete is inert, nontoxic, naturallywaterproof, and fire resistant. It is the world’s mostcommonly used construction material.
The words cement and concrete in every day usageare frequently interchanged, even though cement is onlyone of the multiple materials used in the making of concrete (Is it a cement sidewalk or aconcrete sidewalk?). Cement manufacturing and concrete production are bound together in anyanalysis of energy use and emissions.
The raw materials used to produce cement are primarily limestone, clay, shale, and silicasand (Appendix A Table A.3). These materials are quarried, crushed, and, for economy, areusually transported to a nearby cement plant. The cement plant proportions the raw materials tothe correct chemical composition and grinds the material to a fine consistency. Small quantitiesof iron ore, alumina, and other minerals may be added to adjust the raw material mixture. Thefinely ground raw material, “raw meal,” is fed into large rotary kilns, cylindrical furnaces 10 to25 feet in diameter and 200 to 1,000 feet in length. The rotary cement kiln is the world's largestmoving manufacturing machine and one of the hottest. It is typically set on a slight incline androtates from 1 to 4 revolutions per minute. A large kiln may “pyroprocess” more than 300 tonnesof raw meal an hour. The raw meal is heated in the kiln to extremely high temperatures, about1,500°C (2,700°F). The high temperature pyroprocessing causes the raw meal to react and formcomplex mineral compounds. These compounds exit the kiln as a hard nodular material called“clinker.” Many newer cement plants use the hot exiting kiln gases to preheat the raw meal.Clinker is cooled and ground with approximately 5% gypsum (which controls concrete settingtime) and other minor additives to produce cement.
Concrete is produced by blending cement with fine aggregate (sand), coarse aggregate(gravel or crushed stone), and frequently with small amounts of chemicals, called “admixtures.”Admixtures are used to accelerate or retard setting time, control early plasticity properties,increase strength, improve resistance to acid and sulfates, control shrinkage, and improvefreeze/thaw cracking. When water is added to the concrete mix at the job site, it forms a slurrythat coats the surfaces of the aggregate and fills the voids to form rock-solid concrete. Theprocess of hardening or setting is the result of the water hydration chemical reaction of thecement. The properties of concrete are determined by the exact chemical composition of cement

-2-
Concrete’s Relative Energy Intensity2
Extruded Aluminum 184 Plastics 92 Structural Ceramics 17 Steel 12 Cement 8Glass 7Concrete 1
e.g., It requires 184 times more energy per unit mass tobuild with extruded aluminum compared to concrete.
used, the additives, and the overall proportions ofcement, aggregate, and water. Concrete containsabout 12 weight percent cement. Because of therelatively small cement content, concrete is notenergy intensive when compared to otherconstruction materials.2
ENERGY AND EMISSION METRICS
Technologies, practices, and product usedetermine the energy consumption andenvironmental impact of a product. The energyvalues and emissions studied and presented in thisreport are based on a “value chain” analysis of the cement/concrete industry. Value chainanalysis allows for the capture of the direct energy and feedstock inputs of each processing step(link) to build a cumulative value along the chain. A value chain analysis is an integral part of aLife Cycle Assessment (LCA) and provides valuable information and data values fororganizations performing a complete LCA. LCAs are important to ensure that processimprovements in one area are not merely shifting the energy and environmental burdens toanother area. Numerous LCAs and energy inventories have examined the cement/concreteindustry.3 These are valuable references.
On-site energy values are based on actual process measurements taken within a facility.These measurements are valuable because the on-site values are the benchmarks that industryuses to compare performance between processes, facilities, and companies. On-sitemeasurements, however, do not account for the complete energy and environmental impact ofmanufacturing a product. A full accounting of the impact of manufacturing must include theenergy used to produce the electricity, the fuels, and the raw materials used on-site. These“secondary” or “tacit” additions are very important from a regional, national, and global energyand environment perspective.
The “tacit energy” associated with the production and transportation of fossil fuels usedfor combustion adds roughly 3% to the energy values of the fuels. Tacit electrical energy andenvironmental impact measurements account for the fact that substantial electrical generationinefficiencies and transmission losses occur outside the cement manufacturing facility. It cantake as much as three units of hydrocarbon or coal calorific energy to produce one unit ofelectric energy. Saving 1 kilo watt hour (kWh) of on-site electricity is equivalent to saving over3 kWh of the energy contained in the petroleum or coal-based fuels used to generate electricalpower. Typical U.S. grid electricity requires about 9,935 Btu of energy to deliver 1 kWh of on-site electricity (3,412 Btu) for use (Appendix A Table A.16). Industrial tacit energy values alsoaccount for feedstock energy. Feedstock energy is defined as the energy inherent in fuels that areused in the manufacturing as materials rather than fuels. The feedstock energy associated withcement and concrete production is near-zero. This report, for clarity, distinguishes between on-site energy values and tacit energy values with the use of a superscript (Any value that is a tacit

-3-
Table 1 - Annual On-site Energy Use and CO2 Emissions Associated with Cement andConcrete Production
CEMENT CONCRETE
Energy CO2 Energy CO2
109 Btu 106
tonne 109 Btu 106
tonne
RAW MATERIALS: QUARRYING and CRUSHING
Cement Materials 3,817 0.36
Concrete Materials 14,287 1.28
CEMENT MANUFACTURING
Raw Grinding 8,346 1.50
Kiln: fuels 410,464 38.47
reactions 48.35
Finish Milling 24,057 4.32
TOTAL CEMENT 446,683 93.00 446,683 93.00
CONCRETE PRODUCTION
Blending, Mixing 31,444 5.65
Transportation 61,933 4.53
TOTAL 554,409 104.50See: Appendix A Table A.10
value is denoted with the superscript “t,” e.g., 1.0 t kWh).
OVERALL ENERGY USE AND EMISSIONS
The annual cement/concrete energy “value chain analysis” from quarrying raw materialto the final placement of concrete is shown in Table 1. The United States producedapproximately 89,000,000 tonnes of cement in 2002. In total, the cement/concrete industryconsumed over 550 x 1012 Btu (0.55 quad). Cement manufacturing is the most energy-intensivelink, accounting for nearly 80%, 447 x 1012 Btu (0.447 quad) of the on-site energy consumed inthe cement/concrete energy value chain.
The amount of energy required to produce one tonne of cement averaged 4,982,000Btu/tonne of cement for U.S. plants (not including the energy required for quarrying the raw

-4-
materials). The most energy efficient U.S. plant required 3,230,000 Btu/tonne of cement whilethe least efficient used 8,150,000 Btu/tonne of cement.4 One unit operation, pyroprocessingaccounts for 74.2% of the total on-site energy, more than 410 x 1012 Btu (0.41 quad), requiringnearly 4,617,000 Btu per tonne of cement for pyroprocessing alone.
The CO2 emissions associated with the cement/concrete value chain are also presented inTable 1. Kilns and ancillary equipment used for pyroprocessing produce 83.1% of the CO2emissions. These emissions are generated by two mechanisms:
< Reaction-based CO2 Generation – the thermochemical decompositionreaction or calcining of limestone (CaCO3 µ CaO + CO2) and other minorraw materials produce CO2
< Fuel-based CO2 Generation – the combustion of fuels, used to obtain thehigh temperature needed for the calcining reactions, produce CO2.
The calcium carbonate calcining reaction (CaCO3 µ CaO + CO2) produces 0.785 tonnesof CO2 per tonne of CaO. There is no technological or physical way to reduce calcinationreaction emissions. Many cements contains about 61% CaO. Hence, the calcining reactionproduces roughly 0.48 tonnes of CO2 for each tonne of cement manufactured. This reportcalculated reaction CO2 emissions to be 0.544 tonnes of CO2 per tonne of cement based on theraw materials used by the U.S. cement industry (Appendix A Table A.11 and A.3). Thisdifference can be accounted for by recognizing that the MgCO2 portion of the raw materials alsocontributes to CO2 emissions. Industrial emissions of CO2 that are not caused by the combustionof fossil fuels, Reaction-based CO2 Generation, accounted for 1.2% (68,900,000 metric tons ofCO2 equivalent)5 of total U.S. CO2 emissions in 2000. The cement industry contributed 61% ofthis non-fuel value.5
The level of CO2 emissions from fuels depends on the cement process and the fuels used.These emissions can be controlled to some degree by fuel selection, burner choice, burnercontrols, kiln operation, and heat recovery equipment. The fuel mix and operating systems thatsupplied the energy necessary to pyroprocess in U.S. cement kilns in 2001 produced roughly0.433 tonnes of CO2 per tonne of cement. In total, pyroprocessing generates nearly 0.977 tonnesof CO2 for each tonne of cement produced (Appendix A Table A.11).
Cement manufacturing also generates other emissions of environmental concern.Particulates (dust) become airborne during the grinding, pyroprocessing, milling operations andwith the conveying of raw materials and product within the cement plant. Large volumes ofgases mixing with finely powdered material naturally result in airborne particulates. On-siteairborne dust is captured and controlled through optimal design and application of electrostaticprecipitators and bag-house filtration systems.6 These fine particulates can be difficult to captureand when they escape collection systems can spread over a large area.
Emissions of non-CO2 gaseous pollutants are minimal because of the high temperaturesand long residence times associated with kiln operations. Fuels and waste fuel materials arecompletely combusted and limestone in the raw meal acts as a natural "dry scrubber" that

-5-
captures many potential pollutants. Sulfur dioxide (SO2) emissions from a cement manufacturingplant are dependent upon the sulfur content of the raw materials and fuels used. If a raw materialor fuel with little or no sulfur content is used within a kiln, then there will be little or no SO2emissions. If there is a high sulfur content within the raw meal then the sulphide and organicallycombined sulphur will combust in the preheating stage, the majority of SO2 formed is scrubbedout by the raw meal and only a small portion may be emitted to the atmosphere.7
Other emissions from fuel combustion include nitrogen oxides (NOx) and carbonmonoxide (CO). NOx is produced during combustion due to the elevated temperatures in the kilnand to the presence of nitrogen in the air/fuel mixture. The temperatures at the firing end of thekiln approach 1,870°C (3,400°F). NOx is produced in this environment due to the reaction ofnitrogen in air with excess oxygen. The amount of NOx produced is dependent upon thetemperature and the amount of oxygen present. The higher the temperature or higher excessoxygen used in the kiln, the higher the resultant NOx emissions will be. CO can result from poorsolid-fuel feed systems in which sub-stoichiometric combustion will produce CO.8 However, thehigh temperature and long residence time associated with kiln operations provide littleopportunity for CO emissions to occur.
The energy consumed for concrete production is associated mainly with three operations:quarrying fine and course aggregates; mixing and blending cement, aggregates, and admixtures;and transporting the concrete mix to the work site. The energy associated with concreteproduction is about 19.3% of the total energy associated with all quarrying, cementmanufacturing, and concrete production.
CO2 emissions associated with concrete production results from quarrying, blending, andtransportation. Emissions from concrete account for 10.9% of the CO2 emissions associated withboth cement manufacturing and concrete production (Table 1). CO2 emissions for concreterelative to energy input are smaller than for cement manufacturing, which produces CO2 fromboth reaction chemistry and fuel use.

-6-
Table 2 - 2001 U.S. CementIndustry
Number of Companies 39
Number of Plants 118
Number of Kilns 192
Number of States with Plants 38
Largest Company MarketShare (tonnes)
13.1%
Source: U.S. Cement Industry Fact Sheet, 2003 edition, Portland Cement Association
Diagram 1 - U.S. Kiln Locations
Source: Portland Cement Association
The U.S. Cement IndustryThe U.S. Cement Industry produced
89,000,000 metric tons (tonnes) of building cementin 2002.9 The total value of cement plant sales wasabout $8.6 billion.2 U.S. cement industry plantsdirectly employ about 16,400 workers. The UnitedStates ranks third in the world in overall cementoutput, behind China and India. Cement productionworldwide is about 1,700,000,000 tonnes.10
Building cements accounts for about 95% ofthe cement sold in North America. This was used inthe production of more than $40 billion of concretein the United States in 2001.2 Masonry cementaccounts for the remaining 5% of cement sales inthe United States. Masonry cement is a combinationof building cement and 30% to 50% limestone. It is used as mortar for blocks, bricks, stucco, andother building projects.
Cement manufacturing is a highly capital-intensive industry requiring large-scaleequipment to be economically competitive. The capital investment per worker in the cementindustry is among the highest in all industries. The high capital intensity limits the financialincentive to build new plants or update old plants. There are 118 cement facilities that operate192 kilns in the United States (Diagram 1). Over 45% of U.S. kilns were built before1980 and5% of operating kilns were built prior to 1955.11 The U.S. cement industry currently operates atan average 80% kiln utilization rate.12
The industry is diverse, involving 39companies with no single companycontrolling more than 13.1% of the marketbased on tonnes produced. The five largestcompanies control nearly 50% of the market. Roughly 80% of the cement productioncapacity in the United States has foreignownership or affiliation. Based on plantcapacity, the top six countries with U.S. plantownership are France (14.5%), Mexico(14.4%), Switzerland (14.3%), Germany(13.8%), Italy (9.6%), and Japan (5.4%).These countries each have two corporationspresent in the United States, except forSwitzerland, which has only one. The top six
-7-
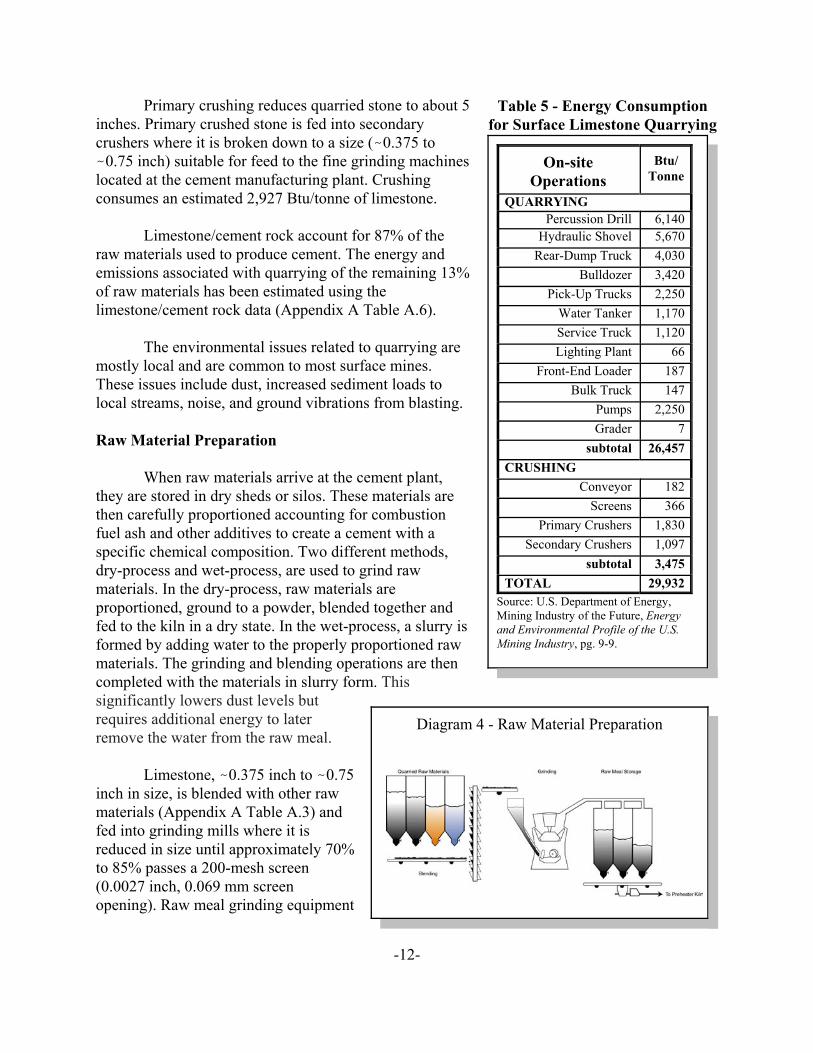
Table 3 - On-site Fuel Consumption for CementManufacturing (excluding Quarrying)
1971 2000Btu/tonne Percent Btu/tonne Percent
CONVENTIONAL FUELS Coal 2,639,000 36% 2,984,100 60% Petroleum Coke 39,600 1% 760,700 15% Natural Gas 3,347,100 45% 261,600 5% Middle Distillates 88,300 1% 39,400 1% Residual Oil 808,900 11% 3,900 0% Gasoline 7,400 0% 4,600 0% LPG 1,400 0% 300 0%ALTERNATE/WASTE FUELS Oils 0 15,000 0% Solvents 0 251,900 5% Tires 0 115,400 2% Solids 0 12,600 0% Misc. 0 7,600 0%
FUELS Subtotal 6,931,700 93% 4,457,100 90%ELECTRICITY 488,600 7% 524,700 11%
TOTAL 7,420,400 100% 4,981,700 100%Source: Cement Industry Fact Sheet 2002 edition
Portland Cement Association
companies in terms of U.S. capacity are Holcim, Ltd. (Switzerland - 13.1%), Lafarge Coppee(France - 12.7%), CEMEX S.A. de C.V. (Mexico - 12.2%), Heidelberger Zement AG (Germany- 8.25%), Ash Grove Cement Co. (United States - 6.5%), and Buzzi UNICEM SpA (Italy -4.4%).
The cement industry has reduced the amount of energy needed in cement production bymore than 33% since the early 1970s (Appendix A, Table A.9). Cement manufacturers achievedgreater energy efficiency by closing small plants and modernizing others. Energy savings wereprimarily achieved by shifting from the energy-intensive wet manufacturing process to the drymanufacturing process. Wet processing plants use water in raw meal grinding operations. Thiswater must be evaporated in the pyroprocessing area. In 1974, 234 cement kilns used the wetprocess, currently only 54 wet process cement kilns are in operation. Cement plants have alsoreduced energy consumption and costs by taking advantage of excess heat from pyroprocessingto preheat the raw meal before it enters the kiln.
Pyroprocessingenergy costs are significantand cement manufacturersattempt to utilize the lowest-cost energy supplies to reachthe high temperaturesrequired. Many cement plantsroutinely burn a mix of fuelsin order to minimize energycosts. They are able to switchamong a variety ofconventional fuels andalternate waste fuels.
Table 3 shows thesignificant shift in fuelsources over the past thirtyyears. Cement manufacturershave switched from naturalgas and petroleum basedfuels to coal and petroleumcoke for pyroprocessing. Thisswitch was initially a resultof federal legislation in response to the “1973 Energy Crisis.” The Energy Supply andEnvironmental Coordination Act of 1974 (ESECA, Public Law 93-319) compelled “Major FuelBurning Installations” to stop burning natural gas and petroleum and to burn coal. ThePowerplant and Industrial Fuel Use Act of 1978 (Public Law 95-620) required Congressionalapproval and a waiver from the Department of Energy for the use of fuels other than coal inheating plants over 50 x 106 Btu/hr. In 1987, Public Law 100-42 amended the Powerplant and

-8-
Industrial Fuel Use Act to repeal prohibitions against the use of natural gas and petroleum. Fuelswitching is costly in terms of capital costs and today’s lower cost/Btu of coal compared topetroleum or natural gas economically favor coal as the fuel of choice.
The switch from petroleum and natural gas results in an increase in CO2 fuel emissionsper Btu consumed. Coal produces about 1.8 times more CO2 than natural gas and about 1.2 timesmore than residual oils on a Btu basis. Overall the industry has lowered their CO2 emission by15% between 1971 and 2000. This was accomplished with improvements in energy efficiencythat produced a reduction in the Btu/tonne requirement for production of cement by over 33%. Ifyear 2000 plants were operating on the 1971 fuel mix, emissions would have been lowered by21% (Appendix A Table A.9).
Kilns are ideally suited to recycling alternate/wastes for recovering their energy valuebecause of the intense heat of pyroprocessing. The cement industry has steadily increased its useof waste materials to fuel cement kilns, and currently relies on the combustion of waste materialsfor 8.2% of its energy needs. Cement plants can burn many household and industrial wastes,including waste solvents, scrap tires, used motor oils, surplus printing inks, dry-cleaningsolvents, paint thinners, petroleum sludge, and agricultural wastes such as almond shells and ricehulls.
Nearly all cement is used to produce concrete. Ready Mixed Concrete, concrete mixed atlocal plants for delivery in the familiar trucks with revolving tanks, accounts for over 75% of allconcrete production. Concrete masonry (e.g., 8 x 16 inch blocks) and precast concrete productsaccount for 13%, contractor (on-site concrete mixing) accounts for 6%, and the remaining 6% ofconcrete production is used in well lining, mining operations, and other activities.13 The UnitedStates has about 2,700 ready mixed concrete companies that operate 5,000 to 6,000 plants andutilize 70,000 to 80,000 trucks for delivery. Ready mixed companies employ between 126,000and 144,000 workers. They supplied more than 390,646,000 cubic yards of concrete in 2002,enough to build a road ten feet wide, four inches thick that encircles the globe 51 times.14

-9-
Cement
Cement is the key ingredient in concrete products. Comprising roughly 12% of theaverage residential-grade ready mixed concrete, cement is the binding agent that holds sand andother aggregates together in a hard, rock-like mass. Building cement or portland cement accountsfor about 95% of the cement produced in North America. Portland cement was patented in 1824by Joseph Aspdin, an English stonemason, and named after a quarried stone it resembled fromthe Isle of Portland.
The properties of concrete depend on the quantities and qualities of its components.Because cement is the most active component of concrete and usually has the greatest unit cost,its selection and proper use are of paramount importance in obtaining the most economicalbalance of properties desired for any particular concrete mixture. Different types of portlandcement are manufactured to meet different physical and chemical requirements for specificpurposes, such as durability and high-early strength.
The American Society for Testing and Materials (ASTM) Specification C-150 providesfor eight types of portland cement (Appendix B). ASTM standards serve as the basis formanufacturing, procurement, and regulatory activities. In 2001, more than 88% of the portlandcement produced in the United States was ASTM Type I and II (or Type I/II); Type IIIaccounted for about 3.5% and Type V accounted for 4.4% of cement production15. Air-entrainingcements Type IA, IIA, and IIIA are available but have little market share. Concrete producersprefer to use admixture for air-entraining during concrete production, where they can have bettercontrol in obtaining the desired air content.
The chemical composition of cement is what distinguishes one type from another.Portland cements are made up of clinker and gypsum (CaSO4•2H2O). The four main compoundsin clinker are: tricalcium silicate (3CaO•SiO2), dicalcium silicate (2CaO•SiO2), tricalciumaluminate (3CaO•Al2O3), and tetra-calcium aluminoferrite (4CaO•Al2O3•Fe2O3). The industrycommonly uses an abbreviated notation differing from normal chemical formulae. Thesecompounds are designated as C3S, C2S, C3A, and C4AF, where C stands for calcium oxide (CaO,lime), S for silica (SiO2), A for alumina (Al2O3), and F for iron oxide (Fe2O3). The approximatecomposition of compounds in typical portland cement is listed in Table 4.
Table 4 - Final Composition of Typical Portland Cement
Cement Compound WeightPercentage Chemical Formula Abbreviated
NotationTricalcium silicate 50 % Ca3SiO5 or 3CaO•SiO2 C3SDicalcium silicate 25 % Ca2SiO4 or 2CaO•SiO2 C2STricalcium aluminate 10 % Ca3Al2O6 or 3CaO •Al2O3 C3ATetracalcium aluminoferrite 10 % Ca4Al2Fe2O10 or 4CaO•Al2O3•Fe2O3 C4AFGypsum 5 % CaSO4•2H2O

-10-
Diagram 2 - Phase Diagram of Major CementComponents14
The industry frequently reports the composition of cement as a percentage of the rawmaterials and not as a percentage of the final compounds formed. The composition of portlandcement falls within the range of 60% to 67% lime (CaO), 19% to 25% silica (Si), 3% to 8%alumina (Al2O3), and 0.3% to 6% iron oxide together with 1% to 3% sulphur trioxide, derivedmainly from the added gypsum, 0.5% to 5% magnesia, and 0.3% to 1.3% alkalies. Titaniumoxide is usually present to the extent of 0.1% to 0.4%. Manganese oxide is usually present onlyin small amounts, except when blast-furnace slag is used as a raw material, then it may rise to1%.
The proportions of components inthe final composition results fromobtaining a phase equilibrium of allcomponents in the raw meal, ash fromfuels, and from other additions. The finalcompounds reflect the effects of kilntemperatures, residence time, quenching,oxygen availability, and many other kilnconditions. The actual final componentsare complex chemical crystalline andamorphous structures. Diagram 2 is aphase diagram of the major raw mealpyroprocess products.16 About 20% to30% of the raw materials become liquid atthe highest temperatures in the kiln. Portland cement composition is noted inone small area. Complex reactions andphase changes occur at the surfaces of thesolids and within the liquid. The behaviorof each type of cement depends on the mixture of final components.

-11-
Diagram 3 - Quarrying for Cement Limestone
CEMENT MANUFACTURING PROCESS
Cement manufacturing requires exacting measurements and careful controls to produce aproduct that meets precise chemical and physical specifications. The first step in the cementmanufacturing process is the quarrying of a combination of raw materials (Appendix A - TableA.3) that when sized, blended, and processed yield the exact chemical composition required.These raw materials then undergo a series of high temperature chemical reactions and physicalchanges after which they are ground into a very fine, carefully sized powder.
Quarrying
Generally, cement raw materialsconsisting of mainly limestone (71%) andcombinations of cement rock (16%),shale, clay, sand, or iron ore are extractedfrom a quarry near the cement plant.Limestone and cement rock are the mostcommon source of CaCO3 for cementproduction, making up about 87% of the raw materials (Appendix A - Table A3). Typically, thelimestone used in cement production contains 75% to 90% CaCO3 with the remainderpredominately MgCO3 and minor impurities. Limestone is typically categorized as high-calcium(<5% MgCO3), magnesium-limestone (5% to 20% MgCO3), or dolomitic-limestone (>20% to<45.6% MgCO3). Cement rock is impure limestone possessing the ideal balance of silica,alumina, and CaCO3 for portland cement17.
A typical limestone/cement rock quarrying process for producing crushed and brokenstone includes:• removal of the overburden (i.e., soil, clay, and loose rock overlaying the deposit)• blasting of the limestone deposit• loading and transporting the blasted limestone to the crushing plant• Crushing to reduce stone to about 5 inches (125 mm) in primary crushers, then to roughly
3/8 inch to 3/4 inch (10 mm to19 mm) in secondary crushers.
The total energy required to quarry and process limestone/cement rock is 29,932Btu/tonne. The quarrying of the limestone/cement rock consumes approximately 88% of the totalenergy requirement and the crushing of the ore accounts for the remaining 12% of the energyrequirement.18 Table 5 provides a detailed listing of the equipment used and the Btu per tonneconsumed for each equipment operation.19 Appendix A Table A.5 lists quarrying fuels andconsumption values. In the quarrying of the limestone/cement rock, diesel fuel is the main sourceof energy and provides about 80% of the quarrying operations energy. Diesel fuel is used to runthe heavy machinery in the limestone quarry’s daily operation. Utilization of biodiesel providesan opportunity for quarrying operations to lower lifecycle emission profiles.
-12-
Diagram 4 - Raw Material Preparation
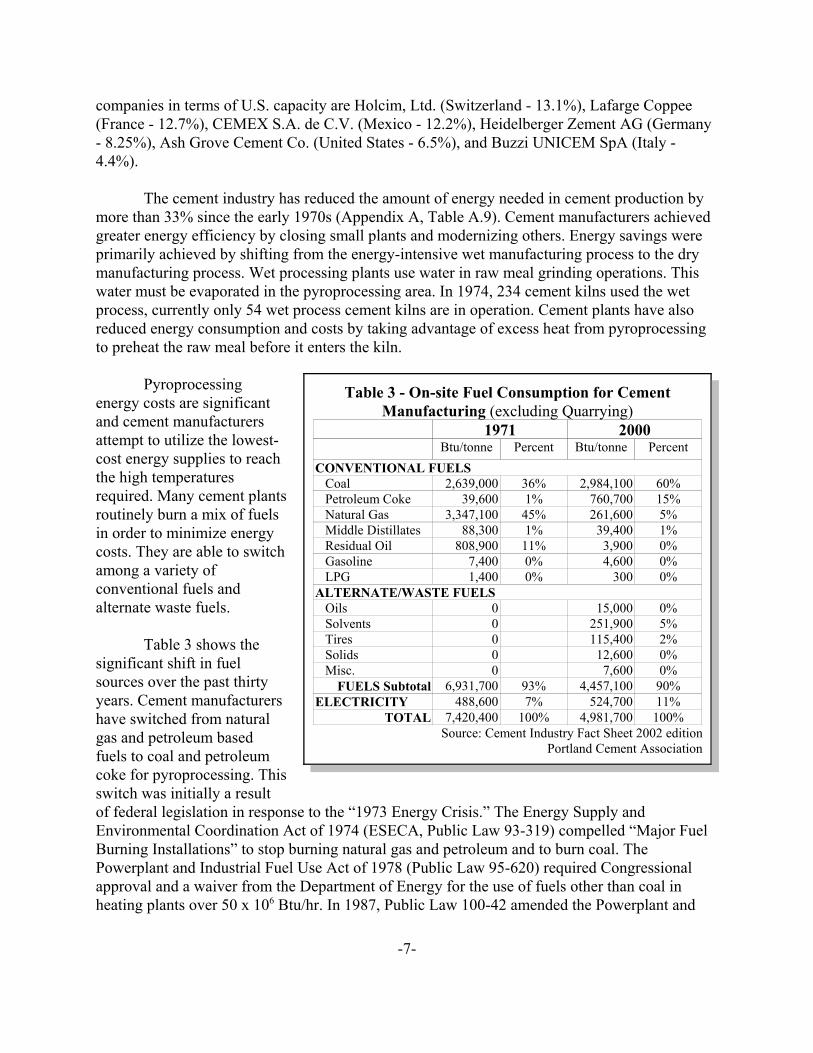
Primary crushing reduces quarried stone to about 5inches. Primary crushed stone is fed into secondarycrushers where it is broken down to a size (-0.375 to-0.75 inch) suitable for feed to the fine grinding machineslocated at the cement manufacturing plant. Crushingconsumes an estimated 2,927 Btu/tonne of limestone.
Limestone/cement rock account for 87% of theraw materials used to produce cement. The energy andemissions associated with quarrying of the remaining 13%of raw materials has been estimated using thelimestone/cement rock data (Appendix A Table A.6).
The environmental issues related to quarrying aremostly local and are common to most surface mines.These issues include dust, increased sediment loads tolocal streams, noise, and ground vibrations from blasting. Raw Material Preparation
When raw materials arrive at the cement plant,they are stored in dry sheds or silos. These materials arethen carefully proportioned accounting for combustionfuel ash and other additives to create a cement with aspecific chemical composition. Two different methods,dry-process and wet-process, are used to grind rawmaterials. In the dry-process, raw materials areproportioned, ground to a powder, blended together andfed to the kiln in a dry state. In the wet-process, a slurry isformed by adding water to the properly proportioned rawmaterials. The grinding and blending operations are thencompleted with the materials in slurry form. Thissignificantly lowers dust levels butrequires additional energy to laterremove the water from the raw meal.
Limestone, -0.375 inch to -0.75inch in size, is blended with other rawmaterials (Appendix A Table A.3) andfed into grinding mills where it isreduced in size until approximately 70%to 85% passes a 200-mesh screen(0.0027 inch, 0.069 mm screenopening). Raw meal grinding equipment
On-siteOperations
Btu/Tonne
QUARRYINGPercussion Drill 6,140
Hydraulic Shovel 5,670Rear-Dump Truck 4,030
Bulldozer 3,420Pick-Up Trucks 2,250
Water Tanker 1,170Service Truck 1,120Lighting Plant 66
Front-End Loader 187Bulk Truck 147
Pumps 2,250Grader 7
subtotal 26,457CRUSHING
Conveyor 182Screens 366
Primary Crushers 1,830Secondary Crushers 1,097
subtotal 3,475TOTAL 29,932
Source: U.S. Department of Energy,Mining Industry of the Future, Energyand Environmental Profile of the U.S.Mining Industry, pg. 9-9.
Table 5 - Energy Consumptionfor Surface Limestone Quarrying

-13-
Diagram 5 - Preheater Precalciner Kiln
includes: ball mills, tube mills, compound mills, ring roll mills, and impact mills. Raw mealgrinding has a significant effect on pyroprocessing and clinker quality. The raw meal quality(fineness, the amount and nature of oversized particles), and flowability (kiln circulating andseparation patterns, and conductive energy transfer) affect the final clinker quality.
Raw material grinding consumes about 2% of the on-site energy associated with cementmanufacturing. Grinding and milling are electrically driven processes. In addition to theelectricity consumed on-site, electric processes have large tacit energy requirements associatedwith the generation and transmission of electricity. Grinding raw materials for cementmanufacturing consumes approximately 93,885 (273,235t) Btu/tonne of cement (Appendix ATable A.11). Grinding energy is a function of numerous factors including how the materialfractures (under slow pressure, under impact), compressive strength, coefficient of elasticity,hardness, starting and finish size, desired particle distribution, etc. The exact amount of workrequired for grinding is difficult to calculate. Grinding efficiency ranges from 6% to 25% basedon the thermal measurements.20 Since grinding consumes electricity, a costly energy source,cement manufacturers work to improve grinding efficiency. On-site grinding efficiencyimprovements provide significant offsite energy savings related to electric generation andtransmission losses.
Kiln Operations
Pyroprocessing in giant rotating furnaces or kilns represent the major technical processcommon to all cement plants. It is also the most technically complex and energy-intensiveoperation from quarrying to concrete placement. Rotary cement kilns are cylindrical, refractory-lined steel furnaces that range from 200 to more than 1,000 feet long and from 10 to over 25 feetin diameter. Cement kilns are the world’s largest piece of moving industrial process equipment -and one of the hottest.
Blended raw material is fed into the upper end of the tilted rotating kiln. As the kilnslowly rotates (1 to 4 revolutions per minute), the raw material tumbles through progressivelyhotter zones toward the flame at the lowerend of the kiln. The mixture passes at arate controlled by the diameter androtational speed of the kiln. The flame isfueled by powdered coal, petroleum coke,natural gas, oil, recycled materials, orother fuels. A 1870°C (3400°F) flameheats the mixture to 1480°C (2700°F).The extreme heat triggers a series ofchemical reactions. The raw materialsbreak down (calcine), become partiallymolten, and fuse together into nodulescalled "clinker."

-14-
The raw meal undergoes complex chemical and physical changes as it tumbles, thenflows, through the kiln. These chemical reactions and changes can be viewed as a sequence ofthermal events, some of which may occur outside the kiln in a preheater and/or precalcinersection. The following describes the sequence of chemical and physical changes:
• Evaporation of uncombined water from raw material preparation in thewet process as material temperature increases to 100/C (212/F).
• Dehydration: the evolution of bound water from the material astemperatures increase from 100/C to approximately 550/C (1,020/F) toform the unhydrated oxides of silicon, aluminum, and iron.
• Calcination of the calcium carbonate (CaCO3) to calcium oxide (CaO) andmagnesium carbonate (MgCO3) to magnesium oxide (MgO) with theevolution of carbon dioxide (CO2) between 900/C (1,650/F) and 980/C(1,800/F). The CO2 gas fluidizes the raw materials, which changes rawmaterial movement from tumbling to flowing.
• Reaction of CaO with silica to form dicalcium silicate.• Reaction of CaO with the aluminum and iron-bearing constituents to form
the liquid molten phase.• Formation of the clinker nodules. Reactions bonding the calcium oxide
and silica oxide to form dicalcium and tricalcium silicates, and smallamounts of tricalcium aluminate and tetracalcium aluminoferrite. Thesecompounds form the four principal components that determine theproperties of the cement manufactured.
• Evaporation of volatile constituents (e.g., sodium, potassium, chlorides,and sulfates).
• Reaction of excess CaO with dicalcium silicate to form tricalcium silicate.• Formation of clinker as material approaches the exit of the kiln at
temperatures of approximately 1,500/C (2,700/F).
Clinker is discharged red-hot from the lower end of the kiln and transferred to varioustypes of coolers to recover thermal energy and lower the clinker to handling temperatures.Clinker, when cooled, is typically gray, glass-hard, spherically shaped nodules that range from0.3 to 5.0 centimeters (0.125 to 2.0 inches) in diameter.
Kilns are divided into two groups, dry-process (80.5% of U.S. capacity) and wet-processdepending on how the raw materials were prepared. Wet-process kilns are fed raw material as aslurry with a moisture content of 30% to 40%. A wet-process kiln needs additional length toevaporate the water contained in the raw material feed. Nearly 33% additional kiln energy isconsumed in evaporating the slurry water. Wet-process kilns tend to be older fully capitalizedoperations. The last wet-process kiln to be built in the United States was constructed in 1975.
Dry-process kilns are fed dry powder raw materials. Three major variations of dry-process kilns are in operation: no-preheater kiln, preheater kiln, and precalciner kiln. Dry-process kilns operate with high exiting gas temperatures. In most dry-process no-preheater

-15-
Diagram 6 - PreheaterPrecalciner Section
operations the kiln is equipped with metal chain sections at thegas exit end. These chains hang from the refractories in the gaspath. The gases pass through the chains, which absorb heatfrom the gas stream. As the kiln rotates, the chains intermix andbecome covered by the feed raw materials at the bottom of thekiln. The chains transfer their thermal energy by conduction tothe raw material entering the kiln.
Most dry process plants preheat the finely ground rawmaterial before it enters the kiln. The preheating takes placetypically in a tall tower consisting of multistage countercurrent-flow cyclones, Diagram 6. These towers can be over 450 feettall. Multiple solid/gas cyclone heat exchangers swirl the rawmaterials with the hot exit gases from the kiln and heat themquickly and efficiently. Some preheater towers include a specialpreheater section which contains a fuel combustion chamber.These sections provide some of the precalciner energy and arereferred to as precalciner.
Today, the most common type of cement kiln(accounting for 80% of capacity in the United States) is a dry-process kiln, in which the rawmeal is processed dry. Many older kilns (20%) still in operation use the wet-process. Table 6provides an inventory of U.S. cement kilns. Each kiln, wet-process and the three versions of dry-process, operate with a different energy efficiency. The theoretical energy requirement forpyroprocessing (i.e., the minimum energy required to remove hydrated water, calcine, and raisethe temperature to obtain the phases necessary for cement clinker) is about 1,710,000 Btu/tonneof clinker.21 The thermal efficiencies for various kiln processes are also shown in Table 6. Onaverage, pyroprocessing operations run at about 34% thermal efficiency. This leaves ampleopportunities to improve thermal performance. The last chapter of this report, Opportunities forImproving Energy Efficiency and Reducing CO2 Emissions, and in particular Table 9, examinesthe thermal balance of the kiln and kiln losses and suggests where efficiency improvement couldhave a major impact.

-16-
Diagram 7 - Clinker and Gypsum Milling
Table 6 - Approximate Energy Consumption in U.S. Kilns by Number and Process
U.S.Kilns1
Percentof Kilns
2000 ClinkerProduction,
tonnes
Percent ofU.S.
Capacity
MillionBtu pertonne 3
PercentThermal
Efficiency
Total U.S. Kilns 192 100% 71,860,0002
100% 4.98 34%
Wet Process Kiln Plants 54 28.4% 14,030,0002
19.5% 6.25 27%
Dry Process Kiln Plants 136 71.6% 57,830,0002
80.5% 4.67 37%
No Preheater or Precalciner 59 31.1% 12,950,0002
18.0% 5.64 30%
Preheater (only) 35 18.4% 13,830,0002
19.2% 4.58 37%
Precalciner 42 22.1% 31,050,0002
43.2% 4.31 40%
Preheater/Precalciner 4 77 40.5% 44,880,0002
62.4% 4.39 39%
1 - Kiln process types were provided by the Portland Cement Association. Two kilns were notclassified and are not listed as wet or dry process kilns. These data represent approximately 92% ofU.S. clinker production and about 93% of U.S. kilns (Appendix A Table A.1).2 - 2000 U.S. and Canadian Labor-Energy Input Survey, Portland Cement Association, pages 12-273 - 2000 U.S. and Canadian Labor-Energy Input Survey, Portland Cement Association, page 74 - Includes plants that are preheater only, precalciner only and combinations
Clinker Cooling
Red-hot clinker tumbles from the kiln onto a grate and is cooled by recirculating air. Thehot air recovered from this cooling process is recycled back to the kiln or preheater system torecover its thermal energy. After energy is recovered from the process gases, the gases are routedto pollution control devices. Electrostatic precipitators or fabric filters remove particulate matter(dust) from the gases before they are discharged to the atmosphere. Particulate removalefficiencies of 99.7 % are common throughout the industry.
Cement Milling
Cooled clinker is combined withapproximately 3% to 6% gypsum andground/milled into an extremely fine graypowder. This fine gray powder is cement.Gypsum is used to control the setting time ofconcrete.
Finish milling usually uses tube or ballmill equipment. Clinker is milled so finely

-17-
that nearly all of it passes through a 200 mesh (0.0027 inch, 0.069 mm) screen that will holdwater. The final powder has a surface area of 3,000 to 5,000 cm2/g and about 85% to 95% of thepowder will pass through a 325-mesh screen (0.0017 inch, 0.043 mm). The fineness of thecement is an important property and affects the rate of hydration. The finer the milled cement,the more surface area is available for hydration. The greater area for hydration causes greaterearly strength and more rapid generation of heat. Cements are classified by their fineness withType III containing a more finely milled cement than Type I cement.
Clinker milling uses the same general type of equipment as raw meal grinding. However,the final product is much finer and requires almost three times the energy 270,610 (778,043t)Btu/tonne of cement as raw meal grinding requires (Appendix A Table A.11). Clinker milling isnot energy efficient and typical cement milling systems can consume nearly twenty times theirtheoretical energy requirement.22 After milling, portland cement is ready to be bagged or shippedin bulk by truck or rail to concrete producers.
Storage and Dispatch
Cement is stored at the cement manufacturing facility or a cement terminal until it isshipped to a customer. Storage of bulk cement is in watertight bins or silos. About 40% ofmanufactured cement is shipped by rail and barge to directly to terminals. Direct customershipments are predominately made by truck. All transportation vehicles should be equipped withwatertight, properly sealed compartments. Cement is very moisture-sensitive and must be storedin a dry environment. When kept dry it will retain its quality indefinitely. If stored in contactwith damp air or moisture, cement will set more slowly and have lower concrete strength thandry cement. Cement stored for long periods of time should undergo standardized tests forstrength and loss on ignition before use.

-18-
Table 7 - Typical Concrete Mix Component Weight % Portland cement 12% Sand 34% Crushed stone 48% Water 6%
Source: National Ready Mix ConcreteAssociation
Diagram 8 - Concrete ProductionConcreteConcrete is produced by mixing
cement with fine aggregate (sand), coarseaggregate (gravel or crushed stone), andwater. Small amounts of chemicals, calledadmixtures, are frequently added to theconcrete mix to control setting time andplasticity. A properly designed concretemixture will possess the desired workability for the fresh concrete and the required durabilityand strength for the hardened concrete. Typically, a concrete mix is by volume about 10% to15% cement, 60% to 75% aggregates and 15% to 20% water. Entrained air bubbles in manyconcrete mixtures may also take up another 5% to 8% of the volume. Table 7 shows a typicalweight percent mix. The character of concrete is determined by the quality of the cement and themix ratios. Higher-quality concrete is produced by lowering the water-cement ratio as much aspossible without sacrificing the workability of fresh concrete.
When water is added to the concrete mix, it combines with the cement to form a slurry orgel that coats the surfaces of the aggregate and fills the voids of the concrete mix. The water andcement compounds undergo hydration reactions that slowly form the complex hydratedmicrostructure that sets the concrete and makes it solid.These reactions continue after the concrete is set andare not complete for months (and even years) afterplacement. The microstructure of the cement hydratesdetermine the mechanical behavior and durability of theconcrete.
The strength developed in concrete depends onits composition and the fineness to which the cement isground. Cements high in C3S (3CaO•SiO2), especiallythose that are finely ground, will hydrate more rapidlyand lead to higher early strength. However, rapidhydration can lead to a lower final strength. C3S is mainly responsible for the strength developedin the first week of hardening. Cements high in C2S (2CaO•SiO2) will hydrate much moreslowly, leading to a denser structure with higher long-term strength. The alumina and ironcompounds in cement make little contribution to final strength.
Concrete can deteriorate from attack by some natural or artificial chemicals. The aluminacompound C3A (3CaO•Al2O3) is the most vulnerable to chemical attack in damp soils containingsulphate salts or in seawater, while the iron compound C4AF (4CaO•Al2O3•Fe2O3) and the twocalcium silicates (C3S and C2S) are more resistant.
Cement liberates heat when it hydrates. Consequently, concrete placed in large masses,as in dams, can cause the temperature inside the mass to rise as much as 72°F (40°C) above theoutside temperature. Subsequent thermal stresses when cooling cause cracking in the concrete

-19-
structure. The highest heat of hydration is shown by C3A, followed in descending order by C3S,C4AF, and C2S.
Ready mixed concrete consisting of cement, aggregates, water, and admixtures mixed atlocal plants for delivery to a work site by truck accounts for over 75% of all concrete production.Concrete masonry (e.g., 8 x 16 inch blocks) and other precast concrete products (e.g., pipes)account for 13%, contractor (on-site concrete mixing) accounts for 6%, and the remaining 6% ofconcrete production is used in well lining, mining operations, and other activities.
Ready mixed facilities store, convey, measure, and discharge cement, aggregates andadmixtures into trucks for transport to a job site. These facilities typically receive raw materialsby rail, truck, or barge. Cement is transferred and stored in elevated dry-storage silos. Sand andcoarse aggregate are stored and transferred to elevated bins as needed. The raw materials aretypically fed by gravity into weigh hoppers, where they are proportioned in the exact amountsspecified for the concrete mix. Approximately 75% of ready mixed concrete is “transit mixed.”Transit mix trucks are loaded with sand, aggregate, cement, and water by gravity from weighhoppers. The materials are mixed and blended in a rotating truck mounted drum while beingtransported to a work site. About 25% of the ready mixed concrete is blended at the ready mixedfacility. The premixed and blended concrete is placed in open bed dump or agitator trucks fortransport to a work site. Dry batching, with concrete mixed and hauled to the construction sitedry is uncommon.
The water, sand, and gravel or crushed stone used in ready mixed concrete production areabundant and usually sourced as close to the ready mixed plant as possible. The distance andquality of the sources have an impact on transportation energy use (costs), water use forwashing, and dust generation. The energy consumed for ready mixed concrete production areassociated mostly with three operations (Appendix A Table A.13):
• Quarrying (fine and course aggregates) 160,700 Btu/tonne cement• Mixing and blending (cement, aggregates and admixtures) 353,700 Btu/tonne cement• Transporting the concrete mix to the work site 697,300 Btu/tonne cement
Ready mixed concrete production from U.S. manufactured cement is estimated to haveconsumed about 117.7 x 10¹² Btu in 2001, approximately 1,211,700 Btu/tonne of cement(Appendix A Table A.13).
Concrete block, pipe and other precast products follow the same production steps(quarrying and blending) as ready mixed concrete, but are cast at a manufacturing site and thentransported to the work site. Hence, the total energy requirement for precast product is similar toready mixed. The difference between the two products is location of where the concrete sets.Likewise contractor, well-lining concrete operations, and mining concrete all transport quarriedaggregates and then blend on the work site. These operations result in overall energy use andemissions similar to ready mixed concrete. For simplicity, this report uses the ready mixedenergy use and emissions data to calculate values for all industrial concrete products. Hence, in

-20-
total, the quarrying, mixing, and transportation operations account for 2.6% (14.3 x 10¹² Btu/yr),5.7% (31.4 x 10¹² Btu/yr), and 11.2% (62.0 x 10¹² Btu/yr), respectively, of the on-site energy usefor all cement and concrete (Appendix A Table A.10).
CO2 emissions associated with concrete production can be calculated based on the fuelsused. The three major concrete operations, quarrying, blending, and transportation, account for1.2%, 5.4%, and 4.3% respectively, a total of 10.9% of the CO2 emissions associated with bothcement manufacturing and concrete production (Appendix A Table A.10). CO2 emissions forconcrete relative to energy usage are smaller than for cement manufacturing, which producesCO2 from both reaction chemistry and fuel use.

-21-
Table 8 - Annual Energy Use and CO2 EmissionsAssociated with Cement and Concrete Production
On-site Energy CO2 Emissions
109 Btu % 106 tonne %
RAW MATERIALS: QUARRYING and CRUSHING
Cement Materials 3,817 0.7% 0.36 0.3%
Concrete Materials 14,287 2.6% 1.28 1.2%
CEMENT MANUFACTURING
Raw Grinding 8,346 1.5% 1.50 1.4%
Kiln: fuels 410,464 74.0% 38.47 36.8%
reactions 48.35 46.3%
Finish Milling 24,057 4.3% 4.32 4.1%
CONCRETE PRODUCTION
Blending, Mixing 31,444 5.7% 5.65 5.4%
Transportation 61,933 11.2% 4.53 4.3%
TOTAL 554,409 100% 104.50 100%See: Appendix A Table A.10
Opportunities for Improving Energy Efficiency and Reducing CO2 Emissions
Many opportunities exist for improving energy efficiency and reducing CO2 emissions inthe cement/concrete industry. These opportunities come from both changes in the manufacturingand production processes and from changes in the chemical formulation of cement. Processchanges range from energy management improvements to investments in equipment upgrades ornew technologies. Formulation changes have been demonstrated to save energy and reduceemissions but their widespread adoption is slowed by the burdens of developing new industrialstandards.
The largest opportunities for improving energy efficiency and reducing CO2 emissionsrelated to energy inputs in the cement/concrete industry are mostly related to cementmanufacturing. Table 8 lists the annual energy use and emissions associated withcement/concrete industry. Pyroprocessing accounts for 74% of the cement/concrete industries’energy consumption (93% of cement’s manufacturing energy requirement) and operates atroughly 34% thermal efficiency. This low thermal efficiency provides many opportunities toimprove performance. If it were possible to operate at the theoretical minimum energyrequirements to produce clinker, nearly 400 x 1012 Btu per year (0.4 quad) in energy savingscould be obtained. Realisticand cost-effective energysavings are smaller, butachievable.
Grinding and millingaccount for 5.8% (12.3t%) ofcement/concrete energyconsumption. These operationsconsume electricity and haveenergy efficiency ranging from6% to 25%. They offer a largeopportunity for energyreduction considering that eachkWh saved on-site saves nearly3 kWh of tacit energy at theelectric generation site.
The potentialopportunities for improvingenergy efficiency and loweremissions in quarrying andconcrete production are smallerin terms of Btu and CO2emissions than in cementmanufacturing. Quarrying and

-22-
transportation related to concrete production consume significant quantities of diesel fuel,approximately 74 x 1012 Btu/year ( 550 x 106gallons). Replacement of diesel fuel with biodieseloffers an opportunity to effectively lower lifecycle emission profiles. Biodiesel is a renewableenergy fuel source, typically containing the mono alkyl esters of long-chain fatty acids derivedfrom vegetable oils (commonly soybean oil) or animal fats. It can be blended at any level withpetroleum diesel to create a biodiesel blend and can be used in compression-ignition (diesel)engines with little or no modifications. It has lower emissions compared to petroleum diesel, isless toxic than table salt, and bio-degrades as rapidly as sugar. Total U.S. production of biodieselwas 25.4 x 10⁶ gallons in 2001.23 Total U.S. production represent only 4.6% of the diesel fuelrequirement of the cement/concrete industry. Hence biodiesel availability will limit theopportunity to substitute for petroleum based diesel fuel.
Normally, energy efficiency improvements proportionally reduce the emissions of CO2generated from fossil fuel combustion and electricity generation. However, reducing cementmanufacturing CO2 emissions by a percentage proportional to energy efficiency improvements isnot possible. More than half of the CO2 emissions associated with cement/concrete are a result ofthe chemical reactions necessary for converting raw materials and not a result of the energyrequired to produce these reactions. If a near-zero CO2 emitting fuel (e.g., nuclear, biomass)were utilized for all pyroprocessing energy needs, then CO2 emissions could be reduced by 54%,from approximately 104 x 106 tonnes/yr to 48 x 106 tonnes/yr. It is also possible to reducereaction CO2 emissions by changing the product formulation with the substitution of rawmaterials, which provide cement-like properties.
The opportunities for reducing energy usage and lowering environmental impact aredescribed in the Pyroprocessing and Product Formulations sections below. Briefly, theseimprovements will come from:
• Managing energy more efficiently< performing energy assessment/audits, utilizing energy
management training, and implementations programs• Upgrading existing equipment
< shifting to more energy-efficient processes (e.g. from wet to dryprocess, from dry process to preheater)
< installing improved heat recovery systems from clinker coolers< installing new design high-efficiency crushing, grinding, and
milling equipment• Adopting new pyroprocessing technologies• Performing the R&D necessary to develop new cement manufacturing
processes• Utilizing biomass fuels• Utilizing waste fuels • Replacing high-carbon fuels by low-carbon fuels (e.g. shifting from coal
to natural gas) (This lowers CO2 emissions, however at current fuel pricesit increases operating costs.)

-23-
• Changing cement product formulations, applying a lower clinker to finalcement mixture ratio (i.e., increasing the ratio of cement additives that donot require pyroprocessing)
• Utilizing alternative cements (mineral polymers)• Sequestering CO2 from the gas streams
Cement manufacturing is a highly capital intensive and competitive industry. This factcombined with the long economic life of existing facilities will constrain the rate of upgradingexiting technology or adopting new technology. The near-term energy and emission-reductionopportunities will mainly come from better energy management practices, changes to “greener”fuels, and, to a smaller degree, changes in product formulation.

-24-
PYROPROCESSING OPPORTUNITIES
The greatest opportunities in reducing energy consumption and lowering emissionsassociated with cement/concrete will be obtained with improvements in cement pyroprocessing.On average, pyroprocessing systems in the United States operate at about 34% thermalefficiency. This low efficiency implies that there are potentially significant process and systemimprovements to improve energy and environmental performance. These process improvementswill come from better energy management, upgrading existing equipment (e.g., replacing wetkilns, upgrading to preheater and precalciners), adopting new pyroprocessing technologies (e.g.,fluidized bed systems) and, in the longer term, performing the R&D necessary to developcompletely new concepts for the cement manufacturing processes.
The typical energy balances for the major pyroprocessing systems are shown in Table 9.These balances show where energy losses occur (areas where no useful work is accomplished).Any area, other than the theoretical requirement, that is losing energy represents an
Table 9 - Thermal Energy Balances to Produce Clinker in Process Kilns
Wet Kiln Dry Kiln Preheater Kiln
Energy Use Area Btu/tonne Percent Btu/tonne Percent Btu/tonne Percent
Theoretical Requirement 1,690,000 30.5 1,730,000 36.6 1,670,000 49.6
Exit Gas Losses 713,000 12.9 1,310,000 27.7 471,000 13.8
Evaporation of Moisture 2,120,000 38.3 285,000 6.0 223,000 6.5
Dust in Exit Gas 10,700 0.2 12,300 0.3 1,220 0
Clinker Discharge 53,700 1.0 58,000 1.2 62,400 1.8
Clinker Stack 180,000 3.3 560,000 11.8 582,000 18.4
Kiln Shell 642,000 11.6 575,000 12.1 166,000 4.9
Calcination of WasteDust
38,600 0.7 17,500 0.4 5,870 0
Unaccounted Losses 84,300 1.5 182,000 3.8 164,000 4.8
TOTAL 5,536,000 100 4,734,000 100 3,424,000 100
Source: The Rotary Cement Kiln, Kurt E. Perry, Chemical Publishing Co., Inc., New York, page 107-111
opportunity for improving energy efficiency and lowering fuel-based emissions. The largeenergy efficiency difference between cement processes, from 5,536,000 Btu/tonne of clinker forwet process to 3,424,000 Btu/tonne of clinker for dry process with preheater, shows thesignificant gains that can be made by upgrading to the more efficient process. The individualenergy use areas (e.g., clinker discharge, kiln shell, etc) in Table 9 show the area and themagnitude of the opportunities available from managing energy losses by improving specific

-25-
equipment or practices.
Pyroprocessing Energy Audits
Energy audits, including kiln system performance testing and calculation of mass and heatbalances, are the most comprehensive approaches to improving an existing system's energyefficiency. These audits can identify specific opportunities for improving energy efficiency andlowering CO2 emissions. A cement manufacturing energy audit should at a minimum address theenergy use areas identified in Table 9 and recommend potential actions. Typically the followingactions will improve energy efficiency.
< Lower kiln exit gas losses• install devices to provide better conductive heat transfer from the
gases to the materials (e.g., kiln chains)• operate at optimal oxygen levels (control combustion air input)• optimize burner flame shape and temperature• improve or add additional preheater capacity
< Lower moisture absorption opportunities for raw meal and fuels (avoidingthe need to evaporate adsorbed water)
< Lower dust in exhaust gases by minimizing gas turbulence (dust carriesenergy away from the kiln where it is captured in dust collectors. The dustis recycled into the raw meal and fed into the kiln where it is reheated.)
< Lower clinker discharge temperature (retaining more heat within thepyroprocessing system)
< Lower clinker cooler stack temperature• recycle excess cooler air• reclaim cooler air by using it for drying raw materials and fuels or
preheating fuels or air
< Lower kiln radiation losses by using the correct mix and more energyefficient refractories to control kiln temperature zones
< Lower cold air leakage• close unnecessary openings• provide more energy efficient seals• operate with as high a primary air temperature as possible
< Optimize kiln operations to avoid upsets
Upgrading Existing Technology – The addition of preheater sections, precalcination sections, or

-26-
more efficient clinker coolers would allow less efficient operations to maximize heat recovery.The impact of upgrading can be seen by comparing the processes shown in Table 6. If all U.S.plants upgraded pyroprocessing to the technology of the best U.S. plant (a dry process, preheaterwith precalciner system3 ), the industry would lower its energy consumption by approximately30% to approximately 3,230,000 Btu/tonne of cement and lower CO2 emissions by 13% to 75.3x 10⁶ tonnes/year.
Adopting New Technology – Large pilot-scale fluidized-bed kilns (200 tonnes/day) have beendeveloped (1996) and have demonstrated significant energy savings. It is estimated that a full-scale fluidized-bed (3,000 tonnes/day) system will consume about 2,800,000 Btu/tonne ofclinker – as efficient as the most advanced U.S. kiln utilizing a preheater and precalciner and37% more efficient than the average U.S. plant. Fluidized-bed systems are estimated to havecapital costs equivalent to 88% of the capital costs of a modern cement facility and operatingcosts equivalent to 75% of a modern cement facility’s operating costs.24 They have smallerfootprints and their superior combustion characteristics of fluidized beds enable the use of lower-grade, lower cost coal.
Fluidized-bed systems do not provide “Shutdown Economics.” That is, their operatingand capital costs are not less than the operating costs of older, fully capitalized kiln-based plants.This slows their adoption by the industry, since they are likely to be considered only for futurecapacity expansion. The U.S. cement industry currently operates at an average 80% kilnutilization rate25. Another barrier to adoption is the natural reluctance to invest in the largecapital expenditures associated with new plant construction. The risks associated with building anew technology commercial-scale plant, based on the successful demonstration of a one-tenthscale facility, are considered high.
Cogeneration – Large industrial thermal energy demand offers opportunities for cogeneration ofelectricity and/or steam production, particularly if the cogeneration system is part of the initialplant design. Cogeneration has demonstrated that it can significantly improve the overall energyefficiency of some manufacturing operations. Five cement manufacturing plants cogenerateelectricity on-site.26 Currently, about 38% of U.S. cement capacity does not take advantage ofpreheater and/or precalciner systems. These plants typically have large heat losses (waste heatstreams). Utilization of waste heat in preheater heat exchange systems is usually more energyefficient than the cogeneration of electricity with its inherently low conversion efficiency ofthermal to electrical energy (typically about 9,935 Btu are required to produce 1 kWh (3,412Btu)). Cogeneration of steam at a cement plant is possible, but typically cement plants requirelittle steam and are located in isolated areas where markets for excess steam generation are notavailable.
Biomass Fuels – Trees, plants, and crops (biomass) incorporate (sequester) CO2 as carboncompounds as they grow. On a life-cycle basis, where the life-cycle includes both the growthphase and the use phase (combustion), there is a near net-zero emission of CO2 associated withthe use of biomass fuels (Net life-cycle emissions are not zero, because energy is used to gather,increase density, reduce moisture, deliver, and store biomass fuels). Therefore the use of biomass

-27-
fuels for pyroprocessing can provide energy with low-net CO2 emissions.
Cement pyroprocessing is suited to utilizing biomass as an ancillary fuel. Careful systemdesign is required to account for biomass combustion characteristics (moisture load, flowability,burn temperature,...) and byproducts (ash composition). Biomass fuels do not improve energyefficiency per se, however they do replace conventional fuels and lower life-cycle CO2emissions. Burning biomass fuels can offer other indirect benefits:
< U.S. dependence on imported fuels is reduced,< crops grown exclusively for energy production can provide economic
opportunity for underutilized agricultural lands,< energy crops require fewer herbicides and pesticides compared to row
crops, and< chemical runoff into surface water and groundwater is reduced.
An additional benefit of burning biomass over fossil fuels is the reduction of sulfurdioxide (SO2) emissions. Most forms of biomass contain small amounts of sulfur; therefore,biomass being burned emits little sulfur dioxide (SO2). For example, using biomass for 5% of acoal-fired heat input would reduce SO2 emissions by approximately 5%. This benefit may not befully realized in cement kiln operations. Limestone in the cement kiln’s raw meal acts as anatural SO2 scrubber resulting in low SO2 emissions. Hence biomass fuels will not significantlychange the SO2 emissions associated with cement kiln operations.
Alternate/Waste Fuels – Utilization of alternate/waste fuels does not directly improve the energyefficiency or lower the CO2 emissions of cement manufacturing. However, it does reduce the useof conventional fuels, lowers U.S. dependence on imported fuels, and reduces waste materialsent to landfills. Depending on the alternate/waste fuel used it can be argued that there are realindirect energy savings and emission reductions. Placing a quantitative value on these indirectenergy savings and emission reductions however is problematic.
Cement pyroprocessing is currently used for and highly suited to the disposal of alternateor waste fuels, such as used solvents, oils, tires, carpets, and other hazardous wastes (see fuelmix, Table 3). In the case of many hazardous wastes, cement pyroprocessing is moreadvantageous than commercial incinerators. Time, temperature, and turbulence are the threemost important factors to ensure the destruction of organic and/or hazardous organic wastes.Cement pyroprocessing systems have a high degree of mixing, have long gas residence times,and burn hotter (30% higher than the temperatures in a commercial hazardous waste incinerator)than a typical thermal waste treatment facility. Cement kilns are very large and have a high heatcapacity. Temperatures cannot change quickly due to process "upsets," ensuring that wastedestruction is complete. Limestone also acts as a natural "dry scrubber" inside the kiln to capturechlorine and sulfur compounds, as well as some metals. Organic materials are completelycombusted. Cement kilns easily achieve a Destruction and Removal Efficiency of at least 99.99percent, as required by U.S. Environmental Protection Agency regulations for most organicwastes. However, care must be taken for high volatile elements (i.e., mercury, thallium, etc.).

-28-
Kilns operate with a temperature profile along their length that controls the sequence ofkiln reactions and phase changes. Waste materials combust and burn at different temperaturesunder different conditions. Solid waste fuels need to be introduced into the kiln in such a manneras to not significantly change the temperature profile and chemical reactions. It is sometimesnecessary to add solid waste through a hatch or valve structure in the kiln shell. This istechnically challenging and creates an additional source of thermal and emission losses.
Receiving and handling of alternate or waste fuels can raise technical, liability, andpolitical concerns. Cement manufacturing companies do not desire to be labeled as handlers ofhazardous wastes and surrounding communities have valid concerns about hazardous wastetransport and final emissions. These concerns can be difficult to address and in some cases areperceived as a financial liability to the cement manufacturer.
GRINDING AND MILLING OPPORTUNITIES
Grinding and milling operations are notoriously energy inefficient. Typical systemsroutinely run at 6% to 25% on-site energy efficiency.17 Although these systems do not accountfor a large portion of the on-site energy consumption profile of a cement plant, they do offersignificant opportunities for energy improvement. Raw material grinding and finish mill systemsshould be evaluated for both efficiency of energy usage and cement quality. Modern finish millsystems may comprise several units of process equipment – high-pressure, twin-roll presses, tubemills, ball mills, and conventional or high-efficiency separators. Air flow, and material and heatbalances should be measured and evaluated. Optimization of these systems may include:
< Adjustment of ball charges< Studies of circulating loads< Analyses of Tromp curves< Modifying particle size distribution< Controlling gypsum dehydration

-29-
PRODUCT FORMULATION CHANGES TO IMPROVE ENERGYEFFICIENCY
Energy efficiency improvements and emission reductions can also result from changes inthe Product Formulation of cement. Research has shown that energy-saving modifications arepossible without a loss in concrete performance. These modifications include the addition oflimestone and other cement-like materials (e.g., fly ash, furnace slag, or other pozzolanicmaterials) that do not require the large energy inputs and emissions associated withpyroprocessing.
Changes to cement product formulations require significant time to be incorporated intoASTM standards and be accepted in the marketplace. An ASTM committee (C01.10) isconsidering a proposal to allow 5% limestone in portland cement. This formulation is supportedwith over thirty years of research and 20 years of field experience that confirms that thisformulation change meets all chemical and physical property requirements. Current European(EN197) and Canadian (CSA A5) specifications allow this formulation. This change in productformulation results in roughly a 5% decrease in energy use and a 2.6% reduction in CO2emissions. Concrete producers specify cement based on ASTM standards in order to guaranteethe performance characteristics of concrete. Changes to these formulations are perceived as“risky” because change represents a move away from standards that have a long and well-documented performance history.
Pozzolan
Materials that can be added to cement to extend its volume without a significant loss ofproperties are known as “pozzolans.” They are named after the ash deposits adjacent to thePozzol volcano that the Romans used as cement. The Pantheon in Rome is a testament to thehigh strength and durability of pozzolan cement. Its hemispherical dome, 141 feet (43 meters) indiameter, is made completely from pozzollan cement and does not contain any reinforcing bars. It has been in use since 135 A.D. (for comparison the U.S. Capital dome is 96 feet in diameter)
The addition of pozzolan to cement will modify its characteristics. Depending on thetype of pozzolan chosen, the density and compressive strength of the formed concrete may beincreased and porosity reduced. Pozzolanic materials can combine with uncarbonated lime(calcium hydroxide) to form stable compounds, thus reducing the risk of early leaching or frostdamage and increasing the potential durability of the mortar.
Pozzolan materials, in general, do not require pyroprocessing and, hence, can save verysignificant quantities of energy and lower emissions when supplementing regular cement.Concrete research is now calling for increased usage and high-volume usage of pozzolans,especially fly ash. Some have suggested that all concrete should contain fly ash 27. The economicand environmental advantages of adding pozzolan would seem to indicate that their regular andhigh-volume use will become standard practice in the concrete industry. The U.S. EnvironmentalProtection Agency requires fly ash content in concrete to be used in buildings that receive

-30-
federal funding.
Coal-fired power fly ash is sometimes used as a source of silica in cement manufacturing,but more commonly is used in concrete production as a substitute for a portion of the cement.This is beneficial in two ways: it reduces solid waste and overall energy use since it does notrequire pyroprocessing. Fly ash can readily be substituted for 15% to 35% of the cement inconcrete mixes and in some applications fly ash content can be up to 70%. These additionchange the performance characteristic of the concrete. Of the 68 million short tons of coal fly ashproduced in 2001, 12.4 million short tons were used in cement and concrete products28. Fly ashcan contain elements (e.g., carbon), compounds (e.g., ammonia) and other constituents that aredetrimental to concrete performance.
Fly ash and slags react with any free lime left after the hydration to form calcium silicatehydrate, which is similar to the tricalcium and dicalcium silicates formed in cement curing. Thisprocess increases strength, improves sulfate resistance, decreases permeability, reduces the waterratio required, and improves the pumpability and workability of the concrete. Western coal-firedpower plants produce better fly ash for concrete than eastern plants, because of lower sulfur andlower carbon content in the ash. Fly ash from incinerators cannot be used. Portland cement withfly ash added is sometimes identified with the letter P after the type number (e.g., Type IP).
Other industrial waste products, including blast furnace slag, cinders, silica fume andsteel mill scale are sometimes substituted for some of the aggregate in concrete mix. Recycledconcrete can be crushed into aggregate and reused in the concrete mix. However, the irregularand higher surface area of crushed concrete aggregate is more costly than sand or crushed stonebecause it takes more cement slurry to coat the surface.
-31-
1. Emission of Greenhouse Gases in theUnited States 2001, Energy Information Agency, DOE,December 2002, page 31
2.Cement Manufacturing, Energy Solutions Center, Inc. Washington, DC, Copyright DTEEnergy, TechPro©2001, Version1.1, October 2002
3.Concrete: Sustainability and Life Cycle - Life Cycle Research Reports 1994 through 2000This CD contains 31 reports with a focus on concrete. Cement is a key component in a LCA anddata are presented in many of these reports.
4. 2000 U.S. AND CANADIAN LABOR-ENERGY INPUT SURVEY, Portland CementAssociation, March 2002, page 3
5. Emission of Greenhouse Gases in the United States 2001, page 31
6. Integrated Pollution Prevention and Control (IPPC) Reference Document on Best AvailableTechniques in the Cement and Lime Manufacturing Industries, March 2001, EuropeanCommission, Directorate-General Joint Research Centre, Institute for ProsepectiveTechnological Studies, Technology for Sustainable Development, European IPPC Bureau, page26
7. Integrated Pollution Prevention and Control (IPPC) Reference Document on Best AvailableTechniques in the Cement and Lime Manufacturing Industries, page 27
8. Integrated Pollution Prevention and Control (IPPC) Reference Document on Best AvailableTechniques in the Cement and Lime Manufacturing Industries, page 27
9. Mineral Commodity Summaries, U.S. Geological Survey, Jan 2003, page 44
10. Cement U.S. Geological Survey Minerals Yearbook -2001, Hendrik G. van Oss, page 16.1
11. U.S. Cement Industry Factsheet, Portland Cement Association, Il, 2002 Edition Update,Table 17
12. U.S. Cement Industry Factsheet, Table 14
13. U.S. Cement Industry Factsheet, page 14
14. Ready Mixed Concrete Industry: An Integral Part of the American Economy, National ReadyMixed Concrete Association, Washington, DC. January, 2002
15. Cement U.S. Geological Survey Minerals Yearbook -2001, Table 16
Endnotes:

-32-
16. Encyclopedia of Chemical Technology, Kirk-Othmer, 3rd edition 1979, John Wiley & Sons,NY, NY, Volume 5, page 165
17. Encyclopedia of Chemical Technology, Volume 14, page 343
18. Energy and Environmental Profile of the U.S. Mining Industry, U.S. Department of Energy,Office of Industrial Technologies, Mining Industry of the Future, page 9-8.
19. Energy and Environmental Profile of the U.S. Mining Industry, page 9-8
20. Chemical Engineering Handbook, Fourth edition, John H. Perry, McGraw-Hill BookCompany, page 8-8
21. The Rotary Cement Kiln, Kurt E. Perry, 1986, Chemical Publishing Co., Inc., New York,page 107
22. Chemical Engineering Handbook, page 8-8
23. Alternatives to Traditional Fuels 2000, September 2002 U.S. Department of Energy, table 10
24. Kawasaki Heavy Industries, Ltd. website (http://www.khi.co.jp/products/sanki/san/faks.htm)FAKS (Fluidized Bed Advanced Cement Kiln System)
25. U.S. Cement Industry Factsheet, Portland Cement Association, Il, 2002 Edition Update,Table 14
26. Cement U.S. Geological Survey Minerals Yearbook -2001, Hendrik G. van Oss, Table 8
27. Mineral Admixtures, John Scanlon, ACI Compilation 22, 1992
28. 2001 Coal Combustion Product Survey, American Coal Ash Association, Aurora, CO


