The MSCI Emerging Market (EM) Small Cap Index is up 11.4 percent this year, vs. a rise of 5.7 percent in the MSCI World Index. 1 Political reforms across EM nations, EM’s commendable value proposition (EM stocks currently trade at a price-to- earnings ratio of around 11.7, versus 16.7 for developed market (DM) stocks) 2 , and China’s push to open its markets have all unveiled opportunities in the emerging markets equity space. As investors look to best position themselves in developing nations going forward, we have found that EM small-cap equity is chiefly poised to benefit from sweeping macroeconomic and market changes in the EM landscape. We focus on the most prominent investor questions related to the EM small-cap premium: Does it exist, and, if it does, what does it mean for my portfolio? It turns out that it does exist historically, but as we look forward, the fundamentals and technicals buttressing EM small-cap portend an even stronger premium in the future. Importantly, data reveals that opportunities in EM small-cap extend well beyond the premium; the asset class has also offered currency hedging benefits and attractive dividend income. Back to Basics: The Size Factor The small-cap premium is one of the most studied concepts in financial economics, and its use as a strategic play is “Finance 101” for most investors. The premium was first observed by economist Rolf Banz, Ph.D., in 1981. 3 Banz aimed to test the standard Sharpe-Lintner Capital Asset Pricing Model (CAPM) and discover the biggest contributing factors to equity returns. In Banz’s regression analysis of New York Stock Exchange common stocks from 1926 to 1975, he found that firm size, in addition to market risk, explains stock returns. 4 Later, in 1992, Eugene Fama and Kenneth French published one of the most widely cited studies of factor-based theory. They determined that three factors are effective in explaining asset returns: market risk, firm size and the ratio of book-value to market- value of equity. 5 Existing data, predominately aimed at DM, shows that the small-cap premium is not necessarily uniform in different time periods. In the US, the premium is most pronounced in January of each year, and looking historically, the premium has not been consistent — especially since the 1980s in the US and the UK. 6 One explanation is that the stock premium is often subject to arbitrage by investors; another is that the popularity of index funds has skewed investor flows into large-cap stocks in lieu of small-cap. 7 Nonetheless, despite some patchiness, historical and academic data affirm a DM small-cap premium over the long term. Expanding to emerging markets, Fama, French and other researchers have demonstrated that value, size and market risk factors are the primary variables that explain international asset class returns. Savina Rizova has demonstrated that small caps outperform the market with respect to both EAFE (Europe, Australasia and Far East) and EM stocks. 8 Searching for the Small-Cap Premium in EM: the Return Observations The concept is basic risk and reward: Smaller firms are thought to have greater underlying risks (linked to market illiquidity, bankruptcy (default) risk and earnings risk), 9 and thus require loftier returns than larger firms on average, over time. Studies have found a higher premium in the smallest micro-cap firms as well as a less prominent premium as market cap increases. 10 Institutional investors most commonly exploit this premium by allocating to an appropriate MSCI small-cap benchmark. However, as we look for an EM small-cap premium in historical data, the output is not so straightforward. Using the dominant by Gaurav Mallik, Lead Strategist, Quantitative Equity and Jean-Christophe de Beaulieu, CFA, Head of Active Emerging Market Equity Portfolio Management IQ INSIGHTS It’s a Small-Cap World Using the EM Small-Cap Premium to Help Grow Your Portfolio July 2015
Transcript
The MSCI Emerging Market (EM) Small Cap Index is up 11.4 percent this year, vs. a rise of 5.7 percent in the MSCI World Index.1 Political reforms across EM nations, EM’s commendable value proposition (EM stocks currently trade at a price-to-earnings ratio of around 11.7, versus 16.7 for developed market (DM) stocks)2, and China’s push to open its markets have all unveiled opportunities in the emerging markets equity space. As investors look to best position themselves in developing nations going forward, we have found that EM small-cap equity is chiefly poised to benefit from sweeping macroeconomic and market changes in the EM landscape.
We focus on the most prominent investor questions related to the EM small-cap premium: Does it exist, and, if it does, what does it mean for my portfolio? It turns out that it does exist historically, but as we look forward, the fundamentals and technicals buttressing EM small-cap portend an even stronger premium in the future. Importantly, data reveals that opportunities in EM small-cap extend well beyond the premium; the asset class has also offered currency hedging benefits and attractive dividend income.
Back to Basics: The Size FactorThe small-cap premium is one of the most studied concepts in financial economics, and its use as a strategic play is “Finance 101” for most investors. The premium was first observed by economist Rolf Banz, Ph.D., in 1981.3 Banz aimed to test the standard Sharpe-Lintner Capital Asset Pricing Model (CAPM)
and discover the biggest contributing factors to equity returns. In Banz’s regression analysis of New York Stock Exchange common stocks from 1926 to 1975, he found that firm size, in addition to market risk, explains stock returns.4 Later, in 1992, Eugene Fama and Kenneth French published one of the most widely cited studies of factor-based theory. They determined that three factors are effective in explaining asset returns: market risk, firm size and the ratio of book-value to market-value of equity.5
Existing data, predominately aimed at DM, shows that the small-cap premium is not necessarily uniform in different time periods. In the US, the premium is most pronounced in January of each year, and looking historically, the premium has not been consistent — especially since the 1980s in the US and the UK.6 One explanation is that the stock premium is often subject to arbitrage by investors; another is that the popularity of index funds has skewed investor flows into large-cap stocks in lieu of small-cap.7 Nonetheless, despite some patchiness, historical and academic data affirm a DM small-cap premium over the long term.
Expanding to emerging markets, Fama, French and other researchers have demonstrated that value, size and market risk factors are the primary variables that explain international asset class returns. Savina Rizova has demonstrated that small caps outperform the market with respect to both EAFE (Europe, Australasia and Far East) and EM stocks.8
Searching for the Small-Cap Premium in EM: the Return ObservationsThe concept is basic risk and reward: Smaller firms are thought to have greater underlying risks (linked to market illiquidity, bankruptcy (default) risk and earnings risk),9 and thus require loftier returns than larger firms on average, over time. Studies have found a higher premium in the smallest micro-cap firms as well as a less prominent premium as market cap increases.10 Institutional investors most commonly exploit this premium by allocating to an appropriate MSCI small-cap benchmark.
However, as we look for an EM small-cap premium in historical data, the output is not so straightforward. Using the dominant
by Gaurav Mallik, Lead Strategist, Quantitative Equity and Jean-Christophe de Beaulieu, CFA, Head of Active Emerging Market Equity Portfolio Management
IQ INSIGHTSIt’s a Small-Cap WorldUsing the EM Small-Cap Premium to Help Grow Your Portfolio
July 2015
State Street Global Advisors 2
index provider MSCI’s data from 1994 to present, one could conclude that the premia is nonexistent. But in our view, MSCI EM Index data can be misleading because it has a small number of constituents and a short history (a launch date of January 2001 and only 835 constituents11). To fully understand the emerging markets small-cap premium, we performed an analysis using companies in the broad MSCI EM Index plus the Standard & Poor’s/International Finance Corp (S&P/IFCI) Index,12 another leading standard EM index. By utilizing a universe wider than the too narrow MSCI and including more business cycles, we can cover most of the EM universe and derive more accurate, actionable conclusions about the premium.
We divided this broader MSCI + IFCI universe into quintiles from largest-size (Q1) to smallest (Q4) (size is defined as market capitalization). Using four measures of returns, from 1989 to 2014 (Figure 1), the smallest market cap quintile (Q4) is indeed the strongest performer. We found evidence that the small-cap
premium does exist, ranging from 4.8 percent for dollar-denominated weighted average returns to 7.1 percent for dollar-denominated average returns.
Similar to DM, the small-cap premium in EM is not static; rather it can rise and fall with changes in the macro- and microeconomic frameworks.
IQ Insights | It’s a Small-Cap World
Figure 2: Risk Premia by Sub-Period1994 to 2014Sub Period Mean (%) Standard Deviation (%) Percent of Months in the Sample with a Small-Cap Premium Exhibited* (%)
1994–2000 -5.83 10.35 45
2000–2008 -0.31 7.07 49
2009–2014 4.29 6.36 52
*The percent of periods where small-cap EM outperformed large-cap EM.
Source: Bloomberg, SSGA, and S&P/IFC, as of December 2014.
Past performance is not a guarantee of future results. Standard deviation is a historical measure of the volatility of returns. If a portfolio has a high standard deviation, its returns have been volatile; a low standard deviation indicates returns have been less volatile. Standard Deviation is normally shown over a time period of 36 months, but the illustrations noted in this material may reflect a shorter time frame. This may not depict a true historical measure, and shouldn’t be relied upon as an accurate assessment of volatility.
Figure 1: Expanding the Data Set to the MSCI EM Index Plus the S&P/IFCI Index, a Small-Cap Premium EmergesYears 1989–2014
Premium (%)
0
10
20
30
Q3 Q1 Q2 Q4 Small Cap Premium
Avg ($) Wtd Avg ($) Avg (Local) Wtd Avg (Local)
Source: Bloomberg, State Street Global Advisors (SSGA), S&P IFC, and MSCI, as of December 2014.
Past performance is not a guarantee of future returns.
The Hidden Currency Hedge in EM SmallFigure 3 illustrates the difference in the EM small-cap premium for returns collected in dollar terms versus local terms. On average, the dollar-based small-cap premium is about 50bp higher than what we get in local terms.
It isn’t a big stretch to see why EM small-cap stocks may have a sturdier umbrella than EM large-cap stocks when currency storms hit, which makes the premium a bit higher on a dollar basis (when FX effects are included) than on local basis (which excludes FX effects). Emerging markets small-cap firms generally operate more locally and less on an international scale than emerging markets large-cap. Therefore, EM small firms will have a lower percentage of earnings in foreign currency, and FX volatility will have reduced impact on the topline. Additionally, EM large companies tend to be more open to markets with higher currency volatility (such as Latin American and EMEA), while EM small companies produce and sell more in Asia and other dollar-linked markets.16
Emerging markets small-cap stocks can therefore act as a natural hedge against currency volatility. While our data shows that foreign exchange does not have a huge impact on returns for small-cap stocks on a near-term basis, investors with a longer time horizon could benefit from a mild natural currency hedge in EM small-cap stocks. On a five-year basis, small caps have outperformed large caps by 1.36 percent in US dollars versus 0.6 percent in local terms (Figure 3).
State Street Global Advisors 3
IQ Insights | It’s a Small-Cap World
In the late 1990s and early 2000s, the premium was negative, mainly due to macroeconomic trends that propped up large-cap returns more than small-cap.13 At that time, the Emerging markets economy was export- and commodity-based. EM was primarily an engine for technology, electronics and manufacturing. EM also struggled with the Asian financial crisis during this period. The early 2000s were a big commodity story, culminating in the super commodity cycle stimulated by Chinese growth. The dollar was weakening during this period, making exports cheaper and the export theme that much more pervasive.14
To play this backdrop, investors poured into large-cap EM.15 Most major manufacturing firms were in the large-cap space,17 and large state-owned entities were best positioned to benefit from revenue growth, gross domestic product (GDP) growth, earnings growth and return on equity (ROE) expansion. Hefty large-cap inflows kept a small-cap premium at bay.
But what can we expect for the small-cap EM premium going forward? Now that the financial crisis is behind us, the premium is becoming more positive (Figure 2). This is primarily because we have entered a phase where developing nations are more domestic consumption-oriented, rather than export- or commodity-oriented.
Small-Cap: The New EM Story?Emerging market nations have shifted to a domestic focus due to the current stresses on the export and commodity stories of the past.18 This transition should have a salutary effect on EM small-cap returns and support a sharper premium.
The new domestic-driven economy is occurring for various reasons. Exports are declining because of a re-industrialization
in the West, and western firms have taken more of their manufacturing onshore. Exports to China — the world’s largest economy — have declined, as China seeks to transition from an investment-based to a consumption-based economy.19 The same trend is occurring across Asia. Commodities are in a long-term slump (Bloomberg Generic Brent Crude Oil futures fell below 50 in January 2015—the lowest level since 2009).20
The new EM world is one where consumption and domestic reform policy are the bedrocks of asset returns. In this world, export and commodity trends matter less and, as a result, the positive themes in the market are less restricted to large-cap manufacturing firms. Data tells us that the share of GDP from consumption growth is returning to levels last seen in the 1980s — before EM transformed into a commodity and export-led economy (Figure 4).
A Deeper Dive into the DataChanges in the macroeconomic environment are just the start. Underlying differences in the performance of developing countries small and large companies further inform our outlook for the EM small-cap premium. To assess these differences, we start with a simple decomposition of EM stock returns.
We take a simplistic approach to assessing the value accrued to equity holders from small- and large-cap stocks. In our construction, we assume that the book value of equity is the value of assets less any liabilities of a firm, as stockholders are residual claimants of the firms’ assets. Changes in book value have ultimately driven shareholder returns, so each measure below looks at different ways book value is generated.
Using the Ibbotson approach we break up the returns of both MSCI EM and MSCI EM Small-Cap indices into the following:
Figure 4: Consumption Growth Has Increased as a Share of GDP Growth
80
70
60
50
Household Consumption Expenditures as a % of GDP
— Asia — LATAM — EMEA — EM
1960 1969 1978 1996 2005 2013
Source: Bloomberg, SSGA, and MSCI, as of December 2013.
Figure 3: The US Dollar-Based Premium Outpaces the Locally-Based By About 0.5 Percent on AverageAs of April 9, 2015
YTD 1 Year 3 Year 5 Year
EM
USD 6.77 0.95 -0.51 -0.30
Local 8.10 10.80 5.06 3.25
EM Small-Cap
USD 8.65 2.84 3.31 1.06
Local 9.50 9.65 7.67 3.84
EM Small-Cap Premium
USD 1.88 1.89 3.82 1.36
Local 1.40 -1.15 2.61 0.59
Source: Bloomberg, SSGA, and MSCI, as of April 2015.
Past performance is not a guarantee of future results.
State Street Global Advisors 4
IQ Insights | It’s a Small-Cap World
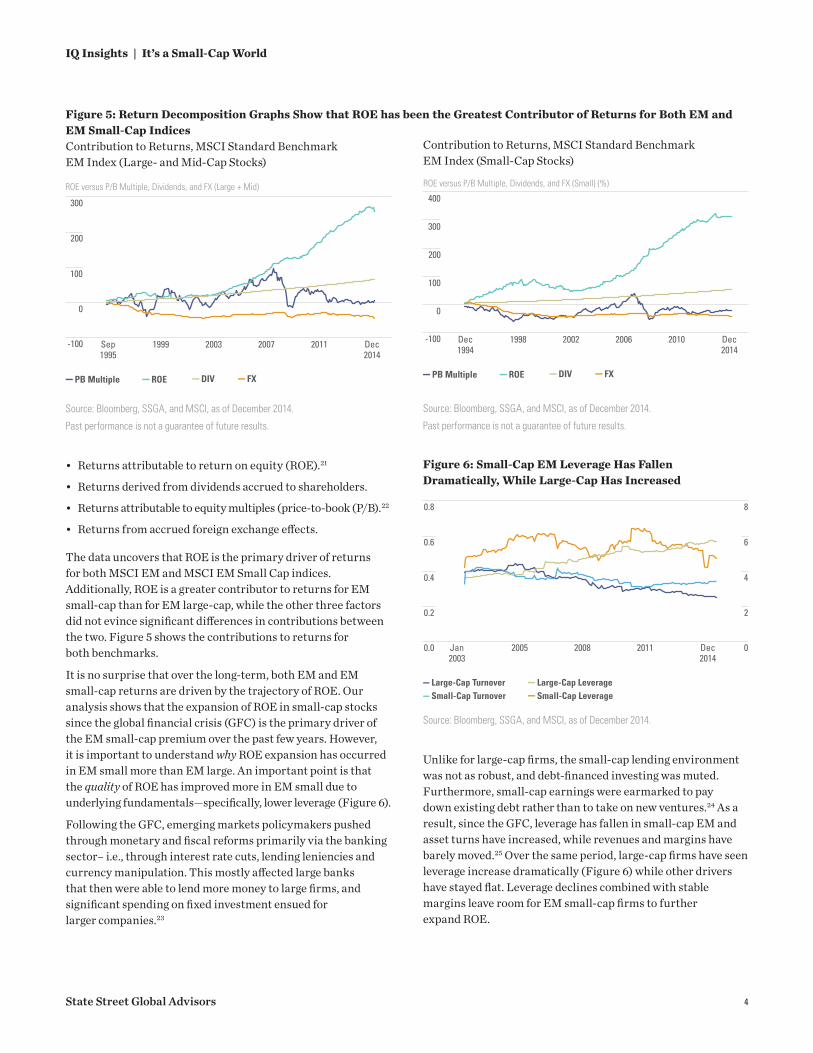
• Returns attributable to return on equity (ROE).21
• Returns derived from dividends accrued to shareholders.
• Returns attributable to equity multiples (price-to-book (P/B).22
• Returns from accrued foreign exchange effects.
The data uncovers that ROE is the primary driver of returns for both MSCI EM and MSCI EM Small Cap indices. Additionally, ROE is a greater contributor to returns for EM small-cap than for EM large-cap, while the other three factors did not evince significant differences in contributions between the two. Figure 5 shows the contributions to returns for both benchmarks.
It is no surprise that over the long-term, both EM and EM small-cap returns are driven by the trajectory of ROE. Our analysis shows that the expansion of ROE in small-cap stocks since the global financial crisis (GFC) is the primary driver of the EM small-cap premium over the past few years. However, it is important to understand why ROE expansion has occurred in EM small more than EM large. An important point is that the quality of ROE has improved more in EM small due to underlying fundamentals—specifically, lower leverage (Figure 6).
Following the GFC, emerging markets policymakers pushed through monetary and fiscal reforms primarily via the banking sector– i.e., through interest rate cuts, lending leniencies and currency manipulation. This mostly affected large banks that then were able to lend more money to large firms, and significant spending on fixed investment ensued for larger companies.23
Unlike for large-cap firms, the small-cap lending environment was not as robust, and debt-financed investing was muted. Furthermore, small-cap earnings were earmarked to pay down existing debt rather than to take on new ventures.24 As a result, since the GFC, leverage has fallen in small-cap EM and asset turns have increased, while revenues and margins have barely moved.25 Over the same period, large-cap firms have seen leverage increase dramatically (Figure 6) while other drivers have stayed flat. Leverage declines combined with stable margins leave room for EM small-cap firms to further expand ROE.
Figure 5: Return Decomposition Graphs Show that ROE has been the Greatest Contributor of Returns for Both EM and EM Small-Cap IndicesContribution to Returns, MSCI Standard Benchmark EM Index (Large- and Mid-Cap Stocks)
0
300
200
100
-100
ROE versus P/B Multiple, Dividends, and FX (Large + Mid)
Sep1995
1999 2003 2007 2011 Dec2014
— PB Multiple — ROE — DIV — FX
Source: Bloomberg, SSGA, and MSCI, as of December 2014.
Past performance is not a guarantee of future results.
0
-100
100
200
300
400
Dec1994
1998 2002 2006 2010 Dec2014
ROE versus P/B Multiple, Dividends, and FX (Small) (%)
— PB Multiple — ROE — DIV — FX
Contribution to Returns, MSCI Standard Benchmark EM Index (Small-Cap Stocks)
Figure 6: Small-Cap EM Leverage Has Fallen Dramatically, While Large-Cap Has Increased
0.2
0.8
0.6
0.4
0.0
2
8
6
4
0Jan2003
2005 2008 2011 Dec2014
— Large-Cap Turnover— Small-Cap Turnover
— Large-Cap Leverage— Small-Cap Leverage
Source: Bloomberg, SSGA, and MSCI, as of December 2014.
Source: Bloomberg, SSGA, and MSCI, as of December 2014.
Past performance is not a guarantee of future results.
State Street Global Advisors 5
IQ Insights | It’s a Small-Cap World
The Risk-Reward Trade-offEM small-cap is not without its risks. It is a new and somewhat unchartered territory, with a mere 3,000 securities in its universe and roughly 1,000 of them, at most, covered by equity analysts.31 Indeed, small-cap EM stocks often have the same size disadvantages (lower market share, reduced economies of scale, smaller balance sheet) as small-cap DM stocks.
We have performed analysis of variables and macroeconomic trends underlying small-cap performance that can cause some periods of ebb or flow in the EM small-cap premium. Over the long term, the additional risk inherent in small cap stocks does argue for a small cap premium — one that has been validated by years of academic literature.
There are many pieces of data highlighting just why small-cap stocks are more risky. One such data point is the relatively greater earnings uncertainty. Indeed, earnings estimates for EM small-cap companies have displayed more dispersion than large-cap estimates, indicating greater earnings uncertainty in EM small-cap stocks (Figure 7).
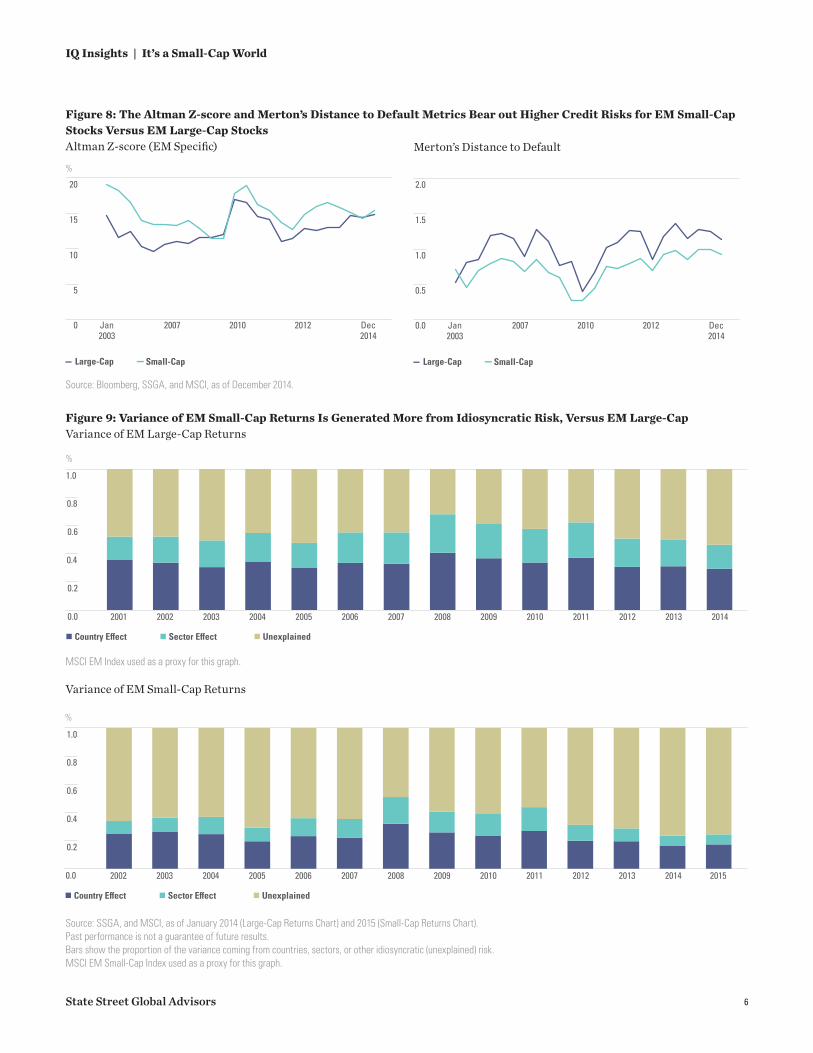
Fama and French have pointed to another such manifestation of greater small-cap risk: bankruptcy.32 We calculate various default statistics for a universe including both the MSCI EM and MSCI Small Cap Indices. To assess default risk, we calculated two metrics: (1) the Emerging Markets specific Altman Z-score and (2) Robert Merton’s Distance to Default statistic. The Altman Z-score combines various weighted performance metrics to form a credit-strength test gauging a company’s likelihood of bankruptcy. Merton’s Distance to Default measure tells us the number of standard deviations the firm’s value is away from default, with default measured by the difference between a firm’s asset value and its outstanding debt. Our analysis shows that both the Altman Z-score and Merton’s Distance to Default metric indicate a higher credit risk for EM small-cap stocks (Figure 8).
Figure 7: EM Small-Cap Stocks Display Broader Dispersions of Earnings EstimatesStandard Devation of Earnings
— EM Small-Cap — EM Large-Cap
0.0
0.2
0.4
0.6
0.8
Jan2001
2004 2008 2011 Jan2015
Source: Bloomberg, SSGA, and MSCI, as of January 2015.
Past performance is not a guarantee of future results.
Standard deviation is a historical measure of the volatility of returns. If a portfolio has a high standard deviation, its returns have been volatile; a low standard deviation indicates returns have been less volatile. Standard Deviation is normally shown over a time period of 36 months, but the illustrations noted in this material may reflect a shorter time frame. This may not depict a true historical measure, and shouldn’t be relied upon as an accurate assessment of volatility
It’s a Family Thing: Dividend Yields Still Flow for Small Cap EMInvestors on the hunt for dividend income can, in fact, attain the same level of dividend yields in EM small-cap or large-cap stocks, despite the inherent differences in risk between the two. The dividend yield, historically, is similar for EM small- and large-cap firms, at 2.4 percent for EM small-cap stocks and 2 percent for EM large.26 This differs from the US, where small-cap stocks have a much lower dividend yield than large-cap stocks. (The Russell 2000 Index has, on average, about half the dividend yield that the S&P 500 Index does).27
As for why dividend yields in riskier EM small-cap stocks are just as high as those for EM large, family ownership likely bears much of the responsibility. Clubby local connections and intimate local knowledge — two of the hallmarks of family-run businesses — matter significantly in developing nations. Thus, the family-run model is common to this region, particularly in Asia, where a history of closed economies has made it more prudent for new founders to keep all parts of the business in-house. Dividends matter more for the liquidity of these families, and the payouts are more sacrosanct. This prompts steeper dividend yields — a phenomenon that bodes well for dividend income in large-and small-cap EM alike.28
The numbers are staggering. Roughly 85 percent of $1 billion-plus businesses in Southeast Asia are family-run. In Latin America, that figure is around 75 percent, while in India, it’s 67 percent. In the Middle East, 65 percent of businesses with over $1 billion in revenues are family-owned.29 In China, the percentage is about 40 percent despite the fact that most large firms remain under state control. Overall, family businesses account for about 60 percent of private-sector EM companies with revenues of $1 billion or more, McKinsey reports.30
As investors consider EM stocks, the small-cap space is notable not just for its differences to EM large, but also for its similarities. And a dividend yield that’s just as high as EM large-cap stocks is one similarity we can live with.
State Street Global Advisors 6
IQ Insights | It’s a Small-Cap World
Figure 9: Variance of EM Small-Cap Returns Is Generated More from Idiosyncratic Risk, Versus EM Large-CapVariance of EM Large-Cap Returns
Source: SSGA, and MSCI, as of January 2014 (Large-Cap Returns Chart) and 2015 (Small-Cap Returns Chart). Past performance is not a guarantee of future results. Bars show the proportion of the variance coming from countries, sectors, or other idiosyncratic (unexplained) risk. MSCI EM Small-Cap Index used as a proxy for this graph.
Figure 8: The Altman Z-score and Merton’s Distance to Default Metrics Bear out Higher Credit Risks for EM Small-Cap Stocks Versus EM Large-Cap Stocks Altman Z-score (EM Specific)
Source: Bloomberg, SSGA, and MSCI, as of December 2014.
In a third level of risk analysis, we can look at what exactly drives the variance of EM small-cap performance. It turns out that EM small-cap stocks have more idiosyncratic or “unexplained” risk than EM large-cap (Figure 9). High levels of performance variability from country or sector movements indicate macro-driven markets. By contrast, idiosyncratic movements are not driven by systemic changes and offer less explanation for investors. While less predictable, idiosyncratic risk also offers investment managers greater ability to add value through stock selection.
These risk differentials validate that investors allocating to small-cap stocks do take on additional risk and should be rewarded for this. Figure 10 shows the risk/return characteristics of EM small-cap stocks relative to other EM benchmarks. Indeed, over the long-term, emerging market small-cap stocks display higher volatility. On a 10-year basis, EM small-cap investors are compensated with a 1.57 percent premium over large-cap stocks. But most importantly, the small-cap index displays the highest risk-adjusted return.
The small-cap investment processes must be designed to account for higher idiosyncratic risk, less analyst coverage and greater uncertainty in fundamentals (earnings/risk of default). But for investors seeking exposure to emerging markets in the future, we think that EM small-cap offers the most attractive positioning as earnings, ROE and leverage metrics have all been improving since the GFC, our observations show. In particular, with lower leverage, EM small-cap credit and operational profiles are less likely to crumble under the weight of geopolitical strains in developing nations. Therefore, EM small cap can help offer
diversification against trends that cast a pall over global investments such as currency volatility, US rate hikes or a Chinese hard landing.
EM Small-Cap is Becoming the EM StoryThe Emerging Markets story is undergoing profound change. To summarize the piece, the political reform process is in full swing across developing nations, investment spending is coming down and domestic consumption is rising. While those countries’ growth was defined by exports and commodities for the bulk of their histories, maneuverings from policymakers and global economic trends have shifted EM economies into a domestic focus. We believe:
• Over time, investors will realize a small-cap EM premium driven by lower leverage in small-cap names and macroeconomic shifts that mute economic trends more favorable to EM large-cap.
• EM small-cap companies have displayed fundamental attributes (reasonable valuation, improving earnings, better shareholder value and enhanced ROE) that are advantageous for investors.
• The prevalence of family-owned corporations in EM translates to attractive dividend income for both small-and large-cap firms in the region.
• In the current economic environment, with declining trade and export activity and a rising US dollar, EM small likely offers better positioning than EM large.
Figure 10: Risk and Return Attributes of Various EM Benchmarks1 Year 3 Years 5 Years 10 Years
MSCI EM Index Return (%) 7.80 3.24 3.02 9.58
Risk (%) 13.36 13.58 18.15 23.59
Information Ratio 0.58 0.24 0.17 0.41
MSCI EM Small-Cap Index Return (%) 7.19 7.19 3.92 11.08
Risk (%) 11.99 12.67 18.36 25.22
Information Ratio 0.60 0.57 0.21 0.44
MSCI EM IMI Index Return (%) 8.07 3.77 3.15 9.77
Risk (%) 13.70 13.83 18.23 23.51
Information Ratio 0.59 0.27 0.17 0.42
Source: Bloomberg, SSGA, and MSCI, as of April 2015.
Past performance is not a guarantee of future results.
Index returns are unmanaged and do not reflect the deduction of any fees or expenses. Index returns reflect all items of income, gain and loss and the reinvestment of dividends and other income.
State Street Global Advisors 8
IQ Insights | It’s a Small-Cap World
1 MSCI Inc, SSGA, as of June 26, 2015.2 SSGA, as of June 2015.3 Banz, R. W., “The relationship between return and market value of common stocks,” Journal
of Financial Economics, 9(1), 3{18, 1981.4 Crain, Michael A., “A Literature Review of the Size Effect,” retrieved from http://papers.ssrn.
com/sol3/papers.cfm?abstract_id=1710076, 2011.5 Fama, Eugene and French, Kenneth R., “The Cross-Section of Expected Stock Returns,” Journal
of Finance, 47, 427{465, 1992.6 MSCI Inc., SSGA, as of February 27, 2015.7 SSGA, “The First ETF Turns 20: Innovation That Leveled the Playing Field for All Investors
Reaches New Milestone,” retrieved from http://newsroom.statestreet.com/press-release/state-street-global-advisors/first-etf-turns-20-innovation-leveled-playing-field-all-i, 2013.
8 Rizova, Savina, “International Evidence on the Size Effect,” Dimensional Fund Advisors, 2006.9 Amihud, Y., “Illiquidity and stock returns: cross-section and time-series effects,” Journal
of Financial Markets 5(1), 31{56, 2002.10 Fama, Eugene and French, Kenneth R., “Common risk in the returns of stocks and bonds,”
Journal of Finance, 33, 3{56, 1993.11 MSCI Inc., as of April 2015. 12 The S&P/IFCI is a liquid and investable subset of the S&P Emerging BMI, with the addition
of South Korea. The S&P Emerging BMI captures all companies domiciled in the emerging markets within the S&P Global Broad Market Index with a float-adjusted market capitalization of at least US$100 million and a minimum annual trading liquidity of US$50 million.
13 MSCI Inc., as of February 27, 2015. 14 Engardio, Pete and Roberts, Dexter with Bremner Brian, “The China Price,” retrieved from
http://www.bloomberg.com/bw/stories/2004-12-05/the-china-price, 2004.15 Post, Mitchell A. and Millar, Kimberlee, “U.S. Emerging Market Equity Funds and the 1997
Crisis in Asian Financial markets,” Investment Company Institute Perspective, 4 (2), 1998. 16 Quantitative Management Associates LLC, “The Search for Alpha: Emerging Markets
Small Cap Fourth Quarter 2014,” retrieved from http://www.institutionalinvestor.com/Article/3417353/The-Search-for-Alpha-Emerging-Markets-Small-Cap.html, 2015.
17 Bloomberg, Various Dates.18 International Monetary Fund, “Emerging Markets In Transition: Growth Prospects And
Challenges,” retrieved from http://www.imf.org/external/pubs/ft/sdn/2014/sdn1406.pdf, 2014.19 The World Bank, as of May 26, 2015. 20 Bloomberg, as of June 4, 2015.21 ROE tells us how retained earnings are translated into new earnings. Changes in book value
or changes in retained earnings are used as a proxy for ROE in our methodology. 22 Price to book is the markets’ estimation of the future value of assets. An expansion or
contraction of price-to-book multiples is used to show how the markets’ perception of future value is changing over time.
23 Mohan, Rakesh and Kapur, Muneesh. “Liberalization and Regulation of Capital Flows: Lessons for Emerging Market Economies,” ADBI Working Paper Series, 186, 2010.
25 Asset turns measure the amount of sales per unit of asset. Higher asset turns indicates a more efficiently-run firm.
26 MSCI, as of June 4, 2015.27 Bloomberg, as of June 4, 2015. 28 Wells Fargo, as of December 5, 2014.29 “Business in the Blood,” The Economist, retrieved from http://www.economist.com/news/
30 “Perspectives on Founder- and Family-Owned Businesses,” McKinsey & Company, October, 2014.31 SSGA, FactSet as of June 4, 2015. 32 Fama, Eugene and French, Kenneth R., “Testing Tradeoff And Pecking Order Predictions
About Dividends And Debt,” retrieved from http://faculty.chicagobooth.edu/finance/papers/testingtrade.pdf, 1999.
Australia: State Street Global Advisors, Australia, Limited (ABN 42 003 914 225) is the holder of an Australian Financial Services Licence (AFSL Number 238276). Registered Office: Level 17, 420 George Street, Sydney, NSW 2000, Australia. T: +612 9240 7600. F: +612 9240 7611. Belgium: State Street Global Advisors Belgium, Chausse de La Hulpe 120, 1000 Brussels, Belgium. T: +32 2 663 2036, F: +32 2 672 2077. SSGA Belgium is a branch office of State Street Global Advisors Limited. State Street Global Advisors Limited is authorised and regulated by the Financial Conduct Authority in the United Kingdom. Canada: State Street Global Advisors, Ltd., 770 Sherbrooke Street West, Suite 1200 Montreal, Quebec, H3A 1G1, T: +514 282 2400 and 30 Adelaide Street East Suite 500, Toronto, Ontario M5C 3G6. T: +647 775 5900. Dubai: State Street Bank and Trust Company (Representative Office), Boulevard Plaza 1, 17th Floor, Office 1703 Near Dubai Mall & Burj Khalifa, P.O Box 26838, Dubai, United Arab Emirates. T: +971 (0)4 4372800. F: +971 (0)4 4372818. France: State Street Global Advisors France. Authorised and regulated by the Autorité des Marchés Financiers. Registered with the Register of Commerce and Companies of Nanterre under the number: 412 052 680. Registered Office: Immeuble Défense Plaza, 23-25 rue Delarivière-Lefoullon, 92064 Paris La Défense Cedex, France. T: +33 1 44 45 40 00. F: +33 1 44 45 41 92. Germany: State Street Global Advisors GmbH, Brienner Strasse 59, D-80333 Munich. T: +49 (0)89 55878 100. F: +49 (0)89 55878 440. Hong Kong: State Street Global Advisors Asia Limited, 68/F, Two International Finance Centre, 8 Finance Street, Central, Hong Kong. T: +852 2103 0288. F: +852 2103 0200. Ireland: State Street Global Advisors Ireland Limited is regulated by the Central Bank of Ireland. Incorporated and registered in Ireland at Two Park Place, Upper Hatch Street, Dublin 2. Registered Number: 145221. Member of the Irish Association of Investment Managers. T: +353 (0)1 776 3000. F: +353 (0)1 776 3300. Italy: State Street Global Advisors Limited, Milan Branch (Sede Secondaria di Milano) is a branch of State Street Global Advisors Limited, a company registered in the UK, authorised and regulated by the Financial Conduct Authority (FCA ), with a capital of GBP 71'650'000.00, and whose registered office is at 20 Churchill Place, London E14 5HJ. State Street Global Advisors Limited, Milan Branch (Sede Secondaria di Milano), is registered in Italy with company number 06353340968 - R.E.A. 1887090 and VAT number 06353340968 and whose office is at Via dei Bossi, 4 - 20121 Milano, Italy. T: +39 02 32066 100. F: +39 02 32066 155. Japan: State Street Global Advisors (Japan) Co., Ltd., Japan, Toranomon Hills Mori Tower 25F, 1-23-1 Toranomon, Minato-ku, Tokyo, 105-6325. T: +81 (0)3 4530 7380 Financial Instruments Business Operator, Kanto Local Financial Bureau (Kinsho #345) Membership: Japan Investment Advisers Association, The Investment Trust Association, Japan, Japan Securities Dealers' Association. Netherlands: State Street Global Advisors Netherlands, Adam Smith Building, Thomas Malthusstraat 1-3, 1066 JR Amsterdam, Netherlands. T: +31 (0)20 7181701. State Street Global Advisors Netherlands is a branch office of State Street Global Advisors Limited. State Street Global Advisors Limited is authorised and regulated by the Financial Conduct Authority in the United Kingdom. Singapore: State Street Global Advisors Singapore Limited, 168 Robinson Road, #33-01 Capital Tower, Singapore 068912 (Company Registered Number: 200002719D). T: +65 6826 7500. F: +65 6826 7501. Switzerland: State Street Global Advisors AG, Beethovenstrasse. 19, Postfach, CH-8027 Zurich. T: +41 (0)44 245 70 00. F: +41 (0)44 245 70 16. United Kingdom:
State Street Global Advisors Limited. Authorised and regulated by the Financial Conduct Authority. Registered in England. Registered Number: 2509928. VAT Number: 5776591 81. Registered Office: 20 Churchill Place, Canary Wharf, London, E14 5HJ. T: +020 3395 6000. F: +020 3395 6350. United States: State Street Global Advisors, One Lincoln Street, Boston, MA 02111-2900. T: +1 617 664 7727.
Investing involves risk including the risk of loss of principal.
The whole or any part of this work may not be reproduced, copied or transmitted or any of its contents disclosed to third parties without SSGA’s express written consent.
The information provided does not constitute investment advice and it should not be relied on as such. It should not be considered a solicitation to buy or an offer to sell a security. It does not take into account any investor’s particular investment objectives, strategies, tax status or investment horizon. You should consult your tax and financial advisor. All material has been obtained from sources believed to be reliable. There is no representation or warranty as to the accuracy of the information and State Street shall have no liability for decisions based on such information.
Past performance is not a guarantee of future results.
Standard & Poors and S&P are registered trademarks of Standard & Poors Financial Services LLC (S&P);
Source: MSCI. MSCI makes no express or implied warranties or representations and shall have no liability whatsoever with respect to any MSCI data contained herein. The MSCI data may not be further redistributed or used as a basis for other indices or any securities or financial products. This report is not approved, reviewed or produced by MSCI.
Risk associated with equity investing include stock values which may fluctuate in response to the activities of individual companies and general market and economic conditions.
The views expressed in this material are the views of Gaurav Mallik and Jean-Christophe De Beaulieu through the period ended July 1, 2015 and are subject to change based on market and other conditions. This document contains certain statements that may be deemed forward-looking statements. Please note that any such statements are not guarantees of any future performance and actual results or developments may differ materially from those projected.
Investing in foreign domiciled securities may involve risk of capital loss from unfavorable fluctuation in currency values, withholding taxes, from differences in generally accepted accounting principles or from economic or political instability in other nations.
Investments in emerging or developing markets may be more volatile and less liquid than investing in developed markets and may involve exposure to economic structures that are generally less diverse and mature and to political systems which have less stability than those of more developed countries.
Companies with large market capitalizations go in and out of favor based on market and economic conditions. Larger companies tend to be less volatile than companies with smaller market capitalizations. In exchange for this potentially lower risk, the value of the security may not rise as much as companies with smaller market capitalizations.
Investments in mid/small-sized companies may involve greater risks than in those of larger, better known companies.