Bangladesh Political Context A notable feature of Bangladesh’s first ESAF pro- gram in 1990 was that it coincided with the end of military rule under President Ershad. A spate of do- mestic violence and demonstrations against the Er- shad government led to the dissolution of parliament in 1987 and, thereafter, to elections in 1991 that brought to power Prime Minister Begum Khaleda Zia, leader of the Bangladesh National Party and widow of General Ershad’s predecessor, General Zia-ur-Rahman. Given the extreme polarization that has characterized politics in Bangladesh, the process of liberalization meant that, from the beginning, the government’s commitment to the ESAF program would almost certainly be made subject to the de- mands of political expediency. Even so, the Zia gov- ernment affirmed its commitment to the program signed in 1990 by the previous government. But this commitment to the program was soon put to the test as political tensions failed to subside. Violent demonstrations led by the opposition Awami League resulted in fresh elections in 1996, which brought into power a government of the Awami League under the leadership of Sheikh Hasina. Thus, the performance of the ESAF in Bangladesh must be evaluated against the background of a polit- ical environment dominated by extreme polarization and a continuing quest for a balance between the need for economic liberalization and the challenges of democratic governance. Indeed, even under the Ershad government, there had been periodic political protests, which in some instances had led to policy reversals. 21 The Zia government had endeavored, against difficult odds, to maintain the momentum of the ESAF program by, for instance, rejecting recom- mendations of a Wage and Productivity Commission to raise wages by a magnitude that it considered in- compatible with proper fiscal management. It is in- teresting to contrast this posture with the stance of the present government in relation to similar pres- sures for wage increases. 22 Consensus Building Given Bangladesh’s long tradition of political po- larization and a fairly active culture of civic protest, the process of consensus building is naturally a diffi- cult one. This means that support for a program under the ESAF, with its obvious distributional im- plications and difficult political choices, can at best be somewhat tentative. In these circumstances, the personality of key figures in the reform process, par- ticularly the Minister of Finance, has tended to be an important factor in the success or failure of the pro- gram and, not unnaturally, the former Minister of Fi- nance, Saifur Rahman, who held the position for a relatively protracted period, came to be perceived as the very embodiment of the program. To be sure, this is not a particularly Bangladeshi phenomenon. Min- isters of finance everywhere are always the object of public ire. But in Bangladesh, with its high inci- dence of poverty, population pressure, and frequent natural disasters whose devastating effects are some- times intertwined with the effects of policy reform in the public imagination, the personalization of the re- form program around the Minister of Finance can be IV Country Profiles 59 21 A Fund mission reported in 1987 that “under sustained pres- sure from the opposition, including a series of demonstrations and strikes, the government felt compelled in July to withdraw some of the revenue measures introduced in the 1987/88 budget.” 22 On October 6, 1997, the cabinet approved the national pay scale increases recommended by the secretary committee, formed to review the recommendations of the 5th National Pay Commis- sion. The scale, containing 20 grades, will be implemented in the next three years; what is significant about this measure is that the government has chosen to fix the lowest pay at 86.48 percent of the recommended amount (the highest-ever increase) compared with 75 percent of the amount recommended by the 4th Pay Com- mission, and 75.75 percent of the pay recommended by the 3rd Pay Commission in 1984. (Daily Star, Dhaka, October 7, 1997, pp. 1, 12) This announcement about pay increases coincided with the Bank’s release of its October 1997 draft report on public ex- penditure in Bangladesh, criticizing the increases in defense ex- penditure (now 17–18 percent of current spending), growing sub- sidies, interest payments on domestic debt, and salaries and wages arising out of the issue of absorption of personnel from the completed public projects under the recurrent budget. (Daily Star, 1997, p. 6).
Transcript
Bangladesh
Political Context
A notable feature of Bangladesh’s first ESAF pro-gram in 1990 was that it coincided with the end ofmilitary rule under President Ershad. A spate of do-mestic violence and demonstrations against the Er-shad government led to the dissolution of parliamentin 1987 and, thereafter, to elections in 1991 thatbrought to power Prime Minister Begum KhaledaZia, leader of the Bangladesh National Party andwidow of General Ershad’s predecessor, GeneralZia-ur-Rahman. Given the extreme polarization thathas characterized politics in Bangladesh, the processof liberalization meant that, from the beginning, thegovernment’s commitment to the ESAF programwould almost certainly be made subject to the de-mands of political expediency. Even so, the Zia gov-ernment affirmed its commitment to the programsigned in 1990 by the previous government. But thiscommitment to the program was soon put to the testas political tensions failed to subside. Violentdemonstrations led by the opposition Awami Leagueresulted in fresh elections in 1996, which broughtinto power a government of the Awami Leagueunder the leadership of Sheikh Hasina.
Thus, the performance of the ESAF in Bangladeshmust be evaluated against the background of a polit-ical environment dominated by extreme polarizationand a continuing quest for a balance between theneed for economic liberalization and the challengesof democratic governance. Indeed, even under theErshad government, there had been periodic politicalprotests, which in some instances had led to policyreversals.21 The Zia government had endeavored,against difficult odds, to maintain the momentum ofthe ESAF program by, for instance, rejecting recom-mendations of a Wage and Productivity Commissionto raise wages by a magnitude that it considered in-
compatible with proper fiscal management. It is in-teresting to contrast this posture with the stance ofthe present government in relation to similar pres-sures for wage increases.22
Consensus Building
Given Bangladesh’s long tradition of political po-larization and a fairly active culture of civic protest,the process of consensus building is naturally a diffi-cult one. This means that support for a programunder the ESAF, with its obvious distributional im-plications and difficult political choices, can at bestbe somewhat tentative. In these circumstances, thepersonality of key figures in the reform process, par-ticularly the Minister of Finance, has tended to be animportant factor in the success or failure of the pro-gram and, not unnaturally, the former Minister of Fi-nance, Saifur Rahman, who held the position for arelatively protracted period, came to be perceived asthe very embodiment of the program. To be sure, thisis not a particularly Bangladeshi phenomenon. Min-isters of finance everywhere are always the object ofpublic ire. But in Bangladesh, with its high inci-dence of poverty, population pressure, and frequentnatural disasters whose devastating effects are some-times intertwined with the effects of policy reform inthe public imagination, the personalization of the re-form program around the Minister of Finance can be
IV Country Profiles
59
21A Fund mission reported in 1987 that “under sustained pres-sure from the opposition, including a series of demonstrationsand strikes, the government felt compelled in July to withdrawsome of the revenue measures introduced in the 1987/88 budget.”
22On October 6, 1997, the cabinet approved the national payscale increases recommended by the secretary committee, formedto review the recommendations of the 5th National Pay Commis-sion. The scale, containing 20 grades, will be implemented in thenext three years; what is significant about this measure is that thegovernment has chosen to fix the lowest pay at 86.48 percent ofthe recommended amount (the highest-ever increase) comparedwith 75 percent of the amount recommended by the 4th Pay Com-mission, and 75.75 percent of the pay recommended by the 3rdPay Commission in 1984. (Daily Star, Dhaka, October 7, 1997,pp. 1, 12) This announcement about pay increases coincided withthe Bank’s release of its October 1997 draft report on public ex-penditure in Bangladesh, criticizing the increases in defense ex-penditure (now 17–18 percent of current spending), growing sub-sidies, interest payments on domestic debt, and salaries andwages arising out of the issue of absorption of personnel from thecompleted public projects under the recurrent budget. (Daily Star,1997, p. 6).
IV COUNTRY PROFILES
extreme. This in turn complicates the process of con-sensus building as, in the words of one interviewee,the program becomes increasingly viewed “as a pri-vate transaction between the Minister of Finance anddonors.”
When ownership of the program is viewed by keyfigures in government, including cabinet ministers,as residing almost exclusively in the minister of fi-nance, this also bedevils the process of consensusbuilding and the mobilization of resources for theprogram as other cabinet ministers retreat from pub-lic support of the program at the slightest hint of op-position.23 This clearly was the experience ofBangladesh’s leading reformer, Saifur Rahman.
The new Minister of Finance is so deterred by thepolitical costs of a new ESAF that he sees very littlespace for the mobilization of political support.24
The support of labor in Bangladesh is also diffi-cult to mobilize as it is subject to the same polariza-tion that characterizes the political situation: theunions are apparently under the control of the twomain political parties so that strikes are often politi-cally induced and are often drawn on party lines. Fi-nally, the role of parliament itself in Bangladesh hastended to be often a disruptive one instead of a uni-fying one. Instead of being a forum for dialogue andconsensus building, parliament is deprived of itsproper role as opposition parties boycott it whenthey have political grievances to settle.
On the positive side, the private sector is generallysupportive of the program. It is particularly support-ive of the privatization program and is keen to see itspeeded up, and therefore views with some disquieta disruption of the program by the alternation ofpower between the two main political parties withtheir different attitudes to the policy. For this reason,the Dhaka Chamber of Commerce and Industry andproreform economists whom we interviewed ex-pressed the rather unusual wish that the ESAFshould come with a stipulation that requires, amongother things, a consensus among political parties as acondition for financial support.
One important potential player in consensusbuilding and a source of support for the program is
the nongovernmental organization (NGO) commu-nity in Bangladesh. Thanks in part, perhaps, to thegenerally good relationship that this community en-joys with the Bank and the Fund, and the large re-sources that come to them through Bank and donor-funded safety net programs, it is favorably disposedto economic reform.
Agenda Setting and Authorship of Program Documents
The distinct impression one gets from readingFund documents and also talking to government of-ficials in the field is that the policy agenda hastended to be set more by the Fund than by the gov-ernment. This is perhaps a little less true in themacroeconomic area than in the area of structural re-forms. But even in the macroeconomic, especially inthe fiscal, area there are many references in the doc-umentation, confirmed by the protests of leading of-ficials, that tax policy was mostly dictated by theFund or was the product of compromises that gov-ernment felt constrained to accept.
Following the fall of President Ershad in 1991,the successor government claimed greater auton-omy and leadership in setting the policy agenda. InAugust 1991, for instance, it increased the nationalpay levels for civil servants in a decision thatclearly reflected more its priorities than theFund’s.25 There are two particular areas though inwhich the government’s role in initiating policywas more pronounced, namely, the poverty allevia-tion program and the area of environmental policy.Given the strong NGO role in Bangladesh, it is un-derstandable that the poverty alleviation policywould have been a preoccupation of the govern-ment itself. The government’s role in putting the is-sues of environmental policy on the agenda is alsonot surprising, given Bangladesh’s history offloods and natural disasters although, again, donorsand NGOs appear at least to have jointly sponsoredthis push that resulted in the creation of a specialMinistry of Environment.
As for the design of policy documents, includingthe PFP, government officials interviewed in thefield readily acknowledged that most documentswere prepared by the Fund and thereafter, in themanner of the usual practice, given to the govern-ment for discussion and comment.
In the area of tax policy reform, the WorldBank’s role in preparing appropriate policy propos-
60
23The former Minister of Finance shared an incident of how hefailed to win consensus in parliament and his reform effort in thisregard was subsequently marginalized. The issue was the estab-lishment of a toll system for the Dhaka-Chittagong Expresswayand the “cleaning up” of illegal habitation along the sides of theexpressway. The Minister of Transport agreed to propose a bill inparliament to this effect but, in the face of strong opposition, re-treated and accused the Minister of Finance of being the instiga-tor of that untenable proposal. (Interviews, Bangladesh, October1997).
24In 1996, representatives of the newly elected government weresaid to be so concerned about their political image that they report-edly told the Fund that advance publicity about the negotiation of apossible ESAF arrangement would be politically damaging.
25The decision was taken without full consultation with theFund, although the increased pay levels did not undermine the vi-ability of the macroeconomic program, as they were to be fi-nanced by new tax measures as well as reductions in subsidiesand nonessential current expenditures.
Bangladesh
als was particularly pronounced.26 However, therole of the Bank and the Fund in authoring thesebasic policy documents did not seem of any partic-ular concern to the technicians, the bureaucrats, oreven the political leadership of the ministries, indi-cating both an acknowledgment of weaknesses inthe government’s own administrative and technicalcapability in particular areas (a weakness aggra-vated a great deal by what would seem to be a highincidence of discontinuity and staff rotation in key government agencies) and the government’sview that the authorship of policy documents, assuch, was not a particularly important criterion ofownership.
Initiatives to Promote Ownership
In the late 1980s, in the face of stiffening opposi-tion to the program, the government began to de-vote greater attention to building national consensusand support for structural reform through public ed-ucation, with particular focus on the bureaucracy.But these initiatives appear to have been largely in-effectual as they were vitiated by the climate of re-crimination and civil unrest that marked the politicsof the period.
The Fund, for its part, began to take the businessof consensus building seriously, as domestic opposi-tion to the program escalated and the pace of domes-tic reform began to slow down noticeably at the be-ginning of the 1990s.
A 1993 internal IMF document not only empha-sized the need to strengthen the consensus for re-form in Bangladesh but also proposed some ratherinteresting and commendable initiatives that theFund might take to help build support for the pro-gram. It proposed that the Fund resident represen-tative “play a leading role through the developmentof a wide range of contacts and by direct participa-tion in the national debate.” It also recommendedthe publication of IMF Occasional Papers onBangladesh for discussion in high-level seminars inwhich the Fund staff would participate, as well asmeetings by Fund missions with opponents of re-form, both in and outside the government, in a bidto make the case for reform to a wider audience.
In 1994, a Fund mission made a submission insupport of accelerated reform to a large group ofministers and senior officials in a roundtable discus-sion attended also by the Minister of Finance, whofound the interaction so effective that he asked that itbe made a regular feature of subsequent Fund mis-sion work.
The Fund mission leader is also reported to haveparticipated in a seminar on reform, growth, andpoverty alleviation in May 1994, inaugurated byPrime Minister Khaleda Zia.
Government Commitment to Reform
As we have noted, the level of government com-mitment and ownership of the program has wanedsignificantly since the beginning of the 1990s, thatis, with the onset of the ESAF program. The presentgovernment, while recognizing the need for contin-uing reform, appears to want to resume an ESAFarrangement with the Fund but is caught in a web ofpolitical paralysis, partly of its own creation. In theperiod between the Khaleda Zia government’stenure and when the present government tookpower, it waged a campaign of violent oppositionand vilification of the reform program and nowfinds itself unable to create space for a resumptionof the reforms. This mood was captured sharply bya senior official of the Ministry of Finance who ac-knowledged, as if in despair, “my administration isweak; even if I am in agreement with IMF, I won’tbe able to produce changes.” The incumbent Minis-ter of Finance himself echoed this same sentimentwith a touch of political apprehension, indicatingthat if the policies insisted on by the Fund were tobe followed, “the ESAF will be implemented by an-other government!”27
Conclusion
In our view, it would take a major consensus-building effort in the form of an all-inclusive na-tional conference (such as Uganda’s in December1989), with the sort of active Fund participation rec-ommended in a 1994 internal Fund document, tobreak the political stalemate that now hovers overBangladesh, and create conditions for a realizationof the country’s tremendous potential for highergrowth. On the part of the Fund, there would need tobe greater recognition of the political constraints thatinhibit the consensus-building process and a willing-ness to allow the government itself to set thetimetable for reform.
61
26In 1988, for instance, the Bank submitted comprehensive taxreform proposals, which were then reviewed by high-level com-mittees that, in turn, reported to government.
27Interview with Minister Kibria, Hong Kong, September 24,1997. His predecessor, who had the most outstanding record ofprogram implementation through the 1980s and early 1990s,also noted how difficult a job it is to carry out reform in the ex-tremely polarized, pluralistic, and democratic framework thatBangladesh has, and referred to a standing joke that financeministers in reforming countries in Africa share with theirBangladeshi counterparts in meetings: “These IMF boys willnot let one stay long as minister!” (Interview, Bangladesh, Oc-tober 7, 1997).
IV COUNTRY PROFILES
Bolivia
Ownership Issues
Bolivia has long been a user of Fund resourcesand has gone through the usual progression fromstand-by arrangements starting from the mid-1980sto arrangements under the structural adjustment fa-cility (SAF), and then to ESAFs. The political situ-ation in the country has, in recent times, been char-acterized by an alternation between the two majorpolitical groupings, with a large number of smallerparties between them. The present government ofPresident Banzer was elected in 1996, and is basedon a coalition of several parties. In general, perhapsbecause of the fragility of the political consensusand the peculiar problems that attend governmentsuccession in the country, the role of technical staffaffiliated with the economic ministries—especiallythe finance ministry, which has the largest concen-tration of them—has tended to be more pronouncedthan in other countries. These technocrats have, ingeneral, shown consistently strong support for re-form programs. While this has in general been pos-itive, it has tended to often put the Ministry of Fi-nance ahead of the Ministry of Planning and therest of the government as agreements are some-times reached with the Fund before the govern-ment’s internal policy discussions have settled onclear choices and decisions.28
Given the prominent role of technical personnel inthe structure of government, these positions have be-come highly politicized, and the composition of ne-gotiating teams has tended to change with everychange of government.29
Program Support and GovernmentCommitment
The workings of the government machinery inBolivia appear to be characterized by a number offactors that have an obvious bearing on the scope ofsupport for, and government commitment to, reformprograms. In addition to the discontinuities in tech-nical positions in the ministries30 and the composi-tion of negotiating teams already noted, the transi-
tion between incoming and outgoing administrationsis often strained.31
There appear to be different circles of policymak-ing within government, the most prominent amongthem being a so-called “macro group” that meetsweekly and consists of the minister of finance, thevice-president, and the president of the central bank,to which the Fund resident representative is often in-vited. Instead of aiding the process of policy coordi-nation and consensus building, these circles tend inpractice to complicate the process through undueoverlap and rivalry.
The role of the legislature is especially critical ofthe fulfillment of government commitments. Thispoint was underscored in interviews withministers32 and confirmed by numerous referencesin internal Fund documents.33 Although many po-litical parties seem to support the general directionof the reform program, many of them are critical ofwhat they see as undue secrecy surrounding theFund’s relations with Bolivia, as evidenced by thelack of access of most congressmen, outside selectcommittees, to basic program documents, includingthe PFP.34
The private sector, including the banking and fi-nancial sector, has a generally more positive andsupportive attitude to the reform programs, an atti-tude partly reflecting the fact that, in contrast withother stakeholders, they have tended to enjoy muchgreater access to government. They also have had agreat deal of leverage over policymaking, whichthey have used, on occasion, to advantage.35
62
28There are several references in staff documents pointing tothis. For instance, a 1992 internal Fund document complains, “inpart because of a lack of coordination between the Ministry of Fi-nance and the Ministry of Planning, public sector investment wasnot limited as envisaged in the program” (July 17, 1992).
29Interviews, Bolivia, October 1997.30Many interviewees emphasized this discontinuity in the poli-
cymaking machinery, stressing that, to a large extent, the short-term focus of successive governments is attributable to interrup-tions in the institutional memory.
31In the most recent change of government, the incoming gov-ernment reportedly was handed documents relating to the pro-gram that had been negotiated by the outgoing government onlyten days before it formally assumed power in a transition periodthat lasted a whole two months. (Interviews, Bolivia, October1997.)
32Ministry of finance officials complained, for instance, thatthe Fund does not sufficiently appreciate the complexities of thelegislative process in Bolivia, especially the time it takes to ob-tain congressional approval of major legislation. (Interview withMinister Millares and others, Hong Kong, September 24, 1997.)
33For example, in 1993, the government’s inability to meetstructural benchmarks relating to banking sector reforms was saidto be attributable to delays in obtaining congressional approval.There are many other references suggesting that governments hadconsiderable difficulty in securing congressional support.
34Interview with Partido Democratro Cristiano (PDC), Bo-livia, October 1997. The mystification of Bolivia’s relations withthe Fund reflects not only these widespread perceptions of se-crecy but also the sensationalism with which these relations aresometimes portrayed in the Bolivian mass media.
35Thus, in December 1994, for instance, the government scaledback tax rebates to exporters in fulfillment of one of the prior ac-tions required for the presentation of the ESAF program to theFund Executive Board. However, this measure was subsequentlymodified in contravention of the commitments made to the Fund,in response to protests lodged by the business community.
Bolivia
Unlike the business community, other NGOs, inparticular those representing the indigenous groupsand labor unions, have been highly critical of thereforms on account of what they perceive as theirweak poverty alleviation impact. The indigenousgroups see their main concerns—decentralization,municipal governance, and environmental issues—as largely marginal to the Fund. To a very large ex-tent, these groups have tremendous ideologicalaffinity with the labor unions. The unions, for theirpart, have not only been critical of the reforms, buthave also been highly confrontational and ideologi-cal in their relations with government. In this re-spect, they differ a little from labor unions inAfrica generally, which, by and large, now acceptthe need for policy reform, focusing their concernsmainly on the issues of governance and adequatesafety nets.
Government reaction to labor protests in Boliviahas perhaps, for reasons of their confrontationaland ideological nature, tended to be inordinatelyheavy-handed, thereby leaving precious little roomfor dialogue and consensus building. Asked duringinterviews to provide more specific details of theways in which the programs affect them detrimen-tally, and also of how they are consciously margin-alized in the government’s decision-makingprocesses, the labor unions plainly confessed thatthey were unable to do so, in large measure becauseof the government’s refusal to give them access tostatistical and other relevant information. It wouldseem therefore that much of the antagonism theunions feel can be relieved by more conscious ef-forts at dialogue and education.36
Authorship of Program Documents andPolicy Initiatives
In the area of agenda setting and the design of pol-icy reforms, the evidence suggests that throughoutthe program period, but especially in its later years,contrary to the impression of most interviewees, therole of government at the technical level has beenquite prominent.37
Government Commitment and ProgramPerformance
The Bolivian program has achieved significantprogress in both the macroeconomic and the struc-tural sphere, although program implementation hassometimes been hampered by political strains. Thesecan be attributed to a number of factors, the most im-portant being frequent friction and difficulties in co-ordination between the executive and legislativebranches of government.
To be sure, this friction characterizes not only theconduct of the government’s relations with the Fundand the Bank, but also other social and economicpolicies as well, and to some extent is not unique toBolivia. However, in the area of Fund-governmentrelations in particular, the problem is aggravated inpart by a perception by some congressional leadersthat the economic reform agenda has somehow be-come the preserve of the executive branch—Fundmissions’ meetings are conducted almost exclusivelywith the executive branch—although the issues in-volved are national in character. This appears to be abit of a paradox because, as many staff documentspoint out, Fund missions do meet congressionalleaders from time to time. That this feeling of inade-quate participation persists in the Bolivian congresscan perhaps be explained by the fact that the interac-tion of Fund missions with congressional leaders isneither systematic nor truly consultative.
Other factors include the failure of program im-plementation schedules to sufficiently factor in real-istic timetables for obtaining congressional ap-proval; discontinuities in the technical leadership ofkey economic ministries, which in turn underminethe efficiency of public administration, with conse-quent delays in the decision-making process; and, fi-nally, a tradition of noncooperation between outgo-ing and succeeding administrations, often leading toa withholding of critical policy documents and datafrom incoming governments for protracted periods.
Initiatives to Promote Ownership
There are indications that governments have, fromtime to time, sought to explain policy measures tospecific interest groups. The present government hasbegun just such an initiative, rather explicitly called“national dialogue,” under which regular roundtablediscussions are conducted, which bring together rep-resentatives of the private sector and NGOs, includ-ing the churches, in an attempt to build a nationalconsensus on several policy issues.
On the part of the Fund, staff reports point to Fundmeetings with a wide cross section of stakeholdersbeyond the normal circle of government officials.There have been meetings of parastatal organiza-
63
36According to the union representatives interviewed, for in-stance, the union protests against the government’s privatizationplans, which precipitated the declaration of a nationwide state ofemergency in April 1995, were called only after attempts to en-gage the government in discussion had failed. (Interviews, Bo-livia, October 1997.)
37In interviews with officials, the fiscal programming unit ofthe Ministry of Finance, officials presented the PFP process asone of intensive discussion and interaction between governmentand Fund staff. They firmly rejected the view that the policyagenda was set by the Fund merely because initial drafts of thePFP came from the Fund. They saw the matter more in terms of“coauthorship” than as a unilateral decision by the Fund.
IV COUNTRY PROFILES
tions and, importantly, occasionally with membersof congress. It would appear from the hugely nega-tive image of the Fund in the public mind, and theunanimous condemnation of the “secrecy” surround-ing its operations in Bolivia, that these meetingshave been viewed as largely sporadic and routine,and not as part of a systematic operational style.
It is interesting to observe though, in this connec-tion, that in contrast with the Fund’s generally nega-tive public image, the image of the Managing Direc-tor of the Fund appears to be fairly positive.38
Indeed, this is a phenomenon we found in othercountries we visited, and which attests as much tothe significance that the public often attaches to vis-its by the Managing Director as to the effectivenessof the Managing Director’s communication skills.
Resident Representative
There has been a resident representative in La Pazsince the beginning of the program period. The cur-rent resident representative appears to enjoy a partic-ularly good relationship with, and access to, govern-ment at the highest political levels. He is clearly veryeffective and is widely viewed in political circles es-pecially as a friend of Bolivia although, by reason ofhis professed personal style,39 his role is not verywell known to the general public (especially thepress and NGO community), as a number of inter-viewees noted.
One other important observation that deserves tobe made about the role of the resident representativein Bolivia, and one which a number of intervieweesmade, is that most resident representatives have al-ways enjoyed good relations with government.40
The technical staff of the ministries quite under-standably view the resident representative’s office asa particularly good source of policy advice.
Conclusion
In spite of the difficult political environment inwhich reforms have been undertaken in Bolivia, suc-cessive governments have shown continuing com-mitment to the basic principles of the reform process,and a great deal has been achieved in the framework
of the 1994–97 ESAF, especially in the area of priva-tization. Program implementation would probably belater helped if greater attention were paid to the timeand politics it takes for government to obtain con-gressional approval for agreed actions.
Côte d’Ivoire
Following independence, Côte d’Ivoire had a pro-longed period of growth led by agricultural exports.By the 1980s, export crops accounted for half ofagricultural output. This period of growth came to anend at the beginning of the 1980s and the economythen went into rapid decline. The decline was trig-gered by the ending of the coffee and cocoa boomsof 1976–79, the aftermath of which produced a fiscalcrisis. During the first half of the 1980s there was areform program, leading to a brief resumption ingrowth by 1985. However, decline resumed in thelate 1980s owing to a conjunction of a further deteri-oration in the terms of trade of 40 percent and laxpublic spending: between 1980 and 1990 the civilservice increased by 57 percent (Ministère de l’Em-ploi, 1996, Table 12). By 1989, the governmentdeficit had risen to almost 18 percent of GDP, exter-nal debt was $15 billion, and per capita GDP wasfalling rapidly at about 5 percent a year.
This conjunction of fiscal crisis and economicdecline induced the government to embark upon anadjustment program, initially supported by an 18-month stand-by arrangement from November 1989,followed by a 12-month arrangement in September1991.
The Stand-By Arrangements and Their Sequel, 1989–93
Adjustment to the negative external shock wascomplicated by two features of the Côte d’Ivoirepolicy regime. First, there was a commitment to sta-bilize producer prices for cocoa and coffee.Whereas this stabilization policy had generatedlarge revenues, by the late 1980s it involved a pricesubsidy. The implication of this was that a negativeshock would be borne by the public sector ratherthan being automatically transferred to producers.Second, membership in the CFA franc zone at afixed exchange rate kept price levels essentiallyconstant. This meant that the real incomes of wageearners could only be reduced through nominalwage reductions. The negative external shock re-duced the equilibrium real wage in the economy. Ina flexible exchange rate regime the real wage wouldhave fallen as a by-product of an increase in theprice level. The exchange rate regime thus had im-portant implications for the political economy of
64
38Interview with Accion Democratica Nacionalista, Bolivia,October 1997.
39The resident representative said, in an interview, that he pre-ferred to keep a very low profile, and for this reason, he generallydoes not talk to the press, as other representatives do. He felt hewas very much an insider within government, and normally doesnot even participate in diplomatic activities. (Interview with theresident representative, Bolivia, October 1997.)
40A number of people interviewed seemed to prefer residentrepresentatives of Latin American origin as they seem to relatebetter to the political and cultural situation in Bolivia.
Côte d’Ivoire
wage adjustment. Whereas inflation would have re-duced real wages in a coordinated fashion and with-out any overt action by employers, in the context ofprice stability, reductions required individual em-ployers to change wage contracts. The governmentas an employer faced precisely this problem. It in-deed attempted to reduce nominal wages as part ofthe stand-by arrangement program. However, thistriggered such violent opposition that the policywas reversed. In the context of declining per capitaGDP, this real wage rigidity implied that the in-comes of civil servants were rising relative to meanincomes in the society. This was particularly prob-lematic because even prior to the negative shockIvoirien civil servants had been unusually well paidrelative to average incomes.41
As part of the stand-by arrangement, producerprices for cocoa and coffee were halved. Given theconcern with the fiscal position, this decision wasunderstandable since world prices were falling.However, it was very much a second-best responsereflecting the constraint imposed by the fixed ex-change rate. Once the exchange rate was adjusted, inJanuary 1994, the domestic currency price of trad-ables doubled. Hence, the chosen adjustment se-quence involved a temporary halving of export cropprices. This gave farmers an incentive first to reducetheir production of export crops and then to increaseproduction. The initial reduction, while necessary onfiscal grounds (given the exchange rate constraint),imposed resource misallocation costs on the econ-omy. These costs could have been avoided if the de-valuation had taken place earlier. Additionally, as wediscuss below, export taxation is highly regressive,so that the chosen adjustment sequence imposed anavoidable regressive redistribution.
Following the initial stand-by arrangement, therewere six World Bank Structural Adjustment Loans(SALs) covering the period 1989–93. Various struc-tural reforms were attempted in these years. Therewas a start to privatization, and financial reform fol-lowed a major banking crisis. There were substantialreductions in current expenditure (30 percent) andcapital expenditure (15 percent), and tax measuresaimed at broadening the tax base. The previous ex-pansion in the civil service was reversed with an 11percent contraction in numbers between 1990 and1992. Between 1989 and 1991, primary expenditurewas reduced by 28 percent.
However, the extent of net fiscal adjustment wasconstrained. First, there was continued contractionin per capita GDP of around 15 percent between1989 and 1993. A major reason for the continued de-
terioration in the economy was that the exchangerate had become substantially misaligned. In addi-tion to the direct resource misallocations implied bythis overvaluation, there was increasing financialspeculation that the exchange rate would be deval-ued. Second, there was continued deterioration inthe terms of trade. Both of these reduced revenues.Because of the inability to adjust the real wage billin the face of these declines in revenue, its share ofrevenue rose very rapidly: from 56 percent in 1989to 75 percent in 1993. Although the program initiallysucceeded in reducing the primary budget deficit byover 6 percentage points of GDP, the overall budgetbalance remained in heavy deficit. As a result therewas continued borrowing. In the first two years ofthe program (end-1989 to end-1991) external debtrose by a further $3.7 billion. The fiscal deficit,which had peaked at 18 percent in 1989, was still 13percent of GDP in 1993.
ESAF Program, 1994–97
The continuing fiscal and current account deficitsproved unsustainable. There were various attemptsto reach agreement among franc zone members ondevaluation but this involved considerable delay.The region finally agreed on a 50 percent devalua-tion in January 1994. The following March, Côted’Ivoire embarked upon its first ESAF program. Theobjectives of the program were to generate a primarybudget surplus of 3 percent of GDP by 1996 (to fi-nance debt service), to achieve GDP growth of 5percent by 1995, and to protect the most vulnerablepopulation groups during the adjustment period. Thefiscal objective was to be reached through a combi-nation of a revenue recovery and expenditure reduc-tion. Revenue was expected to recover as a result ofthe devaluation by about 4 percentage points of GDPin 1994, and thereafter was planned to remain con-stant at about 21.6 percent of GDP. Primary expendi-ture was to fall from 21.1 percent in 1994 to 17.8percent in 1996. The planned structural reforms in-cluded liberalization of the labor market; price de-control; trade reform, including reductions in importtaxes; civil service reduction; and accelerated priva-tization. Of these, there were substantial delays incivil service reduction, privatization, and the deregu-lation of export crop marketing.
It was recognized at the time that the urban poormight be adversely affected by the reforms, includingthe devaluation. To mitigate these effects, the programplanned targeted assistance to urban areas throughthree channels: emergency assistance targeted particu-larly to women and children; improvements in socialinfrastructure, including health and education facili-ties; and labor-intensive public works. It was envis-aged that the program would lead to a substantial rise
65
41This is indeed a general problem for the franc zone. On aver-age in the zone civil servants were paid, prior to the devaluation,11 times per capita GDP. See Goreux, 1995.
IV COUNTRY PROFILES
in rural incomes. The government’s social strategyalso involved reform of the health and education sec-tors. This involved raising enrollment rates in primaryeducation. The educational system was recognized ashaving low enrollment and high drop-out rates.
Fortuitously, the devaluation was very soon fol-lowed by a doubling in the world price of coffee.While not Côte d’Ivoire’s major export, this neverthe-less constituted a substantial temporary windfall.Thus, if the 50 percent devaluation was sufficient torestore equilibrium at the terms of trade prevailing atthe time of the devaluation, the economy switchedfrom having an overvalued exchange rate during anegative shock to an undervalued exchange rate dur-ing a positive shock. Had the exchange rate been flexi-ble, it would have appreciated in response to the termsof trade improvement. With a fixed exchange rate theexternal shock was inflationary.42 Thus, during 1994the economy was hit by two inflationary shocks—thedevaluation and the terms of trade improvement. Dur-ing the year the price level rose by 32 percent.
Associated with the devaluation and the terms oftrade boom was a large fiscal adjustment. Between1993 and 1995 revenue recovered, rising as a shareof GDP from 17.6 percent to 21.7 percent, while ex-penditure declined from 30.0 percent to 26.5 per-cent. As part of the program, the public sector wagebill was frozen, leaving the government the choicebetween salary levels and employment levels. Thegovernment chose to reduce salaries in real terms byonly limited compensation for the postdevaluationinflation, and by reducing the nominal wage for newrecruits while requiring older civil servants to retire.The number of employees in the civil service actu-ally started to increase again, although only mod-estly (Côte d’Ivoire, Ministère de l’Emploi, 1996).
The devaluation was successful in changing rela-tive prices. By May 1995, the price of tradables rel-ative to nontradables had risen by 15 percent andreal wages had fallen substantially (Goreux, 1995,p. 23). It also succeeded in reversing the decline inGDP: in 1995, 1996, and 1997 GDP grew by 7 per-cent per annum. Industrial production recoveredimmediately, increasing by 14 percent between1993 and 1995: unlike Zimbabwe and Zambia,Côte d’Ivoire did not have the features of a transi-tion economy. Both the devaluation and the tempo-rary favorable shock would have been expected toreduce consumption relative to savings.43 This in-
deed occurred: between 1993 and 1994 consump-tion fell by 14 percentage points of GDP, with in-vestment increasing by 6 percentage points and thecurrent account improving by 8 percentage points(Goreux, 1995, Table 26).
The planned social safety net measures were onlypartially implemented. The impact of the devalua-tion on consumer prices was phased in graduallythrough the use of subsidies and taxation. However,price increases were phased in more rapidly than hadbeen envisaged and the CFAF 10 billion allocated totemporary subsidies was underspent. The plans forlabor-intensive public works were not implementedin the first year of the program. The Fund urged thegovernment to accelerate implementation of thesepublic works.
Distributional Effects, 1989–97
The programs had social consequences partlythrough changing incomes and partly throughchanging social expenditures. We first consider theeffects on incomes.
Prior to the ESAF there had been a long period ofworsening poverty. Between 1979 and 1993, percapita consumption fell by 34 percent and the econ-omy informalized. Whereas in 1980 the modern sec-tor and the urban informal sector had each accountedfor 14 percent of employment, by 1992 the modernsector had contracted to 8 percent and the informalsector had expanded to 24 percent (Bodart and LeDem, 1995, Table 1). One reason for this rapid infor-malization was the constraint imposed by franc zonemembership, since (as noted above) it was muchmore difficult for real wages to fall in response tothe massive negative shocks of the 1980s.
The link from wage rigidity to informalization issupported by the results of a computable generalequilibrium model. In this model, a real wage cut of20 percent in the formal sector results in a 16 percentincrease in employment in the sector and an overallincrease in GDP of 2.5 percent. The wage cut re-duces the size of the informal sector and raises over-all incomes in the economy (Bodart and Le Dem,1995).
The adjustment programs affected income distrib-ution through many channels. Here we discuss thethree most important channels—the devaluation,changes in crop taxation, and the change in the pub-lic sector wage bill.
By design, in improving the balance of paymentsthe devaluation initially reduced mean consumption.However, in addition to this general decline therewould be distributional changes: net sellers of trad-ables would be favored relative to net purchasers oftradables. In general, farm households producing ex-port crops were likely to be net sellers of tradables
66
42This is because a favorable external shock raises the relativeprice of nontradables. Since the price of tradables is given innominal terms by the fixed exchange rate, the required relativeprice change can be achieved only through an increase in thenominal price of nontradables.
43A devaluation reduces real cash balances, and a temporary pos-itive income shock raises transient relative to permanent income.
Côte d’Ivoire
whereas urban households were likely to be net pur-chasers. The consequences of this redistribution de-pended upon the initial incidence of poverty amongthe various socioeconomic groups. Prior to the de-valuation, the incidence of poverty was much higherin rural than in urban areas. Within rural areas it wasdisproportionately high among households growingexport crops and female-headed households. Withinurban areas, it was disproportionately high amonghouseholds dependent upon the informal sector.44
This would suggest that the devaluation would bedistributionally progressive although adversely af-fecting some components of the initially poor, no-tably those in the urban informal sector and foodproducers.
Recall that during the stand-by arrangements theprices of export crops were halved. In 1994, duringthe ESAF, export taxation of cocoa and coffee wasreintroduced.
The distributional incidence of export taxation isregressive. It has been quantified for the case ofcocoa, using a computable general equilibriummodel (McIntire, 1997). These simulations suggestthat removing the current export tax on cocoa(which effectively amounts to almost 30 percent)would lead to a powerful redistribution from urbanto rural groups. However, in the case of cocoa, thereis a rationale for the export tax since Côte d’Ivoirehas considerable power in the world cocoa market.Although in aggregate the nation therefore gainsfrom the export tax, rural groups lose, while urbangroups not only capture the entire terms of trade im-provement but also benefit from a transfer from ruralgroups. These effects are substantial: rural groupswould gain about 10 percent from an abolition ofcocoa taxation. Since rural groups are poorer thanurban groups, this gives rise to a trade-off betweenefficiency and equity. An implication is that becauseurban groups are gaining from the tax at the expenseof rural groups, public expenditure would need to beheavily biased toward rural areas to compensate.With respect to coffee taxation, there is no suchtrade-off because there is no market power. The re-moval of the coffee export tax would therefore haveboth a positive distributional effect and improved al-locative efficiency.
The reduction in the public sector wage bill had itssocial consequences. Throughout the franc zone,civil servants have traditionally been paid at veryhigh rates. Prior to the devaluation, they received onaverage over 11 times mean national income(Goreux, 1995, p. xiii). Further, in Côte d’Ivoire, thecomposition of public sector employment is very
different from that of the workforce as a whole.First, it is disproportionately male. Whereas womenare a majority in agriculture and the informal sector,they constitute only one-third of public sector work-ers. Second, it is disproportionately Ivoirien.Whereas immigrants make up almost one-third ofthe labor force, they constitute only 11 percent of thepublic sector.45 Hence, to an extent, the reduction inthe public sector wage bill could be regarded as af-fecting adversely a relatively elite social group.
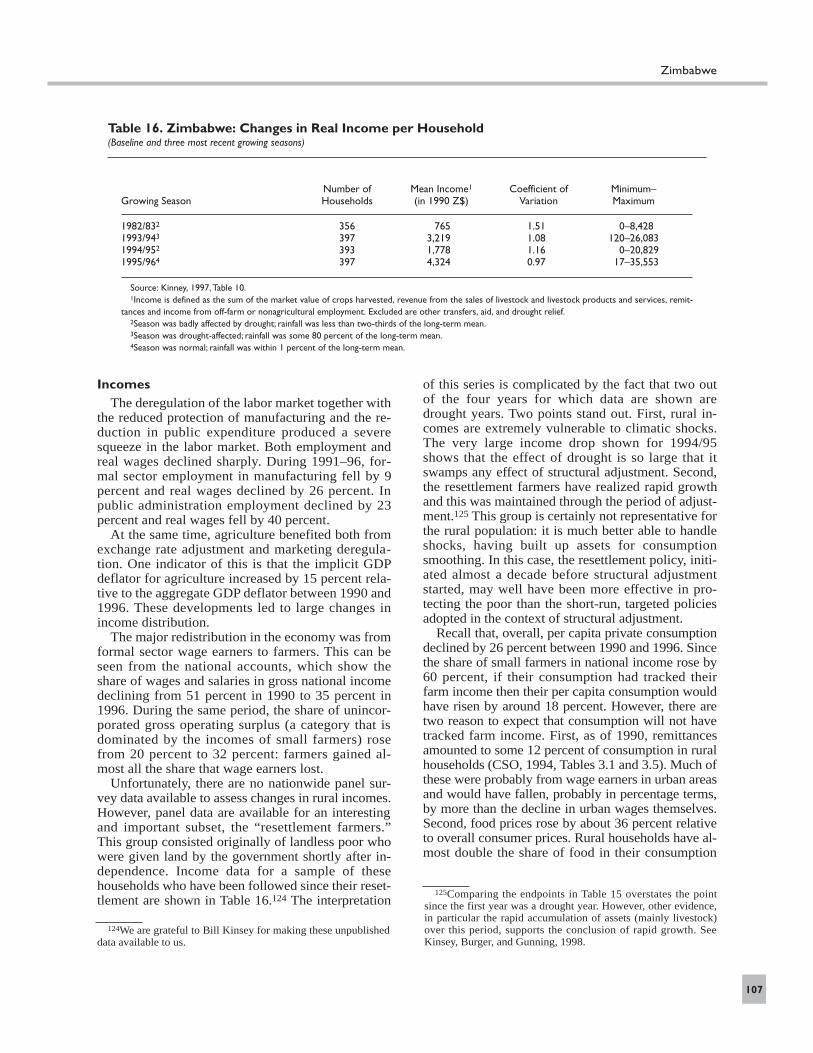
The net effect of reform programs has been thesubject of a number of surveys. These provide snap-shots of poverty in 1988 and 1993, thus spanning thepre-ESAF adjustment period. During this period,both the incidence and the intensity of poverty dou-bled (Table 7). There was little change in the distrib-ution of income and the deterioration in poverty re-flected the decline in mean incomes.
For the ESAF period, survey data are availableonly up to early 1995. This truncation is importantbecause in the first year after the devaluation the de-cline in per capita GDP continued, whereas it wasstrongly reversed during the following three years.Hence, the comparison of household surveys for1993 and 1995 does not pick up this recovery butonly the impact during the first year and a half. Dur-ing this initial phase of the ESAF there was a contin-ued increase in poverty, both the incidence andseverity of which worsened. This was due, as in thepre-ESAF reform phase, to a decline in mean in-come rather than to a change in the distribution ofincome (Table 7). As anticipated in the program,urban poverty had increased dramatically as a resultof the devaluation: in Abidjan, the headcount mea-sure rose from 5 percent to 20 percent between 1993and 1995, and the rate of unemployment rose to 15percent.46 Hence, the safety net programs failed toprevent a substantial deterioration.
Overall, between 1989 and 1995 per capita GDPfell by 12 percent and poverty more than doubled. Atthe end of this period three socioeconomic groups ac-counted for 80 percent of the poor: farm householdsproducing exports, food crop–producing households,and households dependent upon the urban informalsector. The incidence of poverty in these three groupswas 43 percent, 58 percent, and 31 percent, respec-tively. Poverty had become diffused across the majorsocioeconomic groups, whereas it had initially beenmuch more concentrated.
We now turn to the effect of the programs on socialexpenditures and the consequences for health and ed-
67
44Grootaert (1997) shows in a probit analysis of poverty that,controlling for education and various endowments, these groupsare significantly more likely to be poor.
45Côte d’Ivoire, Ministère de l’Emploi, 1996, Annex Tables 1and 5.
46The poverty incidence in Abidjan is taken from World Bank,1997d, p. 12, and the unemployment rate from Côte d’Ivoire, Mini-stère de l’Emploi, 1996, p. 32.
IV COUNTRY PROFILES
ucational outcomes. A major part of the adjustmentprogram was the correction of the fiscal deficit. Partof this adjustment was borne by reductions in expen-diture. Between 1989 and 1995, government primaryexpenditure as a share of GDP declined from 29.0percent to 19.5 percent. The social sectors were rela-tively protected in that the shares of both health andeducation spending in primary expenditure increased.The protection was more pronounced for the healthsector, the share of which in primary expenditure rosefrom 4.1 percent to 6.4 percent. The share of educa-tion increased only marginally, from 23.9 percent to24.6 percent. However, these budgetary reallocationsin favor of the social sectors were insufficient to pro-tect their spending levels in real terms per capita. Todo so would have required health expenditure to haverisen to 6.9 percent and education expenditure to haverisen to 40.3 percent of primary expenditure.
Health
During the adjustment program real per capitapublic expenditure on health declined (Table 8).47
Additionally, there was a substantial shift from re-current to capital expenditure, so that the latter rosestrongly in real terms. The growth in the capital bud-get was disproportionately directed toward primaryhealth care. By contrast, the composition of recur-rent expenditure was virtually unchanged. This sug-gests that the composition of the recurrent budgetwas failing to take into account the changes in thecapital program that would be presumed to have re-current cost implications.
There is some evidence that prior to the adjust-ment program the incidence of health spending washighly regressive. One available measure is the shareof total consultations in public health centers foreach income quintile. In 1988, the richest quintile
had double the share of the poorest quintile. By1995, the difference had narrowed: the richest had1.6 more consultations than the poorest. However,even by 1995, public spending remained highly re-gressive. Spending on health care per capita wasthree times greater for the highest income quintilethan for the lowest.48
As part of the policy reforms, user charges wereintroduced into the public health care system in1991. Despite these charges, usage by the two poor-est quintiles increased, while usage of the privateformal health care system fell sharply. There is alsoevidence, however, of a shift into usage of tradi-tional medicine (see CIRES, 1995).
There is evidence that during the preadjustmentcrisis of the 1980s there was a deterioration in thequality of health care. For example, the rate of mater-nal mortality in hospitals tripled between 1978 and1990. During the adjustment period itself quality im-proved. A vaccination campaign, launched in 1987,has made substantial progress although failing toreach its original targets: between 1987 and 1991 sur-vey results show significant improvement. Duringthe 1990s, neonatal tetanus has been eradicated fromAbidjan, the blood transfusion service has been madesafe from HIV infection, and an increased proportionof pregnant women receive professional health care.Despite these improvements, the state of health re-mains a major problem. The incidence of stunting in-creased from 20 percent in 1988 to 35 percent in1995 (Table 8), and a survey that asked people toidentify their problems found that among women,health was ranked first.49
Education
During the adjustment program real per capitapublic expenditure on education declined by over 35
68
Table 7: Poverty in Côte d’Ivoire, 1979–95
1979 1985 1988 1993 1995
Private consumption per capita(in thousands of CFAF, 1987 prices) 225 189 187 148 129
Source: World Bank, 1997d.Note:The incidence of poverty is the percentage of people living below the poverty line of CFAF 6,350 per month.The intensity of poverty measures
the shortfall from the poverty line: here we use the “P1” measure.
47On the data presented by Demery, Dayton, and Mehra, 1997,the implied fall is somewhat larger, at 16 percent.
48Demery, Dayton, and Mehra, 1997, Figure 2. The data are for1995.
49Côte d’Ivoire and UNICEF, 1996, Table 37.
Côte d’Ivoire
percent (Table 8). Within this decreasing total therewere compositional changes in recurrent expendi-ture. Between 1990 and 1995, the share of primaryeducation increased from 46 percent to 49 percent,that of secondary education fell from 40 percent to34 percent, and that of tertiary education increasedfrom 14 percent to 18 percent.
Within primary education, the number of teachersincreased slightly: the required reduction in thewage bill was achieved by a reduction in the realsalary of teachers. Measured as a ratio of mean percapita GDP, the mean salary of teachers fell from12.6 to 8.7 between 1992 and 1995. The sharp re-duction in the wage bill permitted a massive increasein nonsalary expenditures on primary education:from 2 percent of the salary bill to 11 percent. Thenumber of pupils per teacher increased by 10 per-cent. There were therefore three developments thatmay have affected the quality of education: thelower wages, which demotivated teachers; higherexpenditures on teaching materials; and an increasein the pupil-teacher ratio. The net effect of thesechanges on the quality of education is ambiguous.Abstracting from a possible change in quality, thepolicy change achieved both an increase in educa-tional output and a reduction in educational expendi-ture through reducing the unit cost of primary educa-tion. There remained scope, however, for furtherimprovements in educational efficiency. Whereas inprinciple it should take six years to complete pri-mary education, on average pupils were taking al-most nine years.
These changes were even more dramatic at thesecondary and tertiary levels. The unit costs of sec-ondary education fell relative to those of primary ed-
ucation from 4.9 in 1988 to 2.1 in 1996. Similarly, inuniversity education relative unit costs fell from 15.5to 11.1 (World Bank, 1997e, Table 3). By 1997 thishad provoked major political opposition includingprolonged strikes.
The incidence of educational expenditure differedenormously as between primary and the higher lev-els. Comparing the richest and the poorest quintile,public expenditure per capita on primary educationwas substantially higher for the poor. By contrast,spending for secondary and tertiary education wasabout seven times higher for the rich. This swampedthe progressivity of primary spending, so that overallpublic spending on education was about two-and-a-half times greater for the rich than for the poor (De-mery, Dayton, and Mehra, 1997, Figure 4).
Gross enrollment in primary education increasedsubstantially between 1986 and 1995 (Table 8). Theincrease was relatively larger for the poorer house-hold groups: enrollment for the poorest quintile ofhouseholds increased from 39 percent to 56 percent,and within this group enrollment of girls increasedmore than that of boys. Despite this improvement,educational indicators were very poor: by 1995, only45 percent of girls from the poorest quintile ofhouseholds were receiving primary education. Thisimprovement in primary education was not matchedat the secondary level. The gross enrollment rate de-clined from 34 percent to 31 percent between 1986and 1995.
Thus, the two reform programs certainly involvedmassive reductions in government expenditures andthese inevitably substantially reduced social expen-ditures. The smaller component of these expendi-tures—health—was, however, almost fully protected
69
Table 8. Côte d’Ivoire: Health and Education Expenditures and Outcomes
Sources: Infant mortality, life expectancy, stunting, enrollment and literacy: World Bank, 1997d, p. 6; enrollment rate for 1986 from Demery, Dayton,and Mehra, 1997, Table 8; spending per capita (in thousands of CFAF, 1985 prices) from UNICEF, 1997.
IV COUNTRY PROFILES
by large reallocations of the budget in its favor. Withrespect to education this was not feasible, and educa-tional expenditures declined almost in line withoverall expenditure reductions. However, the effectof the reduction in educational expenditures wasborne largely by teachers. This tended to lower thequality of education, partly by demotivating teachersand partly by shifting the composition of the profes-sion toward the less-qualified. A two-tier system ofwages was introduced for existing employees versusnew entrants, and existing employees were encour-aged to leave. However, the reduction in teachersalaries was sufficiently large to leave room for in-creased nonwage expenditures in primary education.It is, therefore, possible that the deterioration inteacher quality was offset by improved provision ofmaterial inputs.
Summary of Developments Under ESAF
The experience of Côte d’Ivoire is distinctive inour sample because of its membership in the franczone. First, the inability to adjust the exchange ratein response to external shocks contributed to the pro-longed decline of the economy during the 1980s andthe build-up of severe disequilibria in the labor mar-ket, the balance of payments, and the budget. Sec-ond, during the phase of policy reform after 1989,the delay in exchange rate adjustment restricted pol-icy options to actions that were subsequently re-versed once devaluation was achieved.
Franc-zone membership also limited the optionsfor fiscal adjustment, forcing the burden of adjust-ment to be borne by expenditure reduction. The im-plied real wage rigidity contributed to the informal-ization of the economy. This in turn eroded the taxbase. As of 1989, the government faced a huge fiscaldeficit, which could not be eliminated by increasedtaxation owing to the rapid contraction of the privateformal sector. The Fund attempted to increase fiscalrevenues through measures that were clearly detri-mental to income growth. Privatization receipts wereincreased by conferring monopoly rights on thebusinesses to be privatized, and the Fund argued fora high external tariff for UEMOA.
The required reductions in public expenditureswere imposed on a system that was already failing tomeet basic social needs. First, the composition of so-cial expenditures had been geared to meeting the de-mands of the urban elite. Second, during the crisis ofthe 1980s service provision had already massivelydeteriorated (see Berthelemy and Bourguignon,1996). As a result, by 1989, Côte d’Ivoire had verypoor social indicators for its level of income. How-ever, the government chose to place most of the bur-den of adjustment on its own employees. This wasdistributionally progressive because the civil service
was initially unusually privileged. As a result, theprovision of social services was very largely pro-tected despite massive expenditure reductions.
Turning from social service provision to the gen-eration of income, the social costs of adjustment inCôte d’Ivoire were not high. The major groups thatwere initially poor—rural households—were mostlynet beneficiaries of the relative price changes. Nordid the economy face problems of transition: withinfour years of the devaluation the economy hadgrown by more than 20 percent and industrial outputhad increased substantially. Among the initiallypoor, the major group of losers were those in theurban informal sector. For this group there was anacute increase in poverty. The government bothplanned and executed safety net programs for thisgroup, but its interventions could have been largerand faster.
Ownership Issues:The Political Context
The 1990s marked the beginning of major struc-tural reforms in the economy. So also did they usherin a process of political liberalization with the firstmultiparty elections in 1990. The death of PresidentHouphouet-Boigny in December 1993 set off a pe-riod of political turbulence, which subsided onlywith the endorsement of Mr. Henri Konan Bedie aspresident by the ruling party in 1995, and the presi-dential and parliamentary elections that followed inthat same year. The instability generated by this tran-sition was to have significant implications for theimplementation of the ESAF program.
Interviews conducted with government officials,representatives of the ruling as well as oppositionparties, and other stakeholders shed a great deal oflight on the issues of governance, program owner-ship, the depth of social and political support foreconomic reform, and popular perceptions about theFund’s operational methods.
In general, the evidence will seem to suggest thatthe ESAF program, much unlike the precedingstand-by arrangements, benefited from a reasonablemeasure of national ownership, especially judgedfrom the apparent commitment of the top levels ofpolitical leadership, and from the degree of govern-ment involvement in the preparation of policy docu-ments, particularly the PFP. Indeed, government of-ficials generally acknowledged, in interviews, thatthe ESAF program, and in particular the PFP, pro-vided the occasion and opportunity for muchbroader consultation and consensus-building withingovernment than the preceding arrangements.Whereas the stand-by arrangements were typicallynegotiated by a small technical group within theMinistry of Finance and cleared with the president,sometimes without even full-fledged cabinet discus-
70
Côte d’Ivoire
sion, the ESAF, through the mechanism of the PFP,involved technical teams (and some ministerialoversight) from other ministries at the stage of pro-gram preparation.
Political Commitment
For purposes of a general assessment of nationalownership, however, three periods can usefully bedistinguished: the first period, starting with the be-ginning of reform efforts in the 1980s and endingwith the death of President Houphouet-Boigny inDecember 1993; the second, roughly covering theperiod of transition from December 1993 throughthe end of 1995, with the formal assumption ofpower by Konan Bedie as president; and the third,from 1996 through 1997.
The first period was predictably characterized bystrong high-level political commitment stemmingmainly from the decisive and highly centralized au-thority of President Houphouet-Boigny. Given thisdegree of centralization and the absence of real de-mocratic participation, the reform efforts initiallydepended very little on wider societal support. Evenso, it is worth noting that by the closing years of theHouphouet-Boigny era, as political liberalizationdawned, deep fissures had opened in the crust of thebody politic, and strong popular opposition, espe-cially to reforms in the public sector and in educa-tion, had begun. Indeed, a stand-by arrangement ap-proved by the Fund’s Executive Board in September1991 ran into difficulty over disagreements aboutthe public sector wage bill, with the prime ministercomplaining that Côte d’Ivoire had, in his view,“reached the technical and social limits of the do-mestic adjustment strategy.”
However, it was in the second period, the periodof political transition, that the sustainability of thishigh-level political commitment was put to theseverest test. The strains of the transition periodfound their most vivid expression in the implemen-tation of the privatization program. However, theprogram soon became a pawn in the contest for thissuccession when Mr. Bedie, then as president of theNational Assembly, introduced in 1993 debate in theAssembly and obtained an overwhelming vote sus-pending the program until a clear regulatory frame-work had been established. Although on this occa-sion President Houphouet-Boigny used thetremendous weight of his authority to resolve theimpasse by directives to the Central Committee ofthe ruling party, the program remained mired in con-troversy after his death, in spite of a general enablinglaw passed in June 1994 by the national assembly.
While the continuing slippage in the timetable ofenvisaged actions was in part attributable to admin-istrative and technical problems resulting from the
absence of reliable financial reports and data, it was,in large measure, the product of political factors. Itwas not until 1995, when the new presidency hadbeen consolidated, that the program regained its mo-mentum with a set of new initiatives that came to bereferred to as “Bedie’s style” privatization.
Once the tensions of the transition period and thepolitical maneuvering associated with elections sub-sided, the political leadership became more cohesiveand its commitment to the program more resolute.Starting from the second year of the program, there-fore, agreed structural reforms were carried out withgreater resolve and with much less slippage. InMarch, a Fund mission found the results of the pro-gram “broadly satisfactory” and reported that withregard to structural reforms, the government hadachieved “significant progress.”
Thus, it is fair to say that throughout much of theprogram period, except for the period of political tran-sition—which really began with political liberaliza-tion in the closing years of the Houphouet-Boignyera, and ended with the consolidation of power by thenew presidency—the commitment of the politicalleadership to the reform process remained quite high.Indeed, even in the transition period, no fundamentalshift in policy as such occurred.
This high level of political commitment and therelatively smooth record of program implementationwas—and this is important—in part attributable tothe fact that some of the most politically difficult re-form issues, notably those of civil service and labormarket reforms, had been largely exhausted by thetime the ESAF program began.
Scope of Support: The Depth of the Social Consensus
As noted, earlier, the pre-ESAF reforms had beenundertaken under a restrictive political environmentthat depended mostly on the centralized authority ofHouphouet-Boigny for its legitimacy. During thisperiod, relatively little was done to inform and courtthe support of stakeholders outside the small circleof political actors around the president. This longtradition of nonconsultation began to change onlyslowly with the onset of multiparty politics, whichpaved the way for a deepening of the consultativeprocess within the ruling party itself and for a reach-ing out to other political constituencies. Within theleadership of the ruling party, support for the reformprogram was initially restrained, in part because itthreatened vested interests and also in part becausethere was a widespread feeling that the policychanges, in particular the structural reforms, were animposition from the Fund.
Interviews conducted with the leadership suggestthat there is now a larger body of support for the re-
71
IV COUNTRY PROFILES
forms. Objectively, this is no doubt because a recov-ery is under way. In the view of the leadership, how-ever, this is due partly to a recognition that develop-ments in the globalization of the economy made thechanges inevitable and partly also to the fact that theESAF framework provided a longer-term policyframework, which enabled the social impact of ad-justment to be better addressed. By contrast, consen-sus building with the opposition parties and with theunions and student groups appears to be inadequate,at least in the eyes of the leadership of these bodies;at any rate, dialogue with these constituencies is arather recent development.
While there is recognition of a welcome change inthe political culture toward greater inclusivity, thepredominant sentiment in these constituencies is thatconsensus building must be closely linked with goodgovernance to be credible. In this connection, thereis general agreement that a democratization of theelectoral code—among other things, to rid it of pro-visions that are ad hominem, at least by implica-tion—and the adoption by government of measuresto arrest a return to extravagance and conspicuousconsumption among the ruling political elite wouldbe important signals. The unions, for their part, ac-knowledged in interviews that, in contrast with whathad prevailed in the pre-ESAF reform period whenpolicy changes were, in their words, simply “handeddown,” there is now the beginning of a tradition ofconsultation, although this is still more formal thansubstantive. For instance, the new labor code, ac-cording to them, was formulated without prior con-sultation with them, and when labor’s views weresought, the code was promulgated before their com-ments were submitted. There is continuing concernamong labor, especially about the impact of privati-zation on employment.
A number of important observations need to bemade on the general outlook of the political con-stituencies outside the ruling party. One is that inspite of lingering concerns about the social impactof the adjustment process and about the pace andspeed of change, there is general acceptance andunderstanding of the need for change and recogni-tion that it is in the objective interest of the country,given the general direction of global developments.Second, there was also, in our view, a general con-viction in these constituencies that greater access toinformation on the context and reasons for reformswould greatly facilitate the process of consensusbuilding and prevent disruptions in implementationcaused by social protest. These views were alsobroadly shared by the business community. Askedspecifically during interviews what assurances theycould provide to government that, if confidentialdocuments were made available to them, theywould not be exploited for political advantage, the
leaders of these constituencies stressed that theircommitment to the national interest and the re-quirement of stability for national developmentwould rule out any betrayal of confidence for short-term political gain. They further stressed that, atany rate, such short-term political gain could be-come a deterrent to responsible policymaking anddialogue with political opponents if they (the oppo-sition) should find themselves in power.
Authorship of Program Documents and Policy Initiatives
Most interviewees did not really see authorship ofpolicy documents and initiatives as the critical deter-minant of national ownership as such. Nevertheless,they complained that Fund staff tended to stifle localinitiatives in preparing drafts, preferring always towork with their own drafts. For the PFP process inparticular, staff documents themselves suggest thatthe custom is for the first drafts to be written byFund staff, on the basis of consultations with theWorld Bank. Government officials interviewed andsome patchy references in staff documents suggestthat there were obvious exceptions to this practiceand that, occasionally, government participation inthe preparation of early drafts was more than token.However, the overwhelming view in governmentcircles was that these were largely grudging devia-tions from well-established custom.
Technical staff in the government also stressed theneed for more effective technical assistance to im-prove the government’s capacity to prepare policydocuments and strengthen the government’s role innegotiations with the Fund. They acknowledged, inparticular, that the secondment of Fund-based staffof national origin was a useful device and that in thecase of Côte d’Ivoire, this, along with technical as-sistance programs with the Fund, the World Bank,and France had gone a long way toward improvingnational capacity although problems remained, espe-cially in the area of data preparation and analysis.Over the longer term, one problem that would persistin the absence of incentives comparable to thoseavailable in the private sector was the constant lossof trained personnel to the private sector.
The Fund’s Operational Methods
The Fund has had a resident mission since aboutOctober 1984. Our impression is that the incumbentresident representative is rather atypical in that hehas fairly extensive contacts and excellent relations,not only with the technical ministries but also withpolitical leaders, both within and outside the rulingparty. His contacts with the business community andthe unions appear to be equally cordial.
72
Malawi
In general, IMF staff contacts with the countryhave focused on the top political leadership and thekey economic ministries. Fund missions have usuallyhad access to the prime minister and the ministers forfinance, economy, planning, and agriculture, as wellas the National Director of the Central Bank of WestAfrican States (the BCEAO). In the course of thefirst mid-term review of the ESAF program, for in-stance, the Fund mission met with a broad range ofgovernment officials, including the Minister of In-dustry and Commerce and the Minister of Agricul-ture and Animal Resources. One notable feature ofthe Fund’s contacts in Côte d’Ivoire is that missionsoften met the president and the prime minister.
There are also references in the staff reports, whichwere confirmed by interviewees in the field, to con-tacts between Fund staff and officials of public enter-prises, as well as representatives of political partiesand other interest groups, including representativesof the private sector and the bankers’ association.
Interestingly, however, our impression is that thisapparent broadening of Fund contacts with stake-holders in the country, outside of the traditionalFund contacts, has done little to encourage a realsense of participation among these constituencies inthe process of policy formulation and generally inthe conduct of the country’s relations with the Fund.This is a sentiment that was echoed in just aboutevery country we visited, about which we will havemore to say in our general observations section.
Cooperation with Donors and the World Bank
The Fund documents portray the usual picture ofclose cooperation with the Bank and the full partici-pation of the Bank, both at headquarters and at theBank’s resident missions in the work of Fund mis-sions in the country. There are also many referencesto the participation of Bank staff in the preparationof early drafts of the PFP. On closer examination,however, there are indications that these relationswere not always so well coordinated. This is particu-larly true in the area of financial sector reforms,where there were apparent disagreements betweenthe Fund and the Bank over the appropriate level ofcash payments to the domestic banks from the gov-ernment over the period 1991–95 in the context ofdomestic debt restructuring.
Government Initiatives to Promote Ownership
In the area of ownership, the government’s sensi-tivity to the need for consensus building among abroad range of social forces coincided with theonset of political liberalization and the surge ofpopular protest against measures introduced in thestabilization period to reduce the public sector
wage bill and liberalize the labor market. There isevery indication that the process of consensusbuilding is deepening with the beginnings of moreeffective dialogue with the opposition parties andother stakeholders, although suspicions remainabout the depth of the government’s commitmentto genuine dialogue.
Malawi
In Malawi the precursor to ESAF was a sustainedbreak in the growth rate: after two decades of rapidgrowth, per capita GDP declined by about 1 percentper annum during 1979–87. This decline had threecauses.
First, the growth strategy was arguably unsustain-able. It depended upon high implicit taxation of thesmallholder sector with the surplus used for invest-ment in parastatals. While this caused the small-holder sector to stagnate, the parastatals became theengine of growth. Although many African countriesfollowed this strategy, Malawi was the only one tomake it work. This was at least in part because Pres-ident Banda imposed hard budget constraints uponthe parastatals (see Pryor, 1990). By the 1980s thesebroke down, the parastatals sank into heavy losses,and the investment rate collapsed.
Second, the economy was hit by unusually severeexternal shocks. By 1987, the cumulative loss fromthe terms of trade decline was 65 percent of 1979GDP.50 Even with ideal policy responses this wouldhave reduced investment and growth through thedecade. In addition to the decline in the terms oftrade, war in Mozambique broke the transport con-nection to the ports. By 1984 shipment costs were2.5 times as high as in 1980 and it is estimated thatthis reduced the growth rate in the following fiveyears by 1.4 percentage points per annum (see VanFrausum and Sahn, 1996). The war also caused aninflux of almost a million refugees.
Between them these two problems were both re-ducing growth and affecting the budget. Revenue asa percentage of GDP declined because of the con-traction in imports. Expenditure as a percentage ofGDP increased because of the need for a military re-sponse to the National Resistance Movement ofMozambique (RENAMO), the refugee problem, andthe accumulation of a strategic grain reserve.
Third, the initial policy response to the shockswas suboptimal. Although there was some exchangerate adjustment, trade restrictions increased and for-eign exchange was rationed, so that the currency be-came overvalued. It has been estimated that this
73
50Calculated from Table 2.2 of World Bank, 1997a.
IV COUNTRY PROFILES
overvaluation was about 40 percent and that it re-duced GDP during the 1980s by 15 percent.51
Cumulatively, these three elements severely re-duced living standards. Between 1979 and 1987, bothmean per capita private consumption and mean small-holder value-added fell by about one-fourth (see Table9). Even before this decline, the incidence of povertyin Malawi was among the highest in the world, so by1987 there was an acute poverty problem.
Even by 1983 these problems were sufficiently seri-ous to require Fund involvement, although the pro-gram was in effect aborted in 1986. At the time theprogram collapsed in 1986/87, the central bank wasnot able to meet external payments obligations and thebudget deficit was 12.5 percent of GDP. In 1987, thegovernment adopted a shadow program and in 1988Malawi became the first recipient of ESAF financing.
The First ESAF: Program Design
The focus of the program was partly fiscal andpartly structural. The fiscal objective was to reducegovernment expenditure from 33 percent of GDP in1986 to 24 percent by 1991, partially offset by aplanned reduction in revenue from 20 percent to 18 percent over the period. Within revenue, therewas to be a switch from taxes on production to taxeson consumption. The structural objectives were lib-eralization of foreign exchange, productivity gainsin smallholder agriculture, reform of agriculturalmarketing, and financial liberalization. The growthobjective was modest: it was anticipated that the de-cline in per capita GDP would be converted into asmall increase.52 Since the expectation was for littlegrowth, the reduction in the expenditure share im-
plied a reduction in per capita government expendi-ture of one-fourth over five years.
The social impact of the program was explicitlyconsidered. The government intended to increase theshare of social expenditure. Since the initial share ofsocial expenditure in total expenditure was 20.5 per-cent, to be fully protected from the planned reduc-tion in total expenditure, if the planned growth ofGDP had been achieved the share of social expendi-ture would have needed to rise to 27 percent. Planswere broadly consistent with such protection. Forexample, the 1988/89 budget planned to increase theshare of social services to 22.6 percent. Althoughoutturns tended to fall short of these plans, by1992/93 the share had risen to 24.8 percent.
The structural reforms focused on trade liberal-ization and the smallholder sector. With respect tothe latter, there was attention to raising producerprices, increasing fertilizer use, accumulating astrategic grain reserve, and lifting restrictions onentry into cash crops. The likely social impact ofthe pricing reforms was largely positive. Over-whelmingly, poverty was rural and the reformswere aimed at raising rural incomes. However, thesituation was complicated since the poorest 40 per-cent of smallholders were substantial net pur-chasers of maize, meeting only about two-thirds oftheir requirements from their own production, andso would face higher net costs from increases inmaize prices. By contrast, the better-off 60 percentof smallholders produced twice as much as theyconsumed.53 A 1990 internal Fund document notedthis problem. Since the poorer smallholders werenet sellers of labor and disproportionately locatedin the southern region, this could have been tackledeither through raising minimum wages on the es-tates, or through a program of targeted labor-inten-
74
51Van Frausum and Sahn, 1996, Table 11.3.52A second scenario conditional upon additional donor funding
anticipated per capita growth accelerating to 2 percent.
Table 9. Malawi: Private Consumption and Smallholder Income, 1979–96(Kwacha at 1978 prices)
Private Consumption Smallholder Value-Per Capita Index Added Per Capita Index
Source: Malawi, National Accounts.Note: The 1991 population is estimated as 9.1 million; we have assumed a population growth rate of 3.0 percent.
53World Bank, 1995b, Table 3.22.
Malawi
sive rural public works.54 The former was indeedadopted: minimum wages were doubled in 1989.55
The strategic grain reserve was deployed in 1990 tooffset the effects of drought.
Outcomes from the First ESAF
Fiscal adjustment was gradual but effective: by1991 the fiscal deficit (including grants) fell to 3 percent of GDP.56 By contrast, structural adjust-ment was limited. Agricultural marketing remainedheavily controlled, and the exchange rate remainedovervalued. The net effect on growth during1987–91 was that per capita GDP continued its de-cline, but at the more moderate rate of 1 percent perannum. Van Frausum and Sahn (1996) estimate a“pure” effect of the ESAF foreign exchange inflowin the absence of policy changes and this seems themost pertinent characterization of the impact of thefirst ESAF. They estimate that the inflow increasedGDP substantially, by around 4 percent relative tothe counterfactual.
From 1992 the fiscal position rapidly collapsed.There were three further shocks in 1992: the mostsevere drought of the century, during which maizeoutput fell by 60 percent; a cutback in aid of nearly4 percent of GDP as donors pressed for politicalliberalization; and a 68 percent wage increase inthe public sector in response to labor unrest. Thiswas followed by a period of contested elections, achange of government, and a further drought, cul-minating in a deficit (including grants) of 15 per-cent of GDP in 1994/95. One of the last acts of theold government was to float the exchange rate, therate against the dollar falling from 4.4 to 15.3. Thecombined effect of the shocks and the fiscal col-lapse was that per capita GDP declined by 8 per-cent between 1992 and 1994.
Outcomes from the Second ESAF
In 1995 the new government adopted a new ESAFprogram. This envisaged rapid fiscal adjustment, re-ducing the fiscal deficit to 4 percent by 1995/96. Gov-ernment expenditure was planned to fall from 42 per-
cent of GDP in 1994/95 to 28 percent in 1998/99. Thestructural reforms included privatization of public en-terprises, civil service reform, the elimination of therestrictions on smallholder access to land and cashcrops, and the liberalization of agricultural marketing.The net effect of the reforms was expected to raise thegrowth of GDP per capita to 1.5 percent per annum.
There is evidence that the agricultural reformswould indeed be addressing the constraints faced bythe rural poor. As of 1990 among the poorest small-holders nearly one-fifth considered government reg-ulations or transporting and marketing as the mostimportant constraint on new enterprise. However, afurther one-tenth identified lack of technical infor-mation as the most important constraint, while en-hancing the extension service was not a focus of pro-gram design.57
The envisaged reduction in the government expen-diture share and GDP growth implied a fall in percapita real public expenditure of 34 percent between1994/95 and 1998/99. Despite this, social expendi-tures (on health and education) were planned to in-crease, not just absolutely, but as a share of GDP, from4.5 percent to 6.4 percent. As part of this, primaryschool fees were abolished, leading to a 50 percent in-crease in enrollment. Although this was fiscally de-manding, it should be noted that expenditure in1994/95 was highly atypical, so that much of the ad-justment could be achieved simply by reverting to theprecrisis budget.
The program was explicitly designed to be pro-poor. It was again explicitly recognized that thepoorest were net purchasers of maize. To mitigatethe negative effect of envisaged food price increaseson this group, the program included public works,targeted input programs, and supplemental food pro-grams. An innovative feature was the Malawi SocialAction Fund, in which rural communities them-selves identified and partly financed projects. Theprogram faced some difficulties because of the ab-sence of democratic institutions of government atthe local level.
To date, the program has been highly successful.Fiscal stabilization was achieved very rapidly withthe fiscal deficit falling to 3.8 percent by 1996/97.Combined with favorable weather, the growth effectwas dramatic: per capita GDP may have grown by5.6 percent per annum during 1994–1997.58 The ef-fect of the agricultural pricing reforms alone has beenestimated to increase GDP by about 3 percent.59 The
75
54Malawian smallholders are atypically integrated into labormarkets. A measure of this is that out of about one million small-holder households, over 300,000 members were away working orlooking for work for more than three months during 1992/93(Malawi, NSSA, 1992/93, Vol. 4, Table A6.0).
55Fund staff produced a study in which the impact of changes inconsumer prices, producer prices and wages on the real income ofvarious social groups was calculated. See Hicks and Brekk, 1991.
56This is inclusive of interest payments on domestic debt of 2 percent of GDP. Nearly all of this was in fact debt reductionsince real interest rates were much lower than nominal interestrates.
57Malawi, 1991. We report the responses of the poorest 40 per-cent of smallholders in the southern region, the poorest of thethree regions, Table 29, p. 330.
58This estimate is based on provisional national accounts dataat 1994 prices.
59Van Frausum and Sahn (1996), Table 11.3.
IV COUNTRY PROFILES
effect of the exchange rate adjustment implementedjust before the change of government was probablymuch larger. Recall that the effect of a full exchangerate liberalization (40 percent real devaluation) wasestimated to raise GDP by around 16 percent. Al-though the actual devaluation was initially evenlarger than this, it was rapidly eroded to about 20 per-cent by 1996. Its effect on growth was neverthelessprobably larger than that of the agricultural reforms.During the financial liberalization, real interest rateswere initially heavily negative, but by 1997 had risento about 16 percent. The banking sector remained un-competitive: liberalization had focused more on in-terest rates than on market structure.
Distributional Effects of the First ESAF
There are two routes by which the ESAF mighthave had a social impact—through changes inhousehold incomes and through changes in socialexpenditures. We consider these in turn.
During the first ESAF program there was littlestructural change. Further, although the decline inthe economy was halted, there was no growth in percapita terms in GDP. Hence, one would expect thatthe impact on incomes would be rather limited. Amore sophisticated basis for expectations of the im-pact on incomes comes from a simulation model.
The main effects of the program were to augmentforeign exchange inflows and to contain public ex-penditure. The distributional effects of the “pure”foreign exchange inflow has been simulated by VanFrausum and Sahn (1996). Their results suggest thatthe benefits from a pure foreign exchange inflowwould accrue disproportionately to urban socialgroups: urban wage earners, particularly those in thegovernment sector, and the corporate sector. Con-versely, the shares of income accruing to smallhold-ers and estate labor would fall. In absolute terms,they estimate that for smallholders the adverse dis-tributional effects outweigh the positive overall ef-
fect of ESAF on GDP of 4 percent. Smallholder in-comes fall by 2 percent as a result of a “pure” ESAFprogram without policy change.
The limited evidence on incomes broadly bearsout the predictions of the simulation model. Be-tween 1987 and 1991, according to the national ac-counts, per capita smallholder real income was vir-tually constant. This is supported by a comparisonof household surveys for 1984/85 and 1990/91 (seeTable 10). Both surveys showed the southern regionto be the poorest by far. Real wages in manufactur-ing rose by 3 percent. The main deviation fromwhat one would expect on the basis of the modelsimulations is that the real wages of estate workersrose by 15 percent. However, this reflects the factthat the model does not take into account the socialtargeting through the increase in the minimum wageon the estates.
We now turn to the impact via social expenditure.Table 11 brings together the input measures of bud-getary expenditures on health and education withvarious output measures.
As discussed in the section on Zimbabwe, there aretwo possible concepts of real government spending.In one case, a value concept is derived by deflatingnominal figures by the aggregate GDP deflator. In theother case, a volume concept is derived by deflatingnominal figures by an index of costs, which in thecase of health and education will be dominated bywages. These two approaches may lead to very dif-ferent results, as indeed was the case in Zimbabwewhere wages declined sharply in terms of the GDPdeflator. For Malawi, using the first approach, thegovernment maintained total health and educationexpenditure constant, although this implied a fall inper capita terms (see Table 11). Although there are noofficial sector-specific deflators for the health and ed-ucation sectors, we can construct one by using dataon the earnings of government workers in commu-nity, social, and personal services that correspondclosely to health and education. The results indicate
76
Table 10. Malawi: Survey Evidence on Real Incomes of Smallholders During the First ESAF(Kwacha in 1990 prices)
Sources: For 1984/85 from Pryor, 1990,Table 16–3; for 1990/91 from Malawi, HESSEA,Tables 15 and 38; for 1992/93, from Malawi, NSSA, as reportedin Table 3.1 of World Bank, 1995b, converted to household income by assuming a rural household size of 4.4, as cited in Table 2.1. For 1984/85 and1990/91 the figure is mean income, for 1992/93 the figure is for median income, which will be somewhat below mean income. Deflators are from Malawi,Statistical Yearbook, 1995, rural CPI, and from IMF staff data.
Malawi
that wages fell substantially (by 20 percent) relativeto the aggregate GDP deflator. As a result, whereasthe value concept shows a deterioration, the volumeconcept implies an improvement. The volume con-cept implicitly assumes that quality is constant. Tothe extent that the decline in real wages led to a dete-rioration in staff performance, the volume measureoverestimates the real delivery of social services.Hence, both the value and volume measures are bi-ased, but in opposite directions. Since the formersuggests a deterioration by about 10 percent and thelatter suggests an improvement by about 10 percent,the most reasonable inference is that there was littlechange in real social service delivery per capita dur-ing the first ESAF.
Whereas per capita real inputs into health and ed-ucation appear to have stayed broadly constant, therewere significant improvements in the outcome mea-sures shown in Table 11. In health, prenatal atten-dance and immunizations both increased and infantand child mortality fell. In education, primary schoolenrollment increased very substantially. However,we should note that the absolute levels of the variousindicators are poor even by the standards of low-in-come countries. Hence, there is some evidence thatthe productivity of social services increased duringthe period and that this led to improved outcomes.
In summary, during the first ESAF period the in-comes of the poor were broadly constant, while so-
cial expenditure was protected and indeed social in-dicators showed some improvement.
The Phase of Program Collapse
Between the two ESAF programs, Malawi experi-enced a series of shocks as discussed above. Forsmallholders, the most important one was the 1992drought. This is reflected in the fall in smallholder in-comes shown in Table 10. The halving of incomeshown in that table overstates the decline because thefigure for 1992/93 is for the median rather than themean. However, there is no doubt that smallholder in-comes fell substantially: the maize crop fell by 60 per-cent in the drought year. Also in 1992/93 Malawi’sNational Sample Survey of Agriculture (NSSA) alarge number of smallholders reported that their in-come had fallen even in nominal terms from the pre-ceding year, at a time when inflation was about 20percent. Wage earners, both rural and urban, also lostheavily. Real earnings declined by about 30 percentbetween 1990 and 1994. Thus, during the period ofprogram collapse all major social groups lost heavily.
The Second ESAF
During the second ESAF, there has been both sub-stantial structural reform and substantial fiscal ad-justment. The structural reforms would be expectedto have substantial distributional effects.
77
Table 11. Malawi: Health and Education Indicators During the First ESAF(Index per capita, 1987 = 100, unless specified)
Sources: Prenatal attendances: Malawi, Statistical Yearbook, 1995,Table 3.13. Infant and child mortality: Malawi, So-cial Indicators Survey, 1995. Immunizations: Malawi, Statistical Yearbook, 1995, Table 3.16. Health and education ex-penditure calculated from internal Fund documents and deflated by government wages in community, social andpersonal services from Malawi, Statistical Yearbook, 1995, Table 6.4 for the volume series. The wage data are for1987–90, rather than for 1991; to the extent that wages declined between 1990 and 1991, this is an underesti-mate. Enrollments from Malawi, Statistical Yearbook, 1995, Table 4.7.
IV COUNTRY PROFILES
The Van Frausum and Sahn (1996) simulationscan again be used to estimate the distributional ef-fects of the agricultural price and exchange rate re-forms. Recall that an important distinction amongsmallholders in Malawi is that the poorer half are netbuyers of maize whereas the better-off are net sell-ers. We are able to approximate this effect by distin-guishing between smallholders below and aboveholdings of 1.5 hectare. According to the simula-tions, the incomes of the poorer smallholders rose by13 percent as a result of the pricing reforms and by 3 percent as a result of the devaluation. The incomesof the better-off smallholders are affected more sub-stantially by agricultural liberalization, with incomesincreasing by 33 percent, and also by devaluation,with incomes rising by 5 percent.
Compared with the economy as a whole, smallhold-ers thus gained much more from the agricultural liber-alization and much less from the exchange rate liberal-ization. The relatively weak effect of the exchangerate reflects the fact that smallholders are net pur-chasers of foreign exchange, buying imported fertil-izer, but that they produce a nontradable good, namelymaize. In this distribution respect, Malawi is ratherdistinctive. Usually, smallholders are regarded as dis-proportionate beneficiaries of exchange rate deprecia-tion because they are sellers of tradable crops whilepurchasing few imports. Malawi is distinctive partlybecause its very high transport costs make maize non-tradable over a wide price range, and partly because atthe start of the reforms the group of smallholdersgrowing tradable crops such as tobacco was so small.
Whereas smallholders are predicted to havegained quite substantially from the combination ofagricultural and exchange rate liberalization, themodel predicts that estate workers would face a seri-ous decline in their income of 25 percent. This re-flects increasing food prices in the face of nominalwage rigidities.
There are as yet no data at the household levelwith which to check these predictions. National ac-counts data suggest, however, that distributionalchanges have indeed been large. First we considersmallholders. To abstract from the effects of the1994 drought, we compare data for 1996 with thosefor 1993. This comparison suggests that per capitasmallholder real income went up by 14 percent(Table 9).60 This reflects the previously untapped po-tential for raising incomes by diversification. In1992/93, incomes of households whose main occu-pation was tobacco growing were 2.3 times as highas those of households whose main occupation wasmaize growing. Three-fourths of smallholder house-
holds had their main occupation as maize growing,whereas only 6 percent were growing tobacco.61 Be-tween 1993 and 1997 the number of smallholdersengaged in tobacco approximately doubled.
For the whole economy, per capita real income de-clined over the same period by 3 percent, so thatsmallholders appear to have gained relative to theeconomy as a whole. This is consistent with themodel predictions for a large agricultural reform anda modest exchange rate liberalization, such as hascharacterized the ESAF to date.
By contrast, formal sector wage earners lost, atleast in the short term. In the urban economy, realwages fell by 38 percent between 1994 and Decem-ber 1995. This was subsequently offset by wage in-creases following strikes in 1996. In this case, thelosers—urban wage earners—were initially consider-ably better off than the gainers, smallholders. In thissense, therefore, there was not a case for a safety nettargeted at this category of losers. In addition, an im-portant policy change has been the deregulation oftrading and petty manufacturing activities in urbanareas. This has created opportunities for income gen-eration in urban households and has therefore pro-vided a self-selecting safety net for the urban poor.
However, this does not apply to a second categoryof losers—estate workers. Comparison of living stan-dards between estate workers and smallholders is dif-ficult but a survey conducted in 1994 concluded thatthe welfare of women and children on the estates wasbroadly comparable to that among the poorer small-holders (Kamkondo, Dede, and Wellard, 1994). Aspredicted by the model, estate workers lost heavily.Between 1994 and December 1995, an estate workerreceiving a wage entirely in cash would have seen itsreal value halved.62 In practice, to varying degrees,estate workers received part of their income in kindin the form of maize. However, even allowing forthis, there was a severe decline in real incomes thatwould have warranted targeted safety net interven-tion. During the first ESAF, the government had in-deed achieved this through an increase in the mini-mum wage. Since inflation during this period wasmuch more rapid than during the equivalent phase inthe first stabilization program, there was a muchstronger case for intervention.
The second ESAF envisaged a rapid growth in so-cial expenditures driven by a reallocation of the bud-get. This has been reinforced by the rapid GDPgrowth between 1994 and 1997. Hence, the expecta-
78
60The national accounts on which we base these calculationsare in 1978 prices. A new series based on 1994 prices is underpreparation and may qualify these results.
61Malawi, NSSA, 1992/93, Volume 4, Tables A3.0 and A5.0.62This and the urban real wage change have been calculated
from Malawi’s Monthly Statistical Bulletin, May 1997, Tables4.1, 11.5, and 11.6, and Malawi’s Statistical Yearbook, 1995,Table 6.3. Agricultural and nonagricultural wages were deflatedby the rural and urban CPI, respectively.
Malawi
tion is that the real value of social service deliverywill have increased. This is likely to have been aug-mented by a fall in the unit cost of social service de-livery, as over most of the period real wages in thegovernment sector have been lower than in 1994.The most striking evidence of improvement in ser-vice delivery is that enrollment in primary educationincreased by over 60 percent in 1994/95, after schoolfees were abolished. The change was strongly pro-poor: enrollment rates had been considerably lowerfor the children of poor households and these differ-ences were reduced (Castro-Leal, 1996).
Against this major improvement in education,there is some evidence of a decline in the coverage ofimmunizations due to a cut in outreach activities as aresult of reductions in the health budget: between1992 and 1995, the proportion of children fully im-munized fell from 82 percent to 75 percent. Over thesame period, there was an increase in the incidenceof severe wasting from 5.4 percent to 7 percent.63
However, both of these deteriorations might havetaken place during the 1992–94 period of programcollapse. There is also evidence of a reduction in theavailability of drugs, possibly due to excessive ex-penditures on the capital program in the health bud-get. These problems are compounded by the growingprevalence of AIDS. It is estimated that deaths fromAIDS will more than quadruple between 1995 and2000, by which time AIDS cases will be absorbinghalf the health budget (Lodh, undated). As yet it isnot possible to verify other aspects of social impactagainst evidence from performance indicators.
In summary, while during the first ESAF the so-cial impact was modest, that during the secondESAF was substantial. The most important effectwas the increase in smallholder income. The groupsthat lost in this period included urban workers whowere not initially among the core poor, and the estateworkers who were. This latter group was not suffi-ciently protected in contrast to interventions duringthe first ESAF. Social services delivery provides amixed picture. There was a massive improvement inaccess to primary education, while some of thehealth indicators deteriorated.
Summary of Developments During ESAF
The first ESAF was characterized by temporarilysuccessful fiscal adjustment, but without substantialstructural adjustment. Any social impact of this pro-gram was modest. The incomes of the poor werebroadly unaltered as were social expenditures, whilesocial indicators improved somewhat. The secondESAF was also fiscally successful, indeed making a
much larger correction over a much shorter period.However, in contrast to the first ESAF, it was also aprocess of structural adjustment. Both the foreignexchange and agricultural markets were substan-tially liberalized. The structural adjustment pro-duced powerful distributional effects with small-holders gaining and urban wage earners losing. Thisredistribution was progressive.
However, during the period, estate workers, whowere already among the core poor, lost substantially.This can be attributed not to the ESAF but rather to theinflation that was inherited from the period of programcollapse. In the absence of ESAF, this group mightwell have lost more as inflation would have been evenhigher. It is to be noted that wage earners are likely tosuffer substantial short-term income losses duringbouts of unexpected rapid inflation. It is relativelystraightforward to protect formal sector wage earnersfrom these effects, as indeed the Malawian govern-ment did during the earlier ESAF. However, in Africamost formal sector urban wage earners are not amongthe core poor, so that intervention on the basis of asafety net argument cannot readily be justified. Theestate workers in Malawi constitute a group for whichintervention is justifiable on a safety net argument,and for whom targeting is straightforward.
While the second ESAF can be considered suc-cessful, the economy is still far from reaching itsgrowth potential. The transformation of smallholderagriculture has only just begun and is still sufferingfrom weak marketing and transport infrastructure.Investment in the formal sector has yet to becomesubstantial. The large number of Malawian entrepre-neurs living abroad constitutes a resource of consid-erable potential for the economy (as in Uganda), butthere has not as yet been much return migration.
Ownership Issues: The Political Context
After 30 years of repressive and autocratic ruleunder President Banda, Malawi succumbed to pres-sure from the international donor community anddomestic democratic forces and finally, in 1992,began a process of political liberalization that culmi-nated in elections that brought to power a new gov-ernment in 1994. The first ESAF arrangement andits precursor programs were thus managed under ahighly centralized decision-making system withvery little consultation outside the Ministry of Fi-nance and the Reserve Bank of Malawi, although aloose coordinating body, including senior ministers,heads of the security agencies, and representatives ofthe ruling party, provided some sort of general over-sight through periodical meetings.64
79
63Malawi, Social Indicators Survey, 1995, Fig. 6.2. 64Interviews, August 1997.
IV COUNTRY PROFILES
The ESAF arrangement spanning the period1988–94 had mixed results; the fiscal adjustment itentailed was reasonably successful while the struc-tural benchmarks suffered significant delays in im-plementation.65 But the restrictive political systemunder which these reforms had been carried out hadalready begun to crumble in the closing years of theBanda regime, as political liberalization began withthe repeal or modification of repressive laws in Au-gust 1992, and the rise of opposition parties follow-ing the referendum in June 1993, which ended one-party rule. Already in September 1993, there werestrikes by the civil service demanding increases insalaries and wage compensation and calling on thegovernment to resign.
The new government took over in a situation ofprofound fiscal crisis caused by large and un-planned civil service wage increases, and expendi-ture overruns mainly associated with the elections.These problems had been further compounded byrising food prices, followed by a major drought dur-ing the 1994 crop season, and consequent accelera-tion in inflation.
Ownership of Policy Reforms
Against the background of this crisis, caused bytwo major droughts (1991–92 and 1994), the suspen-sion of donor aid, and the fiscal deterioration notedabove, the new government sought Fund assistanceand an eight-month stand-by arrangement wasgranted in November 1994 to help stabilize theeconomy and create conditions for the adoption ofan ESAF arrangement.
This stand-by arrangement was prepared in ratherdifficult circumstances. The government was notonly new; it had also inherited an enormous crisisand was confronted with a restive civil servicewhose loyalty could not be taken for granted. In theevent, the Fund’s intervention coincided with largeBank and donor missions, all of them thoroughlywell intentioned but perhaps not mindful enough ofthe capacity constraints that the new governmentfaced. Indeed, the government recognized these con-straints when, in January 1995, it worked out a na-tional capacity-building program for financial man-agement, jointly with representatives from the Fund,the United Nations Development Program, theBank, the European Union, and bilateral donors, out-lining its technical assistance needs and possible
funding sources. In the very nature of the situation,even this capacity-building program was not exactlythe government’s product, as it required government“endorsement” in August 1994.
Apart from these capacity constraints, the newgovernment also had to contend with other politicalproblems. The labor situation was tense, as was thepolitical temperature, following the arrest of the for-mer president on murder charges.
The Fund staff clearly appreciated these con-straints in a remarkable assessment of the overall sit-uation in a country strategy brief but saw them, notso much in terms of their effect on national owner-ship and the implications therefrom for the longerterm sustainability of the program, as short-term“risks” that could be “minimized to the extent thereis sufficient coordination in the reform process toensure that potential bottlenecks are arrested in atimely manner.” Key policymakers, it continued,“would also need to be focused and made aware ofthe broad objectives of the program. In this regard, itwould be useful to engage a broader section of thegovernment in the preparation of the PFP.”
The government was required to take a number ofprior actions66 before the stand-by arrangement fol-lowed in November 1994.
Not surprisingly, the government ran into consid-erable difficulty in implementing the agreed re-forms. To begin with, the drought in 1994 turned outto be even more devastating than was originally en-visaged, and GDP declined by 12.4 percent insteadof a programmed 9.3 percent decline. Widespreadfood shortages caused by the drought, a sharp depre-ciation of the currency, and the effects of the in-creases in the prices of petroleum products, amongother things, led to an acceleration of inflation,which shot up to 66 percent by the end of 1994against a target rate of 37 percent.
A sense of hopelessness and a feeling of impositionquickly took hold in the top levels of government asthey struggled with the political fallout from thesehardships. Indeed, this feeling of imposition still per-vades the upper echelons of government and the rulingparty, and is also very evident in the outlook of keyministers, including the Minister of Finance, with sig-nificant implications for the sustainability of the ESAFprogram in Malawi.67 In the business community, no
80
65The agricultural sector reforms included the lifting of restric-tions on smallholder production and private sector participationin marketing and distribution of agricultural products, and in theparastatal sector, included a restructuring of a number of statemonopolies, mainly the Agricultural Development and MarketingCorporation and the Press Corporation.
66The prior actions included substantial increases in petroleumproduct prices (131 percent for kerosene, 85.3 percent for diesel,and 27.5 percent for petrol) and other revenue measures, a revisedcash budgeting system, and an increase in the rediscount rate,among other things.
67A number of donors interviewed in Lilongwe also expressedconcern that the program had been imposed upon an inexperi-enced and ill-prepared government, without due regard for thecritical economic and political conditions it faced. (Interviews,Malawi, August 25, 1997.)
Malawi
less, the feeling is even more intense. Our meetingwith the business community in Blantyre was perhapsthe most hostile of all the meetings we had during ourcountry visits. Malawi was also where we found theFund’s image to be the most negative, generally.68
Scope of Support for the Program
Initially, commitment to the program at the top lev-els of government, including especially the Ministryof Finance, was most determined.69 The situation wascritical, resources were required, and therefore thegovernment made the policy compromises required toobtain access to external funds. But the base of politi-cal commitment in government generally was, fromthe very beginning, rather narrow. The program waslargely borne on the shoulders of the Minister of Fi-nance at the time—a highly capable and dedicated pa-triot who acted from a genuine conviction that thepath chosen was the right one, even if less traveled by.But the result was the increasing isolation of the Min-ister of Finance as other ministers, and organizedgroups, including the business community, remainedlargely unconvinced. For the business community, thealienation was deepened by the imposition of an ex-port tax that had evidently been implemented as aonce-and-for-all revenue measure, but which they andother donors regarded, quite correctly, as thoroughlyirrational (Interviews, August 1997).
The bureaucracy, for its part, remained half-hearted at best and mostly cynical about the reformsand about the role of the rising numbers of well-paidexternal technical advisors. In these circumstances,the Minister of Finance, as head of the economicmanagement team, had little choice but to put to-gether and work with a small core team, leaving therest of the ministry and the officials of the Ministryof Planning marginalized and resentful. As the pol-icy agenda got larger with time, and with little relieffrom uncoordinated technical assistance from differ-ent agencies, which the Minister of Finance grate-
fully acknowledged but sought in vain to better tar-get, the core team quickly became overstretched.
For the majority of the rural poor, including small-holders from around the capital, Lilongwe, frustra-tion over the removal of fertilizer subsidies was veryintense. They bitterly complained that these subsidieshad been removed without much explanation, andwhat was more, without any steps being taken to givethem access to any form of credit, given that the ex-isting rural credit scheme had all but collapsed underthe weight of a high incidence of nonrecovery.70
Among donors, there was a feeling that policieswere not being thought through enough, except wherethe Fund had a direct interest, such as, for instance,the value-added tax, although even here they thoughtthe timing was wrong. There was a sense that toomany initiatives were being undertaken by differentdonors, that nobody seemed to be in charge. TheBank, it was felt, had become overpowering andmuch too obtrusive in its work in Malawi, often to thegreat irritation of political leaders; there was some ex-pectation that in such circumstances, the Bank wouldhave been “called to order” by the Fund. The generalimpression was that the absence of a Fund residentrepresentative was not helping matters in this regard.
Authorship of the Policy Agenda
In the final analysis, authorship of the policyagenda and policy documentation is a function oftechnical capacity that, as we have noted inMalawi’s case, was severely constrained. The rulingparty has had a proreform posture from the very be-ginning. Indeed, the party had declared itself infavor of liberalization and privatization in its elec-tion manifesto. However, political opposition andweaknesses in the administrative and technical ca-pacity of the civil service had imposed real con-straints on the government’s space for maneuver.Moreover, donors also often push agendas of theirown. Given the government’s limited technical ca-pacity and the pressures on such capacity as there is,the PFP process and the entire policy agenda settinghas tended to be dominated unduly by the Fund.71
Ownership Promotion
While there are no references to any particular ini-tiatives for the Fund to deepen the ownership of the
81
68Some in the business community blamed the Fund, even forthe sins of others. For example, one of the most bitter complaintswas the passing of a new industrial relations act which, in theirview, contained unreasonably permissive provisions on strikesand which they blamed the Fund for. When we pointed out thatthis legislation had nothing to do with the Fund and had in fact,been proposed by the International Labour Organisation (ILO),we were met with a retort that the ILO must have been directed todo so by the Fund! The Fund, it would seem, is often perceived ashaving a preeminent position among international organizationsbut this obviously comes with great costs!
69The stabilization measures were greeted with widespreadstrikes all over the country which the government resisted firmly.It faced off a strike by civil servants in August 1995, arguing thatno accommodation could be provided before the following fiscalyear and, also, that any further salary increases could only begranted in the context of a general rationalization and reduction inthe size of the civil service.
70When asked what they would do if some benefactor handedthem $1,000, peasant farmers (mostly women) interviewedaround Lilongwe each replied without any hesitation and in a re-markable attestation to their determination to break out of thestranglehold of poverty, that they would buy fertilizer, and morefertilizer. (Interviews, August 1997.)
71Interview with the Minister of Finance, Lilongwe, August1997.
IV COUNTRY PROFILES
program, there are references to internal Fund docu-ments that suggest, and again this was confirmed byinterviewees in the field, that Fund missions have inthe past held meetings with the Economic Commit-tee of the Cabinet “to convey the message that reme-dial actions are immediately required.”
As for the range of Fund contacts, staff reportssuggest—again, this is corroborated in the field—that missions have interacted mostly with the usualcore team, mainly the Ministry of Finance, Min-istry of Planning, and reserve bank officials. Theyalso have had regular meetings with the donorcommunity, and occasional ones with private sectorrepresentatives.
Cooperation with the Bank
Staff documents contain the usual references tofull and close cooperation with the Bank, with theparticipation of Bank staff in meetings of Fund mis-sions, especially joint discussion of the PFP. Whilethere is no reason to doubt that the cooperation is asdescribed in these documents, it is worth noting thatthe perception of some donors in the country wasthat the Bank takes initiatives without due consulta-tion with the donor community or with the Fund inareas of common interest.72
Uganda
In the period 1971–86, the economy declinedrapidly owing to a conjunction of poor economicpolicies and severe social disturbance. In the early1980s there were two stand-by arrangements, butboth collapsed under the pressure of events. The Na-tional Resistance Movement government tookpower in 1986, inheriting a devastated economywith a number of distinctive features. Per capita in-come was among the lowest in the world; the publicrevenue base had collapsed, with coffee taxation ac-counting to close to half of revenue, and high infla-tion had eroded the demand for money. Since therewas little scope for external borrowing, governmentexpenditure had fallen. A by-product of this was thatwhile public sector employment had expanded enor-
mously, public sector wages had become derisory.As a result, while the public sector was large it wasnot well-suited to service delivery. The private econ-omy had retreated into subsistence activities, and ex-ports and investment had declined. By 1986, govern-ment expenditure, exports, and investment wereeach only 9 percent of GDP.
The new government was initially suspicious ofFund and Bank involvement in economic policy. Itdismantled aspects of the previous stand-by arrange-ment, notably refixing the exchange rate. By 1987,inflation had accelerated to over 200 percent andsuch early failures of the policy changes led the gov-ernment to seek an agreement with the Fund. Astructural adjustment facility program was initiatedfor the period 1987–90.
The SAF Program, 1987–89
A major objective of this program was to restoreexports. For this, it was seen as necessary to shiftfrom dependence upon export taxation. The producerprice for coffee, the main export crop, was tripled, andthere were efforts to make payments to farmers ontime and to improve transport. Price controls in manu-facturing were removed. There was a start to foreignexchange liberalization, with a 60 percent devaluationin 1988 followed by frequent smaller devaluations.There were plans for the privatization of public enter-prises and for the removal of ghost workers from thegovernment payroll. The targets were for GDP growthof 5 percent and inflation of 10 percent.
The period of the Structural Adjustment Facility(SAF) program coincided with a deterioration in theworld coffee price. Between 1986/87 and 1989/90,the terms of trade deteriorated by 24 percent. De-spite this, there was a strong recovery in output, withthe growth rate of per capita GDP exceeding 3 per-cent per annum. In view of this satisfactory perfor-mance, the SAF program was revised before itsplanned completion into an ESAF program.
The First ESAF Program: From 1989 to the Crisis of 1992
The ESAF program had three objectives: contin-ued growth of at least 5 percent, a reduction in in-flation to 7.5 percent, and a balance of paymentssurplus of $11 million. The new program includedexchange rate liberalization, the removal of importlicensing, rehabilitation of infrastructure, improvedfiscal controls, and public enterprise reform. Fromthe viewpoint of the government, the core of the program was exchange rate liberalization: in1990, it introduced foreign exchange bureaus whilemaintaining an official exchange rate for sometransactions.
82
72The donors made particular reference to an instance when justweeks after the May 1997 consultative group meeting on Malawi,the Bank sent a letter to the Minister of Finance, which it appar-ently also sent to the president, protesting an increase in the num-ber of ministries contrary to commitments made by the govern-ment. This letter evidently caused great disquiet among thecabinet, and also among donors, who felt that the Bank’s intransi-gence over the matter (the Bank had sent two missions to protestthe issue even after the government had explained the situation)created unnecessary awkwardness in relations between the govern-ment and the donor community, including the Bank and the Fund.
Uganda
The social impact of the program was explicitlyconsidered. It was recognized that some vulnerablegroups would not benefit in the short run. This con-cern led to the setting up of a program to alleviatepoverty and the social costs of adjustment (PAPSCA).The main components of the program were assistancefor retrenched government workers and projects inprimary education, in primary health care, and in ruralinfrastructure rehabilitation.
There was a further sharp deterioration in theterms of trade of 22 percent between 1989/90 and1992/93. This created a dilemma: the collapse in theworld coffee price was liable to accelerate the shiftby farmers out of coffee, yet to prevent it would re-quire the government to reduce export taxation,which was central to its revenue.
In 1991/92 there was a fiscal crisis. In part, this wasdue to an interruption in donor inflows because of theintroduction of the dual exchange rate. However, themajor reason was an extreme loss of control of expen-diture: the share of government expenditure in GDProse from 16 percent in 1990/91 to 23 percent in thefollowing year. This loss of fiscal control produced arapid acceleration in inflation. By March 1992 the an-nualized rate had reached 230 percent and per capitaGDP growth had decelerated to 2 percent. In re-sponse, the president merged the ministries of financeand planning, dismissing the finance team and givingcontrol to the planning team, which had been the mainbase of analysis and advocacy for economic reform.
ESAF Programs from the Crisis of 1992 to 1997
The new team thus faced a short-term stabilizationproblem and a longer-term need for policy reform.The fiscal crisis had cost the government the limitedcredibility with investors that it had achieved. Therisk rating of the country by the Institutional Investorfell to the lowest of the 25 African countries rated. Tostabilize the economy, the government introduced acash budget. This brought about a reduction in ex-penditure of 3 percentage points of GDP. The cashbudget had a dramatic effect on inflation. Within fourmonths of its introduction, prices were stable. Thecost of this disinflation in terms of lost output wasmodest. Between 1992 and 1993 the growth in percapita GDP actually accelerated to 3 percent.
In 1994, a further ESAF program was agreed(1994–97). By this time the economy was alreadystabilized. We should note that this makes the Ugan-dan ESAF program of 1994–97 unique in our sam-ple, since its focus could have been entirely on struc-tural reforms. In the event, the program alsoincluded important fiscal objectives. Reserves wereto be accumulated to five months of imports, and thefiscal deficit (which was largely aid-funded) was en-
visaged to fall from 10.6 to 5.5 percent of GDP. Thiswould involve substantial repayment to the bankingsystem. Indeed, the objective of the fiscal adjust-ment was not to reduce inflation but to improve ac-cess of the private sector to credit.
The fiscal adjustment was to be achieved primar-ily by increasing revenue as a share of GDP by 1percentage point per annum. This was achieved by acombination of institutional and tax rate changes. Anindependent revenue authority was established out-side the structure of the civil service. Taxes on petro-leum were increased sharply so that Uganda came tohave fuel prices more than double those of its neigh-bors. Import duties were raised, so that even by 1996more than half of revenue was from trade taxes. Theremaining fiscal adjustment was to be achievedthrough reduced expenditures. To protect social ex-penditures during this phase of fiscal tightening, a“core budget” was created in which social programswere given priority. This was partly a response to thedifficulties created by the cash budget, which in-creased the volatility of expenditure and thereby re-duced its efficiency.
The government embarked upon a wide range ofradical reform measures. With respect to exportcrops, it first abolished the export tax on coffee, thenremoved the monopoly of the Coffee MarketingBoard, and finally removed the rail monopoly oncoffee transporting. The introduction of private roadhaulage for coffee had the beneficial side effect ofexpanding the market for road haulage sufficientlythat the market structure of the industry becamemuch more competitive: with the demise of thehaulage cartel, freight rates nearly halved.
With respect to foreign exchange, the governmentfirst unified the exchange rate at the Bureau deChange rate, then introduced an interbank market(November 1993), thereby achieving Article VIIIstatus, and finally moved to full capital account con-vertibility (July 1997).
On public employment, both the civil service andthe army were drastically reduced, the civil service byone-third and the army by one-half. Prior to the armydemobilization, there had been considerable concernthat it would lead to an increase in unrest, with demo-bilized soldiers resorting to crime. The governmentimplemented a program of financial and material as-sistance for the demobilized. In the event, crime ratesactually fell and there is evidence that the demobi-lized reintegrated into their rural communities.73
With respect to financial markets, the governmentgradually developed the treasury bill market. Ini-tially, interest rates on the market were very high.There was substantial new entry into the banking
83
73See Collier, 1994.
IV COUNTRY PROFILES
sector, breaking a long-established cartel. However,the capitalization requirements were initially set fartoo low. This reflected the failure to revise the rele-vant legislation in response to the high inflation ofthe previous two decades. As a result, some of thenew banks had to be placed under supervision, andtheir existence was a serious constraint upon the op-eration of monetary policy: the interventions thatwould have absorbed liquidity in aggregate wouldhave made the weaker banks unviable. A distinct andmajor problem was posed by the Uganda Commer-cial Bank, which had a large, weak, and politicizedportfolio. The process of privatization of the UgandaCommercial Bank was slow, and the one importantrespect in which the implementation of reform fellbehind schedule. However, its completion was inprospect at the time of this writing and there havebeen over 60 other privatizations. Both the Fund andthe World Bank were heavily involved in financialsector reform.
In contrast to the first two program periods, theterms of trade sharply improved owing to a temporaryincrease in the price of coffee. Between 1992/93 and1994/95, there was an improvement of 76 percent.The Fund and the government were concerned thatsuch a large favorable shock would cause powerfulreal exchange rate appreciation or inflation, and sothey introduced a stabilizing export tax. In the event,this raised little revenue. However, neither of the con-cerns proved well founded: the private sector sharplyincreased its savings and investment rates. The liber-alization of the coffee sector and the stabilization ofthe economy had been achieved just in time for thewindfall to be well used by private agents. The gov-ernment reduced the export tax in 1995 and abolishedit in 1996. Unlike many governments in similar cir-cumstances, the government was able to contain itsexpenditures through the temporary windfall.
The record during the liberalization phase wasimpressive. Over the whole period 1992–97, thegrowth rate of per capita GDP averaged 4.2 percentand inflation 8 percent. Foreign exchange reservesincreased to five months’ worth of imports despiterapid import growth. The investment risk rating im-proved from 5.4 in 1992 to 20.1 by September 1997,a level equal to that of Côte d’Ivoire.
Aggregate Performance: An Assessment
Over the decade 1986–96 the Ugandan govern-ment transformed the economy, with per capita GDPincreasing by 40 percent. To an extent this remark-able performance was made easier by the disastrousdecline that preceded it. However, the governmentachieved both stabilization and substantial decon-trol. By the end of the period, private investors wereregarding Uganda as a credible location.
The Ugandan stabilization and adjustment pro-grams were relatively unproblematic because therewere no features of a transition economy: there wasno large, heavily protected import substitute sectorthat would become unviable through liberalization,and the public sector was small.
After the preceding years of economic disorder, ahighly flexible informal economy had developed.Prices therefore responded rapidly to policy changesand there was a large natural safety net for those dis-placed by reform. The major category of those wholost from reform—those civil servants who lost theirjobs—had already largely learned to live from theinformal sector because their official salaries werebelow a living wage. Thus, the social costs of adjust-ment were unusually low.
However, for most of the period, policy changeconferred only limited benefits on many of the poorbecause of their initial dependence upon subsistence.The liberalization of cash crops had limited benefi-ciaries because only a minority of rural householdsgrew coffee, and its importance in the rural economyhad greatly diminished as a result of the retreat intosubsistence. Fiscal policy did not always assist the re-versal of this process. First, although coffee taxationwas abolished, trade taxes were little reduced.Rather, there was a shift from the taxation of exportsto that of imports. Analytically, these are broadlyequivalent in their incidence, both being borne by theexport sector (i.e., coffee farmers), although the taxa-tion of coffee has a more transparent incidence thanthe taxation of imports. Hence, the shift to importtaxation appeared to confer benefits on the exportsector, while largely failing to do so.74 Second, themassive increase in the taxation of petroleum will toan extent have offset the decline in transport costs inrural areas that resulted from other aspects of the pro-grams, notably better roads and greater competition.
A further reason why reform may not have con-ferred substantial benefits on the poor is that the poorare concentrated in agriculture, Uganda being one ofthe most rural societies in the world. Other than im-proving transport and raising coffee prices, the gov-ernment interventions in agriculture were limited. Forexample, only 11 percent of rural households reportedever having been visited by an extension worker(CIET International, 1996, p. 31), and there are casesof old cottonseed being distributed to farmers. Thisreflected the collapse of the extension service in thepre–National Resistance Movement period.
Distributional Effects
Over the decade 1986–96 per capita GDP grew by40 percent. Growth was sustained throughout the
84
74In trade theory this is known as the Lerner equivalence theorem.
Uganda
decade (Table 12), with the most rapid growth beingin the last five years. With such strong aggregategrowth it would be expected that there would beroom both for rising household incomes of mostmajor social groups and for rising social expendi-tures. We consider incomes and social expendituresin turn. A notable feature was the shift from privateto public expenditure. The share of public expendi-ture in GDP more than doubled over the decade, fi-nanced partly by extra revenue and partly by aid.
Incomes
The private component of GDP grew in per capitaterms by 31 percent over the decade. As a result ofrising aid and private capital inflows, private expen-ditures were able to grow much more rapidly thanthis, namely by 48 percent. Here, however, we focuson income.
There have been three household surveys withinthe period, conducted in 1988/89, 1992/93, and1994/95. Between them, the surveys thus span muchof the reform period. However, unfortunately, theypresent severe problems of comparability. We adopttwo approaches. First, between 1992 and 1995, thesurveys are comparable. In Table 12 we show the re-sulting headcount measures of moderate and severepoverty. In both rural and urban areas over this pe-riod, there was a substantial fall in both measures ofpoverty. Second, taking the longer period, we canavoid the problems of comparability to some extentby using, from each survey, not the income levelsbut only the ratio between urban and rural incomes.Taking total private income from the national ac-counts rather than from the surveys, we arrive at theincome series shown in Table 12. These results sug-gest that urban per capita incomes increased rapidly,
by almost 60 percent over a six-year period. Ruralincomes, by contrast, on this measure virtually stag-nated, rising by only 4 percent. For the subperiod1992–95, the two measures show rather different re-sults. If the headcount series are right, it seems likelythat rural incomes rose more rapidly than implied bythe indirect inference from national accounts. Thereis some reason to consider the headcount measure asmore reliable.
Although (as everywhere in Africa) urban in-comes were higher than rural incomes, at the start ofthe period there was less difference in Uganda thanin most other societies. The modern economy, bothpublic and private, had been so eroded that the struc-ture of incomes of urban households was similar tothat of rural households: few urban households de-pended upon wage income, and most of them had in-comes from farming (Bigsten and Kayizzi-Mugerwa, forthcoming).The headcount index ofpoverty for rural households showed 46 percent inpoverty in rural areas and 13 percent in urban areas.Thus, a substantial number of urban householdswere poor. However, the divergence of urban andrural incomes over the reform period must have sub-stantially reduced urban poverty (proportionately),substantially more than rural poverty.
There is also some evidence that by the mid-1990swithin rural areas incomes were markedly higher inthose areas closest to the urban economy. The ruralarea closest to the urban economy was the central re-gion. As a percentage of rural incomes in this region,the rural incomes in the northern, eastern, and west-ern regions were estimated at 51 percent, 54 percent,and 62 percent, respectively.75
85
Table 12. Uganda: Rural and Urban Per Capita Private Incomes
Notes: Urban/rural ratios for 1988/89 are from Uganda, 1989, for 1988/89 and for 1992 and 1994 from Uganda,1997, Table 27. For 1994/95 we take the average of the first and second monitoring surveys. We estimate thegrowth in private per capita income for the survey years from per capita GDP (Table 13), adjusted for the share ofGDP accruing to the public sector as revenue in each fiscal year.The headcounts of poverty are from Tables A2 andA4 of Poverty Trends in Uganda,1989–95, Discussion Paper No. 1, May 1997, Department of Statistics. Note thatthis source also gives data for 1989–92, but these are not comparable and so we do not report them.
75UNDP (1997), Appendix 2, Table D.
IV COUNTRY PROFILES
Social Service Provision
Recall that per capita GDP grew by 40 percentover the decade. We have also noted that total gov-ernment expenditure rose substantially as a percent-age of GDP, financed partly by higher revenues andpartly by increased aid. Over the decade the share ofthe government in national expenditure more thandoubled, albeit from a very low base. The division ofpublic expenditure between the recurrent and devel-opment budgets was fairly volatile, but over thedecade as a whole there was a small shift toward thedevelopment budget. Despite this shift, per capita re-current expenditure rose in real terms by 166 percent(Table 13). This evidently provided considerablescope for increased social expenditures. We nowconsider health and education expenditures in turn.
As a result of decentralization, total governmentexpenditure on health and education cannot presently
be determined post-1994/95 since there is uncertaintyabout the expenditure patterns of the districts.
Prior to the decentralization, the share of the re-current budget allocation to the health sector rosebetween the beginning and the end of the decade,although there was no steady trend (the first lineshown under “Health” in Table 13). Hence, thehealth sector benefited both from the strong growthin the total recurrent budget and from an increasingshare. However, offsetting this, the price of healthcare services rose substantially more rapidly thanaverage prices across the economy.76 Hence, agiven amount of health spending bought a smallerquantity of health services. This was partly becauseof the rising wages of workers in the health sector
Sources: Immunizations, nutrition and rural safe water, Government of Uganda and Uganda National Council for Children, 1996, Figures 3, 6 and 15.Infant mortality, UNDP, 1997. National accounts: health and education at constant 1991 prices, Background to the Budget, 1996 and 1997,Table 2. Primaryenrollment, calculated from Uganda, Statistical Abstract, 1996, Tables B2 and L1, assuming 3 percent growth of the school-age population. Pupils per text-book from Government of Uganda and Uganda National Council for Children, 1996, p. 23.
Notes:We derive output of health and education by deflating government recurrent expenditures in these sectors by the sector-specific GDP deflator.The value-added for health and education is calculated by deflating current price value-added in these sectors by the same deflator.
76That is, the GDP deflator for the health sector rose relative tothe GDP deflator for the economy.
Uganda
and partly because of the depreciation of the ex-change rate, which raised the cost of many materialinputs. This effect was large: costs of health ser-vices rose by 65 percent relative to average prices(the second line under “Health” in Table 13).
Despite this increase in relative costs, the provi-sion of health care per capita increased substantiallyin real terms, more than doubling on our estimate(shown in the third line under “Health” in Table 13).There is also some evidence that the increased provi-sion was disproportionate in terms of nonwage mate-rial inputs. The number of health workers per capitarose by only about 10 percent. This is shown asvalue-added per capita in the fourth line of Table 13.This suggests that health workers were becomingmore effective, since they were better supplied withinputs such as drugs and vaccines.
Turning to direct measures of performance in the health sector, we can see such a change. For ex-ample, the proportion of children receiving full immunization rose by nearly 60 percent over thedecade (from a coverage of 31 percent to one of 49 percent).
However, direct measures of health states of thepopulation show a less satisfactory picture. The pro-portion of children who are malnourished on variousmeasures shows no systematic improvement. This isconsistent with the evidence on rural incomes,which, as we have seen, suggests little change.
We now turn to education. Unlike in the healthsector, prior to decentralization there was no system-atic increase in the share of education in the recur-rent budget. Indeed, other than for a large increasebetween 1986 and 1987 (which precedes the SAFprogram) there was a substantial decline in its share.This will have been at least partially reversed by themove toward universal primary education in 1997,but data are not yet available.
As in the health sector, the price of providing edu-cation service rose substantially relative to otherprices (this is shown in the second line of “Education”in Table 13, with an increase of 68 percent). Com-bined with the declining share of the recurrent budget,this was sufficient to reduce the provision of educa-tional services per capita. As shown in line three ofTable 13, this tended to decline from 1987 onward.This is borne out by the decline in the enrollment ratefor primary education, which also deteriorated priorto the move to universal primary education.
As in the health sector, there is some evidence ofan increase in the inputs available per teacher: out-put per capita tends to increase more than value-added per capita. This is supported by some directevidence on the number of books per pupil, whichtripled over the period, although there has presum-ably been a recent deterioration as a result of univer-sal primary education.
In summary, the provision of health services hasimproved while that of education services was er-ratic prior to universal primary education. However,the level of service provision remains extremelypoor. A major reason why service provision did notimprove more despite increased recurrent expendi-ture was that the costs of provision rose relative toother prices. This was broadly reflected in health andeducation outcomes: health outcomes such as vacci-nations improved, while educational outcomes suchas primary enrollments until recently deteriorated.
A further reason why health and educational out-comes might be poor despite increases in expendi-tures is that only a fraction of budgetary releasesfrom the central government actually reach the ruralpopulation. A study that tracked the vote for non-salary primary education from its release by theMinistry of Finance through to the primary schoolsfound that only 36 percent of the vote was receivedby the schools.77 Moneys were retained by higherlevels in the educational administration. Finally, pro-fessional standards had collapsed in public servicedelivery: teachers were not inspected, and medicalworkers diverted supplies to their private practices.
Thus, despite the very large increases in overallreal recurrent expenditures, social provision im-proved relatively little. This was made more seriousby the heavily skewed distribution of the direct ben-efits in terms of the growth of private incomes. Therapid aggregate growth was largely confined to theurban economy. Urban households experiencedlarge gains in income, whereas rural incomes virtu-ally stagnated.
Summary of Developments Under ESAF
Uganda has evidently been successful both interms of stabilization and growth. Over the decadethe economy was transformed from a stagnant, sub-sistence orientation to an economy that enjoyed fastgrowth. Although there were continuous Fund pro-grams through the decade, most of the key decisionswere taken by the government on its own initiative.This was the case both for highly successful policies,such as the liberalization of the exchange rate, andfor potentially disastrous policies, notably the loss ofcontrol of public expenditure in 1991. However, thegrowth was urban led.
It is not evident how policy could significantlyhave improved on this outcome. The rural develop-ment strategy was based upon the reintegration of therural economy into the market, through better roadsand deregulated markets. In the medium term thisstrategy can be expected to raise rural incomes sub-
87
77Economic Policy Research Centre and Management Systemsand Economic Consultants Ltd., 1996.
IV COUNTRY PROFILES
stantially. However, in the short term the main way toreach the subsistence economy would have beenthrough the delivery of services. However, the legacyof a large and virtually nonperforming civil serviceprecluded effective public service delivery. The gov-ernment increased real recurrent expenditure mas-sively, but much of this did not reach the poor. Recallthat only 36 percent of the nonwage vote for primaryschools actually reaches the schools. The governmenttackled the problem of civil service nonperformancein two ways. First, across the board it shed staff andraised wages. However, because of the very large ini-tial size of the civil service this strategy inevitablytakes a long time. Second, in the one area that both itand the Fund regarded as critical—revenue genera-tion—the government bypassed its civil service andset up an independent revenue authority that was rea-sonably successful. It is possible that this modelcould have been applied in the field of rural servicedelivery.
If growth is sustained at recent rates, it is verylikely that poverty will gradually be reduced. How-ever, to sustain high growth the economy will need toincrease the investment rate. To date, there have beenmany opportunities for growth without investment asthe policy environment has been improved: the econ-omy was very far inside its production possibilityfrontier. To raise investment from the present level of16 percent to the 25–30 percent range needed for sus-tained rapid growth, the economy will need to in-crease its capital inflow, both private and public. Todate, the Fund has correctly urged both domestic andexternal deficit reduction. However, with the stabi-lization task completed, this can become counterpro-ductive. The public investment program needs to beexpanded relative to GDP, yet the scope for furtherincreases in revenue to GDP is very limited in theshort term. Indeed, at the margin, the major taxes—those on trade and petroleum—are probably a seriousimpediment to growth. The present strategy of rais-ing tax revenue to run a surplus with the banking sys-tem may both underestimate the marginal cost of tax-ation and overestimate the capacity of the newbanking system for financial intermediation.
The revenue constraint can be overcome by an ex-pansion in the aid program. Several of the largedonors appear willing to provide this expansion, yetthe Fund has been planning on the basis of a rapidand substantial reduction in aid dependence. Simi-larly, with full convertibility and the most rapidlyimproving investment rating in Africa, Uganda islikely to attract substantially increased flows of pri-vate capital. An increased inflow, whether of aid orof foreign investment, will appreciate the real ex-change rate. This will directly reduce the incentivefor exports and so give rise to a potential trade-offbetween exports and investment. Fears of this trade-
off at present heavily influence Ugandan policymak-ers. However, it has not been explicitly addressed bythe Fund, either qualitatively or quantitatively.Ugandan policymakers note that the exchange rate isseldom even discussed by Fund missions.
This is an example of a more general issue. TheESAF program of 1994–97 was the only one in oursample not to need a stabilization component. Ittherefore rightly focused upon a development agendaof structural reforms. However, as a result, the scopeof policy dialogue between the Fund and the govern-ment focused on a range of issues not traditionallywithin the Fund’s area of expertise. The Ugandangovernment values the continued presence of theFund, which is potentially of importance not only foradvice and resources but also for credibility. How-ever, the role of the Fund in low-income countriesoutside the context of stabilization requires examina-tion. We return to this in the thematic discussion.
The social impact of the program has had bothgood and bad aspects. The good aspect is that therehave been few outright losers from the reforms. Themain exception would be retrenched civil servants,but even here the losses were small because civilservice pay was so low that households were not re-liant upon it. The bad aspect is that parts of the ruralpopulation have yet to gain substantially from theprogram. Rural poverty has fallen, but proportion-ately less than urban poverty. The quantitative evi-dence for this from surveys is consistent with thequalitative assessments of local and foreign NGOs.Social service provision gradually improved with re-spect to health, but the improvement in education isonly very recent.
The government has recently given much greaterattention to poverty reduction through a new PovertyAction Plan. A dilemma faced by the government inattempting to target its expenditures more effectivelyon the poor is that this has to be reconciled with thenew decentralization to the district level. While it ispossible that decentralization will directly improvetargeting through greater local political participa-tion, early indications are not entirely encouraging.Two initiatives that are being considered to increasethe pressure on district level authorities to deliversocial services are the promulgation of minimumstandards, so that the population might know what todemand from its local government, and the use ofconditional grants by the central government.
Ownership Issues: An Overall Assessment
Uganda presents a rather interesting ownershipcase, which much resembles Zimbabwe’s in somerespects and Ghana’s in almost every respect. Forthis reason, it is useful to detail somewhat theprocesses and dynamics that helped the maturation
88
Uganda
of national ownership. The government of the Na-tional Resistance Movement, under President Mu-seveni, which came to power in 1986, had comeout of a protracted guerilla and civil war, had a rad-ical and socialist ideological orientation that wasdecidedly antireform and anti-IMF, and graduallycame round to negotiating an ESAF program aftera long process of internal debate and consensusbuilding.
Museveni had attacked the previous government’seconomic policies and condemned previous stabi-lization programs as Fund impositions. Accordingly,upon assuming power, he had reimposed price andforeign exchange controls in the apparent belief thatthis would help curb inflation. And all this over thevigorous protestations of the bureaucrat reformers insome of the technical ministries. But in an early signof his openness to debate, the president had shieldedthese technicians from political victimization andkept them in their jobs.
By end-1986 to early 1987, it had become increas-ingly evident that the new policies of intervention-ism were a failure. By May 1987, inflation had ac-celerated to 380 percent from 120 percent in May1986, when the exchange rate was revalued, and aidflows had all but ceased. But the apparent failure ofthese policies, while not swinging the debate conclu-sively in favor of liberal reform, discredited the con-trol regime enough to pave the way for a renewedsearch for alternatives. In 1986, the InternationalDevelopment Research Council (IDRC), includingUgandans, was commissioned to do precisely that—that is, to propose alternatives. The team ended upproposing two models, one based on market reformsand the other, on central controls, although it advisedstrongly against controls.
Although dissension within the government con-tinued, President Museveni felt confident enoughabout the base of his political support to invite theFund back in early 1987 for discussion and to con-clude, in May 1987, a SAF supported by the Bank inthe context of a three-year Economic Recovery Pro-gram. The president’s confidence was well founded.By 1987, the government had gained widespreadsupport for restoring peace to the country and al-though isolated cases of fighting still continued, thepolicy of amnesty to the vanquished forces hadbrought about a great deal of reconciliation and im-proved the security situation, even if it had to bearthe cost of a vastly increased army whose numbersjumped rapidly from 14,000 at the beginning of1986 to over 100,000 in 1990.
It is interesting to observe though—and a crosssection of interviewees did indeed confirm this—that ownership of the program was still very tenta-tive and partial at this stage. Debates within the gov-ernment still raged and the president himself was not
the wholehearted convert that he was to become afew years later.
The government’s decision to adopt the 1987–89SAF program was dictated mostly by the need to ob-tain access to donor funds. Indeed, a 1988 internalIMF document does note correctly of this period that“the authorities were anxious to rally the support ofthe donor community.” One of the most thoroughgo-ing assessments of the political economy ofUganda’s reform experience by the Institute of De-velopment Studies confirms this view and adds, inour view correctly:
Given the lack of government conviction, it is not sur-prising that no progress was made at first with structuralreforms; the liberalization of agricultural marketing, thereform of the banking system, the reform of the civilservice, and the reform and privatization of the paras-tatal sector . . . . The Coffee Marketing Board resistedpressures to introduce coffee auctions; the government-owned commercial banks ignored liquidity and capitalratios while recklessly expanding their branch net-works. The civil service continued to expand and paras-tatals continued to declare heavy losses. The govern-ment persisted with control on the official price ofcurrent exchange . . . and continued to direct the lendingof the government-owned banks.78
Against the background of continuing dissensionand debate in government circles over the directionof economic policy between the date of adoption ofthe SAF in May 1987 and end-1989, parliament de-cided in 1989 to bar further devaluation. The keyeconomic ministries themselves were divided, withthe Ministry of Finance opposed to market reformsand the Ministry of Planning and Economic Devel-opment arguing for them in a rather unusual reversalof roles. In these circumstances, and to help breakthe impasse and thereby create space for correctiveaction, the president launched a debate under theauspices of the Presidential Economic Council, andunder his direct chairmanship, in which proponentsand adversaries of contending alternative policieswere invited to canvass their positions openly andwith written presentations that the president himselfreportedly read diligently.
The high point of the debate was a national con-ference convened in December 1989 to debate theissues of exchange rate policy and management. Allmembers of parliament, trade unions, academicswith research interest in the subject, and technocratsin the ministries were invited to dispassionately andobjectively canvass their positions. The most im-portant outcome of this phase of the debate—one
89
78Harvey and Robinson, 1995, p. 7.
IV COUNTRY PROFILES
that was to prove a major development in the reso-lution of the continuing policy stalemate—was theshift in the position of the president, who had thusfar straddled the divide between market and anti-market forces, to the side of the reformers. Of par-ticular importance was the decision to legalize ex-change rate bureaus. This decision conclusivelyresolved the debate on exchange rate policy, leavingstill unresolved the issues of fiscal policy and themanagement of inflation.
The Ministry of Finance supported an expansion-ary fiscal stance and continued to resist pressurefrom the Ministry of Planning and Economic Devel-opment to curb spending. Once again, the presidentintervened on the side of the Ministry of Planningand Economic Development when in April 1992,with the rate of inflation accelerating, he removedthe Minister of Finance, merged the Ministries of Fi-nance and Planning, and put the merged ministryunder the erstwhile Minister of Planning and Eco-nomic Development. With this, the government’sownership of the program of reform deepened as theInstitute of Development Studies report correctlyobserves (Harvey and Robinson, 1995). The relativesuccess of the ESAF programs that followed this pe-riod and the government’s success in dealing withthe fiscal crisis of 1992 are largely attributable tothis deepening of ownership. At the same time, de-lays have continued to characterize the implementa-tion of those aspects of the program on which dis-agreement between the Fund and the governmentpersists—notably, the areas of privatization, civilservice reforms, and defense expenditure cuts.
The Scope of ESAF Support
Although ownership had deepened tremendouslyby the time of the adoption of the first ESAF in 1989,the scope of support for the program naturally wasby no means complete. A number of key members ofgovernment still did not share the president’s keencommitment to the reforms. This was particularlyevident in the first period of the program from 1989to 1991, during which, as we have pointed out, ten-sions continued between the Ministry of Finance onthe one hand and the Ministry of Planning and Eco-nomic Development on the other, especially over fis-cal policy. Again, many internal IMF documentsmake references to government indecision.79
Beyond this phase though, it would seem that theprogram now enjoyed a broad measure of support
well beyond the small circle of highly committedand unusually forceful technocrats in the Ministry ofFinance and Economic Planning, who had initiallycarried it with the support of the president. This wasdue in part to the greater degree of political opennessthat characterized the political economy of the re-form process, especially since the mid-1990s. Thereis currently a growing perception that government ismuch more open to dialogue and debate.80 But thisgeneral assessment requires some important clarifi-cations. First, there are new, as well as continuing,tensions within government, which have been fueledespecially by the reseparation of the Ministry of Fi-nance and that of Planning and Economic Develop-ment. Moreover, thanks to this very process of polit-ical liberalization, powerful interest groups haveemerged that are now capable of influencing policiesin significant ways. Pockets of opposition to variousaspects of the program undoubtedly still remain.One such grouping is the Uganda Manufacturers’Association (UMA), a group that was largely mori-bund through the 1970s and early 1980s but whichhas been revived and now represents a large crosssection of business associations and includes about400 members.
Thanks to financial support from the U.S. Agencyfor International Development and technical assis-tance from Canada, the UMA is a well-organizedgroup with a credible policy unit that submits policyrecommendations and position papers to govern-ment regularly. The Association can be a fairly ef-fective lobby, as it demonstrated in 1993 when itmounted a campaign against increases in excise dutyrates introduced in the 1993–94 budget that took theintervention of the president and a compromise inthe way of a reduction in some of the proposed ratesto resolve. The Association enjoys the patronage andsupport of the president, to whom they have readyaccess. For this reason, they separate the presidentfrom the Minister of Finance and senior officials ofhis ministry; the president, in their view, consultswhile the implementers, namely, the Minister of Fi-nance and his advisors, do not.81 They have oftenused this access to great advantage and by their ownadmission, were instrumental in getting the presidentto once again separate the Ministries of Finance andPlanning because in their words, “the [incumbent]Minister of Finance and his principal secretary camefrom Planning to Finance, and promptly forgot allabout plannning.”82
The future direction of the program and the sus-tainability of the government’s commitment to theprogram, especially in the areas of fiscal policy, pri-
90
79A June 1989 internal Fund document noted that “the authori-ties were not able to commit themselves to any specific mea-sures” and also makes reference to a draft Memorandum on Eco-nomic Policies “which was extensively discussed with theauthorities but is not yet fully agreed.”
80Interviews, August 1997.81Interviews, August 1997.82Interviews, August 1997.
Uganda
vatization, and financial sector reforms, will be in-fluenced significantly by the effectiveness, or other-wise, of the UMA lobby and the outlook of the Min-ister of Planning, whose support for these aspects ofthe reforms is far from whole-hearted. Anothergrouping, the Uganda National Chamber of Com-merce and Industry (UNCCI), is not quite as well or-ganized and lacks the policy analysis capability ofthe UMA. For this reason, it is not as effective a pol-icy lobby although it has some political influence,especially with members of parliament.
The Uganda Exporters’ Association, on the otherhand, although not quite as organized as the UMA,is more effective than the UNCCI and is capable ofmilitant agitation. In 1994, it organized a short-livedbut disruptive protest by coffee exporters against anewly introduced graduated coffee tax. This Associ-ation’s technical capabilities appear to be improvingand their attitude to government would seem to bemore positive and less antagonistic than that of theUMA. This disposition, if nurtured by governmentthrough active dialogue, can be turned into a usefulcounterweight to the protectionist pressures from theUMA.
Uganda also has a fairly large number of non-governmental organizations (some estimates put thenumber at over 800), mostly formed apparently afterthe National Resistance Movement governmentcame to power. It would seem that in spite of theirnumbers, the NGOs are as yet not very influential asa policy lobby, except perhaps in the area of humanrights advocacy, a notable exception being OXFAM,which in the past has campaigned for debt relief.Moreover, tensions between local and foreign-basedNGOs have tended to dampen the effectiveness ofthe NGO community in policy advocacy and, if notresolved, will continue to undermine their potentialimpact on policy.83
Another institution whose support for the programis increasingly becoming crucial is parliament. In theinitial stages of parliamentary practice, parliament’srole in economic policymaking was limited and theMinister of Finance usually got his budget passed bylobbying influential members of parliament beforebringing budget proposals to the full house for de-bate. It would seem that this has now changed and—with the exception of monetary and exchange ratepolicy, which is left more or less exclusively to thecentral bank—major economic policy changes, es-pecially those affecting the budget and structuralchanges like privatization, civil service reform, andfinancial sector reforms, are now subject to muchfuller parliamentary oversight through the work ofvarious parliamentary committees that review major
policy reform proposals and report to the full house,which then adopts the proposals through reports ofthe parliamentary committee chairmen. Parliamenthas been particularly active in the implementation ofthe privatization program; in March 1993, it effec-tively stopped the implementation of the program ona private member’s bill when government sought toimplement the program without obtaining the priorapproval, by parliament, of appropriate legislation inthe form of a parastatal enterprise reform and di-vestiture bill. The bill was later to be passed in Au-gust 1993 in a closed session of parliament, underthe chairmanship of the president himself and at hisprodding. Two members of parliament sit alongsideministers and others on the Divestiture Implementa-tion Committee, which oversees the implementationof the divestiture program generally while parlia-ment as a whole participates in decisions affectingthe privatization of large enterprises such as theUganda Commercial Bank. Indeed, parliament’s ex-traordinary interest in the privatization of this partic-ular bank was brilliantly caricatured in one of thelocal newspapers while we were visiting Kampala;the cartoon had a number of parliamentarians stand-ing in front of the parliament building and threaten-ing that parliament would not pass a bill sanctioningthe privatization of the Uganda Commercial Bankunless the bill contained provisions obliging thegovernment to intervene if the new owners of thebank should attempt to seize the properties of loandefaulters, many of whom apparently were membersof parliament!
Finally, through its Committee on Social Services,parliament also gets involved in issues of poverty al-leviation. Interestingly, the two issues that appear tooccupy the majority of members of parliament arethe sustainability of the reforms when formalarrangements with the Bretton Woods institutionscome to an end, and ways of ensuring that povertyalleviation is mainstreamed into the reform programitself rather than through more or less adventitioussafety netting. Finally, the most significant, even ifunorganized, source of opposition to these reformsare mid- to senior-level civil servants and staff ofstate-owned enterprises who have either lost incomefrom scarcity premiums and the perks that camewith the administration of economic controls or arethreatened by potential job losses from privatization.In the end, therefore, the sustainability of the re-forms will depend crucially on greater consultationby government with business and political leadersand with trade unions whose power is bound to in-crease with better organization, and also with mid-to senior-level public sector employees who, fornow, feel some disaffection on account of their mar-ginalization from the gains of the recovery. In thisway, the program’s longer-term sustainability can be
91
83Interviews, August 1997.
IV COUNTRY PROFILES
better safeguarded by a reduction of its undue de-pendence on the role of the president himself.
Authorship of Policies and Agenda Setting
The government’s role in setting the policyagenda and authoring major policy documents, espe-cially those in the area of exchange rate reform and,to some extent, the area of fiscal policy, has beenreasonably strong, especially from the beginning ofthe 1990s when the dissension within governmentsubsided with the conversion of the president to theside of the reformers. In other areas that were essen-tially products of compromise, such as militaryspending, privatization, and civil service reformsafter the initial round of layoffs, the government’sleadership in setting the policy agenda and the paceof implementation does not appear to have been asstrong. Moreover, given the usual asymmetry intechnical expertise between the Fund and ESAFgovernments, not excluding Uganda, Fund staffinput into technical work, especially in the initialstages of the program, was much larger than the gov-ernment’s.84 Even so, the general policy frameworkof the SAF program had been under discussionwithin government long before the Fund was in-vited, in early 1987, to negotiate the program.85
Promotion of Ownership
The Uganda reform experience, as we have seen,benefited from a great deal of public education andconsensus-building initiatives by government. Men-tion has already been made about the debates and theculminating National Conference that took place inDecember 1989. Another distinguishing feature ofthe Uganda reform program in this regard is the roleof President Museveni himself in canvassing supportfor the program through public speeches, addresses,and seminars. Many of these initiatives are reportedin various Fund staff reports. Of particular impor-tance is the president’s role in defending policies,even in the face of popular opposition and protest,rather than opting for the path of political expedi-ency as most presidents are wont to do in such cir-cumstances. Without his personal intervention, for
instance, the value-added tax would not have beenpassed.
On the part of the Fund, a notable initiative forpromoting ownership was its proposal to, and accep-tance by, government to publish the PFP in 1995.
The Resident Representative
A resident representative has been stationed inKampala since 1982. Government, private sector,and NGO representatives interviewed generally hada favorable impression of the role and effectivenessof the incumbent resident representative and the of-fice of the representative mission. In the first yearsof the program period, Fund missions tended to in-teract, as is customary, mostly with the government,particularly Ministry of Finance and central bank of-ficials, and importantly, with the president, withwhom (according to some Fund staff reports) theyhad even more extensive meetings on occasion thanthey had with technical staff. In recent years, how-ever, the Fund has met a broader range of people,again as noted in staff reports and as confirmed byour field interviews. These include other ministriesthan the economic ministries, committees of parlia-ment, NGOs, private sector organizations, and UNagencies. Finally, donors appear to be satisfied withbriefings by Fund missions.
Vietnam
Vietnam represents a particularly interesting casefrom the point of view of its general reform experi-ence, but particularly for the lessons it offers on theissues of ownership, for a number of reasons.
First, market reforms were started long before theBank and the Fund resumed operations in the coun-try following the termination, in October 1993, ofVietnam’s ineligibility to use the general resourcesof the Fund.86 Second, these reforms took place in alargely war-torn economy. Third, the reforms werestarted and have continued largely without accompa-nying political liberalization. And fourth, the coun-try benefited from a remarkably large program oftechnical assistance under two UNDP/IMF pro-grams spanning the period 1990 through 1996, witha total of some 25 person-years, and this evidentlywithout any real loss of ownership over the directionof its policy reforms.
The first three-year ESAF program, approved bythe Board in November 1994, was preceded by a 12-
92
84In November 1988, for instance, a Fund mission reported thatit “prepared several technical notes at the request of the Ministerof Finance—for example, requirements for crop finance, impactof exchange rate changes on the budget, and on domestic prices;revenue enhancement from corporate taxes.” Similarly, a 1992 re-port states “the authorities welcomed the mission’s proposal thatthe Fund staff would prepare for the authorities’ consideration, anoutline of the main elements of the exchange rate system to beimplemented.”
85Interviews, August 1997.
86The ineligibility was lifted after Vietnam settled its arrearswith the Fund, totaling SDR 100.2 million, with funds arrangedby the Support Group for Vietnam and supplementary bridge fi-nance from conventional sources.
Vietnam
month stand-by arrangement that was canceled andreplaced by the ESAF.
Ownership and Governance Issues
The first period of reform, which entailed largelystabilization measures, and the follow-up programunder ESAF, which entailed a larger measure ofstructural reform, have both been conducted under ahighly centralized decision-making system thatcharacterizes Vietnam’s one-party political system.Accordingly, Party Congresses have been an impor-tant forum for policymaking and consensus building,and contrary to the teachings of conventional (West-ern) political theory, this has meant, in practice, thatdecisions are taken after lengthy periods of internaldebate, especially at the upper echelons of the party.The decisive landmark in the government’s liberal-ization effort was the decisions taken by the SixthParty Congress held in 1986, which recognized theneed for a fundamental modification of the socialistmodel of development. These paved the way for theadoption in the ensuing years of comprehensivemeasures of stabilization and structural reform.
The stabilization measures of the 1980s and early1990s brought about a rapid transformation of theeconomy and, thanks to accompanying structural re-forms and expanding flows of FDI, have helped toachieve spectacularly high rates of growth with anexpanding and increasingly diversified export base.
The first phase of the go-it-alone reforms wascharacterized by a high level of government supportand commitment although, of course, there weresome in the party leadership who were less than en-thusiastic in their support.87
Government leadership in setting the agenda anddetermining the pace of reforms was clearly decisivein this initial phase. Policies were adopted by gov-ernment after thoroughgoing debate and without anyexternal pressures, although the government soughttechnical assistance from varied sources, includingthe Fund, whose technical opinion it often sought inthe framework of the intensive collaborative ap-proach. Such technical assistance and advice merelyaided the process of decision making without deter-mining its outcome as such.
In contrast, the second phase of reforms has beencharacterized by an unmistakable slowing down inthe pace of implementation, and this against thebackground of an equally unmistakable erosion ofownership and commitment on the part of the gov-ernment to the reforms. First, there is a widespread
view in government circles that the government haslost the initiative in setting the agenda and deter-mining the speed of change. Government officialsand key functionaries, interviewed on the occasionof our visit to Hanoi, went to great lengths to ex-plain that while no policies had been imposed onthe government as such, there have been many in-stances in which government felt it had surrenderedto compromises, so as to conclude agreements withthe Bank and the Fund in the full knowledge thatthey risked the prospect that opponents would main-tain their reservations through the implementationperiod.88
There is the added factor that the reforms in theESAF period have been largely in the nature ofstructural changes—privatization, tax reform, tradeliberalization—whose political economy is usuallymore difficult to manage in any political situationthan purely macroeconomic reforms. Naturally, in acountry that had had no previous experience what-ever with market reforms, and in which the closedeconomy had developed such strong political andideological roots, it was bound to be even more diffi-cult. Predictably, in these areas the government pre-ferred a more gradualist approach to what it per-ceived as the Fund’s unreasonably fast pace.89
It is probable also that the building of support forthe reforms and the deepening of the government’scommitment to the program may have been compro-mised by some incompatibility between the tortuousand often protracted nature of the decision-makingprocess and the negotiating style of the Vietnamesegovernment90 on the one hand, and the time frameand negotiating strategy of the Fund on the other.
93
87In 1990, a leading Vietnamese official expressed his hopethat the successful implementation of the intensified collaborativeapproach “will disperse suspicion of the Fund among various cir-cles in our country.”
88In an interview with the governor of the State Bank of Viet-nam, a leading figure in government relations with the Fund(who, unfortunately, lost his position a day after we interviewedhim but for reasons, we were assured, that had nothing to do withour interview!), we were told that whereas in negotiations withthe Fund, consensus was always quickly reached on the generalobjectives, disagreements invariably arose on specifics, amongwhich he cited tariffs and state-owned enterprises, where govern-ment often felt that Fund staff came with fixed positions that theymerely wished to impose without sufficient understanding of thespecific conditions prevailing in Vietnam, especially its long pe-riod of state controls in economic management. He added that, inthese areas of disagreement, there often were “compromiseswhich then run into difficulties in implementation because noteverybody is convinced.”
89The government’s preference for a more gradual approach toprivatization and for the transfer of user rights rather than ofproperty rights to private citizens was not lost on the staff as thiswas alluded to in a number of internal staff documents. But thisdid not stop the staff from maintaining pressure on the govern-ment to accelerate the pace of reform. The result inevitably wasdelay in policy implementation.
90It is a negotiating strategy that has been influenced, not onlyby the centralized nature of decision making in Vietnam but alsoby the long history of Vietnam’s participation in the COMICOMsystem, which is notorious for interminable horse-trading.
IV COUNTRY PROFILES
Vietnamese negotiating teams would typically nego-tiate after obtaining a mandate from the party on keyissues to be negotiated. They would then begin ne-gotiations and, in the course of the negotiations, pro-vide briefings as required to the party, and when nec-essary seek fresh mandates for such concessions asneeded to be made. The internal negotiating processis thus often protracted and rather unhurried and, asthe Fund missions for their part are always unavoid-ably time-bound and also mandate-constrained,there is often a rush to conclude discussions, whichthen result in compromises that have little supportwithin government.
In the area of privatization, which is perhaps themost difficult in the policy agenda for the continuingreform,91 the pace of reform has been hampered, notonly by opposition from workers and managementfor the usual reasons, but also by the absence of aclear legal framework. For some reason, in Vietnamand in most other ESAF countries undertaking pro-grams of public sector reform, the privatizationprocess has always begun before an appropriate legalframework in the form of a divestiture implementa-tion or state enterprise law is passed, clarifying notonly the institutional framework but also ownershiprights in the case of Vietnam. Indeed, a number of of-ficials interviewed pointed out that one of the reasonsfor the difficulties encountered in the public sectorreform program was precisely that the government’sown guidelines for the program were unclear.92
Our sense is that the implementation of the priva-tization program will now move more smoothly, as anumber of officials pointed out, because these initialdifficulties have been mostly overcome. First, thereis broader support among management and workersof the affected enterprises, thanks to initiatives bygovernment to explain the objectives and allay theirconcerns. Second, there are more specific andclearer guidelines from government on the program.And third, the program that used to be under an En-terprise Reform Committee is now under the Min-istry of Finance, which has greater experience inmanaging state assets and probably has a keen eyeon the resources that can be mobilized from theirprivatization.93
The Consensus-Building Process
The effectiveness of the processes of consensusbuilding is obviously an important factor influencing
the extent of government commitment and publicsupport for policy reform. In Vietnam, the process isplayed through the various layers of the party, culmi-nating in debates in the Party Congress and in theNational Assembly. The Party Congress sets outmajor policy directions for socioeconomic develop-ment. The National Assembly is the supreme law-making body, which in addition to the passage oflaws approves major objectives and targets for eco-nomic development programs, including growthrates and other macroeconomic targets and budgetprojections for both recurrent and development ex-penditure. The government is the executive body re-sponsible for formulating and implementing specificpolicy measures aimed at realizing the broad direc-tions and goals set by the Party Congress and theNational Assembly.94 There is, of course, the elec-torate, whose voice and leverage are important in thepolitics of the party. In the most recent elections,held in the last week of September 1997, a new lead-ership representing this tendency, headed by Presi-dent Tran Duc Luong and Prime Minister Phan VanKhai, was elected. This change in leadership holdsgreat potential for an acceleration in the pace of re-forms and a strengthening of the government’s com-mitment to the Fund-supported programs.
Authorship of Program Documents and Policy Initiatives
As we have already noted, government ownershipof the reform agenda was particularly strong in thefirst years of the program of reform, with the gov-ernment itself clearly defining the agenda, in spite ofthe extensive technical assistance that it sought andused in the development of the policy framework inmany areas.95
Indeed, the government’s management of technicalassistance and the way it ensured government owner-ship, even with such extensive reliance on externaltechnical assistance, was especially skillful as a 1995internal Fund document duly noted. According to thisreport, “Partly stemming from the authorities’ desirefor ‘ownership’ of the program, and the emphasis oninstitution building, proposals requested from the[Fund’s] advisors are usually compared with those
94
91There are over 6,000 state-owned enterprises on the agendaof the reform.
92Interview with the Governor of the State Bank of Vietnam,Hanoi, September 27, 1997.
93Interviews with officials with the Ministry of Planning andInvestment, September 29, 1997.
94A leading national newspaper commenting on the election ofthis new team noted correctly that “unlike their predecessors whospent most of their lives in the atmosphere of battle, with the twowars going on, first between Vietnam and France, then betweenVietnam and the United States, most members of the newlyelected leadership have been carefully trained at professional in-stitutions at home and abroad.” (Dung, 1997).
95In 1990, for instance, the Vietnamese government sought theviews of the Fund on proposed financial sector reform measuresthat it planned to put before the Council of Ministers.
Zambia
made by other donor-assisted technical assistanceprograms before any action is taken.”
Thanks to this same concern for national owner-ship, the government’s participation in the negotia-tion of the PFP has been particularly active and de-tailed.96
The Resident Representative and Fund Cooperation with Donors and the Bank
The Fund has had a resident mission in Hanoisince 1992. The present resident representative isfairly new. We did not have the opportunity to assesshow well established the mission is since our meet-ings in Vietnam were arranged and coordinated en-tirely by the State Bank of Vietnam.
Regarding the Fund’s relationship with the Bank,although the staff documents describe this coopera-tion as close, and although numerous documentsrefer to joint work and the participation of the Bankin discussions with the authorities, there have beenconflicts, especially in the coordination of policy onstate-owned enterprise reform and banking sector re-form, as we have already noted. On a more generallevel, it would seem that Fund missions have not al-ways fully involved Bank resident mission staff andconsulted them adequately on issues of mutual inter-est such as those of privatization and banking sectorreforms.97
In the view of some staff members, the asymmetryin the levels of authority exercisable by Bank andFund resident missions—Bank resident missionshave greater decision-making authority than Fundresident representatives—makes it difficult to con-duct proper dialogue on, and coordinate, policy dis-cussions in the field as conflicts often have to be re-ferred to Washington, where they are not alwaysresolved satisfactorily. Any strain in relations wouldbe unfortunate as the Bank has been in Vietnamlonger and has more in-depth knowledge of thecountry’s economic and political profile, which canonly be beneficial both to the Fund’s resident mis-sion and to visiting missions.
Zambia
During the first decade of independence, the gov-ernment built a controlled, state-owned economywith high social spending financed by a boomingcopper sector. This system was probably the most
extreme example on the continent of state involve-ment in the economy, and was unsustainable exceptin the context of rising copper prices. The state sec-tor (the civil service and state-owned industries) hadlittle incentive to be efficient and was used as thebasis for a massive patronage system.
This inherently unviable system was hit by a largedeterioration in the terms of trade. By 1976, the gov-ernment was seeking assistance from the Fund.Since then, Fund involvement in the economy hasbeen almost continuous.
Program Design: The First Phase of Fund Involvement, 1976–91
Between 1976 and 1986 there were five stand-byarrangements and one extended arrangement, all insupport of adjustment. The last two of these pro-grams aimed at limited structural reforms centeredon the liberalization of exchange rate and pricingpolicies. These liberalizations began to be reversedin 1986 and collapsed completely in 1987. By1987, the economy was subject to intense rationingover a wide range of activities and the budgetdeficit reached 18 percent of GDP. Between 1976and 1986, per capita GDP declined by about 25percent. Within the same period external debt roseby $3 billion.
Between 1987 and 1989 there was no program.The government again began dismantling some as-pects of the control regime that it had restored in1987. By 1989, the Kaunda government again ap-proached the Fund.
An internal IMF document described the Kaundagovernment’s strategy as follows: “In 1989 Zambiaembarked upon an economic adjustment programthat was designed to create a diversified and mar-ket-oriented economy . . . . The Zambian authori-ties set out to end administrative controls in both fi-nancial markets and markets for goods, diversifythe economy’s export base, rebuild its infrastruc-ture, and exert control over domestic finances.”Given the record, this characterization of govern-ment intentions was implausible. Formally, mostprice controls were lifted, but informally they con-tinued. Parastatals were restructured but little rolewas accorded to the private sector. Rather, the au-thorities intended that the government would re-main the dominant participant in the economy.There is little reason to believe that this programwould have been more successful than its six pre-decessors. Economic events were overtaken by po-litical events and the Kaunda government washeavily defeated in the elections of late 1991. In therun-up to the election, the government had in-creased expenditures considerably, leaving a largefiscal deficit.
95
96Interviews, Vietnam, September 1997.97Although the Bank staff we interviewed were understandably
cautious in their reactions, they cited one recent example in whicha Fund mission ignored the Bank’s comments and handed in policyrecommendations that were at variance with the Bank’s position.
IV COUNTRY PROFILES
Program Design: The ESAF Phase of Fund Involvement, 1991–97
The new government was elected on a program ofradical structural adjustment, but faced an immedi-ate stabilization task. It negotiated a Rights Accumu-lation Program with the Fund, which began in 1992.The program envisaged a reduction in expenditurefrom 31 percent of GDP in 1991 to 27 percent in1992. Revenue was to rise from 16 percent to 17 per-cent and total resources (revenue and grants) from24 percent to 32 percent, largely on account of addi-tional aid. A complicating factor was the severedrought of 1992. The government devoted 4 percentof GDP to drought-related expenditures, but thesewere more than covered by an increase in aid of 6 percent of GDP. These plans envisaged a transfor-mation in net borrowing from the banking systemfrom 5 percent of GDP in 1991 to minus 2 percent in1992 despite the drought.
The actual expenditure reductions implementedduring 1992 were considerably more draconian thanhad been planned. Nondrought recurrent expendi-ture excluding interest payments fell from 18 per-cent in 1991 to 12 percent in 1992. However, thisreduction in expenditure occurred in the context ofvery high inflation and very weak accounting sys-tems. As a result, the government did not recognizethe severity of its own expenditure reduction and in-terpreted the inflation as a symptom of loss of fiscalcontrol. Indeed, in 1993, it introduced a cash budgetto regain control.
Contemporaneous with this fiscal adjustment, thegovernment liberalized the foreign exchange marketin October 1992 and shortly afterward, the domesticfinancial market. It has been shown that this resultedin a large, one-off reduction in the demand formoney, resulting in the inflation that the governmentmisattributed to loss of fiscal control (Adam, 1995).
Hence, while the fiscal adjustment was dramatic,as a result of the sequencing of structural reforms itdid not succeed in reducing inflation. In the first halfof 1992, the tight fiscal position had succeeded in re-ducing annualized inflation from close to 400 per-cent to less than 50 percent. However, following theliberalization, inflation rose again to nearly 500 per-cent. Such a level of inflation poses two problems.First, with an open capital account there was a se-vere danger of hyperinflation driven by falling realmoney demand. The introduction of the cash budgeteffectively removed this potential danger by stabiliz-ing expectations: inflation fell to zero within fourmonths. Second, very high inflation erodes the realvalue of tax receipts. This indeed happened: non-drought revenue collapsed from 18 percent of GDPin 1992 to only 13 percent in 1993. This collapse inrevenue when combined with the cash budget led to
a further drastic reduction in expenditure: non-drought expenditure fell from 17 percent to 12 per-cent of GDP.98
There is thus evidence that the sequencing of thestabilization and the macroeconomic components ofstructural adjustment was mistaken. The exchangerate and financial liberalizations undertaken prior tocompleted stabilization produced a large step-increase in the price level. If these reforms had beenpostponed until the fiscal adjustment had completedthe process of bringing inflation down, they wouldnot in themselves have been inflationary. This is be-cause while the reforms would have made capitalflight possible there would no longer have been anincentive for it. Hence, the demand for money wouldnot have collapsed.
The consequence for public expenditure was dra-matic: between 1991 and 1993 expenditure halvedas a share of GDP. This was massively deviant fromprogram plans and may be presumed to have im-posed very high political costs. The problems inachieving stabilization did not prevent the govern-ment from proceeding rapidly with the microeco-nomic components of its structural adjustment pro-gram. It started a massive program of privatization,eliminated subsidies, and liberalized trade.
The domestic budget was intended to be parti-tioned from both debt service and aid. Aid inflowswere planned to cover debt service with any surplusaid being used to reduce foreign debt. There was noprovision for domestic debt service in the cash bud-get. This created two ways in which the overall bud-get could be in deficit even though the cash budgetwas balanced, and both became important. Due tointerruptions in aid inflows the central bank pur-chased foreign exchange to meet the shortfall indebt-service payments, thereby increasing themoney supply. The net transfer to Zambia of exter-nal assistance declined sharply from $407 million in1992 to $48 million by 1996.99 This reflected a fallin debt relief and in balance of payments supportpartly offset by reduced debt service. The reductionin aid inflows was the result of the dissatisfaction ofdonors with political developments. Although theinitial stock of domestic debt was very small, ex-tremely high interest rates made domestic debt ser-vice increasingly significant, amounting to 4.4 per-cent of GDP by 1994. A third inflationary factor wasa bailout of a failing domestic bank. Between themthese three factors maintained inflation at high levelsuntil 1997 despite continued fiscal stringency.
A corollary of the rise in inflation, given that in-terest rates were liberalized, was that there was a
96
98World Bank, 1995c, Annex Table 5.99Zambia, 1996, Table 2.9. The figures exclude maize provided
as drought relief.
Zambia
squeeze on private sector liquidity. This drove realinterest rates to very high levels and appreciated thereal exchange rate.
Until 1996 the effect of the stabilization and adjust-ment programs on GDP was heavily negative: percapita GDP declined over the first four years of theprogram by 22 percent. However, in 1996 the econ-omy started to rebound, GDP growing by 10 per-cent.100 There is evidence of considerable structuralchange. The growth rate of 10 percent is measured at1994 relative prices; when measured at 1977 relativeprices, GDP growth is much lower (6 percent). Thisimplies that growth has been concentrated in activi-ties that have been favored by the relative pricechanges brought about by liberalization. Within man-ufacturing there was a large switch from import-sub-stitute sectors, such as fabricated metal products, toagro-processing activities such as food, beverages,and tobacco. Within agriculture, resource reallocationhas been slower but there is evidence of considerablerecent crop diversification. In 1997 the area devotedto maize declined by 4 percent, offset by expansionsof 52 percent in cotton, 41 percent in groundnuts, and32 percent in cassava.
The prolonged period of rapid decline must raisequestions about program design. However, given theinitial configuration of the economy, even with anideally designed program there was likely to be aninitial phase of decline.
Agricultural value-added declined by about one-fourth in the first four years of the program. Therewere four factors accounting for this decline. First,there were three years of drought. Second, the govern-ment withdrew public marketing agencies before pri-vate agents entered the market. This was to a large ex-tent unavoidable since private agents were deterred bythe expectation of renewed government interferencein food marketing. Third, the government withdrewthe fertilizer subsidy. While at world prices this prob-ably enhanced allocative efficiency, the agriculturalresponse is currently only measured at the highly dis-torted prices prevailing in Zambia in 1977.101 Fourth,the previous system of pan-territorial pricing of maizeand fertilizer had encouraged overproduction in theremote areas.
While these factors were reducing the economy,the forces of expansion released by the liberalizationwere initially likely to be atypically weak in Zambia.First, the heritage of the Kaunda era was the re-stricted size of the private sector, with most manu-facturing and all rural trade in the public sector. Al-
though markets were liberalized, there were initiallyfew agents to take advantage of the new opportuni-ties.102 There were few private traders: even by 1996only 40 percent of farmers were within 5 kilometersof a food market and only about one quarter of farm-ers received satisfactory information on output mar-kets.103 There was a lack of farmers in the agegroups likely to innovate: Zambia was unique inAfrica in the extent of its migration to urban areas,leaving the rural areas denuded of prime-age, edu-cated adults. Second, the rural road network wasvery poor, having deteriorated through neglect ofmaintenance. This presented a serious constraintupon the switch from food to cash crops. The busnetwork gradually improved, but even by 1996, over40 percent of the rural population was more than 5kilometers from a bus. Where the transport networkwas well developed, particularly along the line ofrail, a substantial switch to new crops occurred.Third, the initial situation was one in which fewcrops other than maize were grown. Hence, the agri-cultural sector was producing at a “corner solution.”This specialization implied that there were neitherexisting growers for the newly profitable crops fromwhom techniques could be diffused, nor the neces-sary market institutions. Some coordination wastherefore needed between potential growers and po-tential buyers.
In the event, there were several respects in whichthe program was not ideal. As we have discussed,there were in our view sequencing errors that delayedthe attainment of stabilization. The delay in stabiliza-tion produced an avoidable credit crunch, which hadtwo serious consequences for the private sector. First,and probably most important, it delayed the emer-gence of private trading in rural areas, an activity thatwas vital in view of the removal of public trading, thelimited extent of on-farm storage, and the need forchanges in the production mix. Second, the creditcrunch squeezed private investment. A survey ofmanufacturing firms in 1995 found that three-fourthsfaced liquidity problems.104 Private investment wasalso deterred by lack of credibility.105 In one sense alack of credibility would be surprising in view of thesweeping structural reforms and massive expenditurereductions. However, the continuing inflation could
97
100This figure is based on provisional National Accounts data,kindly supplied by the Central Statistical Office.
101At present only aggregate GDP is available at 1994 relativeprices; the sectoral level growth rates are still reported at relative1977 prices.
102In this respect Zambia was similar to transition economies.However, it did not have the other characteristic of sucheconomies: a large sector that was intrinsically uncompetitive atworld prices. Zimbabwe was just the opposite, having privateagents but a large, uncompetitive manufacturing sector.
103Zambia, Central Statistical Office, University of Zambia,and World Bank, 1997, p. 10.
104Seshamani, 1997. The data are from the RPED Survey.Comparable data for other African countries show a much lowerincidence of liquidity problems.
105World Bank, 1996b.
IV COUNTRY PROFILES
well be misinterpreted as a lack of commitment,while the large debt overhang potentially constituteda future tax liability for the economy.
The delay in stabilization also unnecessarilysqueezed public expenditures, in particular on main-tenance and investment. This reduced the road pro-gram, which, as we have seen, should have been ahigh priority in terms of the critical path to renewedagricultural growth. A further error of sequencingwas the failure to privatize ZCCM early in the pro-gram. The cost of continued mismanagement of thecopper sector was foreseeably high. The Fund staffjustifies program sequencing as follows. What weregard as premature financial liberalization is de-fended as “the urgent need for liberalizing the econ-omy, which had been stifled by controls was so greatthat the potential short-run costs were probably un-avoidable.” Conversely, what we regard as unwar-ranted delay in privatizing the export sector is de-fended as “a reflection of the Fund’s flexibility toallow the authorities more time to deal with thishighly sensitive issue.”
Distributional Effects:The First Phase of Fund Involvement, 1976–91
We consider in turn the two routes by which aFund program might have a social impact, changesin incomes, and changes in social expenditures.
During this phase per capita GDP declined byone-fourth. Against this background, it is to be ex-pected that most social groups would face severe de-clines in income. Real wages in the formal sector de-clined to around one-fifth of their initial level(UNFPA, 1997). Urban household incomes halvedwhile rural household incomes were protected.106
Since wage earners were much better off than small-holders, and since within the formal sector there waspowerful wage compression, there was a consider-able reduction in inequality. The ratio of income inthe top quintile to that in the bottom, initially veryhigh at 18, narrowed to 9.107
By 1991, despite the increased equity, Zambiahad a severe poverty problem. The two major socio-economic groups among which poverty was con-centrated were smallholders and urban wage earn-ers. The two groups were of similar size andaccounted for around 87 percent of the population.The incidence of poverty among smallholders, was
double that among wage earners: 81 percent asagainst 42 percent.108 Although urban wage earnershad borne the brunt of the income decline duringthe period, the poverty problem remained concen-trated among smallholders, who accounted for two-thirds of the poor.
Health and education spending sharply declinedeven relative to GDP (Table 14). In conjunction withthe decline in incomes, this produced a deteriorationin most of the health-related social indicators.Whereas at the beginning of the period the social in-dicators for Zambia had been much superior to theAfrican average, by 1991 they had deteriorated tobelow the average.
In summary, during the first period of Fund in-volvement there was a severe fall in income and adeterioration in social indicators. Poverty was con-centrated among the rural population.
Distributional Effects: The ESAF Phase of Fund Involvement, 1991–97
The program explicitly considered the social con-sequences both of the reforms and of the contempo-raneous drought. The measures envisaged includedthe distribution of maize, largely in rural areas, ei-ther at a 50 percent discount or free. Part of the sav-ings from the removal of urban consumer subsidieswere earmarked for welfare programs for the ruralpoor. There were also labor-intensive public worksprograms for the creation of infrastructure inpoverty-targeted rural public services. The share ofhealth and education expenditures in the budget wasraised. However, in view of the scale of the reduc-tion in public expenditure, the protection of socialexpenditures was inevitably going to be difficult.
Again we first consider the impact of the pro-gram on incomes. Per capita GDP declined by 22percent between 1991 and 1995, rising by 7 percentin 1996. We focus mainly upon snapshots of theeconomy in 1991 and 1996 over which period it de-clined by 16 percent.
Recall that as of 1991 the major poverty groupwas smallholders. Somewhat surprisingly, realwages in the formal sector appear not to have de-clined between 1991 and 1996.109 However, urban
98
106Zambia, Central Statistical Office, 1994. We have compareddata from the 1974/75 Household Budget Survey with the 1991Prices and Incomes Commission Survey, assuming that the ratioof metropolitan/urban households and of non-metropolitan/ruralhouseholds was the same in 1991 as in the 1993/94 HouseholdBudget Survey.
107World Bank, 1997f.
108Zambia, Central Statistical Office, 1993. The poverty line isnutritionally based.
109Real mean earnings of central government workers re-mained constant between December 1991 and June 1996. In localgovernment, parastatals and the private sector real mean earningsrose, but this may be a statistical artifact because of composi-tional changes, notably the privatization of parastatals. Composi-tional changes are unlikely to account for the constancy of centralgovernment wages. However, it should be noted that calculationsof real wages over periods of very rapid inflation are liable to besubject to wide margins of error.
Zambia
household incomes nevertheless declined because ofthe reduction in formal sector employment opportu-nities. Urban formal sector jobs declined by aboutone-fourth relative to the urban workforce.110 For-mal sector employment was atypically important asa component of income in Zambia because of thesuppression of informal economic activity. We esti-mate that in 1991 it accounted for about 56 percentof urban household incomes.111 Hence, had percapita informal sector income been constant, meanurban household income would have fallen byaround 14 percent. This may exaggerate the declinein urban incomes because the informal sector rapidlyexpanded.
Smallholder value-added per capita declined by13 percent during 1991–96. Hence, comparing thetwo major social groups in the two snapshot years,1991 and 1996, both appear to have experienced in-come losses of about 13–14 percent, a magnitudethat is corroborated by the national accounts. How-
ever, the path between these snapshot years wasprobably very different for the two groups. Small-holder income was markedly lower in 1996, partlybecause of three droughts. Between 1991 and 1994,rural household incomes fell by around 30 percentwhereas urban incomes rose slightly.112
This picture of fairly equally shared losses by theend of the period with rural households bearing thebrunt of the larger intervening losses is broadly sup-ported by the evidence from selfassessment. Askedwhether living standards were higher, the same, orlower in 1996 than in 1991, urban respondents split36 percent-27 percent-37 percent, whereas rural re-spondents split 23 percent-28 percent-49 percent.
We now turn to the provision of social services.Government spending on health and education in-creased as a share of GDP. As a result, per capitaspending on health and education increased invalue terms (i.e., deflated by the GDP deflator) de-spite the fall in per capita GDP. However, the costof providing the services rose relative to the GDPdeflator. These services were labor intensive and,by protecting the real incomes of its workers at atime when productivity across the economy wasfalling in terms of consumption goods, the govern-ment increased their cost. Table 15 shows these di-vergent effects. The volume measure is derived bydeflating expenditure by its own GDP deflator,which is dominated by government wages. Thevalue measure is derived by deflating by the aggre-
EducationEducation spending 100 (1980) 60Primary school enrollment 80% 70%
Sources and definitions: Health spending: index of spending in constant prices per capita, from World Bank,Zambia Poverty Assessment, Vol. 1, p. 95., education spending: index of spending in constant prices per capita, fromGovernment of Zambia and United Nations, 1996, Fig. 5.8. quality of hospital care: malaria deaths per 1,000 hospi-tal admissions, from United Nations, 1996, Fig. 5.6. primary school enrollment: for 1976, percentage of childrenaged 7–14 attending school, from Ministry of Education, 1976, Table A13; for 1991, percentage of children aged7–13 attending school, from Zambia, Social Dimensions of Adjustment, 1997, Table 7.1.
110In absolute terms, formal, nonagricultural employment de-clined by 12 percent. There are no data on urban populationgrowth over the period and we assume, conservatively, that itgrew only in line with the national population, at 3 percent perannum.
111Urban employment in 1991 is taken from Zambia’s Quar-terly Digest of Statistics, 1996, Table 47 (excluding agriculture).Average earnings in December 1991 are from the Quarterly Em-ployment and Earnings Statistics, June 1992, Table 2. This givesan estimate of the urban wage bill at the end of 1991 of K 3,721million per month. Mean urban household income and the num-ber of urban households for 1991 is from Zambia’s Central Statis-tical Office, 1993, Table 9.1. This gives monthly urban householdincome as K 6,700 million. 112Zambia, 1994, Household Budget Survey 1993/94, Table 1.3.
IV COUNTRY PROFILES
gate GDP deflator. Table 15 presents a third mea-sure—namely, value-added (rather than govern-ment spending) in the health and education sectors,deflated by the sector-specific GDP deflators, as inthe case of the volume measure.
For health care, both volume measures decline.However, the value series shows a substantial in-crease; hence, the government was devoting more ofthe economy’s resources to the health sector but thiswas producing less. As elsewhere in Central Africa,over the period 1991–96 the need for health care wasrising because of the incidence of AIDS and by1992, AIDS-related illnesses accounted for 43 per-cent of in-patient days in hospitals (Foster, 1993).The evidence on the indicators is mixed. The accessof the rural population to health facilities, drinking
water, and latrines improved, but there is evidence ofincreasing malnutrition. This is not surprising giventhe fall in incomes.
Cost recovery had started in 1989 and was ex-tended in 1993. In rural areas this was not a goodtime to implement cost recovery. The rural popula-tion had faced a depletion of its real cash balances asa result of inflation, and was not in a good positionto replenish them in view of the drought and thebreakdown of the marketing system.
For education, the two volume measures alsoshow a decline, but in this case there is considerabledivergence between them. The most likely reasonfor this is that expenditure for school books andother materials fell relative to the wage bill. Thiswould reduce the expenditure measure (a gross out-
100
Table 15. Zambia: Social Indicators, 1991–96(In percent, unless otherwise indicated)
1991 1994 1996
HealthBudget actuals per capita (volume) 100 91Budget actuals per capita (value) 100 127Health value-added per capita (volume) 100 85Rural
Households within 5 km. of health facility 42 52Households with clean drinking water 20 31Households with pit latrines 50 63Incidence of stunting 46 52Children underweight 25 27Incidence of wasting 5 5
UrbanHouseholds within 5 km. of health facility 92 100Households with clean drinking water 90 88Households with pit latrines 49 51Incidence of stunting 35 41Children underweight 20 19Incidence of wasting 7 6
EducationBudget actuals per capita (volume) 100 72Budget actuals per capita (value) 100 124Education value-added per capita (volume) 100 85Rural primary school attendance aged 7–13
Boys 60 62Girls 59 63
Urban primary school attendance aged 7–13Boys 82 81Girls 82 81
Sources: Zambia, Central Statistical Office, 1996; for vaccinations: Zambia and United Nations, 1996, and Central Statistical Office, Ministry of Healthand Macro International Incorporated, 1997; health and education volume measures from National Accounts data on GDP in education and health (in1994 prices), corrected for population growth assumed at 3 percent per annum.
Zambia
put concept) relative to the value-added measure.Pupil textbook ratios in primary education currentlyrange between 5 and 50.113 As with health care, thegovernment was devoting more of the economy’s re-sources to the sector, reflected in a substantial in-crease in the value measure, but this was purchasingreduced services.
The outcome measures show that enrollment wasstable in urban areas and increased a little in ruralareas. Although we lack quality indicators, theremust be a presumption that in view of the decline inmaterial inputs the quality deteriorated.
In summary, there was during this period a sharpfall in per capita income. While urban wages wereprotected, formal sector employment contracted.Both urban and smallholder incomes fell in percapita terms by about 13–14 percent. Governmentspending on health and education increased as in-tended, but the output of these services fell. Al-though all major social groups appear to have lost,since poverty was initially concentrated in the small-holder sector, it is the losses in this sector that are ofparticular concern for the design of safety nets. Mal-nutrition worsened among smallholders and this atleast raises the question as to whether safety netswere adequate. Part of the increase in malnutritionwas presumably due to the series of droughts duringthe adjustment period. However, drought relief pro-grams were quite effective, and there are identifiablefailures in safety net design for those adversely af-fected by the adjustment.
There were several channels through which theseadverse effects arose. First, the removal of the fer-tilizer subsidy reduced food production. While inthe long term this will improve allocative effi-ciency and thereby income, in the short term it re-duced food consumption. There was no automaticmechanism directing the resources released fromthe removal of the subsidy to rural households.Second, the removal of pan-territorial pricing abol-ished the implicit subsidy on maize production inthe remote areas. Third, the previous subsidy sys-tem had implicitly discouraged on-farm storage:farmers could purchase milled grain for less thanthey could sell their unmilled grain. Fourth, the re-moval of the public marketing system created aninterval in which there were too few private mar-keting agents.
These changes affected particular groups of farm-ers differently. The loss of the fertilizer subsidy af-fected all farmers. Farmers in remote areas had toadjust to a situation in which maize was only eco-nomic as a subsistence crop, but as a subsistencecrop it required on-farm storage, which was lacking.
For them, the absence of grain traders was not a tem-porary phenomenon but a new permanent feature. Inother areas, maize would remain economical as acash crop so that the absence of private traderswould be only temporary. During the phase in whichmarkets were developing in these areas, market ac-cess would be unreliable and so farmers also wouldface a storage problem. These effects were pre-dictable and hence had implications for program de-sign. In the remote areas there was a clear policyproblem: more on-farm storage was required thanwas initially available. There was a need for a tar-geted program supplying these farmers with on-farmstorage facilities. In other areas, the best that thegovernment could do was to facilitate the emergenceof private marketing and the concomitant commer-cialization of smallholdings through diversificationinto new crops. This would involve road repair andtargeted extension advice. The first step in improv-ing extension advice would be to retrain extensionworkers. The focus of the service was initially themaximization of maize yields and needed to beswitched to the maximization of agricultural income.
Conclusion
Zambia has had an unusually long relationshipwith the Fund in the area of adjustment. We havegrouped the various programs into two phases, cor-responding to the previous and current governments(1976–91 and from 1991 to the present).
In the first phase, the economic philosophy of thegovernment was fundamentally antipathetic to theliberalization of the economy. As a result, Fund anddonor involvement led to the accumulation of mas-sive debts and a record of failure in both stabiliza-tion and adjustment. Although the present reformprogram was begun in the final years of the Kaundaregime, there seems little reason to expect that itwould have been sustained had it not been for achange of government.
The debt overhang has had consequences for thecurrent program. While when the new governmenttook office there was an understanding that thedonors would meet debt-service obligations, politi-cal concerns have led to sporadic interruptions indonor support, worsening the stabilization problem.
There have been three weaknesses in the design ofthe current program. First, the move to capital ac-count convertibility and interest rate liberalizationprior to the attainment of stabilization created anavoidable bout of inflation, which had multiple ad-verse effects. It created a credit crunch in the privatesector, delaying the emergence of rural food marketsand reducing the private investment required forstructural change. It also induced the government toreduce expenditures far in excess of program plans,
101
113Saasa and others, 1996, p. 59.
IV COUNTRY PROFILES
while creating the impression that it was fiscally irre-sponsible. Second, the structural reforms needed tobe sequenced in a particular way in order to producegrowth. Two important sectors, copper and agricul-ture, needed early policy attention. Reform of thecopper sector required the privatization of ZCCM, apolicy that has still not been implemented. Given thefundamental importance of the copper sector inZambia, this was a major error. Agricultural growthrequired early improvement of rural roads and the re-focusing of the extension service to new crops.
Finally, although there was some discussion ofsafety nets in program design, the scale of resourceswas not commensurate with the problem. Further,insufficient analytic attention was paid to the identi-fication of target groups. In the health sector, usercharges were extended just when the rural popula-tion was facing a serious liquidity problem. In theeducation sector, the squeeze imposed through thecash budget reduced nonsalary relative to salary ex-penditures, as a result of which the availability ofteaching materials declined. Identifiable groups ofsmallholders were adversely affected in ways thatcould have been better offset. Smallholders in re-mote areas had to make a transition into maize sub-sistence and urgently required assistance in buildingup on-farm storage capacity. In more accessibleareas, the transition to the private market could havebeen accelerated by increased road maintenance andrefocusing of extension.
Zimbabwe
By the late 1980s, the government of Zimbabwehad come to regard its development strategy as un-sustainable. This strategy had two core components.One, inherited from the Unilateral Declaration ofIndependence (UDI) regime, was an extensive sys-tem of economic controls to support industrial au-tarky. The other, initiated by the postindependencegovernment, was a massive redistributive system ofsocial expenditures—notably, high levels of healthand education expenditures. The former strategywas condemning the economy to slow growth. As aresult, the latter strategy was seen as becoming fis-cally unsustainable.
The control regime had resulted in a very largeand diversified industrial sector serving largely thedomestic market. By 1990, manufacturing ac-counted for one-fourth of GDP. The export sectorhad stagnated because the same control regime thatsustained the industrial sector implicitly heavilytaxed the export activities. Since there was no scopefor further import substitution, industrial growth de-pended upon growth elsewhere in the economy.However, since the export sector was handicapped
by the policy regime, the only dynamic componentof the economy during the 1980s had been the publicsector, which became fiscally constrained. Hence,the government was in our view correct to regardeconomic policy change as being necessary forfaster growth.
Many of the existing industrial firms produced in-puts that would be needed by potential export activi-ties. Many of these firms were producing at highcost and were intrinsically uncompetitive at worldprices. Hence, export expansion required the demiseof these activities. The peculiar industrial structureof Zimbabwe thus left no option for continued pro-tection: to make viable the activities with the poten-tial for growth, the existing industrial sector had tocontract. This made the reform process in Zimbabwemore analogous to that in the transition economiesthan that in the rest of Africa: the first years of re-form would be likely to be contractionary. In theevent, between 1991 and 1996, manufacturing out-put contracted by 14 percent.
The economic control regime inherited from theUDI period had been extended to cover the labormarket by the postindependence government for re-distributive purposes by means of minimum wagerates and employee rights. Minimum wages weresharply increased in the early 1980s. To preventfirms from shedding labor in response to the in-crease in wages, employee rights were introducedwith severe restrictions upon firing. While thesechanges redressed an inherited imbalance of powerin the workplace, over time they reduced employ-ment. There is evidence that employment declinedsignificantly as a result of both higher wages and re-strictions on firing.114 Hence, reform was necessaryfor enhanced growth. However, the short-term effectof removing employee rights was likely to be a re-duction in employment as firms shed workers thatwere surplus to existing requirements. Therefore, aswith trade policy, the effect of reform on employ-ment, while ultimately positive, was likely to benegative in the short run.
The core of the government’s redistributive agendawas through increased public expenditures on educa-tion, health, and public sector employment. Duringthe 1980s much was achieved, both in terms of an ex-pansion of these expenditures and in terms of measur-able indicators of performance. In the process, gov-ernment expenditure rose rapidly to about 47 percentof GDP. This was financed partly through high ex-plicit taxation, at about 37 percent of GDP, with theremaining large fiscal deficit of 10 percent financedby domestic borrowing. This borrowing was done atheavily negative real interest rates as a by-product of
102
114See, for example, Fallon and Lucas, 1993; and Jenkins andKnight, 1997.
Zimbabwe
financial repression, so that the allocation of creditwas part of the economic control regime.
Program Design
The program had in effect two components—fis-cal adjustment and economic liberalization. Sincesome aspects of economic liberalization had largefiscal consequences the two were connected.
The fiscal aspects of the reform program had threeelements. First, as noted, the fiscal stance had come tobe seen as unsustainable since it depended upon risingindebtedness. There was seen to be a need to reducethe fiscal deficit from 10 percent to 5 percent of GDP.One potential option would have been to increase ex-plicit taxation to reduce the implicit taxation of forcedsavings. However, this was not considered.
Second, there was a perception that taxation wasalready dysfunctionally high. Part of the reform pro-gram was, therefore, to reduce explicit taxationrates. It was hoped that lower tax rates would suffi-ciently stimulate activity so that revenue would be atleast somewhat protected. The original agreementwith the Fund (requested in December 1991) envis-aged reducing the “high tax burden” but targeted therevenue/GDP ratio for 1994/95 at 34 percent, whichhad been the average for the 1986–89 period. Theactual revenue/GDP ratio in that year was 28.3 per-cent. This was a point of contention between Fundand Bank advice. The Fund supported the Ministryof Finance’s proposals for reductions in tax rates,whereas the Bank tended to oppose them, partly onthe grounds of equity and partly because of thelikely revenue impact. In the event, revenues as ashare of GDP, declined by 5 percentage points.
Third, the government wished to dismantle thesystem of nonmarket credit allocation. In the De-cember 1991 request, it announced that there wouldbe a “complete deregulation of interest rate.” How-ever, the liberalization of financial markets would befiscally costly. As of 1991, domestic debt of the cen-tral government was 26 percent of GDP. In 1990, thegovernment was paying about 9.5 percent nominalinterest on its domestic debt with an inflation rate of23 percent so that its real interest rate was heavilynegative. By 1996, the Fund and the Bank were pro-jecting a real interest rate of 8 percent on domesticdebt. Hence, even if domestic debt remained con-stant as a percentage of GDP, the eventual cost of fi-nancial liberalization would have been about 5 per-centage points of GDP although the cost would bephased according to the maturity of the existingdebt. In the event, by 1995/96 the interest bill ongovernment debt had already risen by the full 5 per-centage points of GDP.115 This was because, al-
though not all the low-interest stock had matured,the failure to meet fiscal targets had necessitated fur-ther domestic borrowing so that the domestic debtburden had increased to around 55 percent of GDP.
Thus, the fiscal aspects of the reform program pre-supposed an astonishing contraction of noninterestexpenditures. The three policies noted above requireda combined reduction in noninterest expenditures of15 percentage points of GDP over the four years1992–95. The program itself estimated that the re-duction would have to be 7.5 percent of GDP. Of this,the “excessive burden” of public sector enterpriseswas estimated at 3 percent of GDP. The program thusradically underestimated the fiscal implications of itspolicies. Since noninterest expenditures initiallyamounted to 37 percent of GDP, they would (in theabsence of GDP growth) have to be cut by 40 per-cent. In the absence of growth, this would involve ex-penditure reductions of 40 percent. With expenditurereductions on anything like this scale it would be in-evitable that social and redistributive expenditureswould be massively curtailed. Nor, as we have noted,was it likely that in the first years of the reform pro-gram there would be rapid growth. In the event, GDPper capita declined by 9 percent over the period1990–96. Hence, the macroeconomic decline com-pounded the fiscal problem: to meet the fiscal goalsreal per capita noninterest expenditures would haveneeded to be reduced by 46 percent.
Such a severe reduction in social and redistribu-tive expenditures would inevitably have put the re-form program under great political strain. Ar-guably, this would have been feasible only if therehad been wide consensus in the government, theparty, and civil society on the need for such drasticchange. That no such consensus was built reflectedtwo miscalculations. First, there was an economicmiscalculation: the government was not fullyaware of the aggregate implications of the three de-sired components of fiscal adjustment. The scenar-ios envisaged by both the government and the in-ternational financial organizations were undulyoptimistic. We should note that this goes beyondthe failure to build in the risk of drought. While the1991/92 drought derailed the program, the likelypolitical unsustainability of the program could havebeen anticipated. The second miscalculation waspolitical. The above fiscal adjustments proved to bepolitically unfeasible: in particular, the fiscaldeficit actually increased and this was the reasonfor the 1995 interruption in the program. The re-formers in the government failed to campaign for asufficiently broad-based consensus to sustain theprogram, although it must be doubted whether anypolitical campaign could have sustained such adrastic reduction in social expenditures as that re-quired to meet the fiscal objectives.
103
115World Bank, 1996d, Vol. 1, Table 1.1.
IV COUNTRY PROFILES
The core of the economic liberalization programinvolved dismantling the system of nonmarket allo-cation of foreign exchange, including comprehen-sive protection of the large manufacturing sector.This was very substantially accomplished by 1996.Similarly, the financial sector was decontrolled; in-terest rates became market determined and manynew banks were established. The labor market wasderegulated, with free collective bargaining replac-ing centralized wage setting, and firing restrictionswere removed. Reform of the parastatal enterpriseswas much slower, but by 1996 the monopoly of theGrain Marketing Board had been ended and a starthad been made on privatization of state enterprises.
As noted above, Zimbabwe had many of the char-acteristics of a transition economy, so that the likelyinitial consequences of economic liberalization werenegative. Thus, the decline in manufacturing by 14percent between 1991 and 1996 was broadly pre-dictable. Since manufacturing was one-fourth ofGDP, it was unlikely that other components wouldoffset this decline in the short run. The programagreed between the government and the Fund madeno allowance for these short-term effects of liberal-ization. The Fund staff report of January 1992 envis-aged an 18 percent growth of GDP between 1991and 1995. In the event, growth over this period wasonly 1 percent. This very large misforecast clearlyhad the effect of making the fiscal adjustment appearmore feasible than was actually the case.
Of the two components of the reform program, theeconomic liberalization was almost fully imple-mented, whereas the fiscal adjustment, though mas-sive, seriously missed its goals. That the fiscal goalswere missed reflected not primarily the droughts butthe fact that goals were unrealistic.
Macroeconomic Consequences of Fiscal Incompatibility
The fiscal objectives of the program implied such adraconian reduction in noninterest expenditures that itwas unsurprising they were not fully attained. Thegovernment made a huge fiscal adjustment, reducingnoninterest expenditures by 7 percentage points ofGDP. However, this was insufficient not only to closethe original deficit, but also to meet the new fiscalcosts of tax reduction and financial liberalization. As aresult, the deficit increased from 10 percent to 12 per-cent of GDP. With such a large and variable deficit,both nominal and real interest rates were high andvolatile. Nominal rates at times exceeded 40 percent.There is evidence that these high real interest rateshad a strong negative effect on private investment(Marande and Schmidt-Hebbel, 1994). In the event,total fixed investment (public and private) declined by9 percent in real terms between 1991 and 1996. Al-
though the breakdown between public and private in-vestment is not precisely known, there is clear evi-dence that public investment declined sharply. Privateinvestment is likely to have declined both because ofthe interest rate effect noted above and because of theuncertainties arising from the unsustainable fiscaldeficit and the interruption of the Fund program.
The decline in investment has repercussions forthe path of the economy during adjustment. The shiftin relative prices is designed to generate growth innewly profitable activities, generating both employ-ment and investment opportunities. Evidence fromtracking surveys over 1993–95 in the manufacturingsector suggests that, to date, there has been little re-allocation of investment in favor of export activities(Neube and others, 1997). The lack of investmentexacerbated the employment problem.
The other consequence of the insufficiency of fis-cal adjustment was that the government entered adebt trap. Since the real interest rate considerablyexceeded the growth rate, the ratio of debt to GDProse rapidly. By 1996, it had reached 80 percent andwas projected to rise to over 100 percent within thenext decade.116
Hence, the macroeconomic consequences of fiscalincompatibility were severe. Given the highly ambi-tious nature of the original program, some risk assess-ment of what proved to be the actual scenario shouldhave been undertaken. However, a much more effec-tive way of introducing a realistic degree of cautioninto the program would have been to change its se-quencing. When the Board discussed the original pro-gram in January 1992, no consideration was given tosequencing. Yet, both the financial liberalization andthe reductions in tax rates had the potential for beingphased in gradually, behind the implementation ofdeficit reduction measures rather than before them.Politically, the most difficult reforms proved to be thecontainment and privatization of public enterprises,which in the event took about six years. The fiscallycostly elements of the reform program could havebeen sequenced to follow public enterprise reformrather than anticipate it. Financial liberalization wouldhave been achieved automatically had the deficit beenbrought under control because the decline in inflationwould have permitted real interest rates to be positive.As it was, the abrupt decontrol of nominal interestrates created fiscal crisis. Similarly, the reductions intax rates could have proceeded on a more limited andexperimental basis, rather than being implementeddespite the evidence of continuing and substantial re-duction in tax receipts.
From the start, outcomes were very different fromprogram targets. By August 1992, the full magnitude
104
116World Bank, 1996d, Vol. 1, Table 1.3.
Zimbabwe
of the drought was apparent: in the staff report GDPwas projected to decline in 1992 by 9 percent asagainst a program projection of a 4 percent increase.However, the longer-run projections became more op-timistic, so that for 1995 the anticipated fiscal deficitwas reduced from 4 percent to 3 percent. Thus, the ev-idence of program divergence was interpreted asbeing due entirely to the drought. The drought was sosevere that it was indeed not feasible to disentangle itseffects from those of the reform program so that therewere genuinely acute difficulties of monitoring pro-gram performance. By January 1994, following an in-crease in the deficit to about 12 percent, the deficit for1993/94 was projected to contract to 5 percent (itsoutturn was 8 percent). Government expenditure wasforecast to decline by 6 percentage points of GDP intwo years to reach 32 percent in 1995/96 (the outturnwas an increase of 3 percentage points to 41 percent).
By July 1994, staff reports began to sound a noteof warning on fiscal policy and delays in public en-terprise reform. It was stressed that budget deficitsled to high interest rates and thereby held back pri-vate investment. There appears to have been no con-cern about the distributional consequences of theprogram: implicitly, adverse effects were attributedto the drought.
Distributional Effects
As noted, during the 1980s, the government hadplaced considerable priority on redistribution. Thereform program potentially changed distributionaloutcomes through both its effect upon public servicedelivery and its effect on personal incomes.
The program agreed between the government andthe Fund discussed the likely social impact of policychange. The program was expected to result in percapita consumption growth of 1.5 percent perannum. These gains were expected to be “broadlyshared.” It was anticipated that some groups wouldsuffer from the program, but only relatively smallminorities. These were identified as those retrenched(implicitly from the public sector), those affected byprice decontrol, and those who would have to startpaying for health and education. A Social Develop-ment Fund was established to offset these effects. Itsstrategy was to offer pension and retraining arrange-ments for retrenched civil servants, to introducelabor-intensive public works, to support informal en-terprises, to finance rural resettlement, and to intro-duce a targeted food subsidy. Reflecting the modestscale of the problem envisaged, few resources weredevoted to the Social Development Fund.117 For ex-ample, the Social Development Fund allocation for
1993/94 was only Z$100 million. There were alsotargeting problems; a large number of eligiblehouseholds did not receive the benefits intended forthem and there was confusion about the definition ofthe targeted groups.118
The expectations proved to be a massive underes-timation of the social costs of the program. Muchhigher costs could reasonably have been anticipated.
Whereas the program envisaged that between1991 and 1996 per capita private consumptionwould rise by about 8 percent, in the event it de-clined by 37 percent.119 This alone transformed thegroup of those who lost from the reforms from a mi-nority to a majority. Further, the program failed torecognize that even had mean per capita consump-tion not declined, there would have been largegroups of losers after the large resource reallocationsthat would result from liberalizing such a highlycontrolled economy. The decontrol of manufacturingwas likely to lead to an initial phase of contraction.Combined with the deregulation of the labor market,it was therefore reasonable to anticipate that bothemployment and wages would decline quite sharplyin the manufacturing sector.
Public Service Delivery
Recall that to meet its fiscal objectives the govern-ment would have needed to reduce its noninterestexpenditures by 15 percentage points of GDP. In theevent, it reduced them by 7 percentage points. Be-cause the economy grew by only 12 percent between1990 and 1996, even this reduction implied a declinein absolute terms: growth was insufficient to offsetthe reduced share in GDP, so that noninterest expen-ditures fell by 9 percent in units of GDP.120 This iscorroborated by the national accounts: between 1990and 1996, government consumption (which excludesboth interest payments and capital expenditures) fellin units of GDP by 10 percent. However, this wasmade up of a large increase in the volume of govern-ment consumption, which was more than offset by alarge decrease in its unit price: the volume of gov-ernment consumption increased by 20 percent, withits unit price falling by 25 percent. The unit price fallreflected the reduction in public sector wages. In ef-fect, the government was employing more peoplebut paying them so much less that its expenditure
105
118See Chisvo and Munro, 1994, and Kaseke, 1993. 119This was partly because private consumption was atypically
high in 1991 as a result of import liberalization. If the base istaken as 1990, a normal year for private consumption, the declineis 26 percent.
120Recall that noninterest expenditures were initially 37 percentof GDP. The required reduction is therefore to 30 percent of thenew level of GDP, which was 1.12 times its initial level. Hence,the reduction is 37–[30(1.12)]/37 = 9 percent.
117In April 1993, Fund staff expressed concern about the slowimplementation of the Social Dimensions of Adjustment project.
IV COUNTRY PROFILES
fell in units of GDP. As we will see, the large diver-gence between changes in the volume and the valueof public consumption complicate statements aboutchanges in service delivery.
This pattern applied not only to government con-sumption in aggregate but also to its key social com-ponents. Between 1990/91 and 1995/96, healthspending (recurrent plus investment) declined as ashare of the budget from 6.4 percent to 4.3 percentand as a share of GDP from 3.1 percent to 2.1 per-cent.121 However, the unit cost of health services fellby one-third relative to GDP. As a consequence, thevolume of health services (public plus private) in-creased by 45 percent whereas its value in units ofGDP declined by 6 percent. Taking into account pop-ulation growth over the period, there was a substantialincrease in the volume of health services per capita,and a substantial decrease in the value of health ser-vices per capita. There are two reasons why, despitethe large volume increase in health services, theremay have been a reduction in health care delivery.First, the measures of volume used in the national ac-counts make no allowance for changes in quality. It ismost unlikely that quality would have remained con-stant when health workers suffered such large reduc-tions in real wages. The reductions in wages in thepublic health sector have led to many doctors leavingfor the private sector. Over 90 percent of the doctorsin rural areas are now non-Zimbabwean. Second,there was a shift from public to private provision. Thistended to make the service less accessible to thepoorer part of the population. The population cer-tainly received less valuable public health services: inper capita terms government health spending fell inunits of GDP by one-third. Nonwage spending has de-clined even more dramatically than wages, so thatshortages of drugs are becoming common. Health in-dicators are deteriorating rapidly.
There is no doubt that the previous trend of im-proving health outcomes was reversed during the pe-riod of the reform program. During the 1980s, healthoutcomes had improved remarkably. For example,the infant mortality rate declined from 100 to 50 be-tween 1980 and 1988 and life expectancy increasedfrom 56 to 64 years. Since then several health indi-cators have deteriorated. Between 1988 and 1994,wasting in children quadrupled and maternal mortal-ity rates appear to have increased. After many yearsof decline, the number of tuberculosis cases began torise in 1986 and by 1995 had quadrupled.
However, while health outcomes deteriorated dur-ing the phase in which the public health budget was
severely squeezed, it is not straightforward to at-tribute the former to the latter. This is because of therising problem of AIDS. Zimbabwe has amongst themost serious AIDS problems in the world with about30 percent of pregnant women and about 10 percentof newborn children now being HIV positive. AIDSalone will therefore soon account for an under-five-year-olds mortality rate of 100 per 1,000, whereas in1994 its rate from all causes was only 77.122 Thestunting and wasting evidence is consistent with thechild health problem being AIDS-driven: whilewasting quadrupled, stunting fell. Stunting reflectsthe long-run effects of food shortages, whereasAIDS often leads to wasting.
Hence, there have been four large changes in thehealth sector. First, the volume of health care servicesincreased by more than the population. Second, thevalue of these services decreased very substantially,so that quality is likely to have deteriorated. Third, thedemand for health care increased dramatically be-cause of the rising incidence of AIDS. Fourth, healthoutcomes deteriorated whereas they had previouslybeen improving. Unfortunately, the attribution of thedeterioration in outcomes as between AIDS and qual-ity deterioration is not possible. What is, however, ev-ident is that during a period in which the demand forhealth care was rising enormously and predictably,the resources devoted to public health care were dra-matically reduced. Given the present unit cost of treat-ing AIDS patients, the total cost of treating those al-ready infected will be four times the present annualhealth budget.123
Education was given a very high priority by thegovernment. During the 1980s, there was a remark-able increase in educational attainments. During the1990s, as with health, education services increasedin volume but decreased in value in units of GDP.Between 1990 and 1996, the volume of educationservices increased by 7 percent and their unit pricein terms of GDP declined by one-fourth. However,unlike in health care, the volume increase was insuf-ficient to keep up with population growth so that theper capita volume of services declined. While teach-ers’ salaries declined by about one-third in realterms, their quality appears not to have declined un-like in health. Student-teacher ratios were main-tained and the proportion of qualified teachers actu-ally increased, both for primary and secondaryschools. Educational outcomes provide a mixed pic-ture: O-level pass rates increased, but completionrates for primary schools fell slightly. In effect, thegovernment managed to pass on the effects of its ex-penditure reductions in education to teachers ratherthan to children.
106
122World Bank, 1996d.123World Bank, 1996c, p. 64.
121World Bank, 1996d, Vol. 2, Annex 3. There are now indica-tions that data revisions may change this picture, so that the de-cline shown in the Public Expenditure Review may turn out to bespurious.
Zimbabwe
IncomesThe deregulation of the labor market together with
the reduced protection of manufacturing and the re-duction in public expenditure produced a severesqueeze in the labor market. Both employment andreal wages declined sharply. During 1991–96, for-mal sector employment in manufacturing fell by 9percent and real wages declined by 26 percent. Inpublic administration employment declined by 23percent and real wages fell by 40 percent.
At the same time, agriculture benefited both fromexchange rate adjustment and marketing deregula-tion. One indicator of this is that the implicit GDPdeflator for agriculture increased by 15 percent rela-tive to the aggregate GDP deflator between 1990 and1996. These developments led to large changes inincome distribution.
The major redistribution in the economy was fromformal sector wage earners to farmers. This can beseen from the national accounts, which show theshare of wages and salaries in gross national incomedeclining from 51 percent in 1990 to 35 percent in1996. During the same period, the share of unincor-porated gross operating surplus (a category that isdominated by the incomes of small farmers) rosefrom 20 percent to 32 percent: farmers gained al-most all the share that wage earners lost.
Unfortunately, there are no nationwide panel sur-vey data available to assess changes in rural incomes.However, panel data are available for an interestingand important subset, the “resettlement farmers.”This group consisted originally of landless poor whowere given land by the government shortly after in-dependence. Income data for a sample of thesehouseholds who have been followed since their reset-tlement are shown in Table 16.124 The interpretation
of this series is complicated by the fact that two outof the four years for which data are shown aredrought years. Two points stand out. First, rural in-comes are extremely vulnerable to climatic shocks.The very large income drop shown for 1994/95shows that the effect of drought is so large that itswamps any effect of structural adjustment. Second,the resettlement farmers have realized rapid growthand this was maintained through the period of adjust-ment.125 This group is certainly not representative forthe rural population: it is much better able to handleshocks, having built up assets for consumptionsmoothing. In this case, the resettlement policy, initi-ated almost a decade before structural adjustmentstarted, may well have been more effective in pro-tecting the poor than the short-run, targeted policiesadopted in the context of structural adjustment.
Recall that, overall, per capita private consumptiondeclined by 26 percent between 1990 and 1996. Sincethe share of small farmers in national income rose by60 percent, if their consumption had tracked theirfarm income then their per capita consumption wouldhave risen by around 18 percent. However, there aretwo reason to expect that consumption will not havetracked farm income. First, as of 1990, remittancesamounted to some 12 percent of consumption in ruralhouseholds (CSO, 1994, Tables 3.1 and 3.5). Much ofthese were probably from wage earners in urban areasand would have fallen, probably in percentage terms,by more than the decline in urban wages themselves.Second, food prices rose by about 36 percent relativeto overall consumer prices. Rural households have al-most double the share of food in their consumption
107
Table 16. Zimbabwe: Changes in Real Income per Household(Baseline and three most recent growing seasons)
Number of Mean Income1 Coefficient of Minimum–Growing Season Households (in 1990 Z$) Variation Maximum
Source: Kinney, 1997, Table 10.1Income is defined as the sum of the market value of crops harvested, revenue from the sales of livestock and livestock products and services, remit-
tances and income from off-farm or nonagricultural employment. Excluded are other transfers, aid, and drought relief.2Season was badly affected by drought; rainfall was less than two-thirds of the long-term mean.3Season was drought-affected; rainfall was some 80 percent of the long-term mean.4Season was normal; rainfall was within 1 percent of the long-term mean.
125Comparing the endpoints in Table 15 overstates the pointsince the first year was a drought year. However, other evidence,in particular the rapid accumulation of assets (mainly livestock)over this period, supports the conclusion of rapid growth. SeeKinsey, Burger, and Gunning, 1998.
124We are grateful to Bill Kinsey for making these unpublisheddata available to us.
IV COUNTRY PROFILES
bundle that urban households do. The increase in therelative price of food thus raises both the income andthe cost of expenditure of rural households. The for-mer is picked up in the rising income share of ruralhouseholds but exaggerates the increase in their wel-fare. The rise in the price of food raised the cost of liv-ing of rural households by 7 percent relative to that ofurban households.
Despite this differential change in the cost of liv-ing, it is evident that there was a large redistributionfrom urban wage earners to rural households. Thiswas a progressive redistribution because as of 1990urban households had been considerably better off:mean per capita consumption of urban householdswas some 3.6 times that in rural households.126
A second but much smaller redistribution was be-tween private sector nonfinancial companies and thefinancial sector. Over the same period, the share ofthe former declined from 14.5 percent to 13.5 percentwhile that of the latter increased from 4.6 percent to5.9 percent. In addition, there is anecdotal evidencethat within the private sector nonfinancial compa-nies, agriculture gained while manufacturing lost.
Against the large reductions in the mean level ofconsumption and the large changes in distribution,the government’s targeted programs for offsettingsocial costs were liable to prove inadequate. Anevaluation indeed found them ineffective: there weredelays in getting the program started, overcentraliza-tion, reliance upon an already overworked staff, in-adequate funding, urban bias, and poor targeting.
Summary of ESAF Developments
The social impact of ESAF in Zimbabwe to datehas been considerable. During the period, averageprivate consumption levels have declined by aboutone-fourth. There has been a powerful redistributionfrom urban wage earners to the rural population, tothe extent that consumption levels of rural house-holds may have been fully protected and indeed mayeven have risen a little. Conversely, urban house-holds have suffered severely: there are fewer jobsand real wages are very much lower. In addition tothese changes in private incomes, household welfarehas also been affected by the decline in public ex-penditures on social services. The brunt of the fall inthese expenditures has been borne by those workingin the social services. However, the reductions intheir real wages are likely to have resulted in reduc-tions in service quality. There is some evidence that
this was much more pronounced in health care thanin education.
In describing these large changes we have com-pared snapshots of the economy around 1990 and1996. These changes owe little to the interveningdroughts and were consequently reasonably pre-dictable by economic analysis. As with other struc-tural adjustment programs, the ESAF involved rela-tive price changes in favor of agriculture and at theexpense of the formerly protected urban sector. How-ever, unlike most other African adjusters, Zimbabwehad a very large industrial sector producing not onlyfinal goods but also intermediate goods. In this way,it resembled the transition economies. As in the tran-sition economies, liberalization inflicted an initialphase of contraction: the manufacturing sector, ac-counting for over one-fourth of the economy, hascontracted by 14 percent. The analysis underlying theprogram design did not take either of these featuresinto account. It therefore radically underestimated thesocial consequences of the program.
In addition to this neglect of the likely social im-pact, the program was remarkably ambitious in itsfiscal objectives. The share of noninterest govern-ment expenditures in GDP would have needed to fallby 40 percent over a period of six years. The govern-ment could only have achieved this by expenditurecuts, which would have massively compounded thenegative social impact on the urban population notedabove. This implication of the fiscal objectives wasnot recognized.
The core political achievement of the governmenthad been a redistribution in favor of the indigenouspopulation. In our view, the program as designed wasmanifestly politically unsustainable since it wouldhave required the government to dismantle these dis-tribution achievements. The program indeed provedunsustainable, in that although there was sufficientpolitical will to persist with the structural policy re-forms, the envisaged fiscal adjustments were onlypartially attained. This in turn inflicted considerabledamage on the economy. The fiscal crises that char-acterized the period caused both high and volatile in-terest rates and a climate of policy uncertainty, whichpresumably reduced private investment.
This political unsustainability could have beenavoided. The financial and tax reduction liberaliza-tion, which were fiscally very costly, should havebeen sequenced after the politically difficult expendi-ture reductions coming from parastatal reform andpublic employment reductions. This would have obvi-ated the need for reductions in per capita expenditureson health and education. It would also have acceler-ated the recovery of employment in manufacturingand reduced the decline in real wages, which waspartly driven by high inflation. Some of the socialhardship was doubtless unavoidable, as in other tran-
108
126Calculated from CSO, 1994. Table 3.6(a) gives mean house-hold figures. Per capita figures were estimated using the house-hold size information in Table 2.2, assuming a mean householdsize of 12 for households with nine people or more. The compari-son makes no allowance for differences in the cost of living.
Zimbabwe
sition economies. However, because the scale of thecosts in urban areas was radically underestimated, thesafety net operations put in place were inadequate.Further, the social hardship was avoidably severe be-cause of poor program design. The drought made itmore difficult to recognize the design error and obvi-ously added to the social costs.
The design of the program originated with thegovernment. The role of the Fund in design was lim-ited. However, some responsibility must be taken bythe Fund for supporting the government in a fiscalstrategy that was clearly implausible.
Scope of Political Support
Although some of the literature portrays Zim-babwe as a repressive one-party state in which deci-sions are taken centrally and handed down withoutdiscussion,127 the reality bears closer resemblance towhat has been called a system of “societal corpo-ratism,” which in fact permits fairly active democra-tic participation and in which, therefore, competingpolitical groupings operate to exert considerable in-fluence on government policy.128 Consequently, thefailure to factor in an appropriate measure of consen-sus building was a particularly grave miscalculation.
Two phases in the program period may be distin-guished in a general assessment of the scope ofgovernment and national support for the program,the first covering roughly the first year of the pro-gram through 1993, and the second covering theensuing period right through 1995 when the pro-gram was interrupted.
From the very beginning of the program, therewere naturally forces within the government andparty leadership that opposed the program. This isnormal in politics. What distinguished the Zim-babwe situation, however, was the extent of polar-ization and the strong ideological lines that markedthe divide129—on the one side, those committed tomarket-based reforms and economic liberalization,and on the other, those committed to a socialist strat-egy of development. The former included Dr.Chidzero, senior minister responsible for finance,who was the leading proponent of reform, ReserveBank officials, and technical officials of the eco-nomic ministries in the main. The latter group of an-timarket reformers, in Zimbabwe’s case, were notthe bunch of slogan-mongering ideologues that oneoften finds in these situations but trained and com-mitted intellectuals, including the president himselfand other senior members of the party leadership,
who simply did not share the reformers’ belief in theefficacy of the market. They were open to debateand were not given to mere polemical denunciation.This is an important distinction to bear in mind, forit explains how and why the reform program came tobe adopted at all, given the polarization in ideologi-cal positions in the leadership, and provides a foun-dation not only for the Fund’s continuing relation-ship with Zimbabwe in the long run but also forresolving in the near term the lingering stalemate inits relations with Zimbabwe.
In the first phase of the program period, the propo-nents of reform clearly dominated the government po-sition. By mid-1989, President Mugabe had been per-suaded that a change in policy was necessary if fastereconomic growth was to be achieved. As we havenoted, this was, in our view, a correct position giventhat the export sector was weighed down by the con-trol regime while the only other dynamic sector of theeconomy, the public sector, had become fiscally con-strained. The government also, at this time, showed awillingness to discuss major structural issues. Thisshift in the policy stance was aided by the WorldBank’s comprehensive study on the Zimbabwe econ-omy, issued in 1987, which formed the basis for wide-ranging discussion between the government and theBank, as well as by studies conducted by foreign con-sultants at the government’s request.
But by far the most critical link in the chain of gov-ernment commitment was undoubtedly the personalrole of the Senior Minister of Finance, Dr. Chidzero.Indeed, the fragility of government commitment to theprogram resided in the fact that it hinged much toocrucially on his personal role. The result, as a numberof staff documents point out, was that whenever Dr.Chidzero was not available for discussions with Fundmissions, the government appeared rather unpreparedand unable to present a credible and consistent view-point. For instance, a 1993 internal IMF documentnotes that “the authorities did not clearly state their po-sition with regard to exchange rate reform, partly be-cause of the imminent departure of both the Governorof the Reserve Bank and the Senior Secretary of theFinance Ministry. This also contributed to a slow startto the discussions and an initial lack of preparedness ofofficials to discuss the issues.” Again, in 1993, a mis-sion reported that “in the absence of Senior Minister ofFinance Chidzero during the last week of discussionsin Harare, the authority’s position with respect to someof the accompanying measures remained unclear.”
But the weakening of government’s commitmentfrom 1993 amid a general stiffening of oppositionwithin government to the reform program was notattributable entirely, or perhaps even mainly, to Dr.Chidzero’s deteriorating health and his consequentinability to participate as fully in meetings withFund missions.
109
127Mukonoweshuro, 1992.128Skålnes, 1995.129Skålnes, 1995, p. 132.
IV COUNTRY PROFILES
The more fundamental point is that, clearly, notenough had been done to create a sufficiently strongand broad-based fund of support for the program,given the drastic fiscal adjustment that it entailed. In-deed, in a situation of such widespread and often vio-lent protest, such as prevailed in 1993, it is doubtfulthat Dr. Chidzero could have done much by himself atthat stage to turn the tide. In 1992, students at the Na-tional University embarked on violent demonstrationsand boycotted classes to back demands for increasesin student grants to offset rising costs resulting fromdevaluation and inflation. More ominously, in 1993, awave of bread riots shook the lower income suburbsof Harare as demonstrators smashed bakeries and en-gaged in widespread looting to protest recently an-nounced price increases for bread and flour.
At the same time, although in the initial stages ofthe reform, some important business groups hadstrongly supported trade liberalization measures de-spite the increasing competition it was to entail—andthis is true especially of the Engineering Employers’Association and the Confederation of ZimbabweanIndustries—the private sector’s support for, and com-mitment to, the program had by 1993 loosened con-siderably, partly as a perfectly understandable reac-tion to the steady erosion of the substantial regime ofprotection to which they had long become accus-tomed, and also partly as a result of a breach in thechannels of communication and dialogue with gov-ernment resulting from the sudden death of the Minis-ter of Commerce and Industry, Chris Ushewokunze,who, together with Bernard Chidzero, had been themain proponents of market reforms. Interestingly,Ushewokunze’s position was to remain vacant untilafter the elections in April 1995.
Increasing pressure from business groups, towhich Fund reports make references from 1992, pre-dictably led to a slackening of the program of importliberalization with the granting of additional tariffprotection to a number of industries, including themotor, textiles, clothing, and shoe industries.130
These gestures of accommodation failed to restorebusiness confidence in the reforms, however. As lateas 1996, Fund reports were noting that the govern-ment’s policymaking processes were characterizedby “inadequate consultation with the private sectorand social partners,” a view that was also expressedin interviews with officials of the Confederation ofZimbabwean Industries.
Political support for the program was furthershaken by increasing agitation among civil servantsagainst retrenchment and other civil service reforms.In the midst of a general recession in the economyand widespread unemployment, the government hadby June 1993 abolished over 10,000 civil service po-
sitions and reduced the number of ministries from 27to 22—results that Fund missions found “disappoint-ing” even as they acknowledged that the slippages incompliance were attributable to “the government’sconcerns about aggravating unemployment and so-cial dislocation at a time of severe economic down-turn and contraction by private employers.”
Rising calls for indigenization also underminedthe pace of implementation of the privatization pro-gram and by implication, the fiscal program. Whilethe Fund and, the Ministry of Finance saw privatiza-tion as a critical means of raising funds for bud-getary support in a bid to reduce costly bank financ-ing, the advocates of privatization—a policy that thepresident himself favored—saw privatization as ameans of promoting indigenous ownership of pro-ductive assets, a political objective whose impor-tance the Fund’s 1996 country study paper explicitlyacknowledges evidently only in word.
As the pressures mounted, the government beganto perceive the Fund’s continuing counseling of fis-cal restraint and public sector retrenchment as po-litically insensitive. In 1994, in a speech given tothe South African Parliament in Cape Town, thepresident reportedly called for a democratization ofthe Fund and accused the Bretton Woods institu-tions of “financial imperialism” and “dictatorship.”In 1995, he was also reported as speaking of “dis-astrous” reforms imposed by the World Bank andthe Fund and adding ominously “we are wiser thanwe were three years ago and we will not listenwilly-nilly to what the international institutionswill tell us to do.”131
Ownership Issues
Zimbabwe is, in our view, a classic case of a rea-sonably strong national commitment to reform gonesour from economic and political miscalculation inthe sequencing of economic reforms. As we have al-ready noted, the tremendous fiscal crunch and thedrastic reduction in social expenditures that the pro-gram objectives entailed made the task of consensusbuilding difficult enough. In the event, the politicaleconomy of the program was further strained by afailure to deepen support for the program withingovernment itself and, more important, a failure tobroaden its scope to cover the highly politicizedranks of the political parties, especially the rulingparty and civil society at large.
In general, however, given the tremendous socialcosts of the program thus far, the government’scommitment to the reform has been reasonable.The major structural reforms have now largelybeen implemented.
110
130Skålnes, 1995, p. 144. 131Africa Research Bulletin, 1995, p. 12018.
APPEN
DIX
Table A1
111
Table A1. Comparative Analysis for External Viability: Pre- and Mid- and Post-ESAF(In percent)
Ratio of DebtDebt-Service Ratio1 Service to GDP2 Debt-Export Ratio3 Debt-GDP Ratio4 Real External Debt Burden5 Debt Deepening Index7________________________ _______________________ ________________________ _______________________ ______________________________________________ ______________________________
Pre- Mid- and Pre- Mid- and Pre- Mid- and Pre- Mid- and Pre- r = 8 Mid- and r = 8 Pre- Mid- andESAF Post-ESAF ESAF Post-ESAF ESAF Post-ESAF ESAF Post-ESAF ESAF percent6 Post-ESAF percent6 ESAF Post-ESAF
Sources: Authors’ calculations based upon IMF, International Financial Statistics, and internal Fund documents; and on World Bank, World Debt Tables and Global Development Finance.1Debt-service ratio = (interest payment + principal repayment) / export.2Ratio of debt service to GDP = (interest payment + principal repayment) / GDP.3Debt-export ratio = debt stock / exports.4Debt-GDP ratio = debt stock / GDP.5Real external debt burden = (real interest rate – growth rate of GDP) * debt stock / GDP.6Obsfeld (1996) uses a real interest rate of 8 percent, and states that the rate of return on equities is probably a better approximation.7Debt deepening index = (real interest rate – growth rate of GDP) * debt stock /GDP + current account deficit excluding interest payment / GDP.
APPEN
DIX
112
Table A2. Bangladesh: SAF I–III (1986/87–1989/90)
GDP Exchange Rate Real GDP Trade Trade__________________(billions of (national GDP Nominal (billions of Exports Balance Balance/ Current Account_________________national currency/ (millions of GDP national (percentage (millions (millions of GDP (excluding
Sources: IMF, International Financial Statistics, and Recent Economic Developments, various issues; and World Bank, World Debt Tables, 1989–90, and Global Development Finance, 1997.1Real External Debt Burden = (r–g)D/Y, where r = 8%.2Real External Debt Burden = (r–g)D/Y, where r = interest payment /debt.3Debt Deepening Index = (r–g)D/Y + noninterest current account deficit/Y.
APPEN
DIX
114
Table A3.Vietnam: ESAF I (1994–95)
GDP Exchange Rate Real GDP Trade Trade__________________(billions of (national GDP Nominal (billions of Exports Balance Balance/ Current Account_________________national currency/ (millions of GDP national (percentage (millions (millions of GDP (excluding
Sources: IMF, Recent Economic Developments, various issues, and Debt Relief for Low-Income Countries, 1997; and World Bank, Global Development Finance, 1997.1Real External Debt Burden = (r–g)D/Y, where r = 8.2Real External Debt Burden = (r–g)D/Y, where r = interest payment/debt.3Debt Deepening Index = (r–g)D/Y + noninterest current account deficit/Y.
APPEN
DIX
116
Table A4. Côte d’Ivoire: ESAF I–II (1994–96)
TradeGDP Exchange Rate Real GDP Trade Current Account___________________ Balance/ __________________
(billions of (national GDP Nominal (billions of Exports Balance GDP (excluding___________________national currency/ (millions of GDP national (percentage (millions (percentage (millions (percentage interest (percentage
currency) dollars) dollars) (percent) currency) change) of dollars) change) of dollars) change) payments) change)
NPV toDebt Service–GDP–R Debt–Exports Exports REDB1 REDB2 DDI3___________________ ___________________ __________________ __________________ _____________________(percent) Average (percent) Average ratio (percent) Average (percent) Average (percent) Average
Sources: IMF, International Financial Statistics (IFS), and Debt Relief for Low-Income Countries, 1997; and World Bank, Global Development Finance, 1997, and World Debt Tables, 1989–90.1Real External Debt Burden = (r–g)D/Y, where r = 8.2Real External Debt Burden = (r–g)D/Y, where r = interest payment/debt.3Debt Deepening Index = (r–g)D/Y + noninterest current accout deficit/Y.
APPEN
DIX
118
Table A5. Malawi: ESAF I–III (1988–94)
GDP Exchange Real GDP Trade Trade__________________(billions of Rate (national GDP Nominal (billions of Exports Balance Balance/ Current Account_________________national currency/ (millions of GDP national (millions (millions of GDP (excluding
Sources: IMF, International Financial Statistics, Recent Economic Developments; and World Bank, Global Development Finance, 1997, and World Debt Tables, 1989–90.1Real External Debt Burden = (r–g)D/Y, where r = 8.2Real External Debt Burden = (r–g)D/Y, where r = interest payment/debt.3Debt Deepening Index = (r–g)D/Y + noninterest current account deficit/Y.
APPEN
DIX
120
Table A6. Uganda: SAF I–II (1987–1989), ESAF I–IV (1989–94)
GDP Exchange Rate Real GDP Current Account___________________ __________________(billions of (national GDP Nominal (billions of Exports Trade Balance (excluding___________________ ___________________national currency/ (millions of GDP national (millions of (millions of interest (percentage
Sources: IMF, International Financial Statistics, and Debt Relief for Low–Income Countries, 1997; and World Bank, Global Development Finance, 1997, and World Debt Tables, 1989–90.1Real External Debt Burden = (r–g)D/Y, where r = 8.2Real External Debt Burden = (r–g)D/Y, where r = interest payment/debt.3Debt Deepening Index = (r–g)D/Y + noninterest current account deficit/Y.
APPEN
DIX
122
Table A7. Zimbabwe: ESAF I–II (1992–94)
GDP Exchange Real GDP Trade Trade__________________(billions of Rate (national GDP Nominal (billions of Exports Balance Balance/ Current Account_________________national currency/ (millions of GDP national (millions (millions of GDP (excluding
Sources: IMF, International Financial Statistics, and Debt Relief for Low-Income Countries, 1997; and World Bank, Global Development Finance, 1997, and World Debt Tables, 1989–90.1Real External Debt Burden = (r–g)D/Y, where r = 8.2Real External Debt Burden = (r–g)D/Y, where r = interest payment/debt.3Debt Deepening Index = (r–g)D/Y + noninterest current account deficit/Y.
Figure A4. Real External Debt Burden Versus Debt Deepening Index(Mid- and Post-ESAF)
Bibliography
126
Adam, C.S., 1995, “Fiscal Adjustment, Financial Liberal-ization and the Dynamics of Inflation: Some Evi-dence from Zambia,” World Development, Vol. 23(May), pp. 735–750.
Africa Research Bulletin: Economic, Financial, and Tech-nical Series, 1995, Vol. 32 (January 16–February 15).
Bade, Albert, 1996, Benedicto Kiwanuka: The Man andHis Politics (Kampala: Fountain Publishers).
Bangladesh, Bureau of Statistics, 1996, Statistical Year-book of Bangladesh (Dhaka, Bangladesh: Bureau ofStatistics, 16th ed.).
Bangladesh, Bureau of Statistics, 1997, Monthly StatisticalBulletin (Dhaka, Bangladesh: Bureau of Statistics).
Barro, Robert J., and Xavier Sala-i-Martin, 1995, Eco-nomic Growth (New York: McGraw-Hill).
Baxter, Marianne, 1992, “Fiscal Policy, Specialization,and Trade in the Two-Sector Model: The Return ofRicardo?” Journal of Political Economy, Vol. 100(August), pp. 713–44.
Berthelemy, Jean Claude, and François Bourguignon,1996, Growth and Crisis in Côte d’Ivoire (Washing-ton: World Bank).
Bigsten, A., and S. Kayizzi-Mugerwa, forthcoming, Eco-nomic Development in Uganda, 1960–90 (London:Macmillan).
Blanchard, Olivier Jean, and Stanley S. Fischer, 1989,Lectures on Macroeconomics (Cambridge, Massa-chusetts: MIT Press).
Bloch, Eric, 1996, Zimbabwe: Facing the Facts: An Eco-nomic Dialogue Between Eric Bloch and John Robert-son (Harare, Zimbabwe: Thomson Publications).
Bodart, Vincent, and Jean Le Dem, 1995, “Labor MarketRepresentation in Quantitative Macroeconomic Mod-els for Developing Countries: An Application to Côted’Ivoire,” IMF Working Paper 95/87 (Washington:International Monetary Fund).
Boote, Anthony R., and Kamau Thugg, 1997, Debt Relieffor Low-Income Countries: The HIPC Initiative,IMF Pamphlet Series, No. 51 (Washington: Interna-tional Monetary Fund).
Botchwey, Kwesi, 1996, “Obstacles to Continued Reform:An African Perspective,” in Developing Structural Re-form in Africa: Lessons from East Asia, ed. by LauraWallace (Washington: International Monetary Fund).
Burnside, Craig, and Daniel Dollar, 1997, “Aid, Policies,and Growth,” Policy Research Working Paper No.1777 (Washington: World Bank).
Business Africa, various issues (London, Economist Intel-ligence Unit).
Castro-Leal, Florencia, 1996, “Who Benefits from PublicEducation Spending in Malawi?” World Bank Dis-cussion Paper No. 350 (Washington: World Bank).
Centre Ivoirien des Recherches Economiques et Sociales(CIRES), 1995, “Les strategies d’adaptation socialedes populations vulnerables d’Abidjan face a la de-valuation et ses effets” (Abidjan, Côte d’Ivoire:CIRES).
Chipeta, Chinyamata, 1992, “Economic Policy Frame-work,” in Malawi at the Crossroads: The Post-Colo-nial Political Economy, ed. by Guy Z. Mhone(Harare, Zimbabwe: Sapes Books), pp. 90–134.
———, 1992, “Political Process, Civil Society and theState,” in Malawi at the Crossroads: The Post-Colo-nial Political Economy, ed. by Guy Z. Mhone(Harare, Zimbabwe: SAPES Books), pp. 34–49.
Chisvo, Munhama, and Lauchlan T. Munro, 1994, A Re-view of Social Dimensions of Adjustment in Zim-babwe, 1990–94 (Harare, Zimbabwe: UNICEF).
CIET International, 1996, “Baseline Service Delivery Sur-vey in Support of Results-Oriented Management inthe Uganda Institutional Capacity Building Project,”report for UNICEF.
Cohen, Daniel, 1985, “How to Evaluate the Solvency ofan Indebted Nation,” Economic Policy, Vol. 1 (No-vember), pp. 139–67.
———, 1996, “Sustainability of African Debt,” PolicyResearch Working Paper No. 1621 (Washington:World Bank).
Collier, Paul, 1994, “Demobilization and Insecurity: AStudy in the Economics of the Transition from War toPeace,” Journal of International Development, Vol. 6(May–June), pp. 343–51.
Daily Star, Dhaka, October 7, 1997, pp. 1, 12. Davies, Robert, 1996, Uganda Case Study (London: British
Library Research and Development Department).
Bibliography
127
Demery, L., J. Dayton, and K. Mehra, 1997, “The Inci-dence of Social Spending in Côte d’Ivoire,1986–95” (unpublished; Washington: World Bank).
Dodsworth, John R., and others, 1996, Vietnam: Transi-tion to a Market Economy, (Washington: Interna-tional Monetary Fund).
Doob, L.W., 1960, Becoming More Civilized: A Psycho-logical Exploration (New Haven, Connecticut: YaleUniversity Press).
Dung, Nguyen Tri, 1997, “Lawmakers prepare for thetough times to come,” Vietnam Investment Review,September 29–October 5, p. 2.
Economic Intelligence Unit, 1981, Zimbabwe’s FirstFive Years: Economic Prospects Following Indepen-dence, EIU Special Report No. 111 (London: Eco-nomic Intelligence Unit).
Economic Policy Research Centre, and ManagementSystems and Economic Consultants Ltd., 1996,“Tracking of Public Expenditure on Primary Educa-tion and Primary Health Care” (Kampala, Uganda:Economic Policy Research Centre, June).
Fallon, Peter, and Robert E.B. Lucas, 1993, “Job Security Regulations and the Dynamic Demand for Industrial Labor in India and Zimbabwe,” Jour-nal of Development Economics, Vol. 40, pp. 241–75.
Foster, 1993, “Cost and Burden of AIDS in the ZambianHealth Care System,” cited in Capacity Building forEconomic Development in Zambia: Challenges andProspects,” by Olivier S. Saasa and others, consul-tancy study for the World Bank (Washington: WorldBank, 1996).
Ghosh, Atish R., 1995, “International Capital MobilityAmongst the Major Industrialized Countries: TooLittle or Too Much?” Economic Journal, Vol. 105(January), pp. 107–128.
Goreux, Louis M., 1995, “La Dévaluation du Franc CFAun premier bilan, en Décembre 1995” (Washington:World Bank).
Grieve, Roy H., and M. Mozammed Huq, 1995,Bangladesh: Strategies for Development (Dhaka,Bangladesh: University Press).
Grootaert, Christiaan, 1997, “The Determinants ofPoverty in Côte d’Ivoire in the 1980s,” Journal ofAfrican Economies, Vol. 6 (July), pp. 169–96.
Hamada, K., 1966, “Economic Growth and Long-Term International Capital Movements,” Yale EconomicEssays, Vol. 6 (1), pp. 49–96.
Haque, Nadeem Ul, M. Nelson, and Donald J. Math-ieson, forthcoming, “Creditworthiness Ratings:Their Political and Economic Content,” in Risk andAgencies of Restraint: Reducing the Risks of AfricanInvestment, ed. by Paul Collier and Catherine Patillo(London: Macmillan).
Harvie, Charles, 1997, Vietnam’s Reforms and EconomicGrowth (Basingstoke: Macmillan).
Harvey, Charles, and Mark Robinson, 1995, EconomicReform and Political Liberalization in Uganda IDSResearch Report (Brighton, United Kingdom: Insti-tute of Development Studies).
Helleiner, G.K., forthcoming, “External Conditionality,Local Ownership and Development,” TransformingDevelopment, ed. by Jim Freedman (Toronto: Uni-versity of Toronto Press).
Hicks, Ronald, and Odd Per Brekk, 1991, “Assessing theImpact of Structural Adjustment on the Poor: TheCase of Malawi,” IMF Working Paper 91/112 (Wash-ington: International Monetary Fund).
International Monetary Fund, 1997, The ESAF at TenYears: Economic Adjustment and Reform in Low-In-come Countries (Washington: IMF, December).
———, various issues, International Financial Statistics,(Washington: IMF).
———, Recent Economic Developments, various countries. Jenkins, C., and J. Knight, 1997, “Post-Independence Eco-
nomic Policies and Outcomes in Zimbabwe: Lessonsfor South Africa” (unpublished; Oxford: Centre forthe Study of African Economies).
Kadenga, P.A., H. Ndoro, B.M. Zwizwai, 1992, Zim-babwe’s Structural Adjustment Programme: The FirstYear Experience (Harare, Zimbabwe: SAPES Books).
Kamkondo, W.C., P.G. Dede, and K. Wellard, 1994,“Women and Children in the Smallholder and EstateSub-Sectors in Malawi,” Rural Development (Li-longwe, Malawi: Bunda College of Agriculture).
Kaseke, Edwin, 1993, “A Situation Analysis of the SocialDevelopment Fund” (Harare, Zimbabwe: Ministry ofPublic Service, Labour, and Social Welfare, andUNICEF).
Kaunda, Jonathan, 1992, “The Administrative Organisa-tion and Processes of National Development Planningin Malawi,” in Malawi at the Crossroads: The Post-Colonial Political Economy, ed. by Guy Z. Mhone(Harare, Zimbabwe: SAPES Books), pp. 50–89.
Kerkvliet, Benedict J. Tria, and Doug J. Porter, 1995, Viet-nam’s Rural Transformation (Singapore: Institute ofSouth-East Asian Studies).
Kinsey, Bill H., 1997, “Growth-Friendly Poverty Reduc-tion? Long-Term, Household-Level Outcomes ofLand Reform in Zimbabwe,” paper presented at theDevelopment Studies Association Conference, Sep-tember 11–13, 1997, Norwich, United Kingdom.
———, Kees Burger, and Jan-Willem Gunning, forth-coming, “Coping with Drought in Zimbabwe: SurveyEvidence of Responses on Rural Households toRisk,” World Development.
Kwesigabo, Johnson Dan Segyendwa, 1990, Uganda atthe Crossroads: The Dilemma of Choice of Develop-ment Strategy in a Third World Country.
Malawi, Monthly Statistical Bulletin, various issues. ———, National Sample Survey of Agriculture (NSSA),
various issues.———, 1991, HESSEA Survey of 1990/91 (Lilongwe,
Malawi: Government Printers).———, Monthly Statistical Bulletin, various issues.———, Social Indicators Survey, various issues.———, Statistical Yearbook, various issues.Marande, F., and K. Schmidt-Hebbel, 1994, “Zimbabwe:
Fiscal Disequilibria and Low Growth,” in Public Sec-tor Deficits and Macroeconomic Performance, ed. byWilliam Easterly and others (New York: Oxford Uni-versity Press).
McIntire, J., 1997, “Welfare Effects of Ivoirien Cocoa Ex-port Tax and Marketing Policy” (unpublished; Wash-ington: World Bank).
BIBLIOGRAPHY
128
Mhone, Guy, 1992, “The Political Economy of Malawi:An Overview,” in Malawi at the Crossroads: ThePost-Colonial Political Economy, ed. by Guy Z. Mhone (Harare, Zimbabwe: SAPES Books), pp. 1–33.
Milesi-Ferretti, Gian Maria, and Assaf Razin, 1996, Cur-rent-Account Sustainability, Princeton Studies in In-ternational Finance, No. 81 (Princeton, New Jersey:Princeton University, Department of Economics, In-ternational Finance Section).
Moyo, Sam, and Tor Skålnes, 1990, Zimbabwe’s Land Re-form and Development Strategy: State Autonomy,Class Bias and Economic Rationality, Research PaperNo. 3 (Harare, Zimbabwe: Zimbabwe Institute of De-velopment Studies).
Mtewa, Mekki, 1986, Malawi Democratic Theory and Pub-lic Policy (Cambridge, Massachusetts: Schenkman).
Mukonoweshuro, Elipha G., 1992, Zimbabwe: Ten Yearsof Destabilization: A Balance Sheet (Stockholm,Sweden: Bethany Books).
Neube, M., and others, 1997, “Trade Liberalisation inZimbabwe,” in Regional Integration and Trade Lib-eralisation in Sub-Saharan Africa: Vol. 2: CountryCase Studies, ed. by Ademola Oyejide, B. Ndulu, andJ.W. Gunning (London: Macmillan).
New African, various issues.OECD, 1996, Shaping the 21st Century: The Contribution
of Development Co-operation (Paris: OECD, May). ———, 1997, Final Report of the Ad Hoc Working Group
on Participatory Development and Good Governance(Paris: OECD).
Obstfeld, Maurice, and Kenneth Rogoff, 1996, Founda-tions of International Macroeconomics (Cambridge,Massachusetts: MIT Press).
Ohno, K., and I. Ohno, 1993, IMF to Sekai Ginko (IMFand the World Bank) (Tokyo: Nihon Hyoron-sha).
Okoth, P. Godfrey, Manuel J.K. Muranga, and ErnestOkello Ogwang, eds., 1995, Uganda: A Century ofExistence (Kampala: Fountain Publishers).
Onitsuka, Y., 1974, “International Capital Movements andthe Pattern of Economic Growth,” American Eco-nomic Review, Vol. 64, pp. 24–26.
Pryor, Frederic L., 1990, The Political Economy ofPoverty, Equity, and Growth: Malawi and Madagas-car (Oxford: Oxford University Press).
Quibria, Muhammad Ghulam, 1997, The BangladeshEconomy in Transition (New York: Oxford Univer-sity Press).
Rodrik, Dani, 1995, “Why Is There Multilateral Lend-ing?” in Annual World Bank Conference on Develop-ment Economics, 1995, ed. by Michael Bruno andBoris Pleskovic (Washington: World Bank).
Ros, J., 1992, “Debt-Export Ratios,” The New PalgraveDictionary of Money and Finance (London: Macmil-lan Press).
Sachs, Jeffrey, 1982, “The Current Account in the Macro-economic Adjustment Process,” Scandinavian Jour-nal of Economics, Vol. 84 (No. 2), pp. 147-164.
Sahn, David E., ed., 1996, Economic Reform and the Poorin Africa (Oxford: Clarendon Press).
Saasa, Olivier S., and others, 1996, Capacity Building forEconomic Development in Zambia: Challenges andProspects, consultancy study for the World Bank(Washington: World Bank).
Savastano, Miguel A., 1995, “Private Saving in IMFArrangements,” in IMF Conditionality: ExperienceUnder Stand-By and Extended Arrangements, Part II:Background Papers, IMF Occasional Paper No. 129(Washington: International Monetary Fund).
Schadler, Susan, and others, 1993, Economic Adjustmentin Low-Income Countries: Experience Under the En-hanced Structural Adjustment Facility, ed. by SusanSchadler, IMF Occasional Paper No. 106 (Washing-ton: International Monetary Fund, September).
Schadler, Susan, ed., 1997, IMF Conditionality: Experi-ence Under Stand-by and Extended Arrangements,Part II: Background Papers, IMF Occasional PaperNo. 129 (Washington: International MonetaryFund).
Seshamani, V., 1997, “Economic Policy Reforms, Eco-nomic Growth and Sustainable Human Development:A Comparative Study of India and Zambia” (Tokyo:Institute of Developing Economies, April).
Shadur, Mark A., 1994, Labour Relations in a DevelopingCountry: A Case Study on Zimbabwe (Aldershot,England: Avebury).
Sharer, Robert L., Hema R. De Zoysa, and Calvin A. Mc-Donald, 1995, Uganda: Adjustment with Growth,1987–94, IMF Occasional Paper No. 121 (Washing-ton: International Monetary Fund).
Simukonda, Pachero, 1992, “The Non-Governmental Sec-tor in Malawi’s Socio-Economic Development,”Malawi at the Crossroads: The Post-Colonial Politi-cal Economy, ed. by Guy Z. Mhone (Harare, Zim-babwe: SAPES Books), pp. 349–371.
Skålnes, Tor, 1995, The Politics of Economic Reform inZimbabwe: Continuity and Change in Development(New York: St. Martin’s Press).
Sobhan, R., ed., 1995, “Experiences with Economic Re-form” A Review of Bangladesh’s Development 1995(Dhaka: Center for Policy Dialogue, University PressLimited).
———, 1996, “Growth Stagnation?” in A Review ofBangladesh’s Development 1996 (Dhaka: Center forPolicy Dialogue, University Press Limited).
Svensson, Lars, and Assaf Razin, 1983, “The Terms ofTrade and the Current Account: The Harberger-Laursen-Metzler Effect,” Journal of Political Econ-omy, Vol. 91 (February), pp. 97–125.
Sylvester, Christine McNabb, 1991, Zimbabwe: The Ter-rain of Contradictory Development (Boulder, Col-orado: Westview Press).
Uganda, 1989, National Household Budget Survey 1989.———, 1996, Statistical Abstract.———, 1997, Background to the Budget.UNDP (Vietnam), 1995, Country Programme Manage-
ment Plan, Viet Nam (Hanoi: UNDP). UNDP, Uganda Human Development Report, 1997.UNFPA, 1997, “Background Information on Population
and Development Issues in Zambia” (Lusaka:UNFPA).
UNICEF, 1996, “Analyse de la Situation des Femmes etdes Enfants de Côte d’Ivoire” (UNICEF).
129
Bibliography
Van Frausum, Yves, and David E. Sahn, 1996, “Perpetuat-ing Poverty for Malawi’s Smallholders: ExternalShocks and Policy Distortions,” in Economic Reformand the Poor in Africa, ed. by David E. Sahn (Oxford:Clarendon Press).
Vietnam, General Statistical Office, 1995, Statistical Year-book, 1995 (Hanoi: General Statistical Office).
World Bank, World Debt Table, various issues. World Bank, 1987, Bangladesh: Promoting Higher
Growth and Human Development (Washington:World Bank).
———, 1994, Vietnam: Policies for Transition to an OpenEconomy (Washington: World Bank Trade Policy Di-vision).
———, 1995a, Bangladesh: From Stabilization toGrowth (Washington: World Bank).
———, 1995b, Malawi: Human Resources and Poverty,Profile and Priorities for Action, Report No. 15482(Washington: World Bank, November).
———, 1995c, Zambia: Public Expenditure Review (Wash-ington: World Bank).
———, 1995d, Strengthening the Effectiveness of AidLessons for Donors (Washington: World Bank).