Page 1
1 | P a g e
INDIVIDUAL ASSIGNMENT
OF
INVESTMENT MANAGEMENT
ON
EQUITY RESEARCH REPORT
OF
“APOLLO HOSPITALS ENTERPRISES LTD.”
Submitted to
Prof. J S Matharu
Submitted by:
Nimisha Agarwal
2013173
Term- IV
Page 2
2 | P a g e
APOLLO HOSPITALS ENTERPRISES LIMITED
Stock details
Business group: Pratap Reddy
Sector: Healthcare
Incorporation year: 1979
Face Value: Rs.5
Market Capitalization: Rs. 16,320.9 cr.
Free Float Market capitalization: Rs. 8,937.56 cr.
52 week Hi/Lo (Rs): 1224.05/ 815.35
Traded volume: 71,650 shares
Shares outstanding: 13,91,25,159
Stock Exchange Security Code for
(1) Equity Shares
(i) Bombay Stock Exchange Limited, Mumbai: 508869
(ii) National Stock Exchange of India Limited, Mumbai: APOLLOHOSP
(2) GDRs
(i) Luxembourg Stock Exchange: US0376082055
(ii) Nasdaq – Portal Market: AHELYP05
(3)Non-Convertible Debentures
National Stock Exchange of India Limited, Mumbai: APOL17, APOL20, APOL21
PRICE: Rs. 1,159.10
TARGET PRICE: Rs. 189.73
RECOMMENDATION: “SELL”
Page 3
3 | P a g e
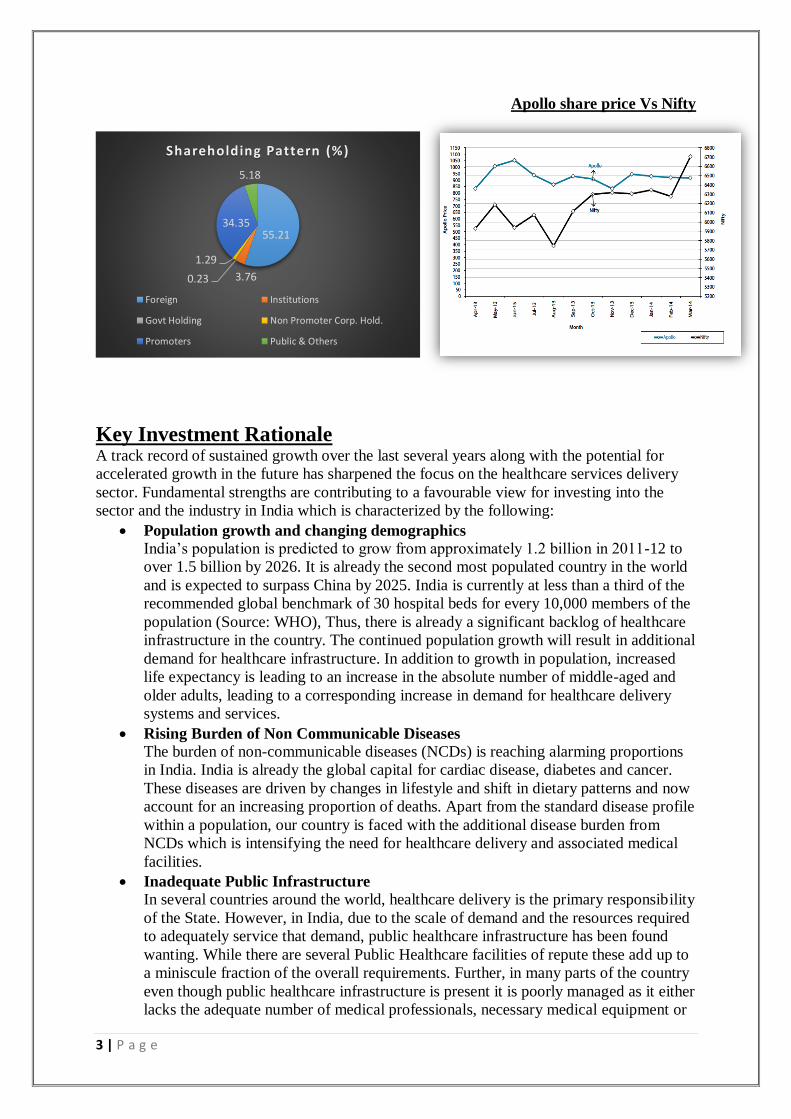
Apollo share price Vs Nifty
Key Investment Rationale A track record of sustained growth over the last several years along with the potential for
accelerated growth in the future has sharpened the focus on the healthcare services delivery
sector. Fundamental strengths are contributing to a favourable view for investing into the
sector and the industry in India which is characterized by the following:
Population growth and changing demographics
India’s population is predicted to grow from approximately 1.2 billion in 2011-12 to
over 1.5 billion by 2026. It is already the second most populated country in the world
and is expected to surpass China by 2025. India is currently at less than a third of the
recommended global benchmark of 30 hospital beds for every 10,000 members of the
population (Source: WHO), Thus, there is already a significant backlog of healthcare
infrastructure in the country. The continued population growth will result in additional
demand for healthcare infrastructure. In addition to growth in population, increased
life expectancy is leading to an increase in the absolute number of middle-aged and
older adults, leading to a corresponding increase in demand for healthcare delivery
systems and services.
Rising Burden of Non Communicable Diseases
The burden of non-communicable diseases (NCDs) is reaching alarming proportions
in India. India is already the global capital for cardiac disease, diabetes and cancer.
These diseases are driven by changes in lifestyle and shift in dietary patterns and now
account for an increasing proportion of deaths. Apart from the standard disease profile
within a population, our country is faced with the additional disease burden from
NCDs which is intensifying the need for healthcare delivery and associated medical
facilities.
Inadequate Public Infrastructure
In several countries around the world, healthcare delivery is the primary responsibility
of the State. However, in India, due to the scale of demand and the resources required
to adequately service that demand, public healthcare infrastructure has been found
wanting. While there are several Public Healthcare facilities of repute these add up to
a miniscule fraction of the overall requirements. Further, in many parts of the country
even though public healthcare infrastructure is present it is poorly managed as it either
lacks the adequate number of medical professionals, necessary medical equipment or
55.21
3.760.23
1.29
34.35
5.18
Shareholding Pattern (%)
Foreign Institutions
Govt Holding Non Promoter Corp. Hold.
Promoters Public & Others
Page 4
4 | P a g e
basic standards of hygiene. Private healthcare service providers have emerged to cater
to the unmet demand for quality healthcare services in India.
Rising per Capita Income and Quality Consciousness
The economic progress of the last few years has led to a rise in per capita and
increased disposable income. This has resulted in a significant expansion of the
addressable market for private healthcare providers. Further, consumer awareness has
increased and patients are willing to pay for better infrastructure, improved diagnostic
facilities, latest technology and best-in-class medical care. This is supported by
increased health insurance coverage across the country leading to a preference for
accredited facilities. Given these factors, patients are inclined towards private
hospitals and the addressable market is expected to grow further paving the way for
sustained growth of private healthcare service providers.
Emergence of Medical Value Travel
Deeper penetration of technology into everyday lives has broken traditional barriers
and transformed the world into a global marketplace. This has led to the emergence of
medical value travel. Patients can now evaluate healthcare institutions across the
globe from the comfort of their own homes. They can assess clinical outcomes,
confirm accreditation standards, evaluate physician success rates and compare
healthcare costs at facilities in all corners of the world. Healthcare service providers
who offer a compelling value proposition now attract patients from all corners of the
globe. India is steadily rising up the ranks of emerging Medical Tourism destinations
due to the quality of services offered by its private healthcare service providers.
Disparity in Health Infrastructure between urban and rural areas
The progress made by private healthcare service providers in the last few years has
been mostly confined to urban areas. These areas are now home to a wide variety of
facilities offering single specialty, multi-specialty, primary care, quaternary care as
well as value added services and bespoke offerings. These urban markets cater to
local residents as well as to international medical value travellers and also to a large
share of patients from surrounding rural areas. Increased competitive intensity has
resulted in pockets of oversupply in some of the urban areas. Semi-urban and rural
areas are at the other extreme with several areas lacking even in basic amenities. Thus
there is a vast disparity in offerings between the metros and urban centers vis-a-vis the
semiurban and rural areas in the country.
Evolving Business Models
Increased competition and the ever increasing cost of resources has encouraged
innovation in the healthcare industry. The last two decades have seen the emergence
of private hospital chains, single specialty chains and boutique healthcare centers. It is
now common for healthcare service providers to focus on a single specialization such
as eye care, orthopedics, cardiac care or maternity. These business models have
proven effective in increasing efficiencies through higher volumes resulting in
reduced costs while delivering comparable quality standards and success rates. Touch
points have also multiplied with all-encompassing hospitals at one single location
being replaced by multiple interface points such as standalone clinics, diagnostic
centres and pharmacies. At the other end of the spectrum, integrated healthcare
delivery centres like Medicities are also emerging as viable business models in the
Indian healthcare services industry.
Increased focus from Investors
The long-term growth potential of the healthcare industry in India has never been in
doubt. However, investors have been deterred by the track record of high capital
intensity and elongated gestation periods. In recent years, steps to moderate capital
Page 5
5 | P a g e
intensity such as leasing of premises, franchising, operating and maintenance
contracts, etc. have helped to somewhat mitigate such concerns. Further, innovative
delivery models and value added services have led to increased capital efficiency and
improved asset turns. This has resulted in multifaceted growth in the healthcare
industry even as several other industries are faced with slowing or declining growth
due to the challenging economic conditions. As a result, there has been a notable
increase in venture capital and private equity investments into the industry.
Key risks Delay in EBITDA break-even of new hospitals
While we have assumed new hospitals (900 beds to be operational over the next two
years) to achieve EBITDA break-even in 18-24 months, more-than-expected delays in
achieving EBITDA break-even would adversely impact margins. Based on our
analysis, if the EBITDA break-even is delayed by a year for the new hospitals, the
overall EBITDA margin is likely to be affected by 20-30 bps.
Execution delays in new hospitals We expect Apollo to add ~2,300 beds at various locations over the next three years.
Some of the projects, such as in Byculla (Mumbai) and Nashik (Maharashtra), are
behind schedule due to delays in approvals and hurdles in site acquisitions. Although
we have adequately factored in these delays in our projections, unprecedented delays
or cost overruns may impact financials and, consequently, the valuations.
Unavailability of skilled professionals might impact prospects The company’s performance and execution of future growth strategy are dependent
on its ability to attract and retain healthcare professionals given the plans to add
~2,300 beds over the next three years. Unavailability of skilled professionals or the
inability to retain key doctors could impact future prospects.
Rising real estate prices Land and buildings together account for 50-55% of the total capital costs in setting up
a hospital. Rising real estate prices, especially in metros and tier I cities, are making it
difficult to put up commercially viable hospitals.
General Overview of Healthcare Services in India India has had several achievements in the growth of its healthcare services sector since
independence. The country inherited basic and limited healthcare infrastructure which was
grossly inadequate to meet the demands of a large and diverse populace. From that starting
point, India has emerged as a serious player in the global healthcare services delivery
landscape with a multitude of world-class healthcare institutions imbibing the highest
standards of clinical excellence.
While the public sector was the predominant service provider for most of the post-
Independence era, over the last two decades the private sector in India has steadily grown and
enhanced its quality of operations to emerge as the leading provider of the entire array of
healthcare services. Though Government initiatives in the field of healthcare are largely
critiqued, there have been several meaningful initiatives and innovative reforms.
Although, there has been reasonable progress in several areas, multiple deficiencies continue
to exist in the delivery of healthcare services in India. These parameters need to be addressed
immediately and effectively. Several Millennium Development Goals are unlikely to be
achieved by 2015. Despite a considerable decline in child malnutrition rates over the past few
decades, India continues to have the highest number of malnourished children in the world.
While India is witnessing an increase in chronic disease related morbidity and mortality, it is
Page 6
6 | P a g e
yet to overcome health challenges posed by infectious diseases and under-nutrition. The
country will need to battle this dual burden simultaneously. The growing rural – urban divide,
abysmal state of public infrastructure, under-allocation of resources towards the sector and
the increasing scarcity of qualified doctors indicate that India will be hard pressed to drive
improvements in terms of key healthcare adequacy metrics for some time.
However, there have also been significant improvement in various offerings across the
healthcare spectrum in India. This is apparent from the strides made in primary care to
quaternary care, expertise across various specialties, adoption of technology-based treatments
and large volumes of complex medical procedures being undertaken. The simultaneous
progress and growth of allied offerings like diagnostics centres, medical & nursing colleges,
pharmacies or medical insurance have resulted in extending and widening the reach of
healthcare to all corners of the country.
The Healthcare Services Delivery Landscape in India A detailed analysis of the healthcare system in India reveals that our health care model needs
further augmentation on several vital parameters, namely:
• Health expenditure as a percentage of GDP
• Per capita spending on healthcare
• Doctor-to-Population & Hospital Bed-to-Population ratio
• Infant and maternal mortality ratio
• Size of the healthcare market
Healthcare spending as a percentage of GDP in India has reduced from 4.3% in 2000 to 3.7%
in 2010. The decline in the proportion to GDP implies that the growth in expenditure on
healthcare has not kept pace with the growth in GDP. The corresponding global average for
healthcare spends as a percentage of GDP was 8.2% in 2000 and 9.2% in 2010.
Due to the low public expenditure and under-utilization of allotted resources, the private
sector accounts for a major share of the total healthcare expenditure in India. While the
proportion of Government expenditure to private expenditure has marginally improved from
26:74 in 2000 to 28:72 in 2010, India continues to report the highest proportions of private
investment in healthcare spending by nations across the globe. The global average for
proportion of public spending to private healthcare spending was 59:41 in 2010.
Another standout feature of the healthcare services delivery landscape in India is that out-of-
pocket spends as a proportion of total healthcare spending continues to remain high at about
86% of total healthcare expenditure in 2010. This is due to a low public spend and moderate
penetration of health insurance. The global average has remained steady at ~50% during the
period from 2000 to 2010.
The global average for per capita spend on healthcare expenditure has significantly increased
(in PPP terms) from US$ 564 in 2000 to US$ 1,017 in 2010. In India, the corresponding
figures compare poorly despite growing from US$ 65 in 2000 to US$ 126 in 2010.
However, despite the progress made by the private sector over the years, infrastructure gaps
persist in the industry. The bed availability in India stood at 9 per 10,000 by 2012 which was
significantly lower than the WHO guideline of 30 beds per 10,000 population. In terms of
availability of medical staff, the number of doctors and nurses available for every 10,000 was
at 6.5 and 10.0 in India compared to the global average of 13.9 doctors and 29.0 nurses per
10,000 population. (Source: WHO World Health Statistics, 2013)
The existing healthcare system in India is heavily skewed in favour of the urban areas, which
account for only 25-30% of the population. This disproportionate distribution of health
services also results in increased cost of treatments, delays and sub-optimal treatments.
Further, the public perception about care and quality in a Government healthcare facility is
not as favourable as compared to private healthcare delivery systems.
Page 7
7 | P a g e
Ensuring healthcare for all calls for a multi-disciplinary & multi-pronged approach.
Significant improvements in the delivery mechanism cannot be brought about by just
changing or applying pressure on one factor and leaving the others unchanged. A model
obsessed with controlling costs without paying attention towards changing other determinants
will not lead to creation of a successful delivery system. Determinants like accessibility,
quality standards, equitability, resource availability and equitable distribution need to be
worked upon simultaneously to produce visible changes.
Retail Pharmacies In India, pharmacies are the dominant distribution channel for pharmaceutical companies and
generate a majority of overall sales. However, the industry is highly fragmented in nature and
is dominated by the unorganized segment or stand-alone units which enjoy a comprehensive
presence across the country. It is only in recent years that the organized segment has scaled
up its presence by setting up chains of retail pharmacy stores.
There are approximately 800,000 pharmacies in India today with about 60,000 distributors. In
value terms, the size of the total retail pharmacy market is estimated to be between
Rs.750,000 and Rs.800,000 million. Out of this, the organised market accounts for
approximately Rs.30,000 million or less than 5% of the overall market.
Organized players are now making steady inroads into the market and gradually increasing
their market share. They are responsible for the improved quality of retail services and have
raised the bar on customer centricity by introducing trends like loyalty schemes, discouraging
spurious drugs, tele-consultation services, private labels and value added services such as
basic diagnostics and health insurance plans.
Entrants into the organised market comprise a mix of pharmaceutical or healthcare service
companies, large corporates, and entrepreneurs and even the Central and State Governments
through the Jan Aushadi outlets and Karunya pharmacies.
The key challenges that need to be addressed are inefficient distribution and supply chains,
counterfeit and spurious drugs, shortage of trained and qualified manpower, increased
competition from international players and the prohibitive cost of real estate. The recent
legislation fixing maximum prices for certain essential medicines has the effect of
compressing profit margins in the industry.
However, the potential remains high and the sector is gradually maturing and will see
increased innovation and improved scale from the larger players. In addition, the entry of
global players will bring in increased sophistication and standards and set the tone for
sustained growth in the retail pharmacy sector.
Health Insurance For the purpose of regulation, health insurance companies are classified as non-life
companies. Despite the country’s worst slowdown in over a decade, the annual growth in
premiums of the non-life insurance sector was a healthy 12% for 2013-14. Health insurance’s
annual premium collections were just over Rs.70,000 million (Source: IRDA). Despite a
healthy growth, profitability in the business remains a challenge due to the prevalence of a
high claims ratio.
Though the health insurance industry is nearly 30 years old, the penetration level remains low
with less than 20% of the population being covered by adequate health insurance. The
industry was liberalised in the year 2000 which facilitated the entry of many private sector
health insurers. Even then, the industry continues to be dominated by four public sector
entities (National, New India, Oriental, and United India) that together have 60% market
Page 8
8 | P a g e
share. The rest of the share is spread over 17 private sector players including the standalone
health insurance players.
The insurance penetration level in India is very low when compared with the global average.
Over 80% of health care spends continues to be from private financing, much of which is out
of pocket payments and employer funding. Prima facie it seems that there is significant scope
for health insurance to grow further. However, there are several consumer prejudices which
will take time to overcome.
The Industry is getting mature as the overall service levels and customer management
standards are improving. The introduction of health insurance portability has offered more
convenience to customers and has enhanced competition in the industry.
Co-ordination by the IRDA to address sustained losses in the industry by permitting revision
in premiums and allowing for negotiation with hospitals has helped to improve the financial
position of the industry. This is expected to spur further innovation and encourage
introduction of customer friendly products which will pave the way for sustained growth in
the years ahead.
Industry Outlook / Prospects The healthcare services industry will need to work towards addressing the key issues
plaguing the sector. In addition to the shortage and the inequitable distribution of health
infrastructure across the country, the sector will have to tackle the shortage of doctors as well
as the growing burden of lifestyle diseases. This will require innovative solutions and high
investments; factual evidence suggests that creation of one bed in the tertiary sector entails an
investment upwards of Rs.8 million and Rs.4 million upwards per bed in the secondary care
sector.
For a transition towards the desired ratios of 30 beds per 10,000 population, over 2 million
new hospital beds need to be created. Moreover, assuming a split of 70:30 between secondary
and tertiary care, an investment of gigantic proportions is required.
Mobilizing a capital spending of this order for capacity building is neither possible for the
Government nor for the private sector if they work in isolation. Hence, this calls for
innovative out of the box solutions and development of new business models.
Better utilization of under-utilized Government infrastructure, incentivizing capital flows into
the sector and leveraging on technology to reduce intensity of physical infrastructure are
some of the options under consideration. It is likely that private players will continue to
upgrade their skills and the overall healthcare market will be divided more categorically into
sub-markets based on geographic location, complexity of care and economic strata of
population being serviced.
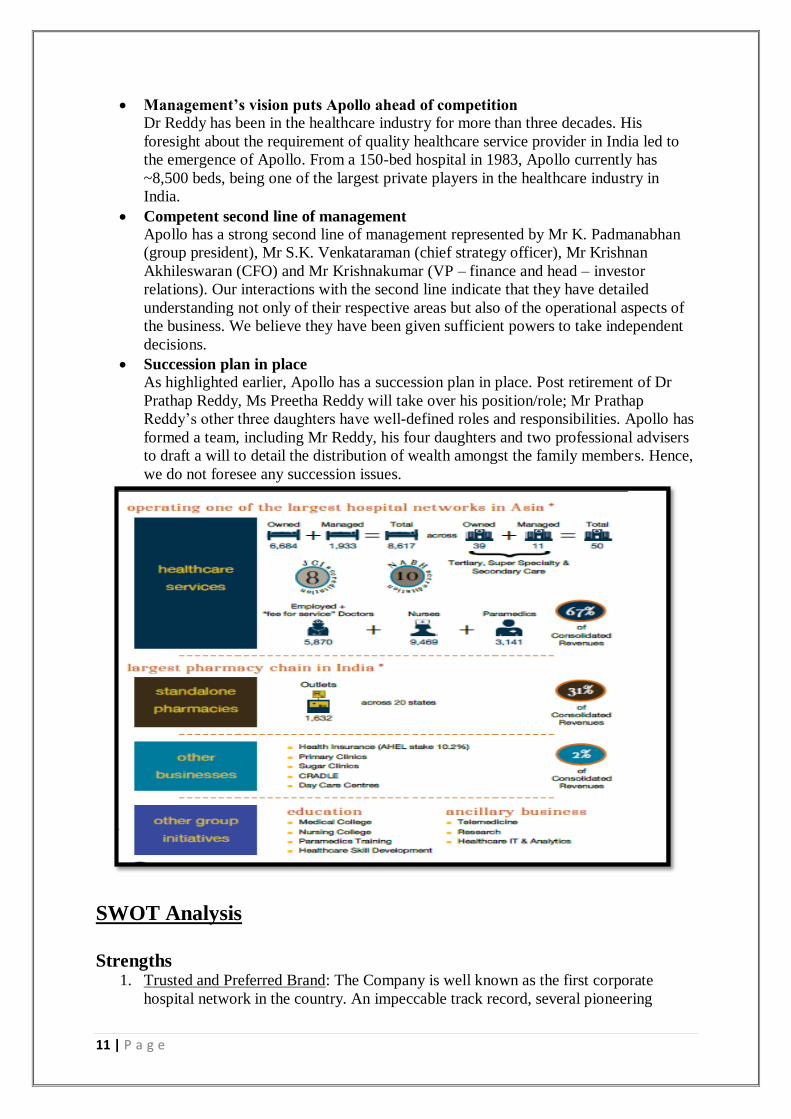
Company Overview Apollo Hospitals was founded by Dr. Prathap C. Reddy in 1979 and became a public listed
company on the BSE in 1983 and was listed on the NSE in 1996. The Company launched
India’s first corporate hospital in Chennai in 1983. Now, as Asia largest and most trusted
healthcare group, its presence includes over 8,617 beds across 50 Hospitals, 1,632
Pharmacies, over 100 primary care & diagnostic clinics, 115 telemedicine units across
10 countries, health insurance services, global projects consultancy, 15 academic institutions
and a Research Foundation with a focus on global clinical trials, epidemiological studies,
stem-cell and genetic research.
The Company is headquartered in Chennai and its diversified operations include multiple
subsidiaries, joint ventures and associates. It runs large hospital clusters in Chennai and
Page 9
9 | P a g e
Hyderabad and has established landmark hospitals in Delhi, Bangalore, Kolkata, Ahmedabad,
Pune, Bhubaneshwar, Madurai and Mysore.
Its healthcare facilities comprise a mix of primary, secondary, and tertiary care facilities. The
tertiary care hospitals in the network provide advanced levels of care in over 50 specialties,
including cardiac sciences, oncology, neurosciences, critical care, orthopedics, radiology,
gastroenterology, and transplants. In addition, it is increasingly focusing on technology based
treatment areas such as minimally invasive surgery, robotics and technology for cancer.
In addition to existing operations, the Group has several initiatives underway which includes
setting up of the Proton Therapy Centre in Chennai. This will be the first of its kind in the
Southern Hemisphere and is well placed to offer advanced oncology therapy to a combined
population of over 3.5 billion people in Asia, Africa and Australia. It is also expanding its
network of Retail Healthcare Centres including Dental Clinics and Lifestyle Birthing Centres.
Significant efforts are also underway to integrate cutting edge technologies and innovative
systems such as Paperless Hospitals, Tele-radiology, homecare services, wearable devices
and personalized medicine into mainstream offerings.
Composition of Board of Directors
Page 10
10 | P a g e
Details of remuneration paid to the directors (Rs. In million)
Management Overview
Experienced and professional management with pragmatic approach Apollo’s management has more than three decades of experience in the healthcare
services industry. The management team is headed by Dr Prathap Reddy, founder and
executive chairman. He holds a medical degree from Stanley Medical College,
Chennai and has received Fellowship from the Massachusetts General Hospital,
Boston, the US. Mr Reddy is supported by his four daughters. There is a clear
demarcation of roles and responsibilities between the sisters to ensure smooth
functioning of the company.
Page 11
11 | P a g e
Management’s vision puts Apollo ahead of competition Dr Reddy has been in the healthcare industry for more than three decades. His
foresight about the requirement of quality healthcare service provider in India led to
the emergence of Apollo. From a 150-bed hospital in 1983, Apollo currently has
~8,500 beds, being one of the largest private players in the healthcare industry in
India.
Competent second line of management Apollo has a strong second line of management represented by Mr K. Padmanabhan
(group president), Mr S.K. Venkataraman (chief strategy officer), Mr Krishnan
Akhileswaran (CFO) and Mr Krishnakumar (VP – finance and head – investor
relations). Our interactions with the second line indicate that they have detailed
understanding not only of their respective areas but also of the operational aspects of
the business. We believe they have been given sufficient powers to take independent
decisions.
Succession plan in place As highlighted earlier, Apollo has a succession plan in place. Post retirement of Dr
Prathap Reddy, Ms Preetha Reddy will take over his position/role; Mr Prathap
Reddy’s other three daughters have well-defined roles and responsibilities. Apollo has
formed a team, including Mr Reddy, his four daughters and two professional advisers
to draft a will to detail the distribution of wealth amongst the family members. Hence,
we do not foresee any succession issues.
SWOT Analysis
Strengths
1. Trusted and Preferred Brand: The Company is well known as the first corporate
hospital network in the country. An impeccable track record, several pioneering
Page 12
12 | P a g e
initiatives and the sheer number of surgeries with high success rates have helped to
establish the “Apollo” brand as a premier brand in the healthcare sector in India. This
brand value provides several tangible and intangible benefits such as the belief and
trust that makes patients choose Apollo, the ability to attract doctors and other
healthcare professionals ahead of competition, ability to appropriately price its
healthcare services, sustained marketing benefits and a headstart in footfalls at new
facilities.
2. Integrated Healthcare Delivery Model: Their presence in various initiatives across the
healthcare services delivery chain gives up a competitive advantage and they are able
to benefit from the following:
• Their pan-India presence in primary clinics, telemedicine, retail healthcare and
other healthcare programs provide increased touch points for patient access.
• Captive market to cross sell businesses of pharmacies, health insurance and
self-branded products.
• Ability to participate in a wider spectrum of the patient treatment cycle from
diagnostics to hospitalisation to insurance coverage up to ongoing medication
requirements post-hospitalisation
• Synergistic revenue streams which have differentiated characteristics in terms
of resource use and capital intensity
• Access to qualified and trained medical resources through our educational
initiatives
3. Scale: The network of 50 hospitals, 1,632 pharmacies and over 100 clinics and retail
healthcare centres provide them with the following benefits:
• Cost efficiencies through sharing of managerial and clinical resources;
• Economies of scale and ability to obtain competitive prices from our suppliers
and service providers due to centralized purchasing;
• The ability to absorb initial ramp up costs during the gestation period of new
hospitals without significantly impacting overall operating performance
4. High Quality and mature facilities: The Company has a strong emphasis on clinical
excellence in its operations. They conduct a large number of complex and high-end
medical procedures with outstanding success rates and clinical outcomes. We have the
largest number 8 of JCI accredited facilities by any single healthcare group in India /
Asia and also have 10 facilities which are accredited by NABH. The first mover
advantage has enabled your company to establish hospitals at prime locations in
several cities in India at costs which cannot be replicated. Apart from that, 67% or
3,896 of our 5,811 operating beds are over 5 years old which indicates the strength
and maturity of the business.
5. Arrangements with Doctors / Medical Personnel: Their consultant engagement model
with senior doctors provides them the professional comfort and freedom to deliver
optimal performance. Many of the doctors associated with us are prominent within the
medical field having received accolades and awards or are heading national medical
associations. They are also among the leading private healthcare services employers
in India. The medical colleges and training establishments within their group provide
them with an abundant number of newly qualified medical personnel the lack of
which can otherwise be a serious constraint to growth and efficiency.
6. Professional Management team with rich industry experience: Their management
team comprises of senior professionals with abundant expertise and knowhow. They
possess a proven track record in the healthcare services industry and have been
instrumental in driving strategy and growth. The blend of doctors as well as qualified
professionals for key functions has enabled the company to repeatedly balance the
Page 13
13 | P a g e
multiple objectives of delivering high standards of clinical excellence, best-in-class
patient care, rapid technology adoption, value optimization and focus on key
specialties while growing in a steady and calibrated manner.
7. Pioneer in Leveraging Technology: The Company has been a pioneer in adopting
cutting edge technology to elevate treatment quality and clinical standards in India.
From introducing the first MRI machine in the country to the recent focus on robotics
and the ongoing project to introduce the Proton Cancer Therapy in India, Apollo has
consistently been at the forefront of introducing technology based treatments in India.
This factor has been a key enabler for maintaining high clinical standards and helps to
attract renowned doctors from India and abroad and in improving efficiency in
operations.
Weaknesses 1. High intensity of resources: The healthcare services delivery business requires
deployment of significant amount of resources which are either expensive or scarce or
both. The upfront investment to set up a hospital is high as the ‘per bed’ cost to set up
a tertiary hospital in an urban area can be upwards of ` 10 million per bed. This
includes costs of building, construction costs, interiors and costs of plants & machines
and medical equipment. Once operational, hospitals are also labour & skill intensive.
Skilled manpower includes doctors, nurses and paramedical staff comprising lab-
technicians, radiographers and therapists all of whom are in short supply in India. The
overall requirement for such scarce resources makes it challenging to set up and
profitably run a hospital in India.
2. Long gestation period: Apart from the significant upfront capital outlay on land,
building and medical equipment at the time of setting up a hospital, operating costs
are also high. Though there are exceptions, the average maturity time frame for a
facility to turn net income positive is approximately 4-5 years. Inability to scale up
occupancy in new facilities could adversely affect our operating efficiencies and our
profitability. The establishment of marquee facilities which are now mature and
generating positive cash flows has improved your Company’s ability to service debt
capital.
3. Lack of Regulatory Vision: There is a requirement of over 80 licenses and approvals
to set up a hospital. There are multiple rules and regulations to adhere to even in day-
to-day operations like importing medical equipment, setting up parking facilities at
hospitals or adding or reducing staff. The present regulations pertaining to medical
visas are a constraint to expand the share of medical tourism. The lack of proactive
and favourable regulation has blunted some of the potential that the healthcare sector
could have realized over the last several decades.
4. Scarcity of doctors and medical personnel: The hospitals business is skill & talent
intensive. The quality of doctors and supporting healthcare professionals are critical to
the quality and efficiency of the business. Top quality doctors and medical personnel
are a finite resource and these professionals enjoy abundant opportunity in the form of
entrepreneurial ventures, independent practice as well as competing offers from other
service providers in India and abroad. Our continued performance and growth
substantially depends on our ability to attract and retain the best of skilled medical
talent and professionals.
5. Obsolescence of medical equipment: The Company uses the latest medical equipment
in the hospitals to provide top quality healthcare services. Due to the extent of global
research and development into healthcare and frequent product improvements and
evolving technology, the rate of obsolescence of equipment is high. Many times, such
Page 14
14 | P a g e
equipment can become redundant well before their projected useful life. Rapid
obsolescence reduces the time frame for recovery of investment and dilutes capital
efficiency.
6. Lack of Standardisation: Healthcare is an extremely dynamic industry and there are
varied requirements even in markets which are reasonably proximate. Every market
has a unique set of circumstances with variance in demographics, disease profiles,
customer attitudes, seasonal variations, price sensitivity and so on. Even hospitals in
two different cities in the same state will not be subject to identical operating
circumstances. This requires a higher degree of customization and adaptability. The
lack of standardisation necessitates increased intensity in the level of monitoring and
clinical governance.
7. Complex business model: The hospital business is not a ‘plug and play’ business by
any standard. Merely having all of the necessary resources is not a guarantee to
success. Due to the many moving parts, rigorous management overview is required
for sustaining clinical standards, balancing case mix, ensuring adequate volumes and
regularly upgrading technology. In addition, there is a high level of doctor interaction
combined with multiple operating metrics to monitor and analyse. The operating
environment is dynamic and the organization has to appropriately respond to the
ongoing challenges.
Opportunities 1. Increase in population and changing demographics: India is the second largest
populated country in the world and is expected to see its population expand from 1.2
billion people currently to 1.5 billion people in 2015.Further, with increasing
longevity the number of middle-aged and elderly people is expected to multiply. This
will result in an increase in demand for all kinds of healthcare services manifold.
2. Change in disease patterns: India is the cancer, diabetes and heart disease capital of
the world. This rising burden of non-communicable disease is a sad reality and a
challenge that Indian healthcare service providers will need to effectively address.
The increase in NCDs is an outcome of changing dietary patterns and alterations in
lifestyle caused by increasing incomes and improved affordability. The sheer volume
of cases will mean that a manifold increase in bed capacity will be required on a pan
India basis to address this challenge.
3. Under penetration in semi-urban and rural areas: Notwithstanding the sophisticated
healthcare facilities and pockets of over-capacity in certain urban centres, there
continue to be several regions within the country where healthcare facilities remain
woefully inadequate. Despite the ability and the willingness to pay for quality
healthcare services patients in these areas are forced to opt for moderate or sub-
standard facilities for lack of a better alternative. These catchment areas can prove to
be low hanging fruit for healthcare service providers who are able to offer quality
healthcare services with excellent clinical outcomes. They plan to serve the demand in
some of these areas for quality healthcare services through our “REACH” initiative.
4. Increase in demand for elective surgeries: Given steady increases in disposable
incomes and growing health awareness, there has been a manifold expansion in
demand for elective or planned surgeries. Patients are now willing to undergo
discretionary treatments and healthcare procedures where the goal is to enhance
health and quality of life. These procedures are known as electives as patient can
‘elect’ to undergo these treatments. They intend to concentrate on this requirement
and build a strong presence in this segment.
Page 15
15 | P a g e
5. Increasing incidence of medical tourism: Earlier, patients would travel across borders
to access high quality medical care which was unavailable in their home countries.
However, these disparities are less common today and quality healthcare is available
in various regions across the world. However, it is now commonly known that
healthcare in developed countries is unaffordable for many. This has led to the
increasing prevalence of medical value travel. In addition to regional peers like
Singapore, Malaysia and Thailand, India is fast emerging as a preferred destination.
Indian doctors are already highly regarded for competency and expertise. If India can
continue to make progress on quality of healthcare delivery and facilities and ease the
overall process, it could garner a significant market share of global medical tourism.
6. High number of under-performing facilities in India: Due to the attractive returns
delivered by the leading healthcare companies in India, there is a perception that the
healthcare business is highly remunerative. As a result, there has been a rush to set up
healthcare facilities across the length and breadth of this country. However, the
approach in several cases does not factor in the ground realities. Due to their inability
to invest in the appropriate medical technology, absorb initial period losses, attract
medical talent or increase footfalls, several medical facilities set up across the country
are incurring operating and financial losses. This presents itself an opportunity for
experienced hospital operators like us to acquire such facilities and leverage our
strengths to turn them around.
Threats 1. Heightened competitive intensity: The increasing propensity for entrepreneurs and
business houses to enter into the healthcare business has resulted in a spike in setting
up of greenfield facilities, JVs and acquisitions. There are even pockets of over-
capacity in some metros. In order to make these ventures remunerative after having
invested significant funds, there is a chance that some of these players may resort to
unsustainable pricing in order to gain market share.
2. Increasing cost of resources: The emergence of several domestic hospital chains
combined with the entry of international players is leading to an increased number of
competitors chasing finite resources such as land, quality medical professionals and
potential acquisition targets. Demand growth is expected to outpace improved supply
of these resources. A failure to acquire resources at fair and reasonable rates will
impact the ability to suitably grow and expand our operations. Further, increases in
operating costs can impact the Company’s operations and financial condition.
3. Discontinuation of leases: The lands on which their hospital buildings and their stand-
alone pharmacies are operating on are not owned by them. In case the lease
arrangements relating to these properties are not renewed in their favour or on terms
that are not favourable to them then their business operations may suffer disruptions.
4. Losing out on the Medical Tourism Opportunity: Several countries in the Asia-Pacific
region have woken up to the opportunity to attract Medical Tourists. These countries
are providing incentives to domestic service providers in the form of subsidized
capital, ease in permissions and tax benefits. Further, due to enhanced infrastructure
and simplified visa norms, they are poised to grab a larger share of the opportunity.
India will need to rapidly address issues and improve its competitiveness in this arena.
5. Withdrawal of tax incentives: Since fiscal 2011, we have benefited from the tax
deduction given in respect of capital expenditure incurred on setting up new hospital
projects. The resultant deferment of tax has helped to improve our immediate cash
flows allowing us more resources to fund growth. Any withdrawal of tax incentives or
Page 16
16 | P a g e
increase in corporate tax rates will result in increased liabilities and reduced returns to
the business.
Apollo is the leading player in the Indian hospital segment by geographic presence, business
span and breadth of service offerings
Porter’s Five Forces Model
1. Competitive rivalry within the industry: It is extremely high as if someone raises
prices, they’ll be quickly undercut. Intense competition puts strong downward
pressure on prices as customers might switch to other service provider as there is not
very differentiated services provided by the existing companies.
2. Bargaining power of suppliers: It is high as due to continuous technological
developments in the healthcare sector, the supplier has the power to negotiate for its
new developments. It leads to increase in capital expenditure of the company but
helps in reducing operating costs.
3. Bargaining power of buyers: It is moderate which puts downward pressure on prices.
It depends upon the nature of illness that the buyer can bargain for service cost or go
for alternative options.
4. Threat of substitutes: There is some threat of substitution. Ex Telemedicine or shifting
to other medicine like ayuraveda or natural care.
5. Threat of new entrants: It is quite high as this industry is making profits from few
years and government policies are attracting new investors thus leading to reduced
profitability of existing companies.
Strategy They remain focused on capacity creation with the objective of simultaneously improving
operating efficiencies. They aim to achieve this through:
Creation of new Healthcare Delivery Capacity in India: The primary focus will be the
delivery of healthcare services in India. The addressable market is large and is
growing each year. They believe that there are several regions which are under-served
and leading healthcare providers must strive to enhance their presence across the
Page 17
17 | P a g e
country. Mergers and acquisitions are not ideal for capacity creation and providers
must strive to add new capacity or leverage unutilized facilities to ensure
‘incremental’ capacity is introduced to address the shortfall of healthcare
infrastructure in the country. The expansion initiatives complement the plans for the
core segment of delivery of healthcare services.
Leveraging multiple formats to touch more patients: In addition to the healthcare
services delivery business, our businesses of retail pharmacies, health insurance,
medical education, telemedicine, projects & consultancy, lifestyle birthing centres and
dental clinics provide us with multiple touch points to interact with patients. These
touch points enable the brand to improve the connect with patients and also help to
serve patients better near to their homes.
Focus on high acuity cases: The healthcare services market is large and diverse with
multiple challenges which has to be addressed. However, since our resources are
finite we need to focus on specific areas where we can optimize efforts and value.
They have therefore identified cardiology, oncology, neurology, critical care,
orthopaedics and transplants as key focus areas for our tertiary care hospitals. We
internally designate these focus areas as “Centers of Excellence”. They have invested
significant resources to develop robotic surgery capabilities and have the largest solid
organ transplant program in the world. They believe that it is essential to increase
volumes of high acuity cases at their facilities to maximize their productivity in the
healthcare services market.
Multi-pronged expansion plan: Despite a wide presence across the country there are
many areas within the country where they wish to augment our presence. As
branching out is a gradual process requiring gestation of new facilities, they need to
selectively expand their presence across the country. They plan to augment our
presence in major urban centres such as Chennai, Hyderabad, Kolkata, Bangalore and
New Delhi where we already have a significant presence. They also wish to enter in
cities like Mumbai, Patna and state capitals. By setting up multiple facilities in each of
these cities we plan to develop ‘clusters’ of hospitals in several major urban centres in
India which will help us to diversify and strengthen our network in these key markets.
Thirdly, they plan to simultaneously augment our presence in Tier 2 and 3 cities in
India through the REACH hospitals initiative.
Hub and Spoke Model: They have set up a network of Clinics, REACH Hospitals,
pharmacies and telemedicine units. All these centres act as the primary touch point for
patients. As setting up of these facilities is significantly less resource intensive vis-a-
vis secondary or tertiary care facilities, they can apply differential strategies when
adding such facilities either in urban centres or semi-urban centres. These centres will
offer basic healthcare services and refer any high acuity cases back to the main
hospitals. These facilities act as spokes and contribute to increased volumes of the
entire network including the tertiary healthcare facilities. Similarly, they are
implementing processes to facilitate outpatient departments and day care centres for
all non-critical treatments at these facilities which will allow for a larger proportion of
capacity at existing hospitals to focus on high end tertiary care.
Technology and new initiatives: The Apollo Hospitals Group has always been at the
forefront of technology excellence and has been the first to leverage several
innovative technologies for the benefit of patients. By employing the latest offerings,
they have been able to enhance clinical outcomes, reduce ALOS and optimize value
while improving the patient care experience. They plan to continue in the same vein
with the increased thrust on Minimally Invasive Surgery and Robotics and the
introduction of the ground-breaking Proton Therapy Centre in Chennai. They also
Page 18
18 | P a g e
plan to introduce new formats for healthcare delivery. These include lifestyle birthing
centres, primary care clinics, dental clinics, larger sized pharmacy stores as well as
units for teleradiology and telemedicine which have been positively received by
patients across the network.
Cultivate Regulatory Support: The healthcare industry is facing multiple challenges
on account of increased costs of capital, scarcity of medical resources, increased
competition from regional markets, archaic laws and regulations. A single player in
the industry will have a limited impact when championing for changes in regulation.
The Company has been one of the founding members of Healthcare bodies such as
‘NATHEALTH’ and the Healthcare Alliance which comprise several leading players
of the Healthcare Industry as members. It is expected that these bodies will act as a
unified voice for the Healthcare Industry and lobby for incentives and forward
looking legislation intended to promote the growth of the healthcare industry in India.
Expansion Plans The Company has chalked out aggressive growth plans for the next 3 years which will see it
adding around 2,200 beds to its existing base of 6,684 beds as of March 31, 2014. These new
beds will be located in 12 hospitals which, when added to the current network of 39 hospitals,
will take the overall network to 51 hospitals.
The expansion has been chalked out in a calibrated manner with a manageable number of
beds coming on stream each year. Further, the strategy behind the expansion is to augment its
pan-India presence in a balanced manner. This will consist of expansion of beds and facilities
in centres such as Chennai and Bangalore where it already has a considerable presence. This
will help it to become the dominant healthcare provider in key locations. They also plans to
set up new hospitals in metros and large cities with no existing presence in order to reach out
to a wider urban population. Its current expansion plan envisages entry into Mumbai, Indore,
Patna and Vishakapatnam amongst other locations.
Lastly, it will simultaneously expand in Tier II and Tier III cities in India through its
“REACH” hospitals initiative. The REACH initiative envisages setting up of secondary care
facilities in these cities leading to a win-win situation for the Company as well as its patients.
A large majority of cases can be handled at these hospitals and complex cases can be treated
at tertiary care centres in Tier I cities.
The current expansion plan envisages an addition of 350 beds in REACH Hospitals in
Nellore and Nashik, 300 beds across four facilities in Chennai and a 180 bed hospital in
North Bangalore which adds to the existing presence in these cities. In FY15, the Company
also plans to launch its first hospital in Mumbai of 350 beds as well as its first hospital in
Indore comprising of 175 beds apart from a 250 bed hospital in Vizag. This will be
supplemented by a hospital in Patna in FY16 and further expansion in Mumbai and Chennai
Metros in FY17 and FY18.
In addition to the planned addition of beds and hospitals, there are several initiatives that will
aid in expansion. The setting up of a Proton Therapy Centre in Chennai which will be the first
of its kind centre for cancer treatment in the Asia Pacific Region will entail an investment of
Rs.4,200 million. This covers the cost of equipment and services including long-term
operation and maintenance. There are plans to enhance retail healthcare presence with the
rollout of clinics, dental care centres, lifestyle birthing centres and pharmacies.
Page 19
19 | P a g e
Capital Expenditure Apart from the expansion plans outlined above they have made investments to increase bed
capacity in existing centres and incurred maintenance and refurbishment costs. They have
invested in new technologies, modernization of facilities and expansion of services. They
believe that these investments will help them to attract and retain doctors and to make their
hospitals a preferred choice for patients.
The Board has approved a capital expenditure of around Rs. 21,000 million for the expansion
plans stated above. Of this Rs.6,000 million has already been invested and the balance
Rs.15,000 million will be invested in a calibrated manner over the next three years. This will
be financed from existing funds, internal accruals as well as through debt funds. Capital
expenditure primarily relates to expansion activities. The amount and purpose of these
expenditures may change in accordance with business requirements.
Revenues The 16% change in our operating revenues for FY14 compared to FY13 was primarily the
result of an increase in occupancy and revenue per bed day (RPBD) for hospitals as well as
strong growth in the SAP business. Health care services revenues grew by 18% from
Rs.25,617 million to Rs. 30,226 million. Revenue per Bed Day increased from Rs. 21,702 to
Rs.23,684. The increase in RPBD is largely a result of changes in the acuity of patients as
well as better price realizations.
Page 20
20 | P a g e
The number of stores within the network of Standalone Pharmacies was 1,632 as at March
31, 2014 as compared to 1,503 stores as at March 31, 2013. These rollouts together with
maturity of existing stores led to a 24% yoy revenue growth in the standalone pharmacy
segment (SAPs).
Expenses
1. Salaries & Benefits (excluding managerial remuneration)
The salaries and benefits expense of Rs.5,865 million during 2013 increased by Rs.1,053
million to Rs. 6,918 million in 2014. This increase was a result of annual compensation
increases for our employees, plus the impact of an increasing number of employed
physicians within our hospitals and pharmacists for the SAPs.
2. Operative Expenses
During 2014, our material cost of Rs. 21,501 million increased 16%, as compared to Rs.
18,558 million in 2013. The increase in material cost was in line with the growth in
operating revenues.
3. Depreciation & Amortization
The depreciation & amortization expense increased to Rs. 1,678 million during 2014, as
compared to Rs. 1,424 million during 2013. The increase is largely due to capital
improvement projects completed during 2013 and normal replacement costs of facilities
and equipment.
4. Financial Expenses
The financial expenses increased to Rs.1,194 million during 2014, compared to Rs.1,033
million during 2013. The increase is largely due to higher interest charge arising on
commissioning of new hospital projects at Chennai, Bengaluru and Trichy.
5. Provision For Income Taxes
The provision for taxes during the year ended March 31, 2014 is Rs. 1,018 million
compared to Rs. 1,051 million in the previous year ended March 31, 2013 due to availing
of benefit under section 35AD of the Income Tax Act that allows weighted deduction of
150% of project cost of new hospitals commissioned during the year.
6. Liquidity
The primary sources of liquidity are cash flows generated from our operations as well as
long-term borrowings. The internally generated cash flows, amounts available under our
2011 2012 2013 2014
Pharmacy 6,613.91 8,605.80 11,016.95 13,648.44
Healthcare services 16,705.71 19,394.92 22,160.96 24,967.87
0.005,000.00
10,000.0015,000.0020,000.0025,000.0030,000.0035,000.0040,000.0045,000.00
Rs.
in m
illio
n
Year
Segmental Revenue
Healthcare services Pharmacy
Page 21
21 | P a g e
debt agreements and the further debt that is proposed to be raised will be adequate to
service existing debt, finance internal growth and deploy funds for capital expenditure.
7. Capital Expenditure
As they continue to increase bed capacity and roll-out new hospitals, capital expenditures
continue to be high. They have made significant, targeted investments at hospitals to add
new technologies, modernize facilities and expand their services. These investments
should assist in their efforts to attract and retain physicians and to make hospitals more
desirable to their employees and potential patients.
FINANCIAL ANALYSIS
Ratio Analysis
Year End 2014 2013 2012 2011 2010 2009 2008 2007 2006
Debt-Equity 0.36 0.31 0.31 0.41 0.39 0.29 0.23 0.16 0.22
Current Ratio 1.4 1.32 1.15 1.02 0.91 0.99 1.35 1.42 1.33
Inventory Turnover 16.42 17.1 16.81 16.37 15.02 15.52 16.76 17.66 17.09
Debtors Turnover 8.63 8.5 8.98 9.81 9.97 10.16 10.05 9.53 8.2
Interest Cover 5.83 6.62 6.31 5.88 6.89 8.72 8.29 7.31 9.31
PBIDTM (%) 16.48 17.76 17.58 16.94 17.21 16.36 17.93 16.93 19.14
PBDTM (%) 14.22 15.57 15.31 14.58 15.14 14.83 16.16 15.09 17.48
APATM (%) 8.56 9.32 8.25 7.79 8.32 8.1 9.04 8.46 9.43
ROCE (%) 13.1 14.4 14.24 13.27 12.83 11.57 13.52 14.71 18.28
RONW (%) 11.62 12.17 11.2 10.97 10.43 9.05 10.22 10.7 13.59
EV/EBIDTA 21.39 20.89 18.32 16.23 15.64 11.92 15.77 14.46 20.69
The debt equity ratio over the years has increased due to increase in capital
expenditure by the company to expand its capacity and absorb technological
advancements to provide good quality of services. But the company is able to control
and keep a check on this ratio, thus, not affecting its profitability in major aspects.
The current ratio helps in knowing the capability of the company to meet its short
term liabilities with the help of short term assets. The company has a current ratio of
above 1 over the period which means the company is able to meet its short term
obligations with the help of short term assets.
The turnover ratios indicates the capability of the management to effectively manage
its assets and provide better return to the shareholders.
The interest coverage ratio of above 1 indicates that the company is able to fund its
interest payments from its profits but over the period, the ratio is decreasing which is
due to increase in capital expenditure which is funded through a mix debt and internal
funding.
The company is able to maintain a profitability margin of 10-15% over the years by
managing its sources of revenue and expenses properly.
The ratio of EV/EBIDTA has improved over the years which indicates that the
company is able to efficiently manage its EBIDTA which is positively contributing
towards the enterprise value of the company. This indicates increase in shareholder’s
wealth.
Page 22
22 | P a g e
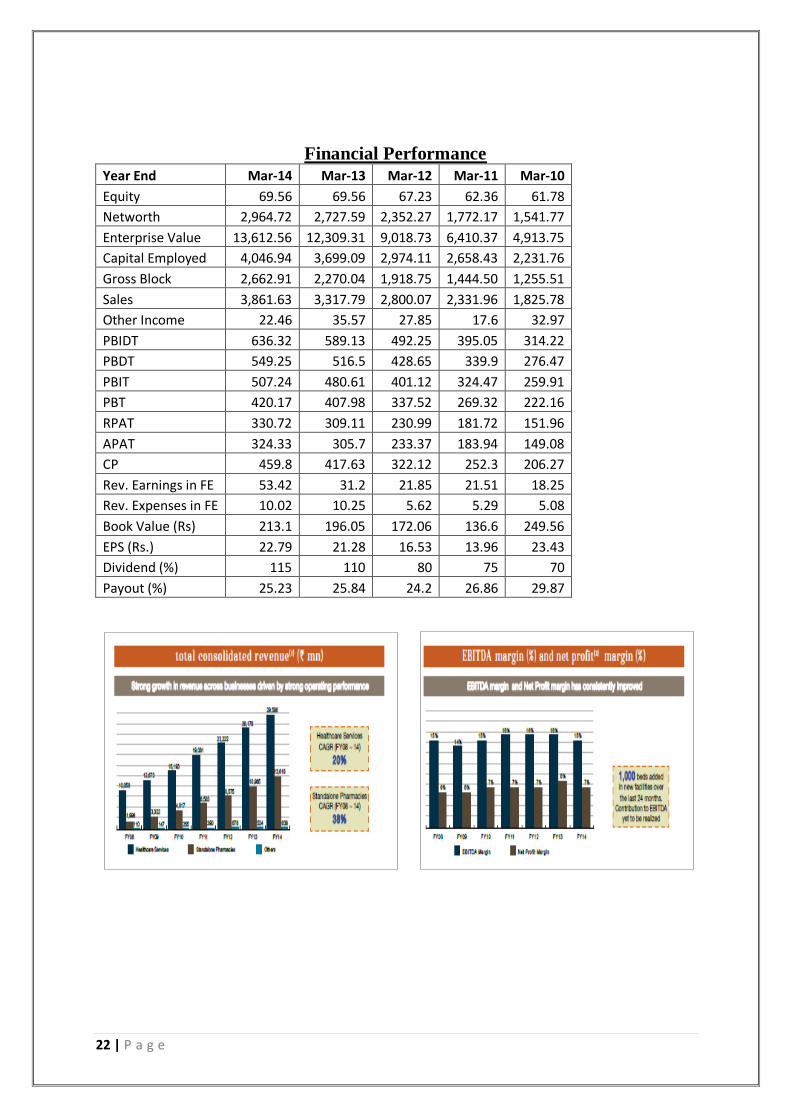
Financial Performance
Year End Mar-14 Mar-13 Mar-12 Mar-11 Mar-10
Equity 69.56 69.56 67.23 62.36 61.78
Networth 2,964.72 2,727.59 2,352.27 1,772.17 1,541.77
Enterprise Value 13,612.56 12,309.31 9,018.73 6,410.37 4,913.75
Capital Employed 4,046.94 3,699.09 2,974.11 2,658.43 2,231.76
Gross Block 2,662.91 2,270.04 1,918.75 1,444.50 1,255.51
Sales 3,861.63 3,317.79 2,800.07 2,331.96 1,825.78
Other Income 22.46 35.57 27.85 17.6 32.97
PBIDT 636.32 589.13 492.25 395.05 314.22
PBDT 549.25 516.5 428.65 339.9 276.47
PBIT 507.24 480.61 401.12 324.47 259.91
PBT 420.17 407.98 337.52 269.32 222.16
RPAT 330.72 309.11 230.99 181.72 151.96
APAT 324.33 305.7 233.37 183.94 149.08
CP 459.8 417.63 322.12 252.3 206.27
Rev. Earnings in FE 53.42 31.2 21.85 21.51 18.25
Rev. Expenses in FE 10.02 10.25 5.62 5.29 5.08
Book Value (Rs) 213.1 196.05 172.06 136.6 249.56
EPS (Rs.) 22.79 21.28 16.53 13.96 23.43
Dividend (%) 115 110 80 75 70
Payout (%) 25.23 25.84 24.2 26.86 29.87
Page 23
23 | P a g e
ROCE= Efficiency (Asset Turnover) * Profitability
Efficiency (Asset turnover) due to efficient use of capital
Lower investment per bed
Strong project execution capabilities
Higher utilization of key facilities and equipment
Quick ramp up of new hospitals- increasing patient flow and occupancy
Profitability due to increasing revenues as
Balanced out- patient and in- patient mix
Reduced average length of stay across the portfolio
Increasing average revenue per occupied bed by CAGR of 8.7% over the last 6 years
Improving case mix
VALUATION
Annualised daily volatility over one year: 0.276715
Beta (β) using last 3 year data: 0.315
Calculation of growth rate:
Year DPS EPS Retention
Ratio ROCE Growth rate "g"
Mar-09 6.5 9.9 34.34% 11.57% 3.97%
Mar-10 7 12.31 43.14% 12.83% 5.53%
Mar-11 3.75 14.66 74.42% 13.27% 9.88%
Mar-12 4 17.72 77.43% 14.24% 11.03%
Mar-13 5.5 22.43 75.48% 14.40% 10.87%
Mar-14 5.75 22.77 74.75% 13.10% 9.79%
Average 8.51%
Assumptions: In order to calculate constant growth rate, average of 6 years is taken in
accordance to company’s policy of dividend and retained earnings.
Page 24
24 | P a g e
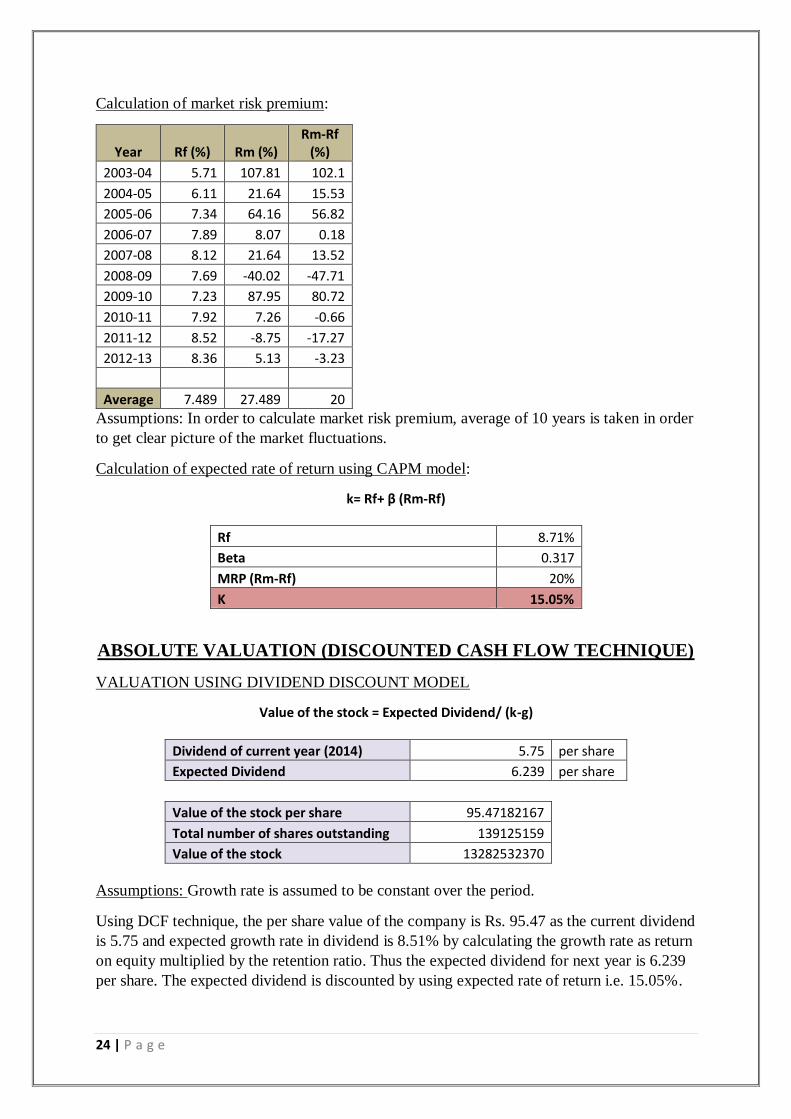
Calculation of market risk premium:
Year Rf (%) Rm (%) Rm-Rf
(%)
2003-04 5.71 107.81 102.1
2004-05 6.11 21.64 15.53
2005-06 7.34 64.16 56.82
2006-07 7.89 8.07 0.18
2007-08 8.12 21.64 13.52
2008-09 7.69 -40.02 -47.71
2009-10 7.23 87.95 80.72
2010-11 7.92 7.26 -0.66
2011-12 8.52 -8.75 -17.27
2012-13 8.36 5.13 -3.23
Average 7.489 27.489 20
Assumptions: In order to calculate market risk premium, average of 10 years is taken in order
to get clear picture of the market fluctuations.
Calculation of expected rate of return using CAPM model:
k= Rf+ β (Rm-Rf)
Rf 8.71%
Beta 0.317
MRP (Rm-Rf) 20%
K 15.05%
ABSOLUTE VALUATION (DISCOUNTED CASH FLOW TECHNIQUE)
VALUATION USING DIVIDEND DISCOUNT MODEL
Value of the stock = Expected Dividend/ (k-g)
Dividend of current year (2014) 5.75 per share
Expected Dividend 6.239 per share
Value of the stock per share 95.47182167
Total number of shares outstanding 139125159
Value of the stock 13282532370
Assumptions: Growth rate is assumed to be constant over the period.
Using DCF technique, the per share value of the company is Rs. 95.47 as the current dividend
is 5.75 and expected growth rate in dividend is 8.51% by calculating the growth rate as return
on equity multiplied by the retention ratio. Thus the expected dividend for next year is 6.239
per share. The expected dividend is discounted by using expected rate of return i.e. 15.05%.
Page 25
25 | P a g e
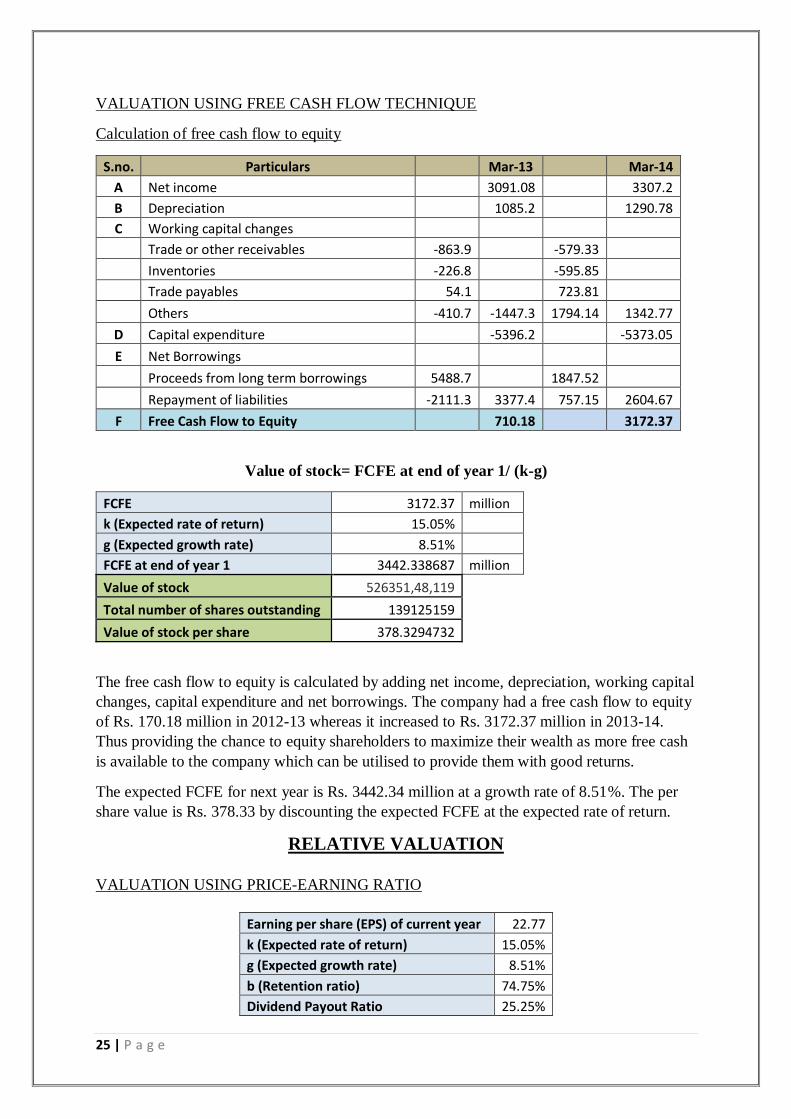
VALUATION USING FREE CASH FLOW TECHNIQUE
Calculation of free cash flow to equity
S.no. Particulars Mar-13 Mar-14
A Net income 3091.08 3307.2
B Depreciation 1085.2 1290.78
C Working capital changes
Trade or other receivables -863.9 -579.33
Inventories -226.8 -595.85
Trade payables 54.1 723.81
Others -410.7 -1447.3 1794.14 1342.77
D Capital expenditure -5396.2 -5373.05
E Net Borrowings
Proceeds from long term borrowings 5488.7 1847.52
Repayment of liabilities -2111.3 3377.4 757.15 2604.67
F Free Cash Flow to Equity 710.18 3172.37
Value of stock= FCFE at end of year 1/ (k-g)
FCFE 3172.37 million
k (Expected rate of return) 15.05%
g (Expected growth rate) 8.51%
FCFE at end of year 1 3442.338687 million
Value of stock 526351,48,119
Total number of shares outstanding 139125159
Value of stock per share 378.3294732
The free cash flow to equity is calculated by adding net income, depreciation, working capital
changes, capital expenditure and net borrowings. The company had a free cash flow to equity
of Rs. 170.18 million in 2012-13 whereas it increased to Rs. 3172.37 million in 2013-14.
Thus providing the chance to equity shareholders to maximize their wealth as more free cash
is available to the company which can be utilised to provide them with good returns.
The expected FCFE for next year is Rs. 3442.34 million at a growth rate of 8.51%. The per
share value is Rs. 378.33 by discounting the expected FCFE at the expected rate of return.
RELATIVE VALUATION
VALUATION USING PRICE-EARNING RATIO
Earning per share (EPS) of current year 22.77
k (Expected rate of return) 15.05%
g (Expected growth rate) 8.51%
b (Retention ratio) 74.75%
Dividend Payout Ratio 25.25%
Page 26
26 | P a g e
Value of stock= Expected EPS at end of year 1 * Justified P/E
Justified P/E= Dividend Payout Ratio/(k-g)
Expected EPS at end of year 1 24.70773
Justified P/E 3.860856
Value of stock per share 95.39298
Using relative valuation technique of price-earnings ratio, the per share value is Rs. 95.39.
The justified P/E is taken out by using Dividend payout ratio discounted at expected rate of
return adjusted for growth. Other methods of justified P/E does not fit into this company as
the company does not have clear competitor as it is market leader and no competition exists
as it has a diversified portfolio.
TARGET PRICE is derived by the average of the valuation done on the basis of all the
above techniques.
Particulars Value per share (Rs)
DCF 95.47
FCFE 378.33
P/E 95.39
Target price 189.73
STANDALONE FINANCIALS: APOLLO HOSPITALS
ENTERPRISES LTD.
Balance Sheet (Rs. In crs)
Year Mar 14 Mar 13 Mar 12
SOURCES OF FUNDS :
Share Capital 69.56 69.56 67.23
Reserves Total 2,895.16 2,658.03 2,246.33
Equity Share Warrants 0 0 38.71
Total Shareholders Funds 2,964.72 2,727.59 2,352.27
Secured Loans 853.25 863.48 374.22
Unsecured Loans 226.21 104.26 242.84
Total Debt 1,079.46 967.74 617.06
Other Liabilities 2.76 3.77 4.78
Total Liabilities 4,046.94 3,699.10 2,974.11
APPLICATION OF FUNDS :
Gross Block 2,662.91 2,270.04 1,918.75
Less : Accumulated Depreciation 674.21 578.53 482.75
Net Block 1,988.70 1,691.51 1,436.00
Capital Work in Progress 480.96 372.73 200.94
Investments 690.03 896.04 764.12
Current Assets, Loans & Advances
Page 27
27 | P a g e
Inventories 264.97 205.39 182.71
Sundry Debtors 468.45 426.61 353.77
Cash and Bank 208.9 255.47 186.96
Loans and Advances 266.97 183.89 123.5
Total Current Assets 1,209.30 1,071.35 846.94
Less : Current Liabilities and Provisions
Current Liabilities 349.15 300.45 271.11
Provisions 131.64 115.44 77.32
Total Current Liabilities 480.79 415.88 348.43
Net Current Assets 728.51 655.47 498.51
Deferred Tax Liability 328.86 239.41 170.09
Net Deferred Tax -328.86 -239.41 -170.09
Other Assets 487.61 322.76 244.63
Total Assets 4,046.95 3,699.10 2,974.11
Contingent Liabilities 279.55 152.23 224.5
Profit and loss statement (Rs. In crs)
Year Mar-14 Mar 13 Mar 12
INCOME :
Sales Turnover 3,861.63 3,317.79 2,800.07
Net Sales 3,861.63 3,317.79 2,800.07
Other Income 22.46 35.57 27.85
Stock Adjustments 45.99 8.43 19.07
Total Income 3,930.08 3,361.79 2,846.99
EXPENDITURE :
Raw Materials 2,047.88 1,728.25 1,474.54
Power & Fuel Cost 74.29 60.83 48.77
Employee Cost 610.22 524.4 428.51
Other Manufacturing Expenses 96.48 79.33 51.48
Selling and Administration Expenses 365.1 301.03 325.13
Miscellaneous Expenses 99.79 78.83 26.31
Total Expenditure 3,293.76 2,772.67 2,354.74
Operating Profit 636.32 589.13 492.25
Interest 87.07 72.63 63.6
Gross Profit 549.25 516.5 428.65
Depreciation 129.08 108.52 91.13
Profit Before Tax 420.17 407.98 337.52
Tax 0 29.55 43.55
Deferred Tax 89.45 69.33 62.98
Reported Net Profit 330.72 309.11 230.99
Extraordinary Items 6.39 3.41 -2.38
Adjusted Net Profit 324.33 305.7 233.37
Adjst. below Net Profit 0 -2.17 0
P & L Balance brought forward 230.67 176.25 164.77
Appropriations 244.84 252.52 219.51
Page 28
28 | P a g e
P & L Balance carried down 316.55 230.67 176.25
Dividend 80 76.52 53.79
Equity Dividend % 115 110 80
Earnings Per Share-Unit Curr 22.79 21.28 16.53
Book Value-Unit Curr 213.1 196.05 172.06
Cash flow statement
Particulars ( Rs. In crs) Mar-14 Mar-13 Mar-12
Cash and Cash Equivalents at Beginning of the year 255.47 186.96 141.44
Net Cash from Operating Activities 303.08 332.56 306.17
Cash Flow From Operating Activities
Net Profit before Tax & Extraordinary Items 420.17 407.98 337.52
Adjustment For
Depreciation 129.07 108.52 91.13
Interest (Net) 82.67 55.18 49.24
Dividend Received -3.69 -8.95 -13.15
P/L on Sales of Assets 2.81 3.81 3.73
P/L on Sales of Invest -13.67 -9.18 0.09
Prov. & W/O (Net) 16.09 13.55 14.45
P/L in Forex -0.69 0.14 -0.43
Others 0.22 -4.35 0
Total Adjustments (PBT & Extraordinary Items) 212.81 158.72 145.06
Op. Profit before Working Capital Changes 632.98 566.7 482.58
Adjustment For
Trade & 0th receivables -57.93 -86.39 -98.58
Inventories -59.59 -22.68 -32.19
Trade Payables 72.38 5.41 -8.46
Others -179.41 -41.27 24.82
Total (OP before Working Capital Changes) -224.55 -144.93 -114.41
Cash Generated from/(used in) Operations 408.43 421.77 368.17
Direct Taxes Paid -106.03 -89.07 -62.43
Others 0.68 -0.14 0.43
Total-others -105.35 -89.21 -62
Cash Flow before Extraordinary Items 303.08 332.56 306.17
Net Cash Used in Investing Activities -309.53 -
631.42 -445.92
Cash Flow from Investing Activities
Investment in Assets :
Purchased of Fixed Assets -537.3 -539.62 -340.78
Financial/Capital Investment :
Page 29
29 | P a g e
Purchase of Investments -22.5 -356 -678.41
Sale of Investments 258.84 271.31 664.34
Interest Received 4.4 17.45 14.36
Dividend Received 3.69 8.95 13.15
Invest.In Subsidiaires -16.66 -38.06 -126.03
Others 0 4.55 0
Net Cash Used in Financing Activities -40.12 367.37 185.27
Cash Flow From Financing Activities
Proceeds:
Proceeds from Issue of shares (incl share premium) 0 157.91 411.63
Proceed from 0ther Long Term Borrowings 184.75 548.87 116.55
Proceed from Short Tem Borrowings 14.43 0 4.98
Payments:
Of financial Liabilities -75.71 -211.13 -237.52
Dividend Paid -76.52 -55.65 -46.77
Interest Paid -87.07 -72.63 -63.6
Net Cash Used in Financing Activities -40.12 367.37 185.27
Net Inc/(Dec) in Cash and Cash Equivalent -46.57 68.51 45.52
Cash and Cash Equivalents at End of the year 208.9 255.47 186.96