27
1 | Ivy Tech Community College Environmental Scan 2017 Ivy Tech Community College Environmental Scan January 2017

1 | Ivy Tech Community College Environmental Scan 2017
Ivy Tech Community College Environmental Scan
January 2017

2 | Ivy Tech Community College Environmental Scan 2017
Table of Contents Executive Summary ...................................................................................................................................... 4
Background ................................................................................................................................................... 5
Social Trends ................................................................................................................................................. 6
Population Growth .................................................................................................................................... 6
Generations and Influencing Factors for Growth and Delivery ................................................................ 8
Baby Boomers ............................................................................................................................................... 8
Generation X ................................................................................................................................................. 9
Millennials ..................................................................................................................................................... 9
Generation Z ................................................................................................................................................. 9
Hispanic/Latino Students ............................................................................................................................ 11
Universal Design for Learning ..................................................................................................................... 11
Poverty ........................................................................................................................................................ 12
Education Outcomes ............................................................................................................................... 12
Transfer ....................................................................................................................................................... 13
Reverse Transfer ......................................................................................................................................... 14
Competency Based Education .................................................................................................................... 14
Workforce ................................................................................................................................................... 15
Technology Trends ..................................................................................................................................... 15
Access to Physical Technology ................................................................................................................ 15
Industry Technology Trends .................................................................................................................... 16
Technology Related to Learning ............................................................................................................. 17
Economic Trends ........................................................................................................................................ 18
State Appropriations and Tuition Trends ................................................................................................ 18
Financial Aid Innovations ........................................................................................................................ 19
Access to Benefits and Free College ....................................................................................................... 19
Return on Investment ............................................................................................................................. 20
Philanthropy ............................................................................................................................................ 21
Environmental Space Trends ..................................................................................................................... 21
Classroom Design .................................................................................................................................... 21
Green Buildings ....................................................................................................................................... 22
3 | Ivy Tech Community College Environmental Scan 2017
Campus Security ...................................................................................................................................... 22
Minority & Women Owned Businesses .................................................................................................. 23
Policy Trends .............................................................................................................................................. 23
Conclusion .................................................................................................................................................. 23
References .................................................................................................................................................. 24

4 | Ivy Tech Community College Environmental Scan 2017
Executive Summary
The landscape in which higher education operates is on the verge of change with new institutional, state, and national leadership. To this end, the Ivy Tech State Board of Trustees and its leaders will undertake a new strategic planning process. The following environmental scan will review key external factors that influence the College. The model looks at higher education trends, following an outline adopted by the Society of College and University Planning focusing on Social, Technological, Economic, Environmental, and Political factors that impact the College’s operations.
Indiana will see uneven population growth and decline across the state. Census projections show that 95 percent of Indiana’s projected growth between 2010 and 2030 will come from just 22 of the 92 counties, most being in Central Indiana (IBRC, 2016). Additionally, experiences, learning preferences, and work styles vary between generations – The Baby Boomers, who are the oldest of college students and workers, to Generation Z who make up the school-aged population and are just now enrolling on college campuses (Seemiller & Grace, 2016). Much of the growth of the school-aged population is due to changing demographics and a dramatic increase in Hispanic/Latino students (Seemiller & Grace, 2016). Students also come with a variety of experiences including effects of poverty and an exposure to Universal Design for Learning (Kids Count in Indiana, 2016; Samuels, 2016). Education outcomes across the generations of students will focus on both transfer to a baccalaureate degree and job placement.
Indiana residents face disproportional access to broadband and the internet, which is a barrier to learning and finding a job (IBRC, 2016). Additionally, higher education leaders will focus on key technology trends – information security, data analytics, and technology related to learning. In the era of big data and data warehouses at colleges and universities, leaders are concerned about protective privacy and the integrity of data. The abundance of data also reiterates the importance being able to analyze it to make informed decisions. Finally, data tools are being used to keep students on track to completion and into the workforce (Game Changers, 2013).
Economic trends include declines, nationwide, in state appropriations and funding for higher education (SHEEO, 2015), innovations in federal financial aid to better meet the needs of students (Cowley, 2016; U.S. Department of Education, 2016), the need for low income students to access additional forms of aid, a focus on the return on investment for higher education, and an increased reliance on philanthropy to meet budget gaps.
On-line learning, hybrid classrooms and changing student expectations are causing facilities leaders in higher education to rethink campus space. Classrooms fitted with upgraded technology and moveable furniture are becoming more common (Lee, 2016). Energy efficient buildings and practices are also increasing in popularity as institutional leaders find ways to close budget gaps (Kovac, 2009). Two final physical space implications come from campus security, and in Indiana, a projected focus on using Minority- and Women-Owned contractors for services.
Finally, 2016 brought changes in the political landscape in Indiana and at the national level. For now, it is too early to tell what the major implications will be for higher education. We will continue to watch as policies and positions develop in Indiana with the new Governor and Superintendent of Public Instruction and with the new President, at the national level. Additionally, this year may bring the reauthorization of the Higher Education Act, which will have implications for financial aid and other higher education policies.

5 | Ivy Tech Community College Environmental Scan 2017
Ivy Tech Community College of Indiana Environmental Scan
Background
Nearly eight years ago, Ivy Tech Community College (the College) leaders made student success and completion the central strategy for faculty, students, and staff. By engaging hundreds of faculty, staff, students, and community members, the College shifted its focus from enrollment and retention – staying enrolled, to persistence – making meaningful progress toward a credential or degree – and completion – achieving educational objectives of transferring, earning certificates or workforce certifications, and completing associate degrees. Despite a declining enrollment, the increased focus on persistence and completion enabled more students to earn credentials and degreesi.
The College participated in several national initiatives and pilot programs through Achieving the Dream (ATD), Complete College America (CCA), the Indiana Commission for Higher Education (The Commission), the Dana Center at the University of Texas, the College Board, Lumina Foundation for Education (Lumina), Black Board, Starfish, the Department of Workforce Development, and through internal strategy committees. These initiatives targeted student retention and completion – as the national conversation moved in this direction, Ivy Tech faculty, students, and staff rose to the occasion.
In addition to the academic changes, College leaders implemented a number of administrative changes designed to improve student interaction and increase quality and efficiencies. Among these changes include regional administrative consolidation; streamlined, state-wide budgeting; outsourcing relationships such as the bookstore and IT helpdesk; development and implementation of continuous process improvement (Lean Higher Education model); creation of express enrollment centers and answer center to improve service to students and cross-training of front-line staff; improved employee benefits; a new website and marketing campaign; centralization of the Office of Information Technology and the development of online courses; the creation of a data warehouse; standardization of desk phones, Wi-Fi, and desktop equipment; development of wrap around service pilot programs; growing philanthropic giving; and expanded/upgraded facilities that better meet student needs.
In 2016, Ivy Tech ushered in new leadership and the State Board of Trustees selected Dr. Sue Ellspermann as its president. At the same time, national initiatives and state legislation called for a greater alignment between community colleges and workforce outcomes. Since the end of the recession in 2010/2011, “the economy has added 11.6 million jobs…11.5 million, or 99 percent of them have gone to workers with at least some college education” (Carnevale, Jayasundra, & Gulish, 2016, p. 7). And, workers with a bachelor’s degree or higher fared even better in the recession and post-recession economy. Today, for the first time, workers with a bachelor’s degree or higher make up a larger proportion of the workforce (36%) than workers with a high school diploma or less (34%). This marks the continued turning away from the industrial economy of the past that largely employed workers with a high school education” (Carnevale, et al, 2016, p. 10).
Community college work that aligns technical education with middle skills jobs and that prepares students to transfer is more important to the student and the economy than ever. Student demographics and enrollment patterns are changing as a new generation, Generation Z, enters college
6 | Ivy Tech Community College Environmental Scan 2017
for the first time. The state and nation see new leadership with implications for the K-12 pipeline and alignment and federal policies that can impact enrollment, financial aid, and staffing.
This paper, Ivy Tech Community College Environmental Scan -- 2016, will focus on external factors that influence the environment in which the College operates. The format follows a model, created by the Society for College and University Planning, to which Ivy Tech is a member. This model looks at trends in higher education in the following realms: Social, Technological, Economic, Environmental, and Policy (STEEP) (SCUP, 2016). This scan will help inform the creation and implementation of a new College strategic plan to guide and monitor progress toward strategies, goals, and metrics that improve education and workforce outcomes for students and drive Indiana’s economy in a positive direction.
Social Trends
In 2005, Ivy Tech became the comprehensive community college serving Indiana with a differentiated mission to provide liberal arts and general studies education with a transfer outcome, technical training to meet workforce needs, and on-going continuing education for Hoosiers. The College adopted the following mission:
Ivy Tech Community College prepares Indiana residents to learn, live, and work in a diverse and globally competitive environment by delivering professional, technical, transfer, and lifelong education. Through its affordable, open-access education and training programs, the College enhances the development of Indiana's citizens and communities and strengthens its economy.
Social trends address the question: Who are the students coming to us? At Fall 2016 Census, the College enrolled 60 percent traditional-aged students (ages 24 and younger) and 40 percent adult students (25 and older).ii With a goal to help students achieve their educational objectives to transfer or prepare for the workforce, the College must adapt to the economic, social, cultural, generational, and educational realities of its students. This section will discuss who the College’s current and prospective students are and where they are projected to live in the state.
Population Growth
From 2010 to 2050, “Indiana’s population will increase 15 percent – from 6.48 million to 7.48 million residents – according to population projections released by the Indiana Business Research Center (Kinghorn, 2012). Between 2010 and 2030, analysts project that Marion and the contiguous counties will account for 64 percent of the total population growthiii (Indiana Business Research Center, 2016, Appendix B). This trend builds on the growth in the Indianapolis Region from 2000-2010 where 10 counties in Central Indiana accounted for 57 percent of the state’s growth (Kinghorn, 2012). These same counties “could claim up to 70 percent of growth” through 2050”iv (Kinghorn, 2012, p. 1). The map below illustrates the growth. Six counties will see growth exceeding 40 percent and 16 will see growth between 10 and 40 percent. Forty-nine counties will see population declines.

7 | Ivy Tech Community College Environmental Scan 2017
Projected Population Change by County, 2010 to 2050 (Kinghorn, 2012, p. 3)
8 | Ivy Tech Community College Environmental Scan 2017
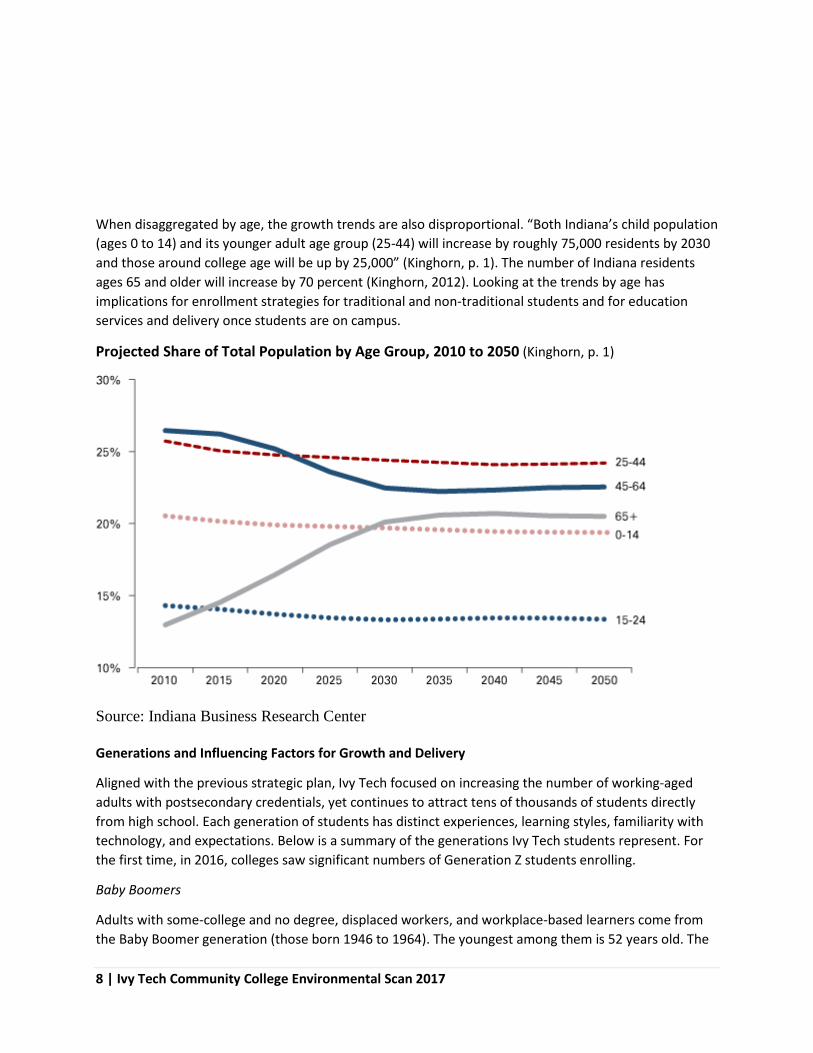
When disaggregated by age, the growth trends are also disproportional. “Both Indiana’s child population (ages 0 to 14) and its younger adult age group (25-44) will increase by roughly 75,000 residents by 2030 and those around college age will be up by 25,000” (Kinghorn, p. 1). The number of Indiana residents ages 65 and older will increase by 70 percent (Kinghorn, 2012). Looking at the trends by age has implications for enrollment strategies for traditional and non-traditional students and for education services and delivery once students are on campus.
Projected Share of Total Population by Age Group, 2010 to 2050 (Kinghorn, p. 1)
Source: Indiana Business Research Center
Generations and Influencing Factors for Growth and Delivery
Aligned with the previous strategic plan, Ivy Tech focused on increasing the number of working-aged adults with postsecondary credentials, yet continues to attract tens of thousands of students directly from high school. Each generation of students has distinct experiences, learning styles, familiarity with technology, and expectations. Below is a summary of the generations Ivy Tech students represent. For the first time, in 2016, colleges saw significant numbers of Generation Z students enrolling.
Baby Boomers
Adults with some-college and no degree, displaced workers, and workplace-based learners come from the Baby Boomer generation (those born 1946 to 1964). The youngest among them is 52 years old. The
9 | Ivy Tech Community College Environmental Scan 2017
generation is defined by goals of home ownership, cars, and material possessions (Seemiller & Grace, 2016). As the largest generation (nearly 75 million), members are driven to succeed and have an 8-5 work ethic (Seemiller & Grace, 2016). Most Millennials have parents from this generation. The looming retirement of Baby Boomers will continue to impact the workforce.
Generation X
Generation X (those born 1965-1980) also comprises the adults with some-college and no degree, displaced workers, and workplace-based learners at the College. Unlike the Baby Boomers, Generation X is smaller (50 million), with the youngest of them in their late 30s. Defining characteristics of this generation are seeing a 25 percent increase in women in the workforce compared to the Baby Boomers, surviving as latchkey kids, transitioning from typewriter to personal computer, and fighting for work/family balance (Seemiller & Grace, 2016). Within the family structure, Generation X grew up with more divorce and 71 percent have their own children, mostly in Generation Z (Seemiller & Grace, 2016).
Millennials (Generation Y)
The Millennial Generation (those born 1981 to the mid-1990s) rivals the Baby Boomers in size and is also dubbed the “me generation” or entitled generation (Seemiller & Grace, 2016). The generation is in its 20s now and experienced a trophy-for-everyone mentality (Seemiller & Grace, 2016). The Millennials tend to have high career expectations that include pay and work-life balance, which manifests itself in changing jobs frequently in search of something better that they believe they deserve (Seemiller & Grace, 2016). This generation also served as early adopters to social media and receive a tremendous amount of support from their families (Seemiller & Grace, 2016).
Generation Z
Generation Z is the newest to start college (those born late 1990s-2010). These students are participating in dual credit and early college programs now and some are starting to enroll on campus. The generation is shaped by the internet and is 25 percent of the current U.S. population (growing to 33 percent by 2020) (Seemiller & Grace, 2016). The generation is the most racially diverse and will likely be the last defined generation that is a majority Caucasian (Seemiller & Grace, 2016). Data indicates that since 2000, there has been a 400 percent increase in black/white marriages, a 1,000 percent increase in Asian/white marriages, a 50 percent increase in multi-racial youth, and a projected 7.6 percent increase in the number of Hispanic teens from 2014-2019 (Honey & Sparks, 2014). “Research shows that multi-racial children tend to be high achievers with a strong sense of self and adaptability to change” (Honey & Sparks, 2014). According to Seemiller & Grace (2016, p. 10), additional characteristics of this generation include the following:
• Open-minded – due to changing demographics and “believing more diversity in America is a good thing”.
• Compassionate – technology and access to information brings world tragedies “home” and can personalize far-away situations.
• Loyal – 85 percent self-describe this characteristic. This generation lived through the recession and high unemployment and may be more loyal to employers and may stay in jobs longer than millennials.

10 | Ivy Tech Community College Environmental Scan 2017
• Driven – the tide is turning from the participation-trophy mentality. Kids born post-September 11, 2001 tend to be more responsible and driven because of the “if not us, then who?” mentality.
• Entrepreneurial – also a result of living through the recession – this generation seeks knowledge and are driven to problem-solve.
• Always plugged in communication via text and pictures (emoji), reliant on social media for research, ability to multi-task (on up to five screens at once), and have short attention spans.
• 83 percent prefer face-to-face communication for friends and learning. • 25 percent do not like to use email at all. • Prefer logic-based, math-based, and experiential learning in an education setting. • Prefer to learn independently, at their own pace, but with rails to stay on track and to check
progress (facilitated learning integrated with technology). • Are not as creative as past generations, as all of their school-based learning came after No Child
Left Behind and a curriculum driven by standardized tests.
The following graph illustrates the American population, by generation (Sparks & Honey, 2014).
Hispanic/Latino Students
Indiana ranks 21st in the nation in the total population of Hispanics with 426,000 now residing in the state (Pew, 2014). Of students enrolled in Indiana schools K-12, 112,000 identify as Hispanic, compared
11 | Ivy Tech Community College Environmental Scan 2017
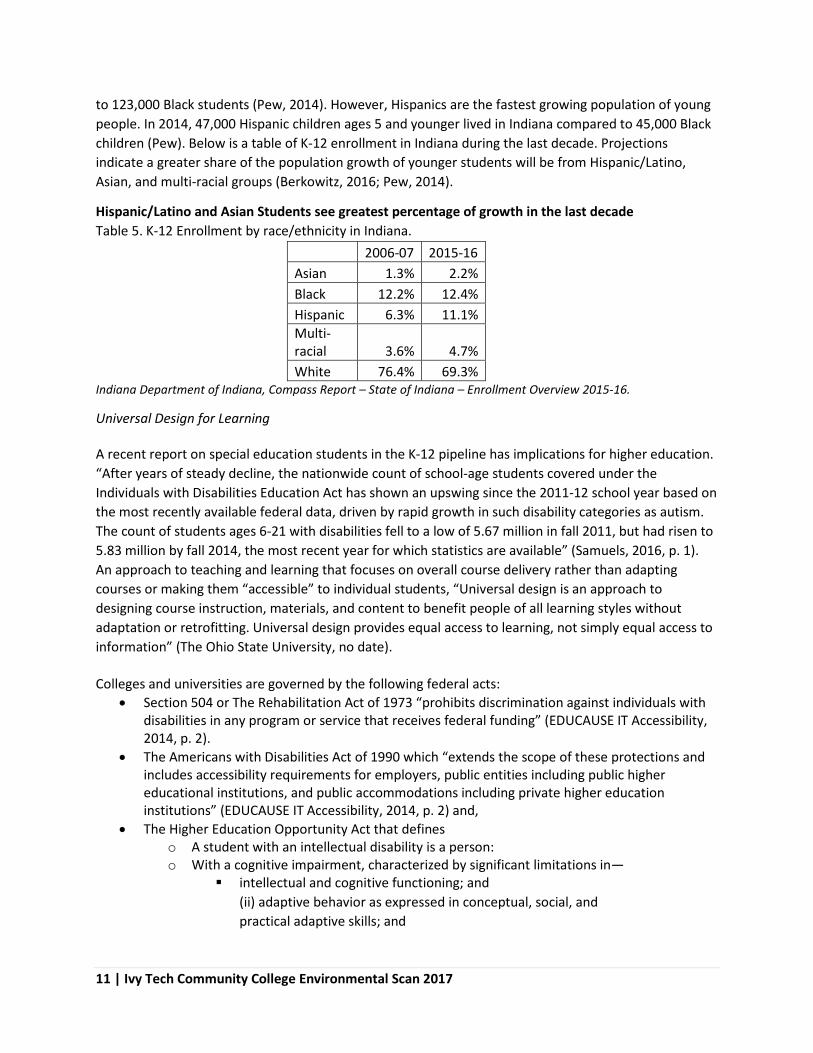
to 123,000 Black students (Pew, 2014). However, Hispanics are the fastest growing population of young people. In 2014, 47,000 Hispanic children ages 5 and younger lived in Indiana compared to 45,000 Black children (Pew). Below is a table of K-12 enrollment in Indiana during the last decade. Projections indicate a greater share of the population growth of younger students will be from Hispanic/Latino, Asian, and multi-racial groups (Berkowitz, 2016; Pew, 2014).
Hispanic/Latino and Asian Students see greatest percentage of growth in the last decade Table 5. K-12 Enrollment by race/ethnicity in Indiana.
2006-07 2015-16 Asian 1.3% 2.2% Black 12.2% 12.4% Hispanic 6.3% 11.1% Multi-racial 3.6% 4.7% White 76.4% 69.3%
Indiana Department of Indiana, Compass Report – State of Indiana – Enrollment Overview 2015-16.
Universal Design for Learning A recent report on special education students in the K-12 pipeline has implications for higher education. “After years of steady decline, the nationwide count of school-age students covered under the Individuals with Disabilities Education Act has shown an upswing since the 2011-12 school year based on the most recently available federal data, driven by rapid growth in such disability categories as autism. The count of students ages 6-21 with disabilities fell to a low of 5.67 million in fall 2011, but had risen to 5.83 million by fall 2014, the most recent year for which statistics are available” (Samuels, 2016, p. 1). An approach to teaching and learning that focuses on overall course delivery rather than adapting courses or making them “accessible” to individual students, “Universal design is an approach to designing course instruction, materials, and content to benefit people of all learning styles without adaptation or retrofitting. Universal design provides equal access to learning, not simply equal access to information” (The Ohio State University, no date). Colleges and universities are governed by the following federal acts:
• Section 504 or The Rehabilitation Act of 1973 “prohibits discrimination against individuals with disabilities in any program or service that receives federal funding” (EDUCAUSE IT Accessibility, 2014, p. 2).
• The Americans with Disabilities Act of 1990 which “extends the scope of these protections and includes accessibility requirements for employers, public entities including public higher educational institutions, and public accommodations including private higher education institutions” (EDUCAUSE IT Accessibility, 2014, p. 2) and,
• The Higher Education Opportunity Act that defines o A student with an intellectual disability is a person: o With a cognitive impairment, characterized by significant limitations in—
intellectual and cognitive functioning; and (ii) adaptive behavior as expressed in conceptual, social, and practical adaptive skills; and

12 | Ivy Tech Community College Environmental Scan 2017
o Who is currently, or was formerly, eligible for a free appropriate public education under the Individuals with Disabilities Education Act. (HEOA, 2008) (Thompson, Weir & Ashmore, 2011, p. 1).
The United States Department of Education reports “More and more high school students with disabilities are planning to continue their education in postsecondary schools, including vocational and career schools, two- and four- year colleges, and universities” (U.S. Department of Education, 2011). With more students entering open access postsecondary institutions, number of adaptive technology solutions at colleges and universities are increasing. “IT accessibility is the ongoing process by which an organization ensures its current and future IT can be used effectively by everyone, including individuals with disabilities” (EDUCAUSE, IT Accessibility).
Poverty
The nation and the state have come out of a recession, yet the lower- and middle- income quartiles are not feeling the benefits of the recovery and are seeing a widening family wealth gap (Fry & Kochhar, 2014). More specifically, research shows changes in the economic well-being of the children and students in the pipeline. The Indiana Youth Institute reports that while the percentage of children in poverty from 2011 to 2014 declined (from 23 percent to 21.5 percent), the use of free lunches in public schools increased during the same time (30 percent to 41.2 percent) (Kids Count in Indiana, 2016). Additionally, monthly average number of families receiving Supplemental Nutrition Assistance Program help increased from 867,101 to 906,170 from 2011 to 2014 (Kids Count in Indiana, 2016). The percentage of students enrolled in special education held steady at just under 15 percent but the percent of English Language Learners grew from 4.9 percent to 5.5 percent (Kids Count in Indiana, 2016).
As leaders and policy-makers consider innovation and strategy directed at college students, generational differences, effects of poverty and the barriers they present, as well as the culture of high-stakes testing, state-mandated college and career readiness standards, workforce alignment, the continuing growth of dual credit and early college (earning college credits in high school) will impact the way in which traditional-aged students come to higher education. At the community college, serving the needs of the changing traditional-aged generation is also balanced with meeting the learning and workforce needs of adults entering the system. Once students are at the community college, institutions will serve them based on workforce or transfer (to a baccalaureate institution) outcomes desired.
Education Outcomes
Transfer
Community college students often times start their postsecondary education at these institutions with aspirations to transfer to a four-year institution to earn a baccalaureate degree, which has served as an indicator of the job security during the recession, and economic recovery post-recession (Carnevale, et al, 2016). Legislation in Indiana focuses easing the financial and time barriers students may face when transferring from one institution to another.
Senate Enrolled Act 182 for 2012 and 2013 established the Statewide Transfer General Education Core (STGEC) and Transfer Single Articulation Pathways (TSAP) to encourage and ease transfer for students in Indiana. The STGEC “is a collection of courses that are based upon a set of competencies in the areas of

13 | Ivy Tech Community College Environmental Scan 2017
Foundational Intellectual Skills and Ways of Knowing” (Fast Facts: STGEC, 2012). A summary of the requirements are listed below:
a) Students earn at least 30 credit hours (on the student transcript) with a minimum 2.0 grade point average.
b) Students must still apply to institutions and programs. c) Students who earn less than 30 credit hours must transfer credits course by course. d) All state colleges and universities participate and accept the STGEC. e) Transfer institutions may require students who do not meet a grade requirement to repeat the
course at the transfer institution.
Fast Facts: Statewide Transfer General Education Core (STGEC), Indiana Commission for Higher Education, 2012.
In the past two years, Ivy Tech students earned nearly 4,000 TGEC certificates. “In addition, Ivy Tech experienced growth in the number of students who transfer within one year of enrolling at Ivy Tech” (Student Success Report, 2016, p. 7).
The TSAP program is a second outcome of recent Indiana legislation on transfer. The TSAP focuses on transfer within a particular academic program. The programs implemented in 2015 include the following:
Business Administration Electrical Engineering Technology Computer Science Human Services and Social Work Criminal Justice Information Technology Early Childhood Education Mechanical Engineering Elementary Education Mechanical Engineering Technology Special Education Nursing
Fast Facts: Statewide Transfer General Education Core (STGEC), Indiana Commission for Higher Education, 2012.
Academic leaders in Indiana are developing the following TSAPs for implementation in 2017:
Biology Human Services Chemistry Sociology Psychology
Fast Facts: Transfer Single Articulation Pathway, Indiana Commission for Higher Education, 2013.
As with the STGEC program, these pathways require students to earn 60 credit hours with a minimum 2.0 grade point average. All TSAP degrees with the exception of nursing incorporate the full STGEC with the associate degree requirements. “However, a 2.0 cumulative GPA may not be enough to get a student admitted into a particular 4-year state educational institution or educational program within that state educational institution” (Fast Facts: TSAP, 2013). All public institutions participate in the program. If admitted into the four-year institution, students who complete the TSAP will be granted 60 hours of credit toward their baccalaureate degree in the same program area.

14 | Ivy Tech Community College Environmental Scan 2017
Complete College America (CCA), which launched in 2009, “is a national nonprofit with a mission to work with states to significantly increase the number of Americans with quality career certificates or college degrees and to close attainment gaps for traditionally under-represented populations” (The Game Changers, 2013). CCA identified five activities that states may undertake to increase college graduation and Guided Pathways to Success is one of these. Indiana, and subsequently Ivy Tech, participates in the CCA work to reduce the number of wasted credits students accumulate on their way to associate and baccalaureate degrees. These two transfer programs may feed into technology-enabled guided pathways for students in the future (The Game Changers, 2013).
Reverse Transfer
National Student Clearinghouse defines reverse transfer as “the transfer of credits from a four-year institution to any two-year institution from which a student transferred…If eligible, the student is awarded an associate degree” (National Student Clearinghouse, 2016). Reverse transfer initiatives are important because eligible students can be awarded a degree that reflects their level of credit hours earned and compete more successfully in higher education and the workforce. The Correctly Recognizing Educational Achievements to Empower (CREATE) Graduates Act, introduced in 2014, specifically encourages states to establish or expand reverse transfer programs (National Student Clearinghouse, 2016). The state of Indiana has not yet passed specific legislation mandating reverse transfer agreements among higher education institutions. Existing agreements are brokered between institutions. Ivy Tech currently has agreements with the following institutions: Indiana State University, Western Governors University, Purdue University, University of Phoenix, Ottawa University, and University of Southern Indiana.
Competency based education
Competency based education gives students credit for knowledge gained and mastered rather than by seat time and credit hour. Competencies can be defined as “acquiring skills and knowledge...to process that learning in a way that enables them to apply it in a variety of situations…competencies are clearly defined and measurable” (Klein-Collins, 2012). This blend of educational options may meet the diverse needs of students across generations and experiences. For those in the older generations (Baby Boomers and Generation X) who are trying to balance work and family life while also earning a college degree, competency based education potentially offers the benefits of being able to fit into their schedules while also allowing them to capitalize on the knowledge they have already gained in professional, volunteer, and civic participation – lessening the time they need to spend in the classroom or in other formalized learning experiences. For the younger generations (Millennials and Generation Z), the flexibility and individual control available in competency based education is often attractive. The education Gen Z students have received – largely standards based – may make it easier for them to transition to a learning experience where they clearly know the demands placed on them and can rise to meet those demands.
15 | Ivy Tech Community College Environmental Scan 2017
Workforce
Indiana ranks consistently in the top 10 for measures related to business climate and economic growth. Currently, the state ranks nationally in a number of indices. CNBC publishes America’s Top States for Business 2016 in which Indiana ranked first for cost of doing business and infrastructure (Cohn, 2016). Cost of doing business is takes into consideration the tax climate, utility costs, wages, office rental, and state-sponsored incentives for business (Cohn, 2016). In this index, infrastructure includes access to transportation, vitality of transportation systems (air, roads, rail, and waterway), commute time, and water system conditions (Cohn, 2016). Despite the number one ranking in these two areas, the state ranks low in workforce, education, and quality of life.
Quality of life measures livability – crime rates, inclusiveness, antidiscrimination protections, healthcare access and quality, and the overall health of the population (Cohn, 2016). Education measures focus on K-12 test scores, spending, and class size, and higher education measures considered are the number of higher education institutions and state funding trends for colleges and universities (Cohn, 2016). Workforce measures education level of the workers, productivity, training programs in place, union members, and right to work laws (Cohn, 2016). In addition to CNBC, Forbes ranks state business climate. Despite the overall 13th rank for best states for business, the index has Indiana at 45th in labor supply, as the college attainment rate lags behind the rest of the nation (Forbes, 2016).
Technological Trends
Changing technology is a pervasive driver of education and learning. While the Baby Boomers searched for resources through the Dewey Decimal system, Generation Xers were the first to transition from typewriters to personal computers, email, and the World Wide Web. Millennials gleaned information from blogging and were the first to use on-line gradebooks and learning management systems. Now, Generation Z is immersed in instant access to information and communication – expecting and using virtual student supports, on-line tutoring, practice tests, open access curriculum, how to videos, and gaming (Seemiller & Grace, 2016). This section will look at three areas of technology: access to physical technology, industry technology trends, and technology related to learning.
Access to Physical Technology
A 2014 U.S. Census population study indicates that 84 percent of Indiana’s households have at least one computer (IBRC: Data Utility, 2016). Of these households, 71 percent have broadband internet access, ranking Indiana 16th among states in access (IBRC: Data Utility, 2016). When disaggregating the data by household income, the access divide is apparent. Only 9 percent of households with incomes exceeding $75,000 are without internet access while 55 percent of homes reporting the lowest incomes are without internet. More than half of households with incomes of less than $20,000 do not have home internet access (IBRC: Data Utility, 2016).

16 | Ivy Tech Community College Environmental Scan 2017
Graph 2: Internet Access in Indiana – Households, by Income
Broadbandnow.com reports that Indiana has 86 percent broadband coverage, leaving 10 percent of households without access, regardless of ability to pay (2016). Among young people ages 12-17, 92 percent access the internet at least daily (Wartella, Rideout, Montague, Beaudoin-Ryan, and Lauricella, 2015). “In fact, adolescents and young adults have far surpassed all other age groups in internet use…71% of teens reporting that they use more than one social networking site…nearly 70% of youth ages 13-17 owing a smartphone” (Wartella, et al, 2015, p. 13). While internet access is critical to accessing information and on-line course delivery, it does not translate to the only way students prefer to work. For instance, “A 2013 study of college students found that if the cost was the same for print and digital books, 87 percent of undergraduate and graduate students would prefer the paper version” (SCUP Trends, 2016, p. 5).
Industry Technology Trends
In addition to personal access to technology, institutions operate in a changing technology environment. Three institutional areas are discussed below: Information security, data warehousing and analytics, and physical technology space on campus.
In 2016, EDUCAUSE, a nonprofit membership association serving higher education information technology professionals, listed information security at the top of its annual issues list. Within this topic, chief information officers, chief information security officers and IT staff at colleges and universities identified a) Ensuring faculty, students, and staff receive information security professional development, b) Developing an effective information security strategy that responds to campus culture and elevates concerns to senior leaders, and c) Planning for and implementing next-generation security and responding to threats as the top concerns in this category (Grama and Vogel, 2016).
Access to data, analytics, and analysis are a second trend for institutions. Achieving the Dream, a national network of community colleges focusing on student success and equity uses an Institutional
0% 20% 40% 60% 80% 100%
Less than $10,000
$10,000-$19,999
$20,000-$34,999
$35,000-$49,999
$50,000 to $74,999
Over $75,000
Households with Internet Access by Income Level

17 | Ivy Tech Community College Environmental Scan 2017
Capacity Tool (ICAT) to assess institutional readiness for change. Assessment questions related to data and technology are as follows:
Data 1. Does relevant data exist to inform decision-making? 2. Does reliable data exist to inform decisions? 3. Are data readily accessible to those who need it? 4. Are measures of student success defined, documented and used? 5. Are data collected at various points along the student experience continuum? 6. Are student success data translated into meaningful information? 7. Do data analyses yield insights about the past and future? Technology 8. Have student success technologies been adopted to improve student outcomes? Culture of Evidence 9. Do the Information Technology (IT) and Institutional Research (IR) staff collaborate to optimize processes for data use? 10. Does the college use benchmarking to identify strategies for improvement and innovation? 11. Does the college use data to examine and improve student outcomes? 12. Does the college evaluate student success initiatives to inform decision-making?
Achieving the Dream, ICAT Tool (Appendix E).v As access to big data and the emergence of data warehouses expand to higher education making data and reports more available to leaders, faculty and staff, organizations like EDUCAUSE and Achieving the Dream alert practitioners to focus on analytics as well as access to data. Gartner selected data analytics as one of the top ten trends in technology for higher education in 2016. “Predictive analytics involves extracting an analytical model from multiple sources of data to predict future behavior or outcomes. Predictive analytics are seen by higher education leaders as a key part of strategies to improve student success and save money through improved retention” (Gartner, 2016).
Traditional partnerships with Institutional Research and Information Technology work to provide descriptive data and capacity to manipulate the data with appropriate statistical models to tell practitioners how well particular groups are performing, how closely related various data elements are to each other, and what the outcomes of particular interventions may be. On the other hand, data analytics is often applied to big data environments and machine learning models to use data and “statistical analysis, and explanatory and predictive models to gain insight and act on complex issues” (Yanosky & Arroway, 2015, p. 6). EDUCAUSE emphasizes that analytics is a tool to address complex, strategic questions and often times focuses on predicting future behavior rather than telling researchers and practitioners how well things work (Yanosky & Arroway, 2015). Technology Related to Learning In addition to access to physical technology and trends that occupy the information technology departments at colleges and universities, technology also influences and impacts the campus learning. Researchers at the Education Advisory Board, Teachers College at Columbia University, and Complete College America are among groups that work with community colleges to implement guided pathways
18 | Ivy Tech Community College Environmental Scan 2017
for students. Often times, these pathways come with a technology solution. Upon selecting a career path, students follow a technology solution with information on credentials, degrees, careers, and transfer institutions to keep them “on track” to meet their education and workforce goals. According to Complete College America, “More than 80 credits are earned on average for an associate degree when only 60 is the standard…[extra credits] are often the result of poor choices made when students mistakenly enroll in courses that don’t count toward chosen majors” (Game Changers, 2013). The technology pathways help students understand what courses are required for a program and when – with successful transfer or work as the outcome. These systems can be labor intensive and costly to build but may be worth the cost they can help students reduce time to degree and dramatically increase completions (EAB, 2016).
Economic Trends
Economic drivers will influence where higher education, community colleges, and Ivy Tech will go in the future. Areas that policy makers and leaders focus on when planning include state appropriation trends, tuition, financial aid innovations, finances as a barrier to student success, return on investment, and philanthropic dollars.
State appropriations and tuition trends
In some states, local property taxes and assessments provide an income stream to community colleges. This is not true in Indiana – where the system relies on tuition and fees, state allocations, philanthropic, and investment dollars for revenue. Since the recession in 2008, most states saw a decline in funding for public higher education. The State Higher Education Executive Officers Association (SHEEO) reports that Indiana’s educational appropriation per full time equivalent student dropped 8 percent from 2008 to 2015 from $5,592 per FTE prior to 2008 to $5,142 per FTE in fiscal year 2015 (SHEEO, 2015, p. 34). From 2014-2015, Indiana was one of 13 states that continued to see a drop in higher education funding, down 1.2 percent (Mitchell & Leachman, 2015, p. 7). To off-set declining state revenue, Indiana’s public colleges and universities raised tuition 25 percent at two-year colleges from 2004-05 to 2016-17 from an average of $2,584 annual tuition and fees to $4,407. At the four-year colleges and universities, tuition and fees increased an average of 10 percent from $5,847 to 9,201 at the public institutions (College Board, 2016). Indiana has the 16th highest tuition and fees for public-two year institutions, but remains the most affordable higher education option in the state (College Board, 2016).
Despite SHEEO reporting declining funds per FTE student, CHE indicates an increase in the state general fund for higher education (operating funds, fee replacement, and line items – excluding R&R and cash funded construction from 2008 to the present. The increase is from $1.69 billion in 2008 to $1.9 billion for higher education in Indiana in 2016-17 (SOURCE). The two-year college system in Indiana also saw an increase during this same time period (SOURCE).
The Young Invincibles Organization focuses on the study of young people and giving them a voice in policy and practice. The group produces a 50 state report card through its Student Impact Project. The group gives Indiana a “C” grade for Indiana budget support for Public Higher Education. The report card is listed in Appendix C.vi Elements of the grade that relate to higher education include an A- for state aid, where almost all of the funds are awarded on the basis of need; a C- for tuition where 2-year fees of $4,152 exceed the national average and have increased 22 percent since the start of the recession, and a C+ for attainment equity where a 10 percent and 16 percent achievement gap in attainment exists

19 | Ivy Tech Community College Environmental Scan 2017
between African American and white students and Hispanic and white students respectively (Young Invincibles, 2016).
Financial Aid Innovations
While the Reauthorization of the Higher Education Act (see policy section) will have implications on financial aid across the country, colleges and universities are testing new models in delivering financial aid that focus on the affordability issue. Purdue University launched its Back a Boiler program this year where junior and senior students enter into income-share agreements. The program differs from traditional loan programs because “students get funds to cover current educational expenses, and, in return, they agree to pay a percentage of their future income over an agreed-upon period of time. When that repayment term ends, so does the student’s obligation, even if their total payments are less than the amount they received” (Cowley, 2016, p. 1).
The U.S. Department of Education also runs experiments with financial aid that are directed to better serve students. The list of experimental projects as of October 2016 include the following:
1. Loan counseling – institutions may require additional financial counseling for student borrowers in addition to the standard in-coming and out-going counseling requirements.
2. Expansion of competency-based education – currently financial aid is distributed on a credit-hour (time-based) model. This experiment will split disbursements based on satisfactory academic progress based on what knowledge and competencies students acquire from their studies.
3. Dual enrollment – institutions may test offering Pell Grants to students enrolled in college-level classes in high school.
4. Direct loan – institutions may limit the amount of unsubsidized loans students may take. 5. Conclusion – institutions may offer one-time or early loan disbursement for study
abroad, unequal distribution of loans, loans for parents of students with intellectual disabilities and student loans for students with intellectual disabilities in high school.
6. Second chance Pell – aid for incarcerated students. 7. Prior Learning Assessment – aid for students to earn credit based on prior experience.
More information on the experimental programs can be found at https://experimentalsites.ed.gov/exp/approved.html
Access to Benefits and Free College
“Of the 12 million students enrolled in community college, half drop out. Many do so because of financial barriers. Completing school is not merely an educational achievement, but leads to better jobs and a more secure financial future. The unemployment rate for those with an associate degree is just over 4%” (Single Stop USA, 2016). Programs that help community college students access public benefits to help remove barriers to continuous enrollment and completion see increases in retention, graduation, and job placement in living-wage occupations. These programs serve as a single point of application and approval for state and federal benefits for which low-income students may qualify. The success of these programs relies on partnerships with the state’s federal benefit agency.

20 | Ivy Tech Community College Environmental Scan 2017
SNAP Employment and Training programs are another example of how social service agencies and community colleges are working to bring needed student support resources to campuses. “SNAP E&T has historically been underutilized as a resource for workforce development activities” which includes job training and workforce certification at community colleges (National Skills Coalition, 2014, p. 1). Community college and partners can request up to 50 percent reimbursement on non-federal tuition, supplies, and fees dollars they spend on SNAP E&T recipients. Additionally, they can claim reimbursement on non-federally funded resources they use for support services such as job search and training, childcare, and transportation.
College Promises are creative ways that institutions, communities, towns/cities and national initiatives work to make community college free for students – particularly low-income students.
In April, President Barak Obama announced a plan to expand access to postsecondary education through free community college. According to the American Associate of Community Colleges, the program will include the following elements:
$100 million in grants, available in summer 2016 to focus on “ H-1B funded grant competition by the Department of Labor to create and expand innovative regional and sector partnerships between community colleges and other training providers, employers, and the public workforce system to create more dynamic, tuition-free education and training programs for in-demand middle and high-skilled jobs across the country”. (AACC, 2016).
In addition to the $100 million grant initiative, the administration committed $70 million for state and local Promise programs that provide free community college tuition to students across the country (AACC, 2016). The Kalamazoo Promise is the first of the free college programs. Launched in 2005, a group of anonymous donors pledged tuition for all graduates of Kalamazoo public schools to attend Michigan public colleges and universities (NPR, 2014). An evaluation of the Kalamazoo Promise by the Brookings Institute shows that Kalamazoo graduates are more likely than their peers to pursue postsecondary education, but they were just as likely as other students to earn 24 credit hours after 16 months enrolled in postsecondary education (Brookings, 2015). Additionally, the Kalamazoo students saw achievement gaps – low income students performing at lower rates than middle and upper income students, and African American students achieving behind their white counterparts (Brookings, 2015). This town is adding programs to combat the effects of race and poverty, along with the financial incentives for postsecondary education. Additional programs include Communities in School, funding for preschool, and workforce development (Brookings, 2015).
Indiana has Promise Programs in Shelbyville for students to attend community colleges and in a neighborhood on the near north side of Indianapolis near Ivy Tech and the Children’s Museum. Additionally, national resources list the Twenty-first Century Scholars program as a promise program, as any low-income student who signs up in middle school and meets certain requirements can get public tuition rates to attend Indiana colleges and universities upon graduation.
Return on Investment
Nationally, the American Association of Community Colleges reports that community colleges and their students added $809 billion in income to the national economy in 2013 (AACC, 2014). This equals more than 5 percent of the national gross domestic product (AACC, 2014). For every $1 spent at the

21 | Ivy Tech Community College Environmental Scan 2017
community college level, students gain an average of $4.80 in lifetime income, $25.90 in added social security income for society at large, and $6.80 in tax revenue for the community (AACC, 2014).
Overall, the value of earning a postsecondary credential is associated with higher earnings and lower unemployment, but there are additional social and health-related benefits as well (Mulholland, Z., 2011). Research shows that college graduates are more likely to have health insurance and exercise regularly; less likely to be obese or a smoker; and are more likely to vote, give to charity, and volunteer (Mulholland, Z., 2011). The positive impacts increase with each level of education from high school through a doctoral or professional degree program (Mulholland, Z. 2011).
Philanthropy
According to Giving USA 2016, Americans gave $57.48 billion to education (70 percent of which was for higher education) making it the second largest charitable sector behind religion (Johnson Grossnickle, 2016). Total charitable giving was up in the United States as Americans increased their gifts by 4.1 percent to $373.25 billion in 2016 (Johnson Grossnickle, 2016). Increased giving has implications for higher education development and grant offices.
The Council for Advancement and Support of Education (CASE) conducted a survey of community college foundations in 2015 and found that “volunteer leadership plays a critical strategic role in community college foundations…and volunteer advisors outnumbered paid staff” (Paradise, A., 2015, p. 10). With growing philanthropic giving overall and to the sector, a reliance on volunteer leadership, and a growing sense of accountability in the marketplace, Johnson Grossnickle recommends the following strategies for higher education:
• Invest in major gifts programs. • Maintain and upgrade the college’s capacity to engage donors online. • Encourage donors in your areas of highest need – transformative giving. • Be aware of college debt and finances the role it may play in giving decisions.
Environmental – Physical Space
Despite the growth of online learning opportunities, a majority of students in Indiana still come on campus for their learning experiences. Physical space implications for 21st Century learning focus on technology (see Technology section), classroom needs, green building requirements and expectations, safety and security concerns, and use of minority/women owned businesses in contracting. The following sections will address these topics.
Classroom Design
This year, Indiana will add sciences – chemistry, biology, and physics – to the list of Transfer Single Articulation Pathways. In addition to learning outcomes that are aligned across public two- and four-year institutions, lab standards will also be aligned. The curriculum committees are still working on the details of these transfer pathways and there will be implications for upgrading and/or adding lab space to meet the new standards adopted by the state-wide transfer committees. College and University leaders will also need to consider the culture of safety with respect to labs, chemicals, and machinery used for teaching as faculty review curriculum and the implementation of additional labs for experiential learning that mimic real-life production situations.

22 | Ivy Tech Community College Environmental Scan 2017
In addition to the transfer articulation Pathways, Complete College America and other higher education institutions promote guided pathways for students to help keep them on track with the courses they need to complete a credential or degree in a timely manner (Complete College America, 2013). “If these pathways are to be effective, the course content and pedagogy used in the classroom needs to be redesigned as well…Imagine a college classroom that is not restricted to the boundaries of any single room, where learning is contextualized to a students’ career paths and builds on their existing competencies and prior learning” (Padron, E., 2016, p. 2). College leaders are looking to aligned standards, cross-functional learning environments, inter-disciplinary classrooms, and intentional spaces to provide experiential learning to help meet the learning needs of students.
The shift to hybrid instructional delivery, blended classrooms, and faculty and staff desire to access technology and to work collaboratively whenever they want impacts building design. Students and faculty expect greater access to technology (internet, monitors, white boards, apps) both in the classroom and in collaborative workspaces around campus. “Students and faculty are demanding more digital resources in and out of the classroom, but also want spaces that foster greater personal interactions and opportunities for collaboration” (Lee, 2016, p. 1). These shifts may take the form of smaller, technology-equipped classrooms, open collaborative spaces with furniture is durable and mobile, and colors that are branded for the institution (McCormick, 2015; Lee, 2016).
Green Buildings
Colleges and Universities are increasingly looking toward green and energy efficient buildings. The interest is two-fold: cost savings and a growing awareness and interest from stakeholders (Kovac, 2009). In addition to the energy savings (although some projects have significant up-front costs) and demand due to faculty and staff awareness, some community colleges are using green building and renewable energy programs as job training sites. Central Carolina Community College shows “Green Collar Jobs Report forecasts 37 million jobs from renewable energy and energy efficiency in the United States by 2030. The renewable energy and energy efficiency (RE&EE) industries represented more than 9 million jobs and more than a trillion dollars in U.S. revenue in 2007, according to the report. The renewable energy industry grew three times as fast as the U.S. economy, with the solar thermal, photovoltaic, biodiesel, and ethanol sectors leading the way, each with 25%+ annual revenue growth” (Central Carolina, 2016).
Schools in Indiana are looking at creative ways to save on energy and utility costs which include solar farms and use reduction. In Putnam County, buildings are using a solar farm to provide power. The schools will see a return after 20 years of use, but the panels won’t have to be replaced for 40, which provides a future return of 20 years of energy costs (Kelly, A. & Williams, L., 2015).
Campus Security
The Cleary Act of 1990 requires colleges and universities to report statistics on crime on campus (Campus Safety, 2009). In 2009, Lilly Endowment funded a campus safety and security survey through the National Association of College and University Business Officers (NACUBO). Areas of safety and concern focused on leadership, communication, building security and mutual aid.
The increase in campus and school-based shootings during the past two decades heightened the focus on security issues. “The percentage of public institutions [92%] using sworn officers was more than

23 | Ivy Tech Community College Environmental Scan 2017
twice that of private institutions…the percentage of public campuses [91%] using armed officers was also more than double the percentage of private institutions (U.S. Department of Justice, 2015). Community Colleges across the country are focusing on facility improvement to secure classrooms and buildings. Iowa Western Community College held a special election in 2016 to cover the cost of facility improvements “including the installation of new locks and doors throughout the campus system, along with new cameras and upgrades to our computer system for better monitoring of activity” (Sidzyik, 2016).
Minority & Women Owned Business Contracts in Construction
In 2014, Indiana state agencies and public colleges and universities, including Ivy Tech, participated in a study to provide information to the Indiana Department of Administration (IDOA) to determine if disparities exist in the access to opportunities and use of minority and women owned businesses in contract work. “IDOA currently sues MBE/WBE contract goals on most of its professional services and goods and support services contracts” (BBC Research & Consulting, 2016, p. 3). Of the 20,584 prime contracts and sub-contracts awarded July 1, 2009 to June 30, 2013, 18.1 percent were to Minority- and Women-Owned businesses (BBC Research & Consulting, 2016). Additionally, the report looked at availability and use of minority and women owned businesses in construction contract and sub contract work to determine disparity in use of contractors. Two groups displayed disparity in contracts – Black American-owned businesses and Subcontinent Asian American-owned businesses while white women-owned, Asian Pacifica American-owned, Hispanic-American-owned, and Native American-owned businesses did not display a disparity (BBC Research & Consulting, 2016). The analysis did not include Public Works contracts, which are responsible for most of the construction and construction-related contracts, because “IDOA does not enforce the use of MBE/WBE contract goals” for this division (BBC Research & Consulting, 2016). Due to this fact, leaders anticipate this will be an area to watch for future legislation or change. vii
Policy Trends
January 2017 brings executive office changes in both the Indiana governor’s office and the White House as new administrations are sworn in for their first terms. Additionally, Indiana will see a new leader as Superintendent of Public Instruction who oversees the states K-12 system – providing a pipeline of students to higher education. Finally, the Higher Education Act that was up for renewal in 2013 and extended to 2016 faces reauthorization when Congress convenes.
Conclusion
This year, 2016, brought institutional changes with a new Ivy Tech president, the end of the third year of the current three-year strategic plan, and political changes at the state and federal level that will impact the external environment in which the College operates. Given the changes and the increased focus on workforce and four-year alignment, the College will undertake a new strategic planning process. Through thoughtful review of external factors, a reflection on internal trends (see State of the College document), and a robust engagement of faculty, staff, students, community members, and stakeholders, leaders will review the mission, vision, and values of the College; identify strengths, weaknesses, opportunities, and threats; develop goals and strategies; fully vet ideas with faculty; and implement a new plan for January 2018. As has been Ivy Tech’s history, serving students and the state of Indiana will be central to the work.
24 | Ivy Tech Community College Environmental Scan 2017
References
Achieving the Dream (2016). ICAT Feedback Report for Ivy Tech Community College. (See Appendix C).
American Association of Community Colleges (2016). FACT SHEET: White House Launches New $100 Million Competition to Expand Tuition-Free Community College Programs that Connect Americans to In-Demand Jobs. Retrieved from the Web: http://www.aacc.nche.edu/newsevents/News/articles/Pages/04242016_1.aspx American Association of Community Colleges (2014). Fact Sheet: Where Value Meets Values – The Economic Impact of Community Colleges. Retrieved from the Web: http://www.aacc.nche.edu/About/Documents/USA_AGG_FactSheet_Final_021114.pdf
Aspen Institute and Achieving the Dream (2016). Feedback Report Prepared for Ivy Tech Community College.viii
Carnevale, A., Jayasundra, T, & Gulish, A. (2016). America’s Divided Recovery: College Haves and Have- Nots. Washington, D.C.: Georgetown University Center on Education and the Workforce.
Central Carolina Community College (2016). Green Building and Renewable Energy Program. Retrieved from the Web: http://www.cccc.edu/green/greenbuilding/
College Board (2016). Tuition and Fees by Sector and State Over Time. Retrieved from the Web: https://trends.collegeboard.org/college-pricing/figures-tables/tuition-fees-sector-state-over-time
Cohn, S. (2016). America’s Top States for Business 2016: Our methodology. CNBC Online. Retrieved from the Web: http://www.cnbc.com/2016/06/23/americas-top-states-for-business-2016-our-methodology.html
Complete College America (2013). The Game Changers: Are states implementing the best reforms to get more college graduates? Washington, D.C.
Cowley, S. (2016). Getting a Student Loan with Collateral From a Future Job. New York Times, April 8, 2016. Retrieved from the Web: http://www.nytimes.com/2016/04/09/business/dealbook/getting-a-student-loan-with-collateral-from-a-future-job.html
Education Advisory Board (2016). Guided Pathways Are Worth the Effort To Implement, Authors Say. Retrieved from the Web: https://www.eab.com/daily-briefing/2016/07/19/guided-pathways-are-worth%20-the-effort-to-implement-authors-say
Forbes Best States for Business (2016). Forbes Online. Retrieved from the Web: http://www.forbes.com/places/in/
Fry, R. & Kochhar, R. (2014). America’s wealth gap between middle-income and upper-income families is widest on record. Pew Charitable Trust. Retrieved from the Web: http://www.pewresearch.org/fact-tank/2014/12/17/wealth-gap-upper-middle-income/
Gartner (2016). Gartner Highlights Top 10 Strategic Technologies for Higher Education in 2016. Press Release Retrieved from the Web: http://www.gartner.com/newsroom/id/3225717
25 | Ivy Tech Community College Environmental Scan 2017
Grama, J.L. & Vogel, V (2016). The 2016 Top 3 Strategic Information Security Issues. EDUCAUSE Review, January/February 2016.
Hillman, N., & Orians, E. (2013). Community Colleges and Labor Market Conditions: How Does Enrollment Demand Change Relative to Local Unemployment Rates? Research in Higher Education Vol. 54 Issue 7, p765-780. 16p.
Indiana Business Research Center (2016). STATS Indiana: School-age and College-age population projections by region. Indiana University Kelley School of Business: Bloomington, IN.
Indiana Department of Education. College and Career Readiness Standards. Retrieved from the Web: http://www.doe.in.gov/standards/college-entrance-preparation
Internet Access: Indiana (2016). Retrieved from the Web: http://broadbandnow.com/Indiana
Ivy Tech Community College (2016). 2016-17 College Metrics & Benchmarks. Indianapolis, IN.
Ivy Tech Community College (2015). Annual Unduplicated Headcount Enrollment. Institutional Research: Indianapolis, IN. Retrieved from the Web: http://wwwcc.ivytech.edu/employee/infonet/institutional-research/reports/14-15-Annualized-headcount.pdf
Ivy Tech Community College (2015). Annual Unduplicated FTE Enrollment. Institutional Research: Indianapolis, IN. Retrieved from the Web: https://www.ivytech.edu/files/14-15-Annualized-fte.pdf
Ivy Tech Community College (2016). Student Success Report. Indianapolis: IN: Kara Monroe.
Kelly, A. & Williams, L. (2015). Going green to save green: North Putnam Community Schools switching to solar to save long-term. WRTV Retrieved from the Web: http://www.theindychannel.com/news/local-news/going-green-to-save-green-north-putnam-community-schools-switching-to-solar-to-save-long-term
Kids Count in Indiana 2016 Data Snapshot: a profile of child well-being (2016). Indiana Youth Institute: Indianapolis, IN.
Kinghorn, M. (2012). Indiana’s Population Projections, 2010 to 2050. Indiana Business Review, Spring 2012.
Klein-Collins, R. (2012). Competency-Based Degree Programs in the U.S.: Postsecondary Credentials for Measurable Student Learning and Performance. Chicago, IL: Council on Adult and Experiential Learning.
Kovac, J.R. (2009). Green Buildings in the Community College: A study to Illuminate Student and Faculty Perspectives. Austin, TX. Dissertation Retrieved from the Web: https://repositories.lib.utexas.edu/handle/2152/7845 Lee, M. (2016). Innovation on Campus: Five Trends in Higher Education Planning. High Profile. Retrieved from the Web: https://www.high-profile.com/innovation-campus-five-trends-higher-education-planning/

26 | Ivy Tech Community College Environmental Scan 2017
Mitchell, M. & Leachman, M. (2015). Years of Cuts Threaten to Put College Out of Reach for More Students. Center on Budget and Policy Priorities. Retrieved from the Web: http://www.cbpp.org/sites/default/files/atoms/files/5-13-15sfp.pdf
McCormick, S. (2015) Trends in Higher Education Interiors. College Planning & Management. Retrieved from the Web: https://webcpm.com/Articles/2015/04/01/Higher-Education-Interiors.aspx?Page=1
Mulholland, Z.J. (2011). The Value of Education: A comprehensive look at the benefits associated with higher education. Bloomington, IN: Indiana University Public Policy Institute Policy Choices, number 11-C16.
National Skills Coalition (2014). Training Policy in Brief: SNAP Employment and Training Program. Retrieved from the Web: http://www.nationalskillscoalition.org/resources/publications/tpib/file/NSC_Training_SNAP_2014.pdf
National Student Clearinghouse (2016). National Student Clearinghouse Revere Transfer Project. Retrieved from the Web: https://reversetransfer.org/
NPR Radio (2014). How One Michigan City Is Sending Kids To College Tuition-Free. Retrieved from the Web: http://www.npr.org/2014/04/16/303365867/how-one-michigan-city-is-sending-kids-to-college-tuition-free Pew Research Center (no date). Demographic profile of Hispanics in Indiana, 2014. Retrieved from the Web: http://www.pewhispanic.org/states/state/in/
Padron, E. (2016). Transforming the Community College Classroom. Community College Week March 23, 2016. Retrieved from the Web: http://news.mdc.edu/wp-content/uploads/2016/02/Transforming-the-Community-College-Classroom.pdf
Seemiller, C., & Grace, M. (2016). Generation Z Goes to College. San Francisco, CA: Jossey-Bass.
Sidzyik, K. (2016). Iowa Western asks voters to pass bond to address campus security issues. The Nonpareil Online. November 16, 2016. Retrieved from the Web: http://www.nonpareilonline.com/news/local/iowa-western-asks-voters-to-pass-bond-to-address-campus/article_0a6f85a7-e8a8-5e56-8e2d-877488fc1035.html
Single Stop USA. (2016). Delgado Community College Sets Record High For Benefits Confirmations. Retrieved from the Web: http://singlestopusa.org/delgado-community-college-sets-record-high-for-benefits-confirmations/
Society for College and University Planning (2016). Trends for Higher Education: The Future of Learning. Retrieved from the Web: www.scup.org/trends
State Higher Education Executive Officers (2015). SHEEO: State Higher Education Finance: FY 2015. Retrieved from the Web: http://sheeo.org/sites/default/files/project-files/SHEEO_FY15_Report_051816.pdf

27 | Ivy Tech Community College Environmental Scan 2017
Sparks & Honey (2014). Move over Millennials Here Comes Generation Z. Retrieved from the Web: http://www.slideshare.net/sparksandhoney/generation-z-final-june-17/19-19Traditional_gender_roles_have_been
The Ohio State University. Fast Facts for Faculty: Universal Design for Learning – Elements of Good Teaching. Retrieved from the Web: https://ada.osu.edu/resources/fastfacts/Universal-Design-FF.pdf
Thompson, T., Weir, C. & Ashmore, J (2011). AHEAD White Paper on Students with Intellectual Disabilities and Campus Disability Services. Retrieved from the Web: https://webcache.googleusercontent.com/search?q=cache:JJsUc0UhtmwJ:https://www.ahead.org/uploads/docs/resources/Final%2520SWID%2520White%2520Paper%2520with%2520PSE%2520and%2520DS%2520Issues1.doc+&cd=1&hl=en&ct=clnk&gl=us
United States Department of Education (2011). Education: Know Your Rights and Responsibilities. Retrieved from the Web: http://www2.ed.gov/about/offices/list/ocr/transition.html
United States Department of Education (2016). Experimental Sites Initiative. Retrieved from the Web: https://experimentalsites.ed.gov/exp/approved.html
United States Department of Justice (2015). Campus Law Enforcement, 2011-12. Retrieved from the Web: http://iaclea.org/visitors/PDFs/DOJReport2015fordata2011-2012.pdf
University of Arkansas News (2016). Fair Labor Standards Act Regulatory Changes Put on Hold. Retrieved from the Web: http://news.uark.edu/articles/37236/fair-labor-standards-act-regulatory-changes-put-on-hold
i Appendix A: Ivy Tech Institutional Research: Annualized FTE Enrollment and Annualized Unduplicated Headcount Enrollment Reports. ii Appendix A: Ivy Tech Institutional Research: Demographic Profile Year to Date Fall 2015 vs. Fall 2016 iii Appendix B: Indiana Business Research Center – US Census Data pulled using STATS Indiana – IU Kelley School of Business. iv IBRC, Counties include: Boone, Brown, Hamilton, Hancock, Hendricks, Johnson, Marion, Morgan, Putnam, and Shelby Counties. v Appendix C: Achieving the Dream ICAT Assessment Tool. vi Appendix D: Young Invincibles State Report Card – Indiana, 2016 vii Appendix E: BBC Research & Consulting. 2015-16 State of Indiana Disparity Study, Indiana Department of Administration Executive summary. viii Appendix F: Aspen Institute and Achieving the Dream Feedback Report Prepared for Ivy Tech Community College.


![Ivy Tech Community College 2019-20 Course Prerequisites ......Ivy Tech Community College 2019-20 Course Prerequisites for Dual Credit [Effective July 1, 2019 - June 30, 2020] Ivy Tech](https://static.documents.pub/doc/80x56/5fa5eb9617f8e075842839df/ivy-tech-community-college-2019-20-course-prerequisites-ivy-tech-community.jpg)


