28
IWA - FOREST I NDUSTRY PENSION PLAN A NNUAL R EPORT 2013

IWA - Forest Industry PensIon PlAn
AnnuAl rePort 2013

IWA - Forest Industry PensIon PlAnSuite 2100 - 3777 Kingsway
Burnaby BC V5H 3Z7
Main Switchboard: 604-433-6310Toll Free in BC: 1-800-663-4384
Pension Information: 604-433-5862Pension Toll Free: 1-800-913-0022
Facsimile: 604-433-0518
Website: www.iwafibp.ca
Image C-04571 Courtesy of
royal BC museum, BC arChIves [Ca. 1911]
BlaCk & WhIte Cover Images:Courtesy of the royal BC museum, BC arChIves
Image B-07516, [Ca. 1903]Image a-06876, [unknoWn date]

Table of ConTenTs
Message froM The TrusTees 1
Profile 2
a brief review of 2013 3
Pension Plan governanCe 4overvIeW 4
GovernAnce PrActIces 4
BoArd commIttees 5
BoArd chAnGes 5
GovernAnce structure 6
MeMbershiP 7ActIve memBer ProFIle 8
retIred memBer ProFIle 8
hIstorIcAl memBershIP trends 9
invesTMenT inforMaTion 10Assets In the PensIon Fund 10
Asset mIx 11
rAtes oF return And BenchmArks 12
Investment mAnAGers 13
toP ten holdInGs 13
finanCial inforMaTion 14PlAn FundInG 14
GoInG concern ActuArIAl lIABIlIty 14
solvency lIABIlIty 15
recent PlAn Amendments 15
summArIzed FInAncIAl stAtements For 2013 16
BeneFIt PAyments 18
AdmInIstrAtIve exPenses 18
Investment And custodIAl exPenses 19
AnnuAl cAsh FloW 19
contrIButory hours 20
glossary 21


IWA - Forest Industry Pension PlanAnnual Report 2013
1
Message froM The TrusTees
tom GetzIe, co-chAIr BoB mAtters, co-chAIr
We are pleased to present the Annual Report 2013 for the IWA-Forest Industry Pension Plan (the “Plan”). The Trustees of the Plan recognize that your pension is one of your most important financial assets in retirement, which makes the security of your pension and the financial health of the Plan crucial. We hope this report provides you with a better understanding of how the Plan is managed, the demographics of the Plan and its current financial status.
2013 marked the 40th anniversary of the Plan. The Plan was created in June of 1973 to provide pensions for workers in the booming forest industry of the 1970s. By the end of its first year, the Plan had grown to $7 million in assets, 500 contributing companies, 81 million hours worked and over 850 members collecting a pension. The demands on the Plan, not to mention the landscape of the forest industry, have changed immensely since then. By the end of 2013, the Plan had grown to $3.12 billion in assets, with just 419 contributing companies, 21 million hours worked and over 25,000 members collecting a pension. In total, the Plan has paid out almost $3.8 billion in pension benefits to our membership since 1977; with over $1.8 billion in benefits paid in the last 10 years alone. In order to continue delivering on this promise and to ensure the sustainability of our Plan, the Plan must adapt to the economic environment in which it operates.
The financial health of the Plan is affected by many factors such as: investment market cycles, current interest rates, the life expectancy of Plan members, the demographics of the membership, as well as the state of the forest industry. The latest actuarial valuation (as of December 31, 2012) identified a $1.6 billion deficit. Last year saw an improvement in assets due to strong investment returns, as well as a slight increase in contributions. However, historically low interest rates during the last decade, increased life expectancies and an aging population are causing pension costs to grow faster than pension assets — a funding challenge faced by many other pension plans in Canada and around the world. The Plan, in compliance with BC pension law, was required to address the deficit which necessitated amendments to the Plan. Details of the Plan’s financial position, the valuation results and the amendments are included in this report (pages 14-20).
On the investment side the Plan achieved a 15.7% gross rate of return generating over $439 million in investment income. This rate was well over the benchmark of 12.4%. Over 35 years, the Plan’s return has averaged 9.8% per annum.
In summary, 2013 was a year in which obstacles were encountered and amendments were necessary to put the Plan on a path to sustainability for our 70,000+ members and beneficiaries. The Plan administration and Trustees will continue their focus on ensuring the Plan remains viable for future members and beneficiaries.

IWA - Forest Industry Pension PlanAnnual Report 2013
2
Profile
The IWA – Forest Industry Pension Plan was established in 1973 pursuant to negotiations between the I.W.A. and Forest Industry employers, to provide benefits for workers in the forest industry. In 1978 the Coast, Southern Interior and Northern Interior regional pension plans were merged to create the current Plan. In September of 2004, the I.W.A. merged with the United Steelworkers (“USW”) and now the Plan’s forest industry employees are members of the USW. Today our Plan serves approximately 70,000 current and retired members in the industry.
The Plan provides two major services: acting as benefit administrator by collecting contributions and administering payment of benefits and serving as the investment manager of the Plan’s assets (the “Pension Fund”).
adMinisTraTive funCTions: � Enrolling and collecting information from employers and employees.
� Collecting contributions from both participating employers and Plan members.
� Calculating and processing benefits.
� Providing information to members, union locals and participating employers on pension benefits.
� Disbursing benefit payments.
� Filing of appropriate documentation for tax and pension regulatory purposes.
invesTMenT funCTions: � Evaluating risk and return opportunities between the Plan’s assets and liabilities.
� Establishing and recommending appropriate investment mix and long-term investment benchmarks.
� Using investment policies to review and monitor independent investment manager performance and making changes as appropriate.
� Using independent trust fund custodian to safekeep Plan assets.
� Using staff and independent consultants to review Plan investment strategies.
� Ensuring compliance with Plan policies and regulatory compliance.
The Plan employs approximately 50 employees at our offices in Burnaby, BC and is governed by the provisions of the Pension Benefits Standards Act of British Columbia.
The Board of Trustees were pleased to welcome Derrick Johnstone to the Plan in 2013, who has assumed the role of Deputy General Manager/Pension Administrator.

IWA - Forest Industry Pension PlanAnnual Report 2013
3
a brief review of 2013MeMber serviCes
� There were 15,497 active members in the Plan as at December 31, 2013.
� There were 29,190 inactive members in the Plan as at December 31, 2013.
� 879 members retired in 2013.
� A total of 25,536 retirees and beneficiaries received monthly pensions totalling $215,650,953 for 2013.
� 1,407 members broke service at the end of 2013.
� The average monthly pension payment for 2013 was $691.68.
� 311 beneficiary claims were processed.
� Over 13,200 telephone calls were received in member services.
� 3 retirement seminars were conducted across British Columbia.
� 218 personal interview sessions were conducted with our pension counsellors at the Plan office.
� 2,497 estimates were provided to our membership.
� Our website reported over 593,000 hits by year end 2013, with 15,115 visitors.
Plan highlighTs
� There are currently 419 participating employers in the Plan; 15 employers began participating in the year 2013.
� Approximately $57.4 million was contributed to the Plan by participating employers and $35.2 million by employees.
� The Plan paid out a total of $232.8 million in benefits in 2013 ($236.9 million was paid in 2012). This amount includes 1,180 commuted value withdrawals from the Pension Fund at a value of $17.2 million.
� As of December 31, 2012 (the last filed actuarial valuation), there was a solvency liability of $4.696 billion, and a solvency ratio of 60.1%.
� As of December 31, 2012 (the last filed actuarial valuation), there was a going concern liability of $3.225 billion, and a funded ratio of 87.7%.
� Employee and employer contribution levels remained at $1.625 and $2.675 per hour respectively for the majority of participating employers.
� 21.6 million hours were reported for 2013 (2012 had 20.5 million hours).
invesTMenT highlighTs
� The market value of the Fund increased from $2.83 billion to $3.12 billion at year-end.
� The annual rate of return on investments was 15.7%.

IWA - Forest Industry Pension PlanAnnual Report 2013
4
Pension Plan governanCe
overview
The Plan’s sponsors - the United Steelworkers (USW) and the Forest Industry employers, are responsible for appointing Trustees to operate the Plan and manage the Fund in the long-term interest of the Plan membership. A 16 member Board of Trustees equally representing both the USW and the Forest Industry employers oversees the administration of the Plan.
The appointed Trustees are responsible for determining Plan benefit levels and Plan design. They acquire and manage the services of the administrator, actuary, auditor, legal counsel, investment managers and custodian in order to ensure the security of the Pension Fund and competent administration of members’ pensions. The Plan is provincially regulated and governed by the provisions of the Pension Benefits Standards Act of British Columbia.
governanCe PraCTiCes
The role of a Trustee is complex and good governance practices are necessary to ensure the Plan’s goals are achieved. Pension plan governance refers to the structure and processes adopted by the Board of Trustees for overseeing, managing and administering the Plan. The objective of good governance is to optimize the Plan’s performance while ensuring that the Plan is able to meet its obligations to its members and beneficiaries.
The Trustees of the Plan are required to act independently of the United Steelworkers and Forest Industry participating employers to make decisions in the best interest of our Plan members and beneficiaries. Through its ongoing commitment to good governance practices the Board has strategies in place to provide guidance, measure effectiveness and ensure accountability and transparency.
� Committee Terms of Reference: Reviewed and accepted guidelines for Trustee and staff roles and responsibilities as related to investment, administration, actuarial and audit issues.
� Committee Structure: Committees created to focus on the different roles and responsibilities of the Board Trustees. Each committee meets anywhere from one to four times per year. Ad hoc committees, to deal with short term specific issues, are established on an as needed basis.
� Code of Conduct Policy: Developed to articulate and sustain a governance and corporate culture that reflects the Board’s principles and values, and to ensure that Trustees have a full understanding of these principles and values.
� Board Education and Qualification: Orientation and external training for new and existing Trustees to educate and assist them in carrying out their governance responsibilities. Comprehensive Trustee Governance Manual designed to assist Board members on current training requirements and standards of practice.
� Board Effectiveness Assessment Process: Self-assessment process required annually which is designed to provide Trustees with an opportunity to examine how the Board is operating and to make suggestions for improvement.
� Communication: The Board communicates to the union, participating employers and membership regularly through audited financial statements, actuarial valuations, this report, annual statements issued to members, our website, on site seminars and through our member services via local and toll free phone lines.

IWA - Forest Industry Pension PlanAnnual Report 2013
5
Pension Plan governanCe
board CoMMiTTees
The committees are made up of Trustees with equal representation from participating Forest Industry employers and the United Steelworkers.
Audit Committee
The Audit Committee assists in the supervision of the Plan’s internal operations, reviews the audited financial reports, meets with external auditors and ensures information disclosure, accuracy and efficiency thereby building confidence with Plan members, Plan sponsors and regulators.
Investment Committee
The Investment Committee oversees the investment of the Pension Fund. It reviews and advises the Trustees as to selection of investment managers, matters of investment policy, Pension Fund asset management and any other matters relating to the investment and management of the Pension Fund.
Governance Committee
The Governance Committee reviews the system of governance including the mandates for the Board and committees, best practices for Plan governance and the effectiveness of the Board and its committees.
Human Resources & Compensation Committee
The Human Resources & Compensation Committee establishes compensation, including compensation policies and strategies for the General Manager and the Director of Investments as well as compensation policies and strategies for employees excluded from the bargaining unit. It also reviews labour relations, strategy, succession planning and key employee development.
board Changes
There were a few changes to the members of the Board of Trustees in 2013:
Retired Member: Darrel Wong, USW
New Member: Brian Butler, USW

IWA - Forest Industry Pension PlanAnnual Report 2013
6
Pension Plan governanCe
governanCe sTruCTure
iwa - foresT indusTry Pension Plan
TrusT Fund CusTodian Plan aCTuary audiTors
NORTHERN TRUST COMPANY, CANADA MORNEAU SHEPELL GRANT THORNTON LLP
ExTErnal lEgal CounsEl invEsTmEnT ConsulTanT
LAWSON LUNDELL LLP MERCER (CANADA) LIMITED
1 Audit Committee1* Audit Committee Co-Chair2 Investment Committee2* Investment Committee Co-Chair3 Governance Committee3* Governance Committee Co-Chair4 Human Resources & Compensation Committee4* Human Resources & Compensation Committee Co-Chair
I.F.L.R.A. Interior Forest Labour Relations AssociationCONIFER Council on Northern Interior Forest Employment RelationsFIR Forest Industrial RelationsUSW United Steelworkers
Appointing Organizations:
Board oF TrusTEEs
Tom Getzie (1, 2, 3*, 4*)Co-Chair
Forest Industrial Relations
Mike Bryce (2, 3)CONIFER
Donald Cadman (1*, 3, 4)FIR
Len SmithFIR
Vern Carter (1, 2*)I.F.L.R.A.
Kathy CoburnCONIFER
Greg WishartI.F.L.R.A.
Boyd StinsonFIR
adminisTraTion & invEsTmEnTs
Robert BishoffGeneral Manager
Derrick JohnstoneDeputy General Manager/
Pension Administrator
Colleen TroelstrupDirector, Investments
Bob Matters (1*, 2*, 3*, 4*)Co-Chair
United Steelworkers
Frank Everitt (1, 2, 3, 4)USW
Warren Oja (2)USW
Doug Singer (1, 3)USW
Brian ButlerUSW
1 VacancyHarvey Arcand, Advisor - USW
Gerry Smith, Advisor - USW
Brian HarderUSW
Monty MearnsUSW

IWA - Forest Industry Pension PlanAnnual Report 2013
7
MeMbershiP
The Plan holds the pension assets of over 70,000 members, from 419 participating employers and is considered one of the largest private sector pension plans in British Columbia.
2013 2012 2011
Active Members 15,497 15,172 14,797
Inactive Members 29,190 29,200 29,691
Retired Members and Beneficiaries 25,536 25,298 25,066
Market Value of Funds (millions) $3,122.8 $2,827.9 $2,709.8
Employer Contributions (millions) $57.4 $55.8 $54.8
Employee Contributions (millions) $35.2 $33.1 $33.4
Retirement Benefits Paid (millions) $232.8 $236.9 $247.8Commuted Value Withdrawals and Payables (millions; this number has been included in “Retirement Benefits Paid”) $17.2 $22.3 $37.5
Annual Administrative Cost per Member(excludes investment cost) $61.48 $57.96 $52.67
The annual administrative cost per member increased to $61.48 last year. This cost continues to remain relatively stable, averaging $57.91 per member over the last 5 years.
MeMbershiP breakdown 2013 and 1993
The number of retirees and beneficiaries has increased by 68% over the past 20 years, while the number of active members declined by 60% - in part due to greater global competition and the rapid pace of technological change/automation within the forest industry. The market value of the Fund in this same period, however, has grown from $988 million in 1993 to $3.12 billion in 2013 - a growth of 216%. This is significant because as a mature pension plan, investment returns become more important to the future growth of the Pension Fund than contributions.
22%Active(15,497)
1993
2013
53%Active(38,892)
42%Inactive(29,190)
26%Inactive(19,105)
36%Retirees &
Beneficiaries(25,536)
21%Retirees &
Beneficiaries(15,162)
0 10,000 20,000 30,000 40,000 50,000 60,000 70,000 80,000

IWA - Forest Industry Pension PlanAnnual Report 2013
8
Age 90+3%
Limited Members1%
MeMbershiP
aCTive MeMber Profile
The statistics over the last 20 years show a trend towards aging workers in the forest industry. The average age of a worker in the forest industry was 44.5 on December 31, 2013, up from 38.6 in 1993.
aCTive MeMbers by age - 2013
age aT reTireMenT(over lasT 5 years)
Members are retiring slightly earlier and living longer than they did 20 years ago. From 1989 to 1993 the average age of retirement was 61.2 with an average life expectancy of 20.7 years. The average age at retirement over the last 5 years was 60.3 with an average life expectancy of 22.4 years.
reTired MeMber Profile
The average age of a pensioner in the Plan has risen from 69.7 in 1993 to 72.1 in 2013; an increase of 3% over the past 20 years.
There are 4,298 pensioners over the age of 80, with 602 being over the age of 90. Our oldest pensioner on file is 102 years of age.
Pensioners by age - 2013
TyPes of Pension
52% of our pensioners are receiving subsidized early retirement pensions.
Survivor benefits make up 16% of our pensions in payment (both “pre” and “post” retirement beneficiaries).
Over Age 652%
Age 45-5429%
Under Age 2513%
Age 35-4416%
Age 25-3415%
Age 55-6425%
Over Age 655%
Before NormalRetirement Age (65)
78%
At NormalRetirement Age (65)
17%
BeneficiariesPre-retirement
Death2%
PensionersSubsidized
Early Retirement52%
PensionersVested
Deferred24%
BeneficiariesPost-retirement
Death14%
PensionersNormal (at age 65)
7%
Age 60-6416%Under Age 60
6%
Age 80-8918% Age 70-79
34%
Age 65-6923%

1980 1990 2013
: : :
IWA - Forest Industry Pension PlanAnnual Report 2013
9
MeMbershiP
hisToriCal MeMbershiP Trends
The number of active Plan members in the forest industry has declined considerably over the past twenty years due to a multitude of factors including: the global financial crisis of 2008, the weakened US housing market, greater global competition, the rapid pace of technological change, automation within the forest industry and environmental concerns. This decline has in turn led to an increase in our inactive membership and pensioners.
raTio of aCTive-To-reTired MeMbers
As the Plan grows more mature each year, the proportion of working members declines relative to the growing number of retired members. Mature pension plans usually pay out more to pensioners than they receive from members who are still working. Strategies for managing mature pension plans therefore evolve in such a way that investment returns become more important than contributions.
Last year the Plan paid out $232.8 million in benefits and received $92.6 million in contributions. In 1980, the Plan paid out $13.4 million in benefits and received $35.8 million in contributions. The illustration below shows the historical shift in active to retired members over the decades:
In 1980 there were 18 active members for every retired member. Currently there are only 0.6 active members for every retired member. This shift in membership levels is one of several factors which influence the Plan’s funding levels and directs policies and strategies for Plan management.
Inactive Members
hisToriCal MeMbershiP Trends (2003 - 2013)80,000
70,000
60,000
50,000
40,000
30,000
20,000
10,000
0
Pensioners & Beneficiaries
0
10000
20000
30000
40000
50000
60000
70000
80000
Inactive Members
Pensioners & Beneficiaries
Active Members
2003
2004
2005
2006
2007
2008
2009
2010
2011
2012
2013

0.0
0.3
0.6
0.9
1.2
1.5
1993
1994
1995
1996
1997
1998
1999
2000
2001
2002
2003
2004
2005
2006
2007
2008
2009
2010
2011
2012
2013
1.5
1.2
0.9
0.6
0.3
0.0
0.0
0.5
1.0
1.5
2.0
2.5
3.0
3.53.5
3.0
2.5
2.0
1.5
1.0
0.5
0.0$2
.513
1993
1994
1995
1996
1997
1998
1999
2000
2001
2002
2003
2004
2005
2006
2007
2008
2009
2010
2011
2012
2013
Ass
et V
alue
($bi
llion
s)
$0.9
89
$1.0
39 $1.2
63 $1.5
11 $1.6
98
$1.8
14
$1.9
53 $2.11
0
$2.0
79
$1.9
50 $2.2
16 $2.4
51 $2.8
00 $3.18
0
$3.2
13
$2.8
67
$2.7
10
$2.7
58
$2.82
8
$3.123 billion
IWA - Forest Industry Pension PlanAnnual Report 2013
10
invesTMenT inforMaTion
Contributions from both members and employers add to Plan assets, as do positive investment returns. As the Plan matures, however, contributions are expected to make up less of total cash inflows while investment returns will make up relatively more. While hourly contributions have risen over the past 20 years, total contributions have declined as hours worked decline. This means that over time the Plan has become more reliant on investment returns. The last few years however, revealed a slight increase in contributions to the Plan as the number of hours worked improved slightly. The graph below shows the downward trend of contributions relative to pension payments:
raTio of ConTribuTions To Pension PayMenTs (20 years)
asseTs in The Pension fund
The Pension Fund grew to $3.12 billion at the end of 2013 from just $58 million in 1977. Equity markets were exceptionally strong during 2013 while bond markets lagged. The value of the Fund increased by about $290 million during 2013. The Pension Fund is balanced and broadly diversified. Balance and diversification across asset classes, regions and currencies is the key to weathering the ups and downs of the investment markets. Further, it is important to keep in mind that long-term performance is most significant for pension plans because they pay benefits to members over very long periods of time. Be assured that the Plan’s investment policies are sound and the Plan’s trustees, staff and investment managers continue to work diligently to ensure the Plan’s long-term investment objectives are met.
MarkeT value asseT growTh (20 years)

IWA - Forest Industry Pension PlanAnnual Report 2013
11
asseT Mix
The Plan’s long-term asset mix is set as a result of the evaluation of the Plan’s liability structure (the payment schedule of pension benefits over time) and the funding of the Plan (expected contributions plus investment returns). The resulting asset mix is the “best” trade-off of risk versus return that comes from evaluating the many possible outcomes and risks associated with investments in stocks, bonds, real estate and other assets. Consequently, the Plan’s investments are diversified across asset class, region and currency. Professional staff and investment managers manage these investments and regularly report on their activities to the Plan’s Investment Committee.
The Plan’s equity portfolio is further diversified according to investment style by using managers who follow value, growth and core investment styles. Overall, the Plan‘s equity portfolio is managed with a slight value bias. In theory the value style of investing tends to provide the portfolio with better protection when markets are not performing well while producing attractive returns over the longer-term.
The Plan’s asset mix as at year-end 2013 was as follows:
*Alternative Investments consist of Real Estate, Infrastructure, Private Debt and Absolute Return funds.
invesTMenT inforMaTion
asseT diversifiCaTion as aT deCeMber 31, 2013
asseT alloCaTion asseT Class value
AlternativeInvestments*
11.8%
Cash1.9%
Foreign Equities38.3%
Canadian Equities21.2%
Bonds26.8%
$800.0
$700.0
$600.0
$500.0
$400.0
$300.0
$200.0
$100.0
$-
Ass
et V
alue
($m
illio
ns)
0
100
200
300
400
500
600
700
800
Cas
h
Can
adia
n Bo
nds -
Uni
vers
e
Can
adia
n Bo
nds -
Lon
g
Alte
rnat
ive
Inve
stm
ents
*
Can
adia
n Eq
uitie
s
US
Equi
ties
Glo
bal E
quiti
es
Non
-Nor
th A
mer
ican
(EA
FE) E
quiti
es
Emer
ging
Mar
ket E
quiti
es$58.3
$95.6
$738.9
$660.2
$369.1 $380.5
$313.4
$383.0
$122.1

IWA - Forest Industry Pension PlanAnnual Report 2013
12
invesTMenT inforMaTion
raTes of reTurn and benChMarks
A benchmark is a standard for comparison. At the investment manager or asset class level, it is an index chosen because it best reflects the risk and return of a particular investment approach. A benchmark helps answer the basic question of “How are the Plan’s investments performing?”
The total Plan benchmark is a weighted combination of the individual benchmarks of each asset class. The weighting reflects the Plan’s long-term allocation to each asset class.
For the year ended December 31, 2013, the Plan’s return was 15.7% against the benchmark of 12.4%. Plan returns have been positive in 30 of the last 35 years.
Market performance in any one year is unpredictable and can be volatile. It is important to keep in mind that long-term performance is most significant for a pension plan because benefits are paid to members over very long periods of time. Over the last ten years, for example, the Plan’s investment returns have averaged 7.7% versus a benchmark of 6.9%. During that ten year period, however, returns reached as high as 17.1% and as low as -18.4%.
The Plan’s investment returns need to be interpreted with care. Plan performance should not be evaluated over short-term periods. Annual review periods are too short and are included to demonstrate how short-term results can be very volatile. This is especially important as the Plan has and will continue to experience both strong and weak market environments over time. The chart below shows actual annual rates of return for the Plan and the Plan’s benchmark since 1993:
raTes of reTurn vs. benChMarks (annual)
-20
-15
-10
-5
0
5
10
15
20
2525%
20%
15%
10%
5%
0%
-5%
-10%
-15%
-20%
Plan Return (%) Plan Benchmark (%)
20012002
1994
2008
1993 1995 1996 1997 1998 1999 2000 2003 2004 2005 2006 2007 2009 2010 2011 2012 2013

IWA - Forest Industry Pension PlanAnnual Report 2013
13
invesTMenT inforMaTion
invesTMenT Managers as aT deCeMber 31, 2013
ToP Ten holdings as aT deCeMber 31, 2013
Manager Mandate % of Assets Managed
TD Asset Management Canadian Equities 5.1%
Phillips Hager & North Canadian Equities 5.3%
Beutel Goodman Canadian Equities 5.4%
Connor Clark & Lunn Canadian Equities 5.4%
Phillips Hager & North Canadian Bonds 8.8%
Beutel Goodman Canadian Bonds 9.3%
Wellington Canadian Bonds 8.7%
JP Morgan Asset Management US Equities 5.9%
Aronson + Johnson + Oritz US Equities 6.3%
Alliance Bernstein Global Equities 5.4%
Capital Guardian Global Equities 4.7%
Oechsle Non-North American (EAFE) Equities 6.3%
Sprucegrove Non-North American (EAFE) Equities 6.0%
Capital Guardian Emerging Market Equities 3.9%
Various Real Estate 6.2%
Various Infrastructure 3.2%
Various Private Debt 1.1%
Various Diversified Growth Funds 1.2%
Internal Cash 1.8%
Security Name Type of Security Holding as a % of Total Assets
1 Concert Real Estate Corporation Real Estate Company Shares 2.1%
2 Toronto Dominion Bank Canadian Bank Stock 1.5%
3 Royal Bank of Canada Canadian Bank Stock 1.4%
4 Province of Ontario Province of Ontario Government BondCoupon 3.5%; Maturity June 2, 2043
1.4%
5 Canada Housing Trust Canadian Government Agency BondCoupon 2.75%; Maturity December 15, 2014
1.3%
6 Bank of Nova Scotia Canadian Bank Stock 1.3%
7 130 West Broadway Real Estate Property 0.9%
8 Government of Canada Government of Canada BondCoupon 3.5%; Maturity December 1, 2045
0.7%
9 Canadian National Resources Corporation Canadian Energy Company Stock 0.7%
10 Province of Ontario Province of Ontario Government BondCoupon 3.45%; Maturity June 2, 2045
0.7%
IWA - Forest Industry Pension PlanAnnual Report 2013
14
finanCial inforMaTion
Plan funding
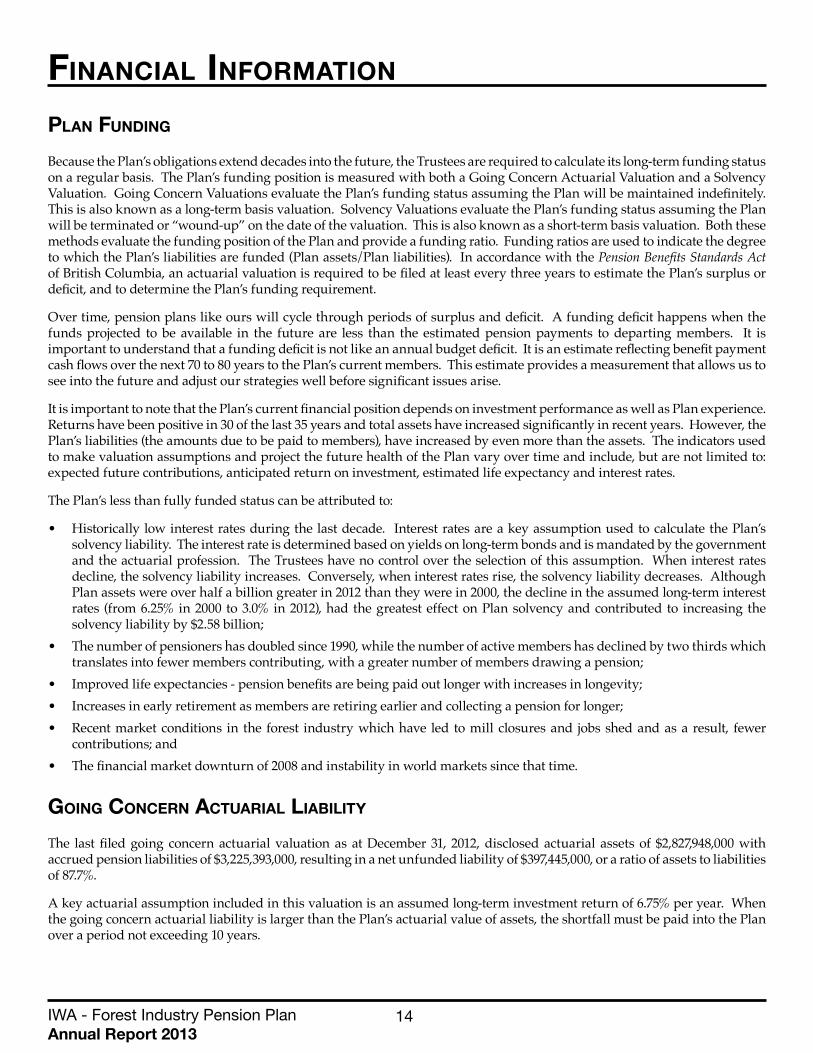
Because the Plan’s obligations extend decades into the future, the Trustees are required to calculate its long-term funding status on a regular basis. The Plan’s funding position is measured with both a Going Concern Actuarial Valuation and a Solvency Valuation. Going Concern Valuations evaluate the Plan’s funding status assuming the Plan will be maintained indefinitely. This is also known as a long-term basis valuation. Solvency Valuations evaluate the Plan’s funding status assuming the Plan will be terminated or “wound-up” on the date of the valuation. This is also known as a short-term basis valuation. Both these methods evaluate the funding position of the Plan and provide a funding ratio. Funding ratios are used to indicate the degree to which the Plan’s liabilities are funded (Plan assets/Plan liabilities). In accordance with the Pension Benefits Standards Act of British Columbia, an actuarial valuation is required to be filed at least every three years to estimate the Plan’s surplus or deficit, and to determine the Plan’s funding requirement.
Over time, pension plans like ours will cycle through periods of surplus and deficit. A funding deficit happens when the funds projected to be available in the future are less than the estimated pension payments to departing members. It is important to understand that a funding deficit is not like an annual budget deficit. It is an estimate reflecting benefit payment cash flows over the next 70 to 80 years to the Plan’s current members. This estimate provides a measurement that allows us to see into the future and adjust our strategies well before significant issues arise.
It is important to note that the Plan’s current financial position depends on investment performance as well as Plan experience. Returns have been positive in 30 of the last 35 years and total assets have increased significantly in recent years. However, the Plan’s liabilities (the amounts due to be paid to members), have increased by even more than the assets. The indicators used to make valuation assumptions and project the future health of the Plan vary over time and include, but are not limited to: expected future contributions, anticipated return on investment, estimated life expectancy and interest rates.
The Plan’s less than fully funded status can be attributed to:
• Historically low interest rates during the last decade. Interest rates are a key assumption used to calculate the Plan’s solvency liability. The interest rate is determined based on yields on long-term bonds and is mandated by the government and the actuarial profession. The Trustees have no control over the selection of this assumption. When interest rates decline, the solvency liability increases. Conversely, when interest rates rise, the solvency liability decreases. Although Plan assets were over half a billion greater in 2012 than they were in 2000, the decline in the assumed long-term interest rates (from 6.25% in 2000 to 3.0% in 2012), had the greatest effect on Plan solvency and contributed to increasing the solvency liability by $2.58 billion;
• The number of pensioners has doubled since 1990, while the number of active members has declined by two thirds which translates into fewer members contributing, with a greater number of members drawing a pension;
• Improved life expectancies - pension benefits are being paid out longer with increases in longevity;• Increases in early retirement as members are retiring earlier and collecting a pension for longer;• Recent market conditions in the forest industry which have led to mill closures and jobs shed and as a result, fewer
contributions; and• The financial market downturn of 2008 and instability in world markets since that time.
going ConCern aCTuarial liabiliTy
The last filed going concern actuarial valuation as at December 31, 2012, disclosed actuarial assets of $2,827,948,000 with accrued pension liabilities of $3,225,393,000, resulting in a net unfunded liability of $397,445,000, or a ratio of assets to liabilities of 87.7%.
A key actuarial assumption included in this valuation is an assumed long-term investment return of 6.75% per year. When the going concern actuarial liability is larger than the Plan’s actuarial value of assets, the shortfall must be paid into the Plan over a period not exceeding 10 years.

IWA - Forest Industry Pension PlanAnnual Report 2013
15
finanCial inforMaTion
solvenCy liabiliTy
The December 31, 2012 solvency valuation, filed with the Superintendent of Pensions, disclosed actuarial assets of $2,820,878,000 with accrued pension liabilities of $4,696,187,000, resulting in a net unfunded liability of $1,627,523,000. The solvency ratio at that time was 60.1%, indicating that the Plan did not have sufficient assets to cover all the benefits that had been promised as of that date, based on the “hypothetical” scenario that the Plan wound up on December 31, 2012.
hisToriCal going ConCern and solvenCy raTios
1987
1988
1989
1990
1991
1992
1993
1994
1995
1996
1997
1998
1999
2000
2001
2002
2003
2004
2005
2006
2007
2008
2009
2010
2011
2012
GoInG concern rAtIo 6
0.2
55.6
61.8
61.5
65.5
61.0
63.0
68.0
76.4
82.1
88.0
91.0
92.0
94.2
95.0
84.0
85.6
87.7
96.5
103.6
*103
.3
*86.
4
94.0
*93.
6
*87.
2
87.7
solvency rAtIo 64.2
60.6
69.9
65.0
70.8
63.9
65.7
66.0
77.3
85.3
85.3
81.2
97.4
100.
0
93.0
84.0
87.6
89.4
85.8
94.0
*92.
6
*74.
0
74.0
*75.
3
*61.
5
60.1
*estimated
reCenT Plan aMendMenTs
Because the negotiated contribution rate in the applicable collective agreements was less than the minimum required contribution rate needed to comply with the Regulations, the Board of Trustees spent considerable time and effort considering options regarding how the shortfall might be addressed. The following is a summary of the amendments approved by Superintendent of Pensions for the Plan:
• Effective July 1, 2014, the negotiated contribution rate will increase by $1.60 per hour, $1.00 from employers and $0.60 from members. As not all operations have concluded negotiations, this proposed rate increase is still in progress;
• Removal of the “Involuntary Job Loss” provision for eligible members experiencing an involuntary job loss on or after July 1, 2014;
• Cancellation of commuted value balance payments due after March 1, 2014. Please be advised that a letter to each member affected by this amendment was mailed on June 4, 2014;
• Effective March 1, 2014, members who choose to postpone their pension until after the age of 65 will no longer be entitled to an actuarial increase based on their postponed retirement date; and
• What is known as the “50% Rule” with regard to employee contributions will be suspended from March 1, 2014 until December 31, 2015. This rule affects a small group of members who leave the Plan and take a commuted value of their benefit and have been members for only a short time.
The Board of Trustees continues its commitment to all beneficiaries of the Plan and the sustainability of the Plan. The Plan must meet the retirement needs of those already receiving a pension as well as those who will retire decades from now. This requires that the Plan adapts to reflect the current economic and demographic projections.For more details regarding these amendments, please see our website at www.iwafibp.ca. Should you wish to discuss these changes and how your pension may be affected, please contact the Plan office, with caution that call volume may be higher than usual.

IWA - Forest Industry Pension PlanAnnual Report 2013
16
finanCial inforMaTion
suMMarized finanCial sTaTeMenTs for 2013
sTaTeMenT of finanCial PosiTion
December 31 2013 2012
ASSETS
Investments $ 3,115,335,868 $ 2,814,398,496
Cash 26,431,845 25,408,457
Contributions receivable
Employee 3,040,364 3,199,407
Employer 5,015,715 5,289,338
Other receivables 484,377 612,451
Prepaid expenses and other assets 65,063 55,266
Leasehold improvements 835,224 896,937
3,151,208,456 2,849,860,352
LIABILITIES
Payables and accruals 2,257,062 1,796,185
Commuted values payable 26,158,536 20,185,728
28,415,598 21,981,913
Net assets available for benefits 3,122,792,858 2,827,878,439
Pension obligations 3,189,350,000 3,124,699,000
Deficiency $ (66,557,142) $ (296,820,561)

IWA - Forest Industry Pension PlanAnnual Report 2013
17
finanCial inforMaTion
suMMarized finanCial sTaTeMenTs for 2013
sTaTeMenT of Changes in neT asseTs available for benefiTs
December 31 2013 2012
REVENUENet Investment Income $ 81,396,171 $ 146,114,975
Realized and unrealized gain on investments 358,357,145 124,443,205
439,753,316 270,558,180
CONTRIBUTIONSEmployer 57,375,228 55,771,442
Employee 35,216,948 33,147,717
532,345,492 359,477,339
EXPENSESBenefit payments 232,827,062 236,866,147
Administrative 3,822,505 3,659,532
Non-administrative 781,506 843,815
237,431,073 241,369,494
Increase in net assets available for benefits $ 294,914,419 $ 118,107,845
Net assets available for benefits, beginning of year $ 2,827,878,439 $ 2,709,770,594
Increase in net assets available for benefits 294,914,419 118,107,845
Net assets available for benefits, end of year $ 3,122,792,858 $ 2,827,878,439
IWA - Forest Industry Pension PlanAnnual Report 2013
18
finanCial inforMaTion
benefiT PayMenTs
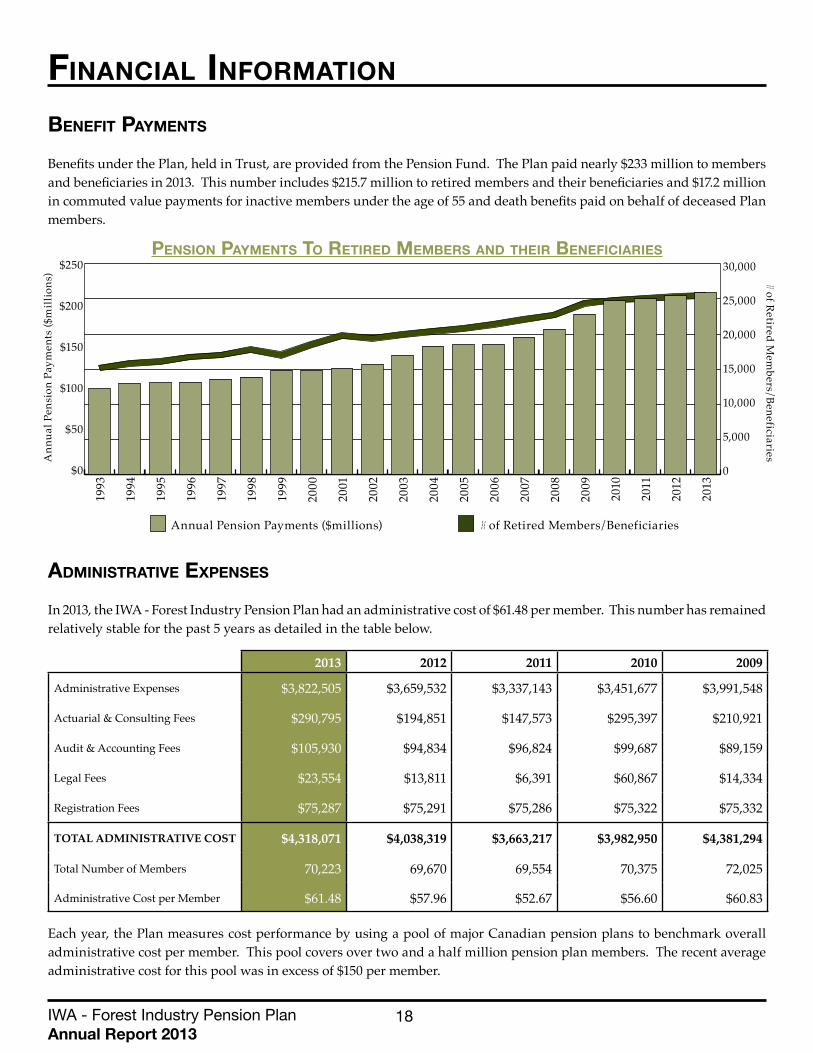
Benefits under the Plan, held in Trust, are provided from the Pension Fund. The Plan paid nearly $233 million to members and beneficiaries in 2013. This number includes $215.7 million to retired members and their beneficiaries and $17.2 million in commuted value payments for inactive members under the age of 55 and death benefits paid on behalf of deceased Plan members.
Pension PayMenTs To reTired MeMbers and Their benefiCiaries
adMinisTraTive exPenses
In 2013, the IWA - Forest Industry Pension Plan had an administrative cost of $61.48 per member. This number has remained relatively stable for the past 5 years as detailed in the table below.
2013 2012 2011 2010 2009
Administrative Expenses $3,822,505 $3,659,532 $3,337,143 $3,451,677 $3,991,548
Actuarial & Consulting Fees $290,795 $194,851 $147,573 $295,397 $210,921
Audit & Accounting Fees $105,930 $94,834 $96,824 $99,687 $89,159
Legal Fees $23,554 $13,811 $6,391 $60,867 $14,334
Registration Fees $75,287 $75,291 $75,286 $75,322 $75,332
TOTAL ADMINISTRATIVE COST $4,318,071 $4,038,319 $3,663,217 $3,982,950 $4,381,294
Total Number of Members 70,223 69,670 69,554 70,375 72,025
Administrative Cost per Member $61.48 $57.96 $52.67 $56.60 $60.83
Each year, the Plan measures cost performance by using a pool of major Canadian pension plans to benchmark overall administrative cost per member. This pool covers over two and a half million pension plan members. The recent average administrative cost for this pool was in excess of $150 per member.
0
50
100
150
200
250
1993
1994
1995
1996
1997
1998
1999
2000
2001
2002
2003
2004
2005
2006
2007
2008
2009
2010
2011
2012
2013
$250
$200
$150
$100
$50
$0
30,000
25,000
20,000
15,000
10,000
5,000
0
# of Retired Mem
bers/BeneficiariesAnn
ual P
ensi
on P
aym
ents
($m
illio
ns)
Annual Pension Payments ($millions) # of Retired Members/Beneficiaries

IWA - Forest Industry Pension PlanAnnual Report 2013
19
finanCial inforMaTion
invesTMenT & CusTodial exPenses
The Investment Fees for 2013 totalled $10,897,192. Custodial Fees for the year totalled $285,940. This computes to 0.36% of the Market Value of the Pension Fund. Investment management fees can vary greatly and are a product of the size and type of asset being managed. Investment and Custodial Fees are usually calculated as an annual percentage of the average total net asset value of the fund. In some cases, additional investment manager fees are netted against asset values and performance based fees may be payable, and therefore are not included in the table below.
The following table illustrates the last five years of the Plan’s Investment and Custodial Fees:
2013 2012 2011 2010 2009
Investment Fees $10,897,192 $10,501,088 *$10,209,287 *$9,059,226 *$8,151,323
Custodial Fees $285,940 $465,028 $653,544 $603,986 $611,438
TOTAL $11,183,132 $10,966,116 $10,862,831 $9,663,212 $8,762,761
Market Value of Fund $3,122,792,858 $2,827,878,439 $2,709,770,594 $2,867,886,359 $2,757,754,248
% of Market Value of Fund 0.3581% 0.3878% 0.4009% 0.3369% 0.3177%
*These amounts have been restated to include estimated amounts directly netted from investment funds.
annual Cash flow
The Plan’s revenue and contributions totalled $532,345,492 in 2013, which includes an increase from employer and employee contributions of $92,592,176 and an investment gain of $439,753,316. The benefit payments and expenses totalled $237,431,073. The value of the Pension Fund therefore increased by $294,914,419 during 2013.
invesTMenT inCoMe & ConTribuTions vs. benefiT PayMenTs & exPenses$600
$400
$200
$0
$-200
$-400
$-600
($m
illio
ns)
-600
-400
-200
0
200
400
600
-600
-400
-200
0
200
400
600
-600
-400
-200
0
200
400
600
-600
-400
-200
0
200
400
600
-600
-400
-200
0
200
400
600
1993
1994
1995
1996
1997
1998
1999
2000
2001
2002
2003
2004
2005
2006
2007
2008
2009
2010
2011
2012
2013
Investment Income Benefit Payments & Total ExpensesContributions Contributions + Investment Income

IWA - Forest Industry Pension PlanAnnual Report 2013
20
finanCial inforMaTion
ConTribuTory hours
The Plan had a total of 21,554,477 hours reported for 2013 (20,529,080 hours were reported in 2012). This represents a substantial increase, 35% from 2009 (15,915,669 hours). This increase can be partially attributed to a rise in softwood lumber exports to China and a modest recovery in the US housing market.
The forest industry has however undergone many challenges in the last decade. The rapid pace of technological change, automation within the industry, the softwood lumber dispute and recent market conditions have been challenging for the industry, ultimately resulting in a steady decline in contributions over the last 10 years. As the industry is restructured, the hours reported have declined by approximately 56% since 1993.
ConTribuTory hours rePorTed (20 years)
20000000
30000000
40000000
50000000
6000000060.0
50.0
40.0
30.0
20.0
10.0
0.0
1993
1994
1995
1996
1997
1998
1999
2000
2001
2002
2003
2004
2005
2006
2007
2008
2009
2010
2011
2012
2013
(mill
ions
)
201321,554,477 hours reported56% decrease over 20 years
199349,002,495 hours reported

IWA - Forest Industry Pension PlanAnnual Report 2013
21
glossary
Active Member - A member of a participating employer who maintains continuous employment. For the purpose of the Plan, continuous employment means that the member does not incur a break-in-service or maintains 350 qualifying hours, as defined by the Plan Text, in two consecutive calendar years.
Actuarial Liability - An estimate of the Plan’s financial obligations, which uses actuarial assumptions (economic and demographic) and assumes that the Plan continues indefinitely.
Actuarial Valuation - Examination of a pension plan by an actuary to assess the solvency of the plan and determine the level of contributions required to maintain or improve its solvency (solvency valuation). Also included is a going concern valuation used to determine the value of a plan assuming it will continue to operate indefinitely as a going concern.
Actuarial Value of Assets - The theoretical value of the Plan assets as of a given date, determined by applying a set of actuarial assumptions (economic and demographic). The actuarial value of assets smooths the gains and losses of the market value of assets over a four-year period.
Actuary - A trained specialist in the pension field responsible for determining pension plan liabilities. In Canada, full professional recognition requires membership in the Canadian Institute of Actuaries.
Annuity - A series of equal payments made at intervals to an individual from a lump sum investment either for life or for a specified period of time.
Benchmark - An “Investment Benchmark” is the index representative of the asset class against which a portfolio manager’s investment performance is evaluated.
Beneficiary - A person designated by a Plan member to receive benefits.
Board of Trustees or Trustees - Those persons appointed under the Trust Agreement acting as fiduciaries, holding the assets and administering the Plan for the members’ and beneficiaries’ benefit.
Bond - A certificate of debt issued by a government or corporation guaranteeing payment of the original investment plus interest by a specified future date. Also referred to as a fixed-interest security.
Commuted Value - The actuarial present value of the pension benefits to which a Plan member or former Plan member may be entitled to, calculated in accordance with the Pension Benefits Standards Act of British Columbia which takes into account several variables such as life expectancies and interest rates relevant at the time.
Custodian - A financial institution or trust company that holds in custody and for safekeeping, the securities and other assets of a trust fund.
Early Retirement - Retirement prior to a member’s “normal” retirement date (65 years of age). Members of the IWA - Forest Industry Pension Plan can commence their pension anytime after age 55 with the appropriate actuarial reductions.
Emerging Markets - the financial markets of developing economies.
Equity or Equities - Refers to the ownership of property, usually in the form of common stocks, as opposed to fixed income bearing securities such as bonds or mortgages.
Going Concern - Refers to the assumption that the Plan will continue indefinitely, people will retire, terminate, and die in the normal patterns.

IWA - Forest Industry Pension PlanAnnual Report 2013
22
glossary
Inactive Member - Often referred to as “vested deferred” member. Member has a break-in-service or has failed to maintain 350 qualifying hours, as defined by the Plan Text, in two consecutive calendar years.
Investment Fee - The service fee of the investment managers. Varies depending on the size of the fund and rate of return.
Long Bonds - Bonds with a term to maturity of more than 10 years.
Market Value - The current price at which a security or commodity is trading as indicated by current market conditions.
Member Services - Plan staff available to members to answer questions and provide forms.
Normal Retirement Date - Age 65 is the normal age of retirement in this Plan. It is the age at which a Plan member can retire and receive full unreduced pension. However, because of a special Plan provision, active members can retire with a fully subsidized pension at age 60.
Pension Fund (“Fund”) - The account where monies received by the Trustees, including employer and employee contributions and investment income are held in Trust.
Plan Member (“Member”) - A person who has become covered by the Plan and continues to be covered under the Plan.
Plan Sponsor - Plan sponsor means an employer, association or any other entity providing a benefit plan. For this Plan, the Plan sponsors are the United Steelworkers and the employer associations: FIR, I.F.L.R.A., CONIFER and other independent employers.
Plan Text - The document which sets out the eligibility requirements to become a member of the Plan and the amount of benefits that will be paid to Plan members and beneficiaries.
Portfolio - A compilation of investments held by an institution or individual.
Solvency - The capacity of an entity to pay future benefits or claims that have been promised; calculated in terms of a specific date.
Solvency Valuation - The valuation of the liabilities and assets of a pension plan determined as if the plan had been wound up on the valuation date using methods and actuarial assumptions in accordance with generally accepted actuarial principles and practices appropriate for such determination.
Subsidized Early Retirement Reduction - A benefit that allows active members of the Plan to retire early with little or no reduction to their pension (55-59 marginal reduction, 60+ no reduction).
Trust - The property held by the Trustees for the benefit of another under a fiduciary relationship to be used only for the purposes set out in the Trust Agreement.
Trust Agreement - The agreement entered into by the union and employer association groups that established the Pension Trust and Pension Plan.
Wind Up / Wound Up - Discontinuation of a pension plan as regulated by law. The plan is essentially shut down as of a given date and the pensions are paid out according to the solvency calculated on the specific date.

Image D-04875 courtesy of Royal BC Museum, BC Archives [ca. 1926]

IWA - Forest Industry PensIon PlAnSuite 2100 - 3777 KingswayBurnaby BC V5H 3Z7
Main Switchboard: 604-433-6310Toll Free in BC: 1-800-663-4384Pension Information: 604-433-5862Pension Toll Free: 1-800-913-0022Facsimile: 604-433-0518
Website: www.iwafibp.ca®


