Government of Rajasthan Deptt. Of Watershed Development & Soil Conservation District Watershed Development Unit, Jhunjhunu. IWMP (2010-2011) - VIII (CHANANA) Block : -CHIRAWA District :- JHUNJHUNU Gram Panchayat : Chanana,Bhukana,Solana,Gowla,Bhadunda kalan Project Area :-5872 Ha. Project Cost :- 880.8 lac MANOJ KUMAR S.L.MEENA Assistant Engineer (P.I.A.) Executive Engineer (L.R.) Panchayat Samiti,CHIRAWA Cum Project M.WCDC jhunjhunu
Transcript
Government of Rajasthan
Deptt. Of Watershed Development & Soil Conservation
District Watershed Development Unit, Jhunjhunu.
IWMP (2010-2011) - VIII (CHANANA)
Block : -CHIRAWA District :- JHUNJHUNU
Gram Panchayat : Chanana,Bhukana,Solana,Gowla,Bhadunda kalan
The watershed falls in Agroclimatic Zone 2A .The soil texture is Sandy & Sandy loam. The average
rainfall is 456.7 mm . The temperature in the area varies between the range 30 to 49.5 centigrade
during summer and 0 to 38 centigrade during winter. The major crops in the area are Bajara, Chanwla, Guar, Wheat, Gram, Mustard. Land is under cultivation 4790.10 ha.(82 %), land fallow,
0% land is wasteland. 1.8% land is irrigated through well, Tube well. 75 No of households are BPL(2.18% total households) 534 are landless households(15.5%
total households) and 2632 household are small and marginal farmers(76.38% total household)
.Average land holding in the area is 1.39 ha. 72.75 % area is single cropped area and 27.25 % is
double cropped. The main source of irrigation is Tube well. The average annual rainfall (10 years) in
the area is 456.70 mm. The major festivals in the village are Holi, Deepawalee & Rakshabandhan.
At present this village is having 20736 population with Communities like
Jat,Rajput,Harijan,Brahmin,Gurjar and Kumawat, Muslim
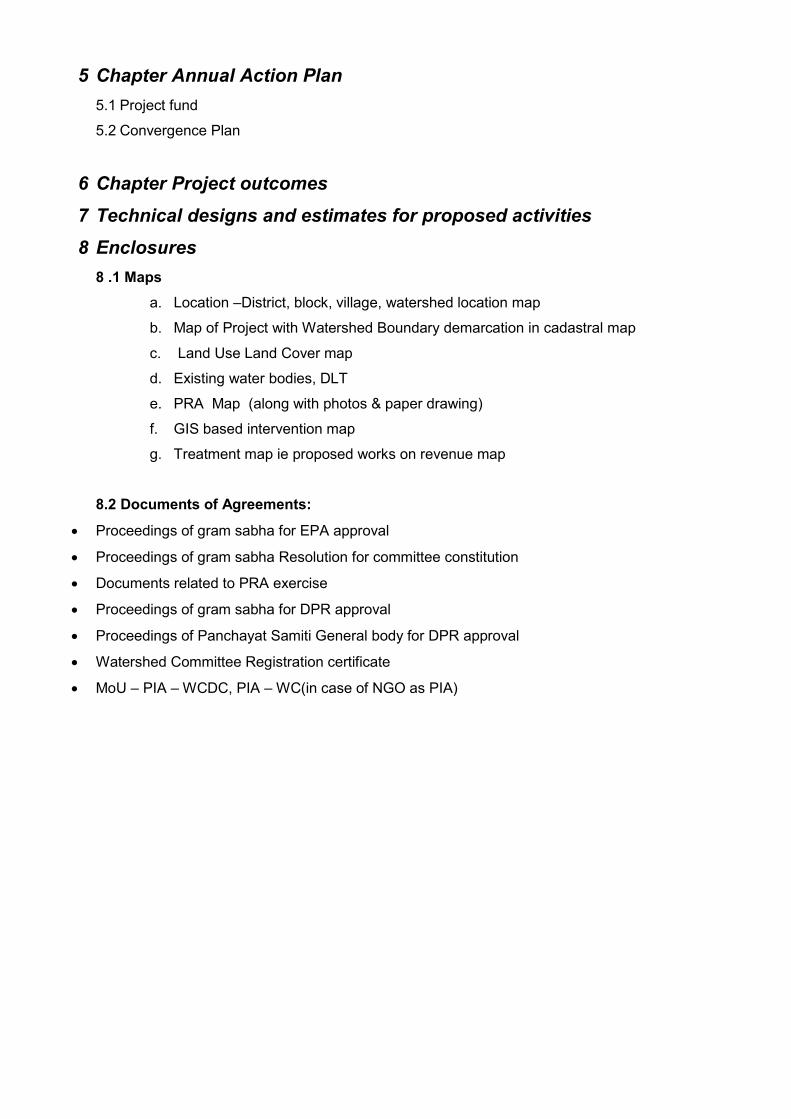
Climatic and Hydrological information 1 Average Annual Rainfall(mm)
2 Average Monthly rainfall (last ten years) Month Rainfall(mm) i) June 62.7 ii) July 107.7 iii) August 109.2 iv) September 63.9 3 Maximum rainfall intensity (mm)
4 Temperature (Degree C) Season Max Min i) Summer Season 49 30 ii) Winter Season 38 0 iii) Rainy Season 42 18
5 Potential Evaporation Transpiration (PET) (mm/day) Season PET i) Summer ii) Winter iii) Rainy
6 Runoff i) Peak Rate (cum/hr) - ii) Total run off volume of rainy season (ha.m.) - iii) Time of return of maximum flood
5 years 10 years In-Year
iv)Periodicity of Drought in village area 2 3 Other Development Schemes in the project area :
The Villages have been benefited by various schemes of rural development. Currently MGNREGA, Indira Awas Yojana, Swa-Jaldhara,
Total Sanitation Campaing, TFC, SFC, MP LAD, MLA LAD etc. This is the first watershed Project in these Villages.
I. MGNREGA (MNREGA) is an Indian Job Guarantee Scheme, enacted by legislation on August 25,2005. The scheme provides a legal
guarantee for one hundred days of employment in every financial year to adult members of any rural household willing to do public work
related unskilled manual work at the statutory minimum wage of Rs.133 Per day. Desilting of Talab, Gravel Road, Ditch cum bund
boundaries, plantation works has been carried out in the Villages under MGNREGA.
II. Total Sanitation Campaigfn (TSC) : Individual toilets are constructed under TSC programme.
III. Indira Awas Yojana : Houses for people under poverty (BPL) have been constructed under Indira Awas Yojana (IAY).
IV. Swa-Jaldhara : Facilitating organization working towards drinking water security and habitat improvement by empowering communities to
manage their local water sources, drinking water supply and environmental sanitation.
V. SFC & TFC : Facilitating works related to drinking water and environmental sanitation related works for rural community.
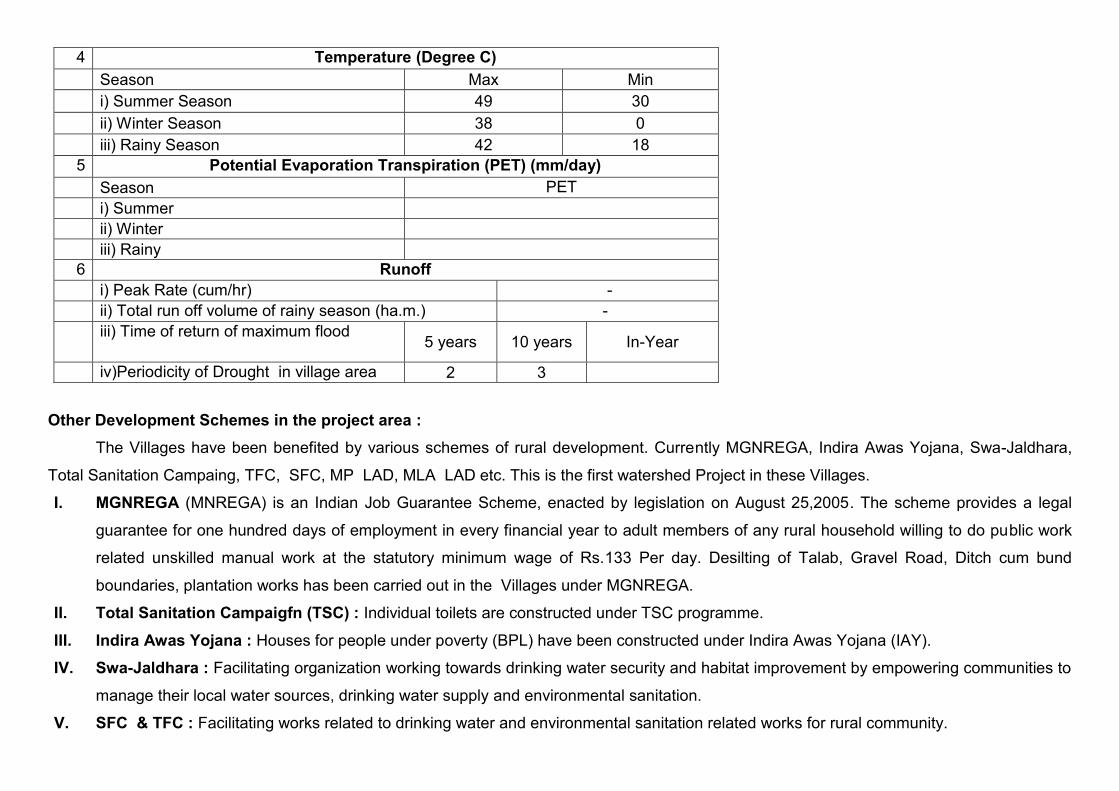
S.No Scheme
Name of the
department
Key interventions
under the Scheme
Targeted Beneficiaries
Provisions under the Scheme
1 MGNAREG
A Rural Dev. Employment guarantee Labours Employment guarantee
2 SFC Panch.
Raj.
Drinking water &
sanitation Villagers Drinking water &
sanitation
3 TFC Panch.
Raj.
Drinking water &
sanitation Villagers Drinking water &
sanitation
4 SGSY Rural Dev. Self
Employment Villagers Self Employment
5 Swajal Dhara
Central Govt.
Drinking Water Villagers Drinking Water
4 Indira Awas
Yojana Panch. Raj Housing B P L Housing Details of infrastructure in the project areas
Parameters Status (i) No. of villages connected to the main road by an all-
weather road 8
(ii) No. of villages provided with electricity 8 (iii) No. of households without access to drinking water Nil (iv) No. of educational institutions : (P
(v) No. of villages with access to Primary Health Centre 2 (vi) No. of villages with access to Veterinary Dispensary 2 (vii) No. of villages with access to Post Office 5 (viii) No. of villages with access to Banks 1 (ix) No. of villages with access to Markets/ mandis 1 (x) No. of villages with access to Agro-industries Nil (xi) Total quantity of surplus milk 58 Qt./day (xii) No. of milk collection centres (U)
The objective of WCDC are supervising, planning, implementing, documenting and
promoting watershed development projects and related development activities in the district, also
WCDC will work as direting to PIA for IWMP projects.
SWOT Analysis of the WCDC: Strength :
1. Dedicated and experienced and unexperience staff and a multi disciplinary team
2. Independent District Level Nodal Agency.
3. Strong linkages with national and state level institutions, agricultural universities as MPUAT,
Udaipur; Raj. Agri. University, Bikaner and NGOs for capacity building and tehnical
guidance.
4. Scientific planning in watershed projects with the help of College of Technology and
Engineerng, Udaipur, KVK Abusar Jhunjhunu and Other related Govt. Departments.
5. District level monitoring, coordination & co-operation Committee.
Weakness : 1. No permanent office building.
2. Project area is Rained Area. Three Year is Drought Out of Five Years.
Opportunities : 1. A Number of different other development schemes of the government are running; so,
there can be horizontal integration and convergence of programmes.
2. Better financial provision under IWMP
3. Usage of new ICT tools like GIS Threats :
1. Rainfall being very scarce and unreliable in the project area, the activities planned to be
taken up may yield limited impact.
2. Irregularities in fund flow can derail the smooth functioning.
3. Lack of contribution and cooperation from local people.
4. Low literacy rate in the project area.
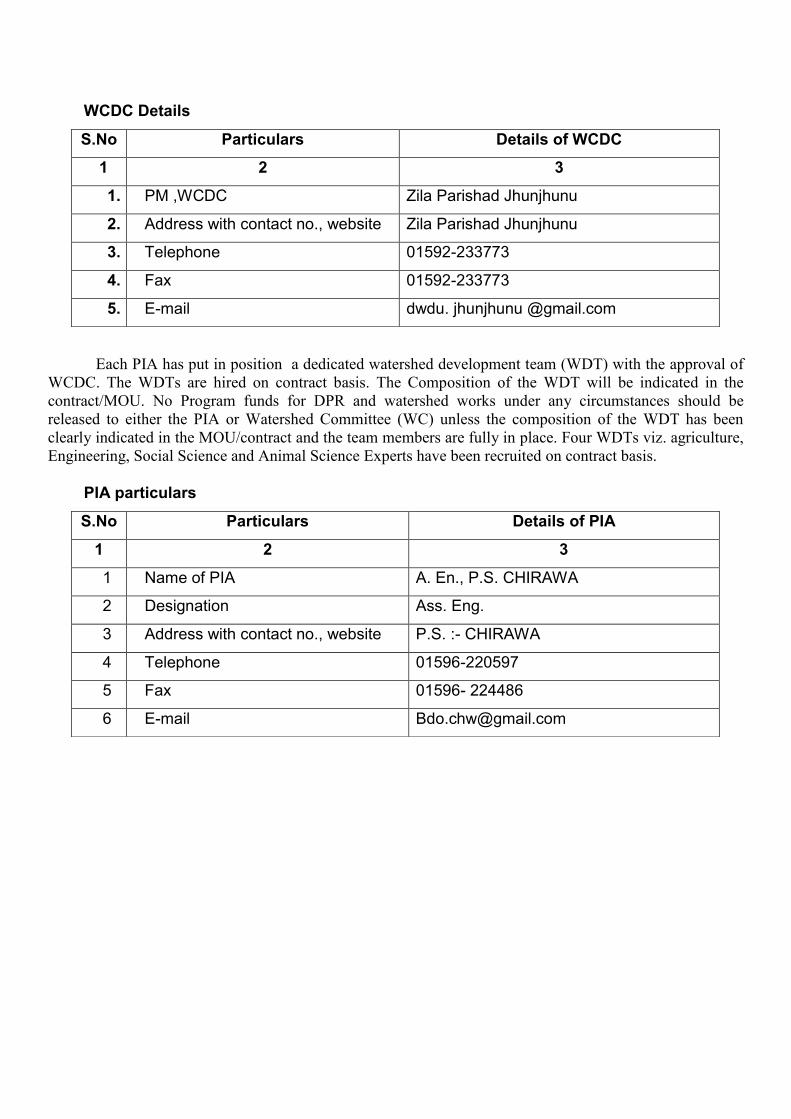
WCDC Details
Each PIA has put in position a dedicated watershed development team (WDT) with the approval of WCDC. The WDTs are hired on contract basis. The Composition of the WDT will be indicated in the contract/MOU. No Program funds for DPR and watershed works under any circumstances should be released to either the PIA or Watershed Committee (WC) unless the composition of the WDT has been clearly indicated in the MOU/contract and the team members are fully in place. Four WDTs viz. agriculture, Engineering, Social Science and Animal Science Experts have been recruited on contract basis.
PIA particulars
S.No Particulars Details of WCDC
1 2 3
1. PM ,WCDC Zila Parishad Jhunjhunu
2. Address with contact no., website Zila Parishad Jhunjhunu
3. Telephone 01592-233773
4. Fax 01592-233773
5. E-mail dwdu. jhunjhunu @gmail.com
S.No Particulars Details of PIA
1 2 3
1 Name of PIA A. En., P.S. CHIRAWA
2 Designation Ass. Eng.
3 Address with contact no., website P.S. :- CHIRAWA
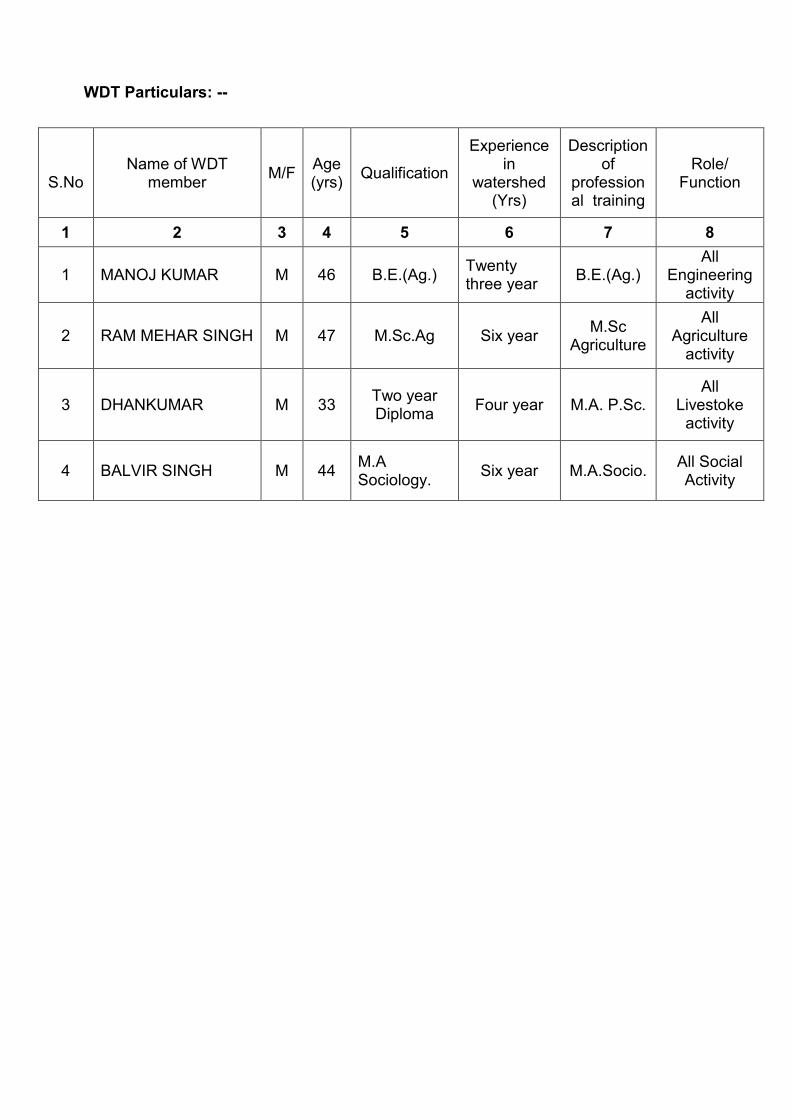
1 MANOJ KUMAR M 46 B.E.(Ag.) Twenty three year B.E.(Ag.)
All Engineering
activity
2 RAM MEHAR SINGH M 47 M.Sc.Ag Six year M.Sc Agriculture
All Agriculture
activity
3 DHANKUMAR M 33 Two year Diploma Four year M.A. P.Sc.
All Livestoke
activity
4 BALVIR SINGH M 44 M.A Sociology. Six year M.A.Socio. All Social
Activity
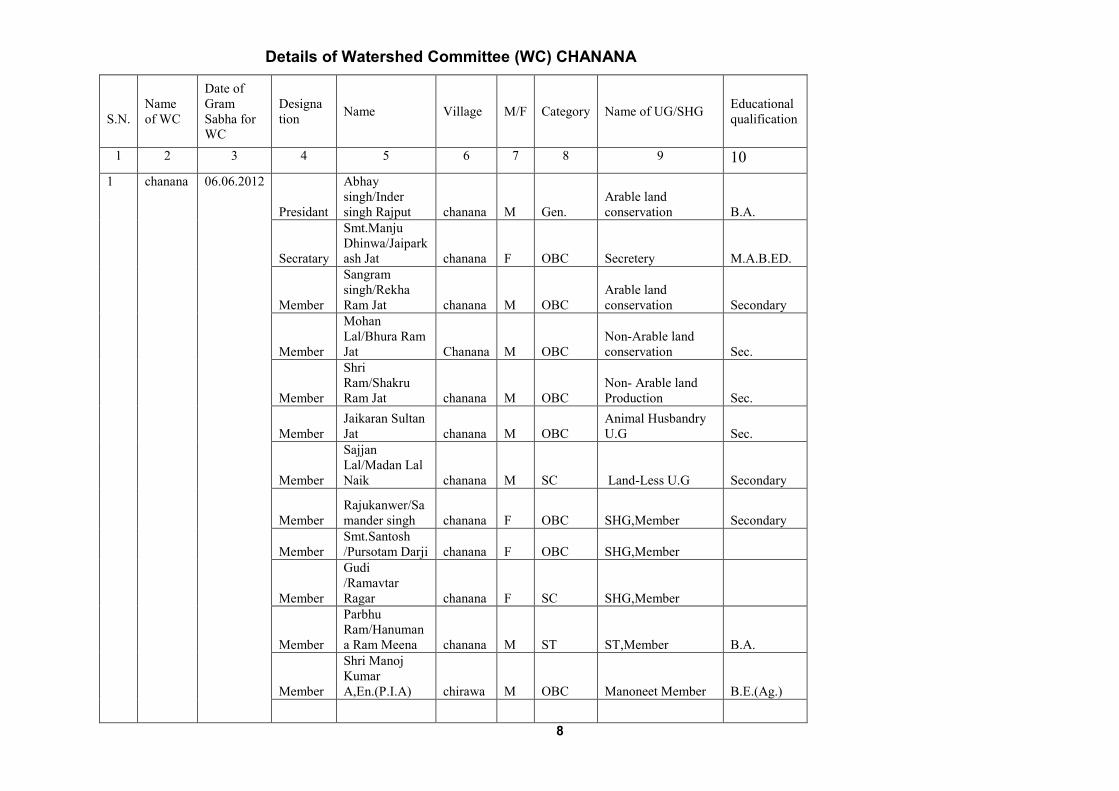
Details of Watershed Committee (WC) CHANANA
S.N.
Name of WC
Date of Gram Sabha for WC
Designa tion Name Village M/F Category Name of UG/SHG Educational
qualification
1 2 3 4 5 6 7 8 9 10 1
chanana 06.06.2012
Presidant
Abhay singh/Inder singh Rajput chanana M Gen.
Arable land conservation B.A.
Secratary
Smt.Manju Dhinwa/Jaiparkash Jat chanana F OBC Secretery M.A.B.ED.
Member
Sangram singh/Rekha Ram Jat chanana M OBC
Arable land conservation Secondary
Member
Mohan Lal/Bhura Ram Jat Chanana M OBC
Non-Arable land conservation Sec.
Member
Shri Ram/Shakru Ram Jat chanana M OBC
Non- Arable land Production Sec.
Member Jaikaran Sultan Jat chanana M OBC
Animal Husbandry U.G Sec.
Member
Sajjan Lal/Madan Lal Naik chanana M SC Land-Less U.G Secondary
Member Rajukanwer/Samander singh chanana F OBC SHG,Member Secondary
Member Smt.Santosh /Pursotam Darji chanana F OBC SHG,Member
Member
Gudi /Ramavtar Ragar chanana F SC SHG,Member
Member
Parbhu Ram/Hanumana Ram Meena chanana M ST ST,Member B.A.
Member
Shri Manoj Kumar A,En.(P.I.A) chirawa M OBC Manoneet Member B.E.(Ag.)
8
Details of Watershed Committee (WC) BHUKANA
S.N.
Name of WC
Date of Gram Sabha for WC
Designation Name Village M/F
Categ-ory Name of UG/SHG
Educational qualification
1 2 3 4 5 6 7 8 9 10 1
bhukana 13.05.2011 President Shri Juglal/Heera
Ram Jangir Bhukana M OBC Arabal Land Cioservation
Sacratary Sandeep Kumar Bhukana M OBC Sacratary B.A.
Member Mahaveer Parsad/Sanwal Ram Jat Bhukana M OBC
Non Arabal Land Coservation
Member Liladhar Soni/Hanuman Parsad Bhukana M OBC Land Less U.G.
Member Dharma Pal/Seodan Jat Bhukana M OBC
Arabal Land Conservatin
Member Shahi Ram/Jhutha Ram Jat Lodipura M OBC
Non Arabal Land Conservation
Member Manohar Singh/Durjan Singh Seolalpura M GEN.
Arabal Land Conservation
Mamber Jagdish Singh/Sugan Singh Seolalpura
M. GEN.
Arabal Land Conservation
Member Smt.Birma/Mahaveer Bhukana F ST. SHG,Member
Member Smt.Anpurna/Dinesh Sharma Bhukana F GEN. SHG,Member
Member Smt.Saroj/Subhash Meghwal Bhukana F SC SHG,Member
Member Shri Manoj Kumar Chirawa M OBC
A.En.PIA,Mnoneet Member
9
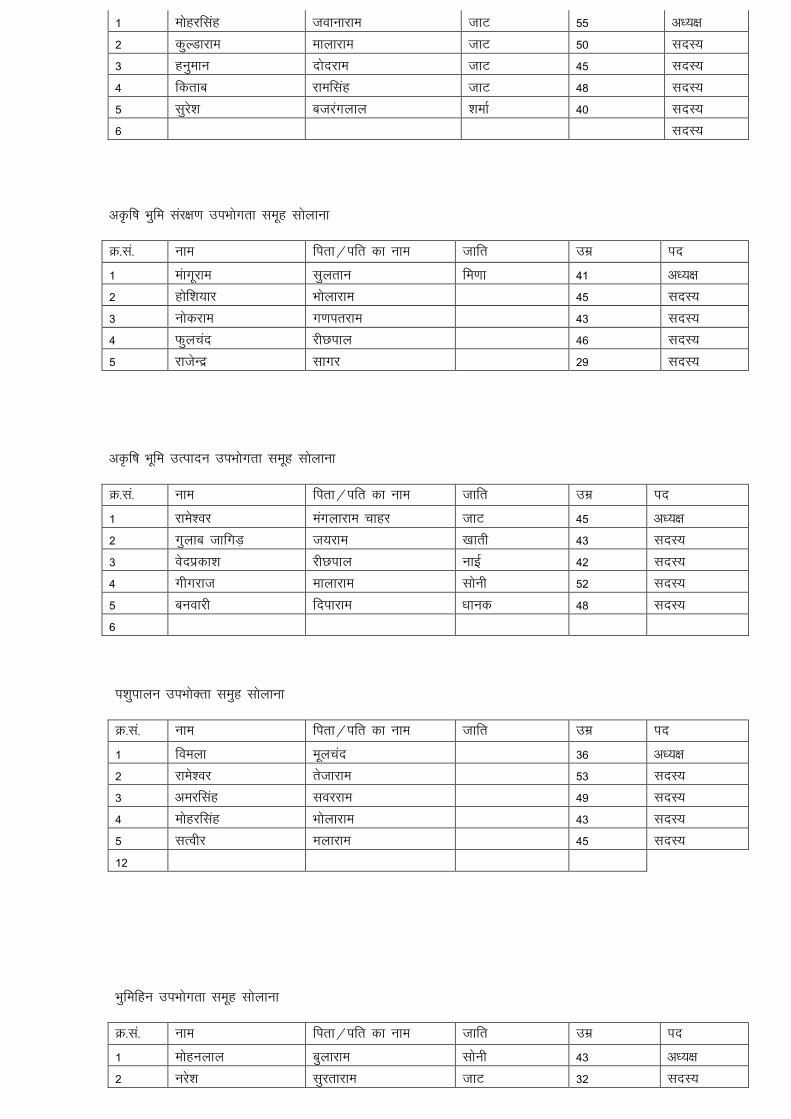
Details of Watershed Committee (WC) SOLANA
S.N. Name of WC
Date of Gram sabha for WC
Designation Name Village M/F Category Name of UG/SHG Educational
qualification
1 2 3 4 5 6 7 8 9 10
1
solana President
Mohar Singh/Jawana Ram Jat Solana M OBC
Arabal Land Conservation
Sacratary Buti Ram/Gokul Ram Jat Solana M OBC Sacratary
Member Harish Chander/Ram Niwash Jangir Solana M OBC
Arabal Land Conservation
Member Mangu Ram/Sultan Meena Solana M ST.
Non Arabal Land Conservation
Member Banwarilal/Deepa Ram Dhanak Solana M SC Mnoneet Member
Member Rameshwer /Mangla Ram Jat Solana M OBC
Non Arabal Land Conserevtion
Member Smt.Bimla /Mulchand Jat Solana F OBC
Animal Husbandary UG.
Member Mohan Lal /Gula RamSoni Solana M OBC Land Less UG
Member Smt.Sawitri/Durga Parsad Jat Solana F OBC SHG,Member
Member Smt.Patasi/Udmi Ram Jat Solana F OBC SHG,Member
Member Shri Manoj Kumar Chirawa M OBC A.En.PIA,Chirawa B.E.(Ag)
10
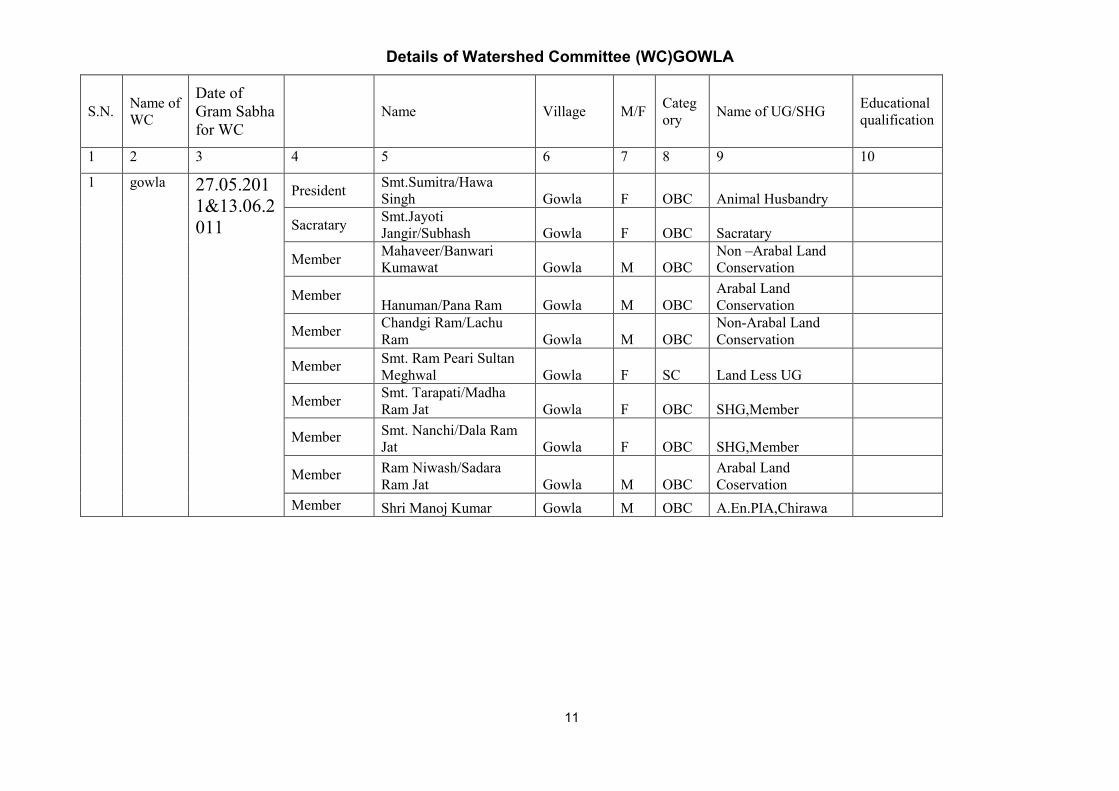
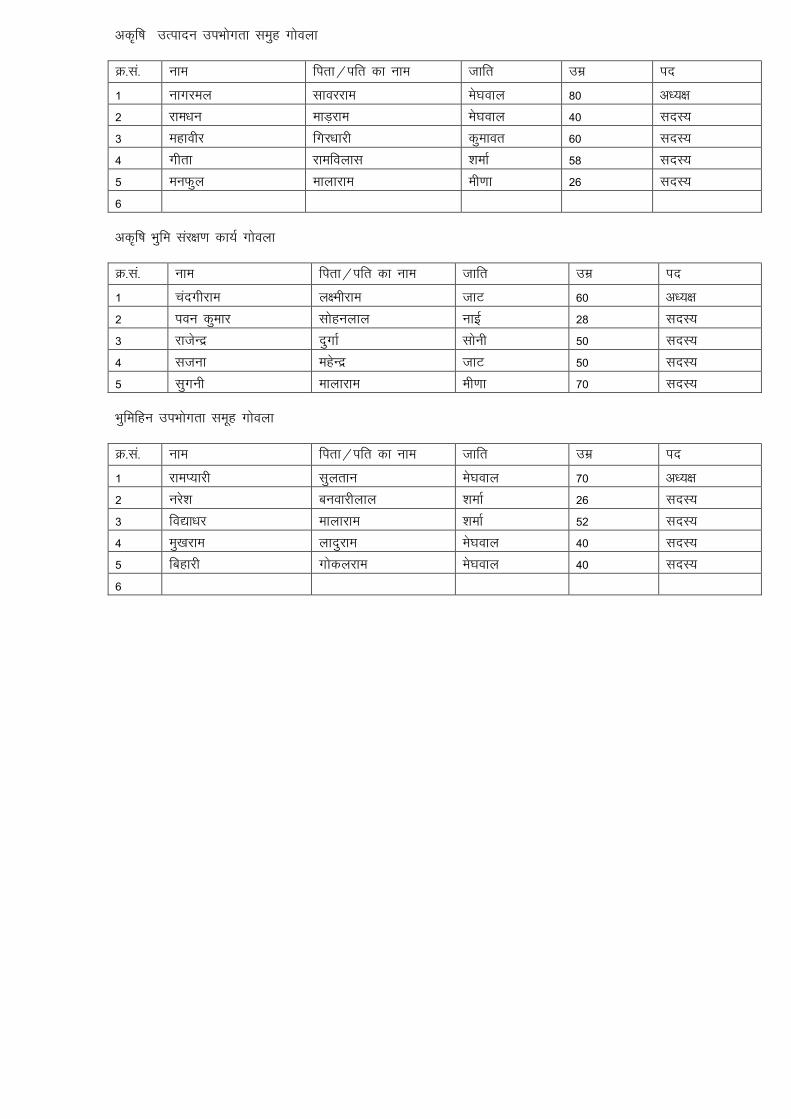
Details of Watershed Committee (WC)GOWLA
S.N. Name of WC
Date of Gram Sabha for WC
Name Village M/F Category Name of UG/SHG Educational
qualification
1 2 3 4 5 6 7 8 9 10
1
gowla 27.05.2011&13.06.2011
President Smt.Sumitra/Hawa Singh Gowla F OBC Animal Husbandry
Sacratary Smt.Jayoti Jangir/Subhash Gowla F OBC Sacratary
Member Mahaveer/Banwari Kumawat Gowla M OBC
Non –Arabal Land Conservation
Member Hanuman/Pana Ram Gowla M OBC
Arabal Land Conservation
Member Chandgi Ram/Lachu Ram Gowla M OBC
Non-Arabal Land Conservation
Member Smt. Ram Peari Sultan Meghwal Gowla F SC Land Less UG
Member Smt. Tarapati/Madha Ram Jat Gowla F OBC SHG,Member
Member Smt. Nanchi/Dala Ram Jat Gowla F OBC SHG,Member
Member Ram Niwash/Sadara Ram Jat Gowla M OBC
Arabal Land Coservation
Member Shri Manoj Kumar Gowla M OBC A.En.PIA,Chirawa
11
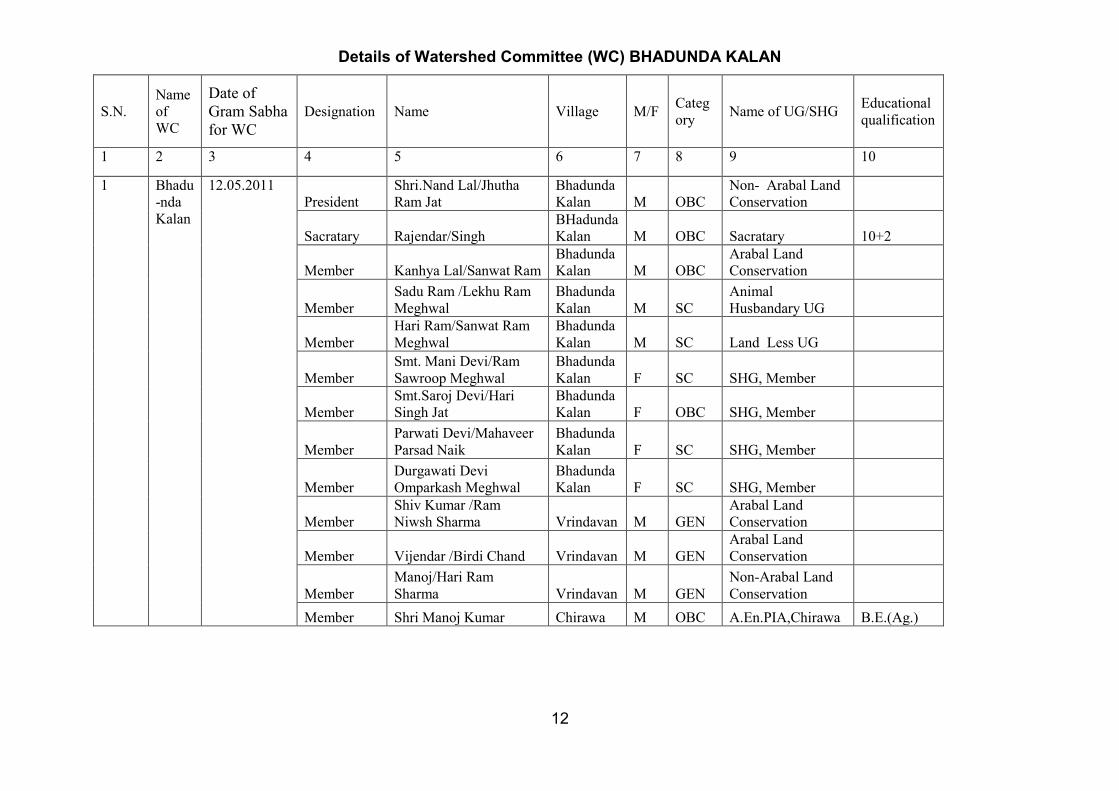
Details of Watershed Committee (WC) BHADUNDA KALAN
S.N. Name of WC
Date of Gram Sabha for WC
Designation Name Village M/F Category Name of UG/SHG Educational
qualification
1 2 3 4 5 6 7 8 9 10
1
Bhadu-nda Kalan
12.05.2011 President
Shri.Nand Lal/Jhutha Ram Jat
Bhadunda Kalan M OBC
Non- Arabal Land Conservation
Sacratary Rajendar/Singh BHadunda Kalan M OBC Sacratary 10+2
Member Kanhya Lal/Sanwat Ram Bhadunda Kalan M OBC
Arabal Land Conservation
Member Sadu Ram /Lekhu Ram Meghwal
Bhadunda Kalan M SC
Animal Husbandary UG
Member Hari Ram/Sanwat Ram Meghwal
Bhadunda Kalan M SC Land Less UG
Member Smt. Mani Devi/Ram Sawroop Meghwal
Bhadunda Kalan F SC SHG, Member
Member Smt.Saroj Devi/Hari Singh Jat
Bhadunda Kalan F OBC SHG, Member
Member Parwati Devi/Mahaveer Parsad Naik
Bhadunda Kalan F SC SHG, Member
Member Durgawati Devi Omparkash Meghwal
Bhadunda Kalan F SC SHG, Member
Member Shiv Kumar /Ram Niwsh Sharma Vrindavan M GEN
Arabal Land Conservation
Member Vijendar /Birdi Chand Vrindavan M GEN Arabal Land Conservation
Member Manoj/Hari Ram Sharma Vrindavan M GEN
Non-Arabal Land Conservation
Member Shri Manoj Kumar Chirawa M OBC A.En.PIA,Chirawa B.E.(Ag.)
12
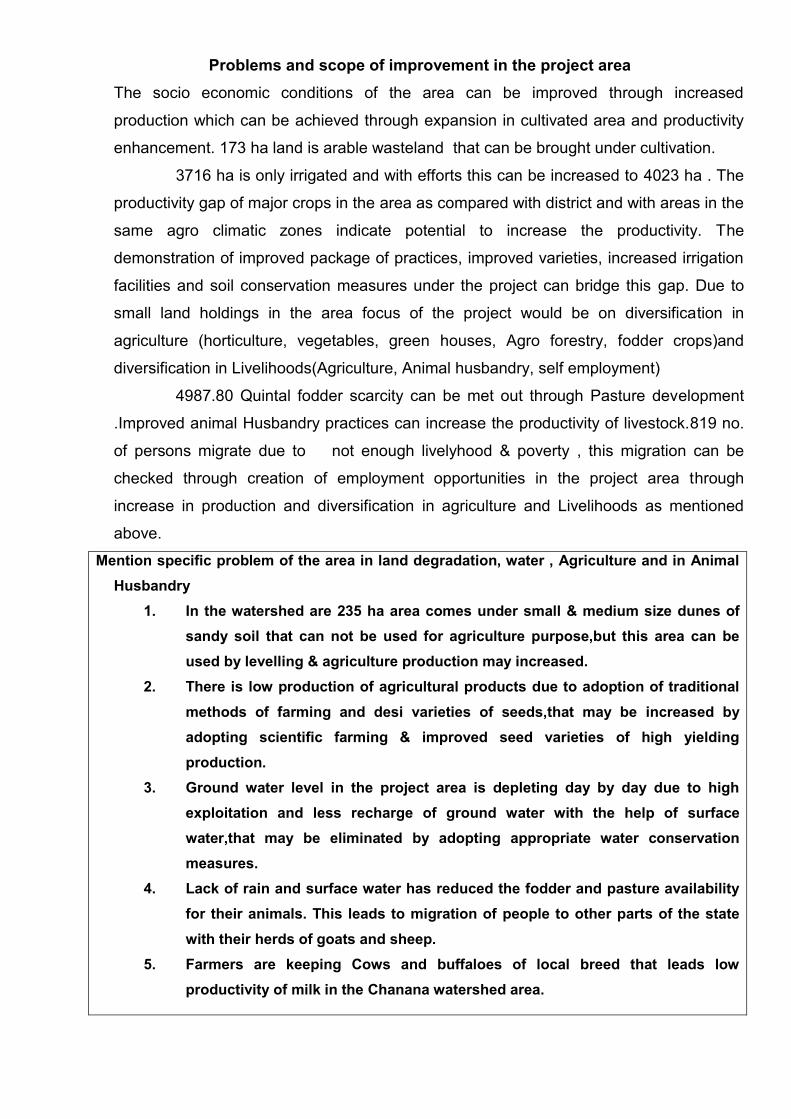
Problems and scope of improvement in the project area The socio economic conditions of the area can be improved through increased
production which can be achieved through expansion in cultivated area and productivity
enhancement. 173 ha land is arable wasteland that can be brought under cultivation.
3716 ha is only irrigated and with efforts this can be increased to 4023 ha . The
productivity gap of major crops in the area as compared with district and with areas in the
same agro climatic zones indicate potential to increase the productivity. The
demonstration of improved package of practices, improved varieties, increased irrigation
facilities and soil conservation measures under the project can bridge this gap. Due to
small land holdings in the area focus of the project would be on diversification in
agriculture (horticulture, vegetables, green houses, Agro forestry, fodder crops)and
diversification in Livelihoods(Agriculture, Animal husbandry, self employment)
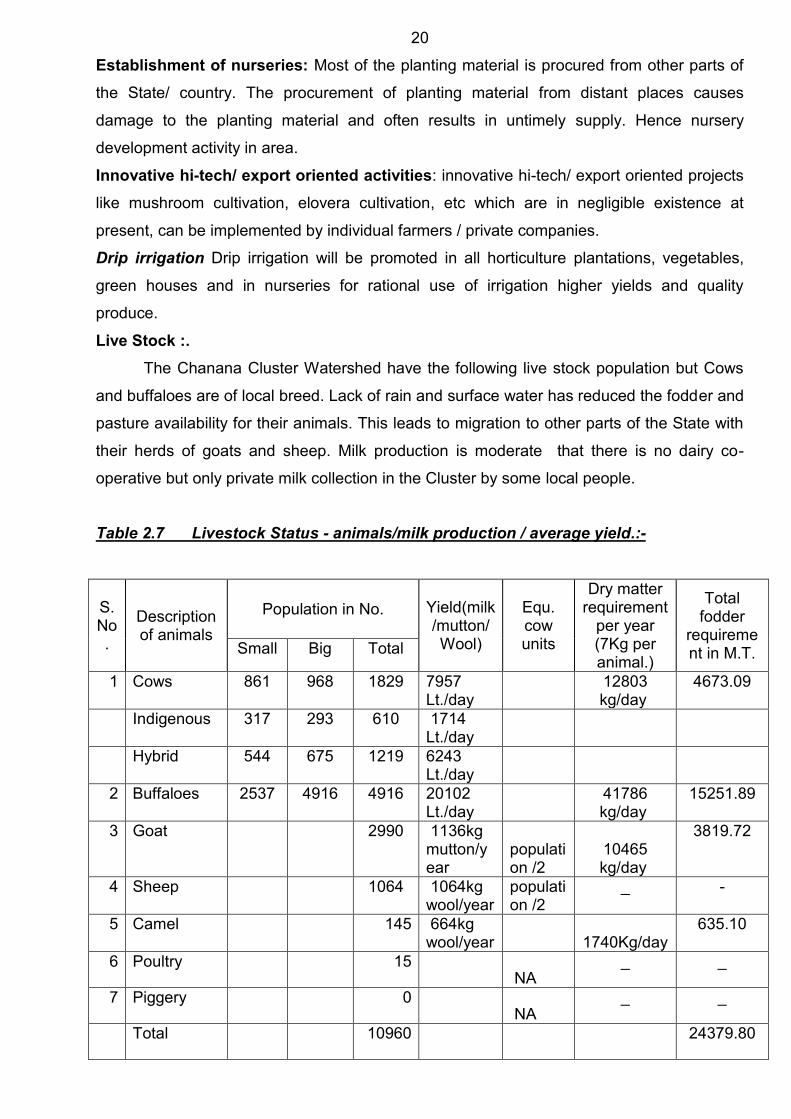
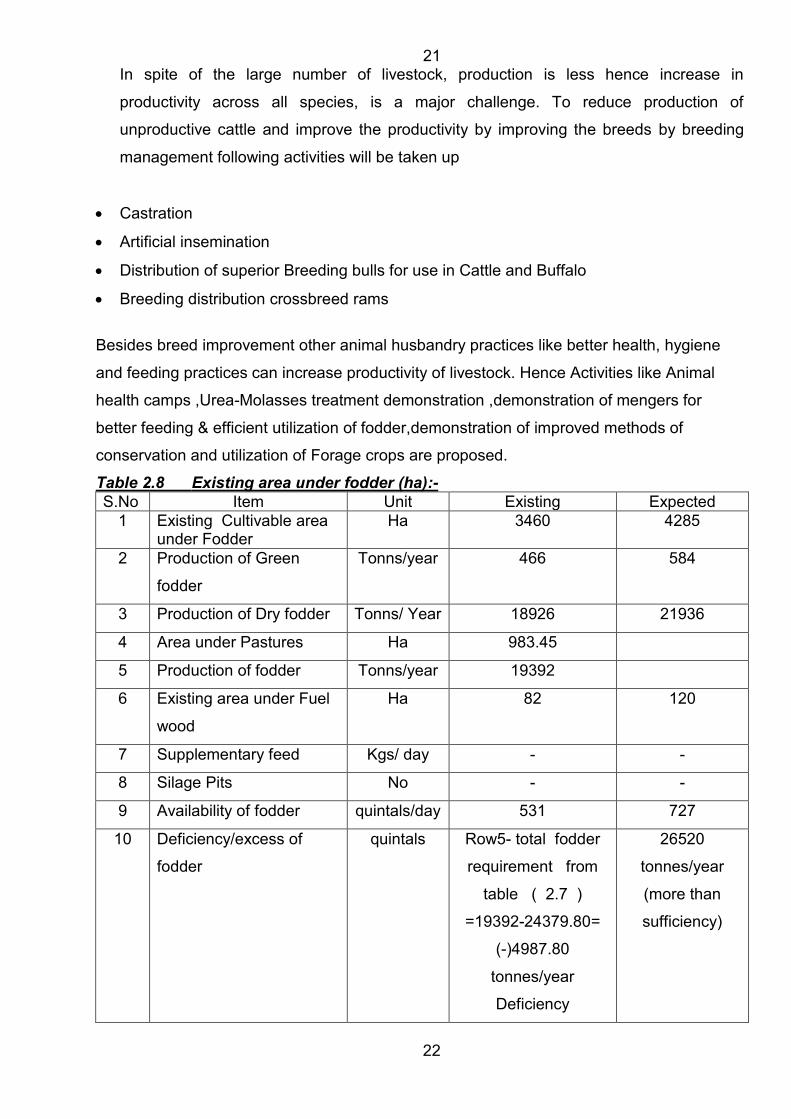
4987.80 Quintal fodder scarcity can be met out through Pasture development
.Improved animal Husbandry practices can increase the productivity of livestock.819 no.
of persons migrate due to not enough livelyhood & poverty , this migration can be
checked through creation of employment opportunities in the project area through
increase in production and diversification in agriculture and Livelihoods as mentioned
above.
Mention specific problem of the area in land degradation, water , Agriculture and in Animal Husbandry
1. In the watershed are 235 ha area comes under small & medium size dunes of sandy soil that can not be used for agriculture purpose,but this area can be used by levelling & agriculture production may increased.
2. There is low production of agricultural products due to adoption of traditional methods of farming and desi varieties of seeds,that may be increased by adopting scientific farming & improved seed varieties of high yielding production.
3. Ground water level in the project area is depleting day by day due to high exploitation and less recharge of ground water with the help of surface water,that may be eliminated by adopting appropriate water conservation measures.
4. Lack of rain and surface water has reduced the fodder and pasture availability for their animals. This leads to migration of people to other parts of the state with their herds of goats and sheep.
5. Farmers are keeping Cows and buffaloes of local breed that leads low productivity of milk in the Chanana watershed area.
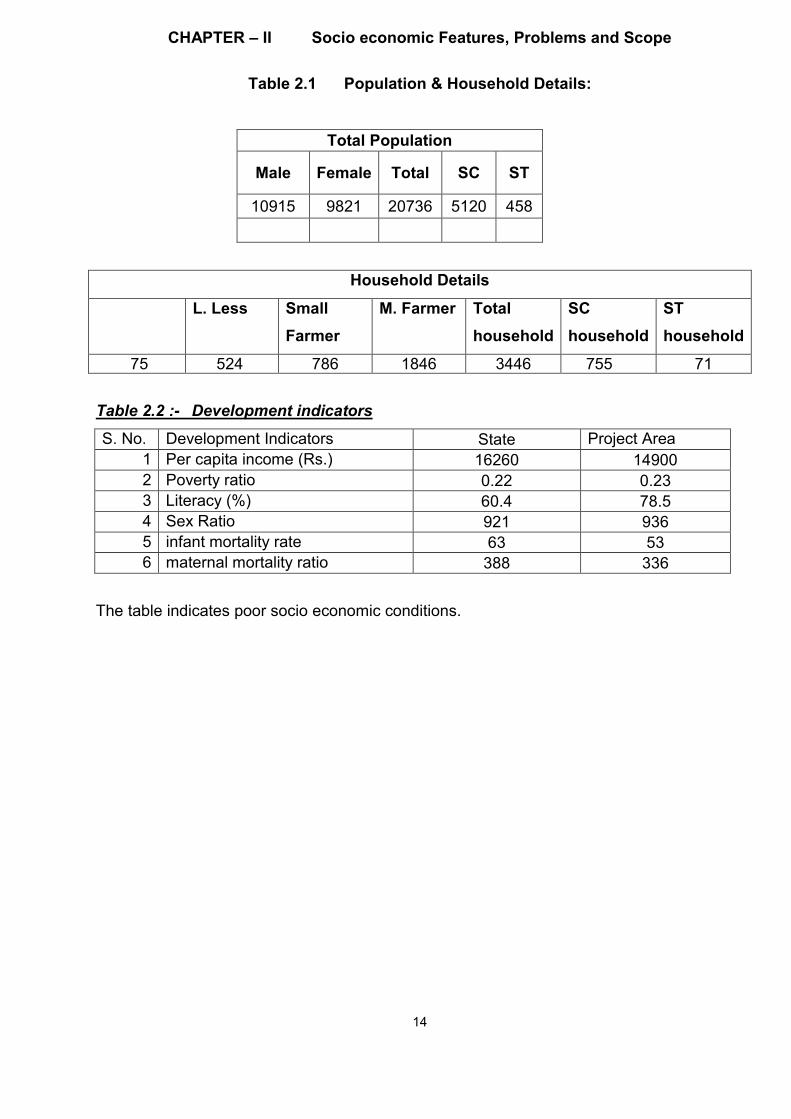
CHAPTER – II Socio economic Features, Problems and Scope
Table 2.1 Population & Household Details:
Total Population
Male Female Total SC ST
10915 9821 20736 5120 458
Household Details
L. Less Small Farmer
M. Farmer Total household
SC household
ST household
75 524 786 1846 3446 755 71
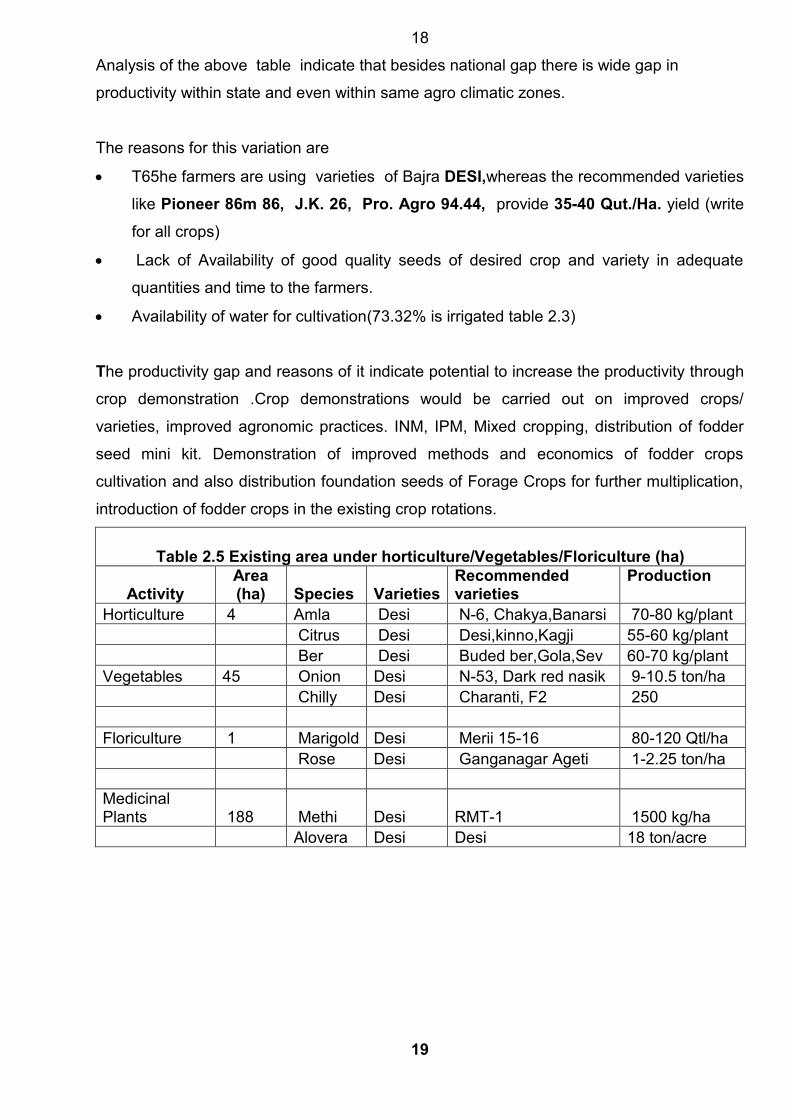
Table 2.2 :- Development indicators
S. No. Development Indicators State Project Area 1 Per capita income (Rs.) 16260 14900 2 Poverty ratio 0.22 0.23 3 Literacy (%) 60.4 78.5 4 Sex Ratio 921 936 5 infant mortality rate 63 53 6 maternal mortality ratio 388 336
The table indicates poor socio economic conditions.
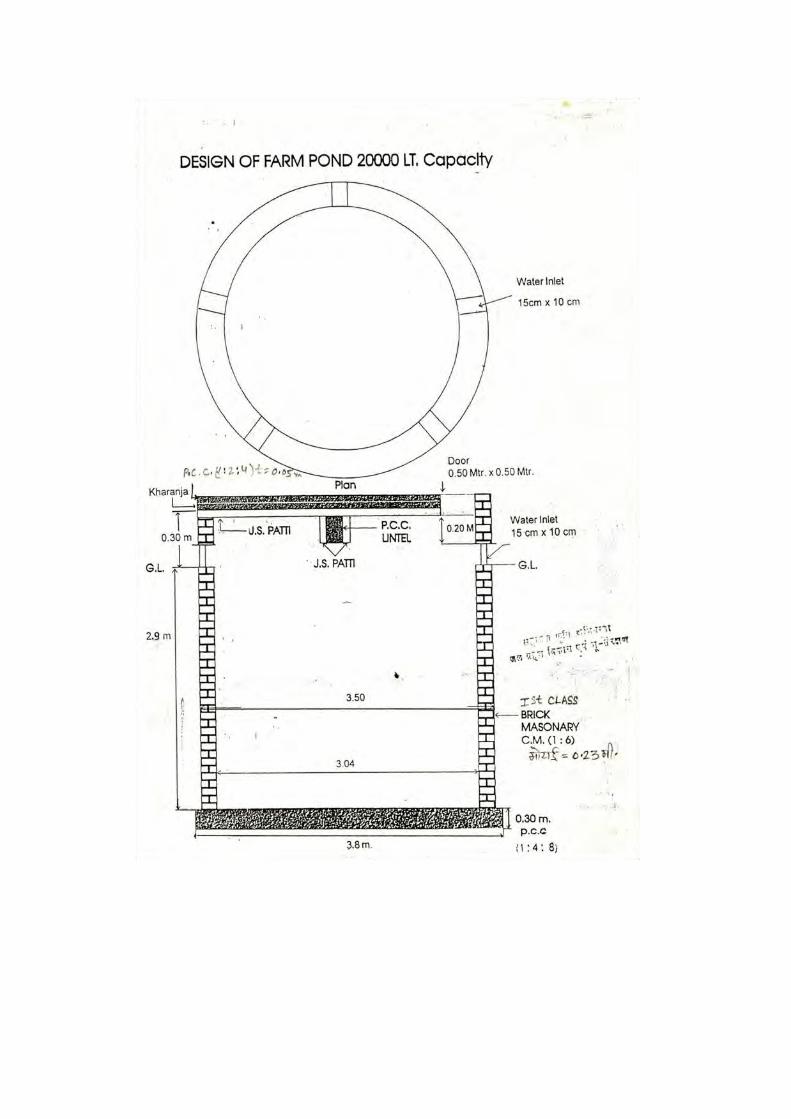
The project area has 173 ha of cultivable wasteland that can be brought under cultivation if
some irrigation source can be provided through Construction of WHS like Khadin, Tanka,
Farm ponds, etc. and also through demonstration of rainfed varieties of crops.
Construction of WHS can increase 65 ha. area under irrigation. (1.11% of the project area)
is under wastelands and can be brought under vegetative cover, with reasonable effort
.Activities like Earthen check dams, Vegetative filter strip, V-ditches, staggered trenches , Farm Ponds,WHS (Johad), Afforestation of wastelands and Pasture development will be
taken up on these lands.
Pasture development the land use table shows that there is 983.45 hectare pasture land
(16.75%).This emphasizes the need for taking up pastureland development works through
sowing of promising species of grasses and plantation.
15
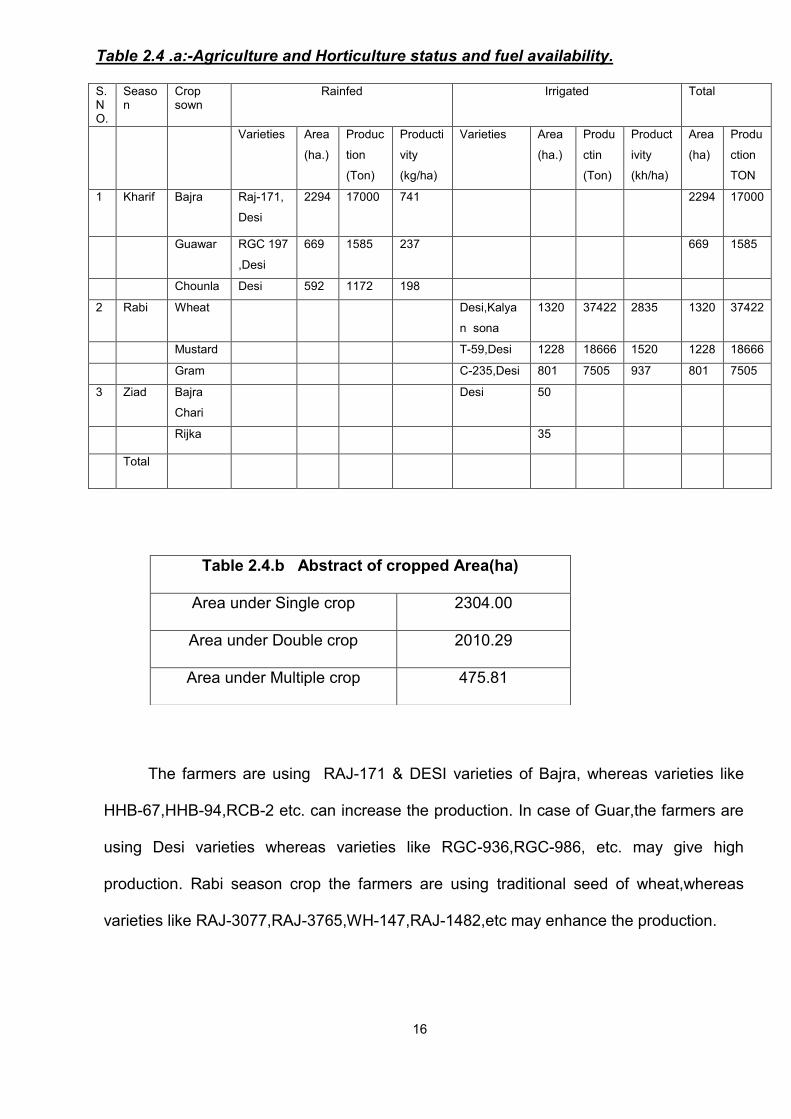
Table 2.4 .a:-Agriculture and Horticulture status and fuel availability. S.NO.
Season
Crop sown
Rainfed Irrigated Total
Varieties Area
(ha.)
Produc
tion
(Ton)
Producti
vity
(kg/ha)
Varieties Area
(ha.)
Produ
ctin
(Ton)
Product
ivity
(kh/ha)
Area
(ha)
Produ
ction
TON
1 Kharif Bajra Raj-171,
Desi
2294 17000 741 2294 17000
Guawar RGC 197
,Desi
669 1585 237 669 1585
Chounla Desi 592 1172 198
2 Rabi Wheat Desi,Kalya
n sona
1320 37422 2835 1320 37422
Mustard T-59,Desi 1228 18666 1520 1228 18666
Gram C-235,Desi 801 7505 937 801 7505
3 Ziad Bajra
Chari
Desi 50
Rijka 35
Total
The farmers are using RAJ-171 & DESI varieties of Bajra, whereas varieties like
HHB-67,HHB-94,RCB-2 etc. can increase the production. In case of Guar,the farmers are
using Desi varieties whereas varieties like RGC-936,RGC-986, etc. may give high
production. Rabi season crop the farmers are using traditional seed of wheat,whereas
varieties like RAJ-3077,RAJ-3765,WH-147,RAJ-1482,etc may enhance the production.
16
Table 2.4.b Abstract of cropped Area(ha)
Area under Single crop 2304.00
Area under Double crop 2010.29
Area under Multiple crop 475.81
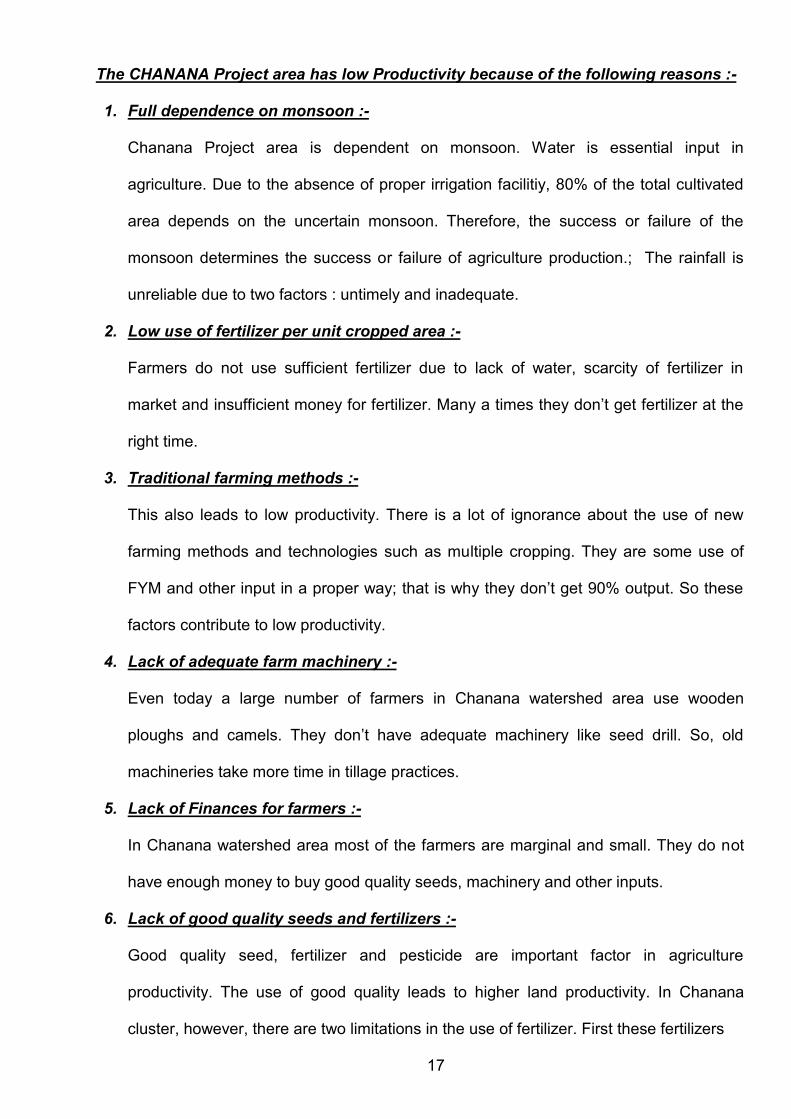
The CHANANA Project area has low Productivity because of the following reasons :-
1. Full dependence on monsoon :-
Chanana Project area is dependent on monsoon. Water is essential input in
agriculture. Due to the absence of proper irrigation facilitiy, 80% of the total cultivated
area depends on the uncertain monsoon. Therefore, the success or failure of the
monsoon determines the success or failure of agriculture production.; The rainfall is
unreliable due to two factors : untimely and inadequate.
2. Low use of fertilizer per unit cropped area :-
Farmers do not use sufficient fertilizer due to lack of water, scarcity of fertilizer in
market and insufficient money for fertilizer. Many a times they don’t get fertilizer at the
right time.
3. Traditional farming methods :-
This also leads to low productivity. There is a lot of ignorance about the use of new
farming methods and technologies such as multiple cropping. They are some use of
FYM and other input in a proper way; that is why they don’t get 90% output. So these
factors contribute to low productivity.
4. Lack of adequate farm machinery :-
Even today a large number of farmers in Chanana watershed area use wooden
ploughs and camels. They don’t have adequate machinery like seed drill. So, old
machineries take more time in tillage practices.
5. Lack of Finances for farmers :-
In Chanana watershed area most of the farmers are marginal and small. They do not
have enough money to buy good quality seeds, machinery and other inputs.
6. Lack of good quality seeds and fertilizers :-
Good quality seed, fertilizer and pesticide are important factor in agriculture
productivity. The use of good quality leads to higher land productivity. In Chanana
cluster, however, there are two limitations in the use of fertilizer. First these fertilizers
17
are most useful in irrigated condition. But in Chanana cluster 66.23% of land depend
on rainfall. In Chanana Cluster mostly farmers use Manual total Organic Farming.
7. Lack of Other facilities such as storage and marketing :-
4-8% of agriculture product damage after harvesting due to scarcity of proper storage
and proper market for sale. So he sale to local traders at the low prices. Farmers
mainly face proper means of transportation. An second problem is farmers don’t have
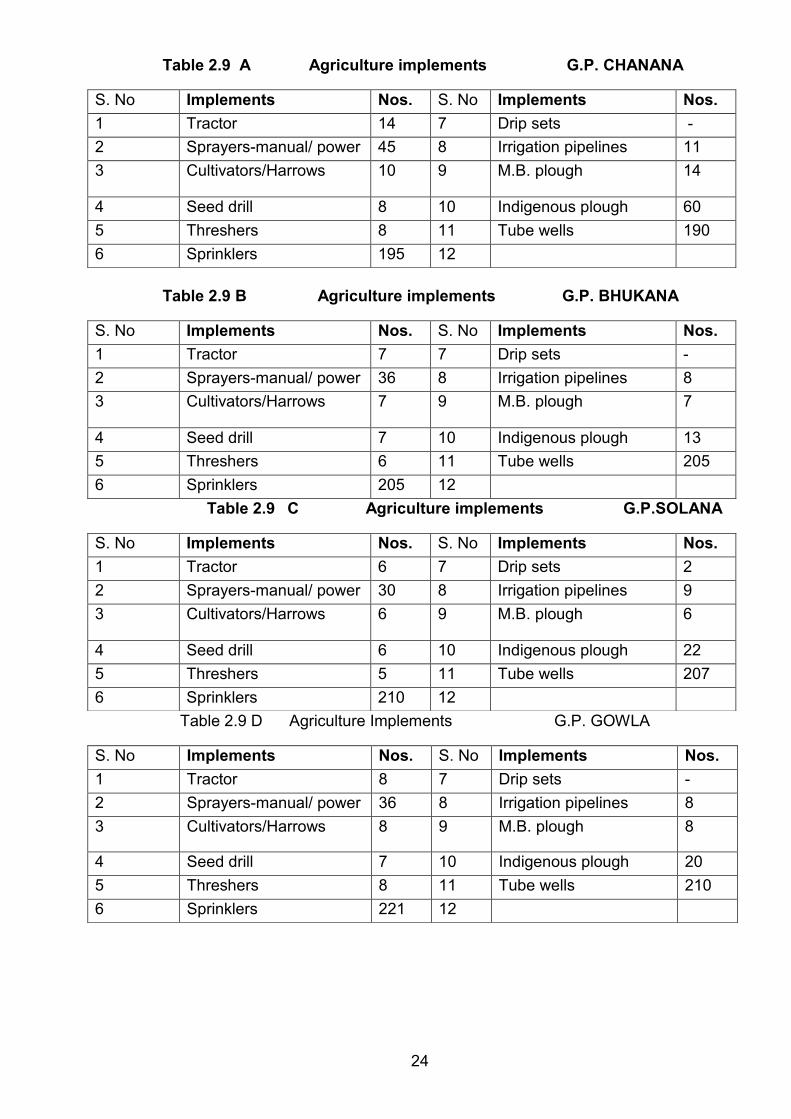
Table 2.9 E Agriculture Implements G.P. BHADUNDA KLAN
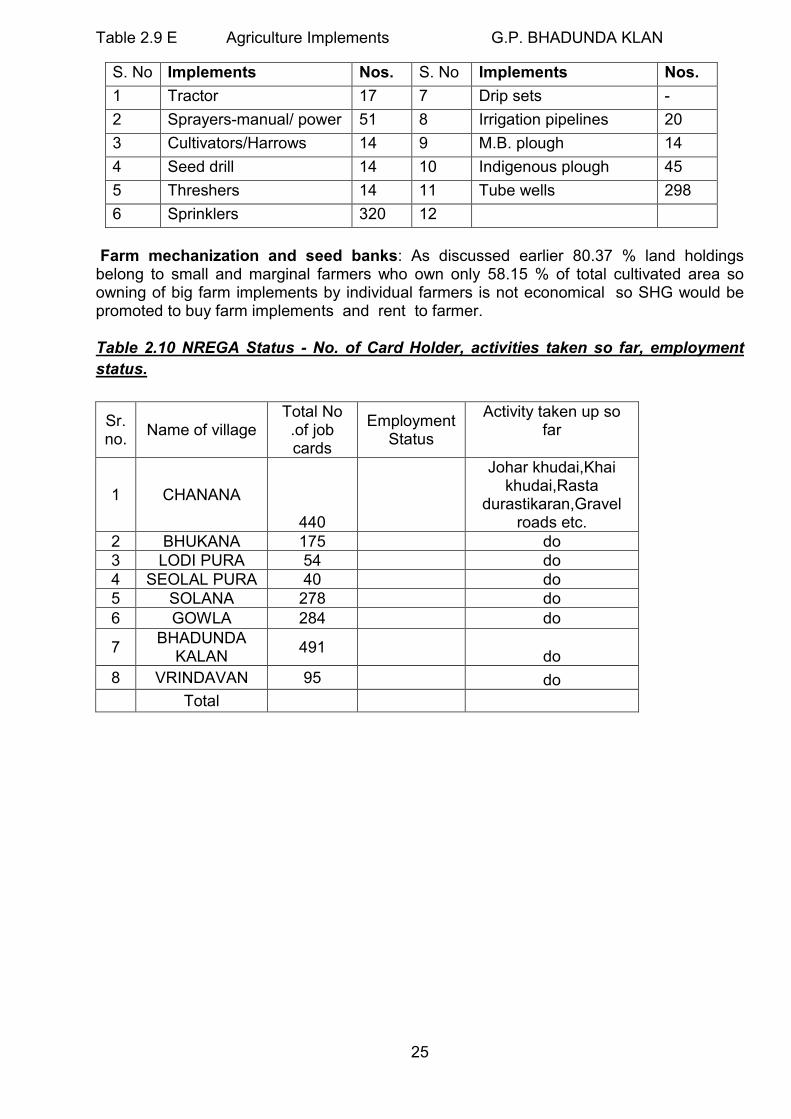
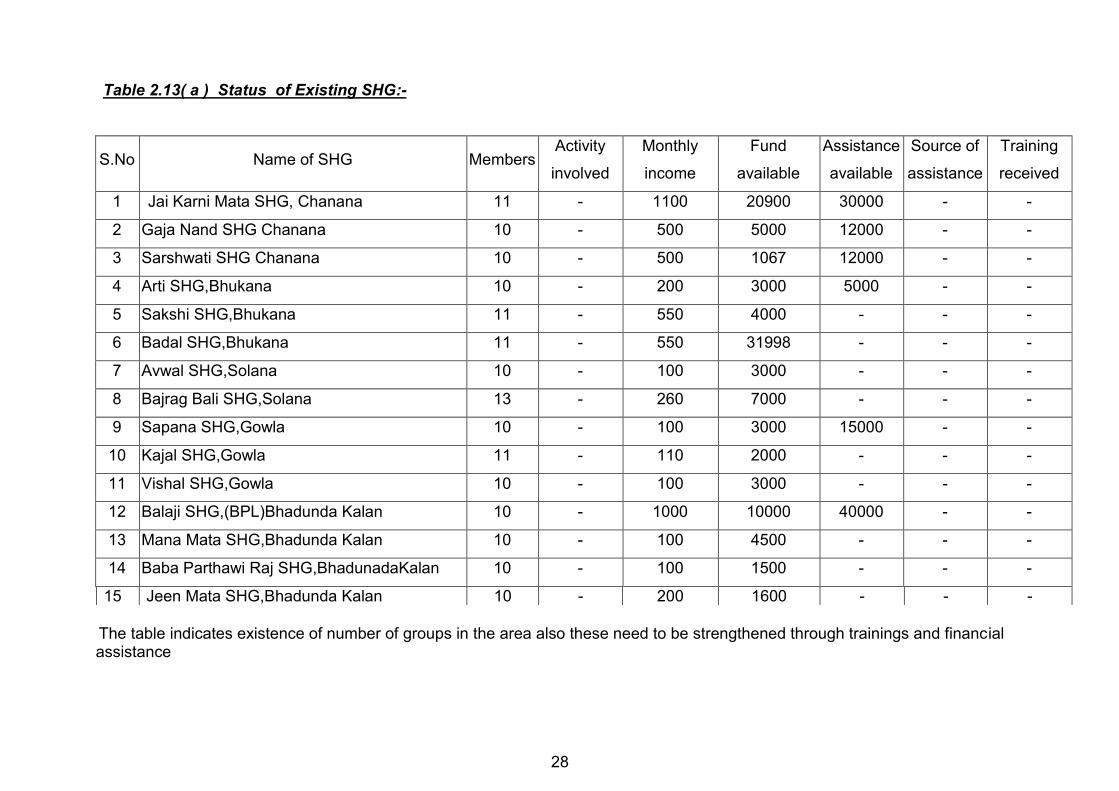
Farm mechanization and seed banks: As discussed earlier 80.37 % land holdings belong to small and marginal farmers who own only 58.15 % of total cultivated area so owning of big farm implements by individual farmers is not economical so SHG would be promoted to buy farm implements and rent to farmer. Table 2.10 NREGA Status - No. of Card Holder, activities taken so far, employment status.
Sr. no. Name of village
Total No .of job cards
Employment Status
Activity taken up so far
1 CHANANA
440
Johar khudai,Khai khudai,Rasta
durastikaran,Gravel roads etc.
2 BHUKANA 175 do 3 LODI PURA 54 do 4 SEOLAL PURA 40 do 5 SOLANA 278 do 6 GOWLA 284 do
7 BHADUNDA KALAN 491
do 8 VRINDAVAN 95 do Total
25
S. No Implements Nos. S. No Implements Nos. 1 Tractor 17 7 Drip sets - 2 Sprayers-manual/ power 51 8 Irrigation pipelines 20 3 Cultivators/Harrows 14 9 M.B. plough 14 4 Seed drill 14 10 Indigenous plough 45 5 Threshers 14 11 Tube wells 298 6 Sprinklers 320 12
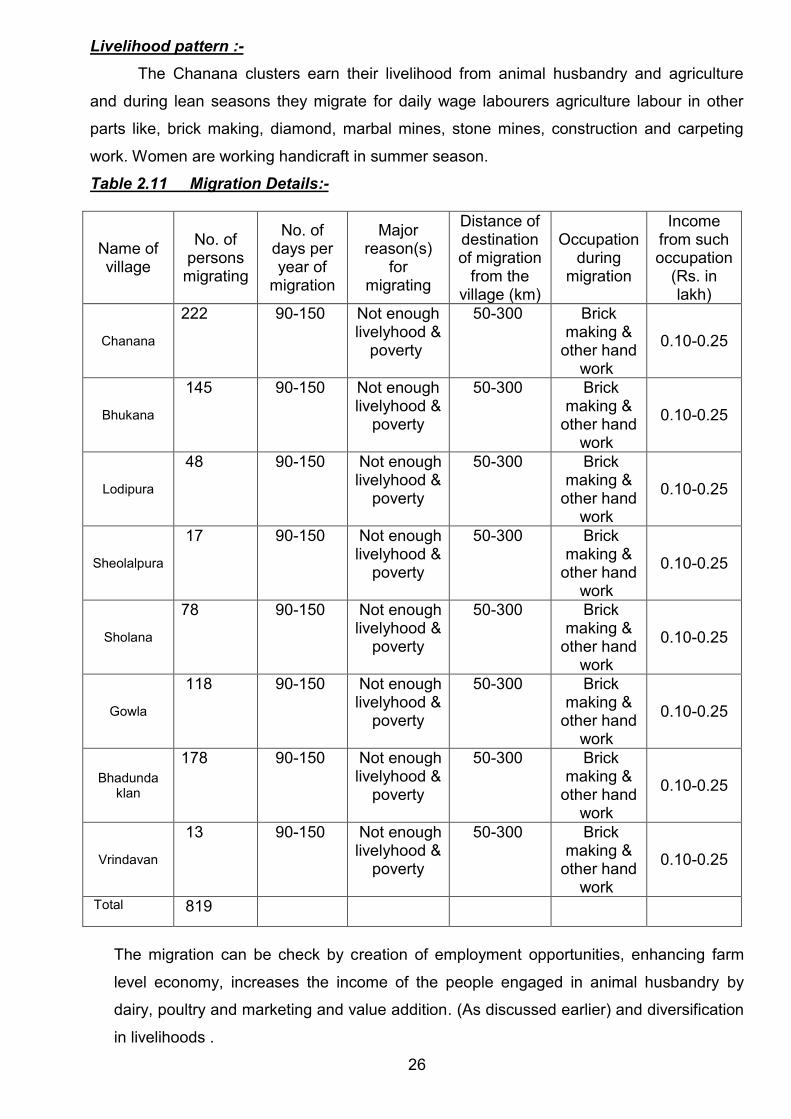
Livelihood pattern :- The Chanana clusters earn their livelihood from animal husbandry and agriculture
and during lean seasons they migrate for daily wage labourers agriculture labour in other
parts like, brick making, diamond, marbal mines, stone mines, construction and carpeting
work. Women are working handicraft in summer season.
Table 2.11 Migration Details:-
Name of village
No. of persons migrating
No. of days per year of
migration
Major reason(s)
for migrating
Distance of destination of migration
from the village (km)
Occupation during
migration
Income from such occupation
(Rs. in lakh)
Chanana
222 90-150 Not enough livelyhood &
poverty
50-300 Brick making &
other hand work
0.10-0.25
Bhukana
145 90-150 Not enough livelyhood &
poverty
50-300 Brick making &
other hand work
0.10-0.25
Lodipura
48 90-150 Not enough livelyhood &
poverty
50-300 Brick making &
other hand work
0.10-0.25
Sheolalpura
17 90-150 Not enough livelyhood &
poverty
50-300 Brick making &
other hand work
0.10-0.25
Sholana
78 90-150 Not enough livelyhood &
poverty
50-300 Brick making &
other hand work
0.10-0.25
Gowla
118 90-150 Not enough livelyhood &
poverty
50-300 Brick making &
other hand work
0.10-0.25
Bhadunda klan
178 90-150 Not enough livelyhood &
poverty
50-300 Brick making &
other hand work
0.10-0.25
Vrindavan
13 90-150 Not enough livelyhood &
poverty
50-300 Brick making &
other hand work
0.10-0.25
Total 819 The migration can be check by creation of employment opportunities, enhancing farm
level economy, increases the income of the people engaged in animal husbandry by
dairy, poultry and marketing and value addition. (As discussed earlier) and diversification
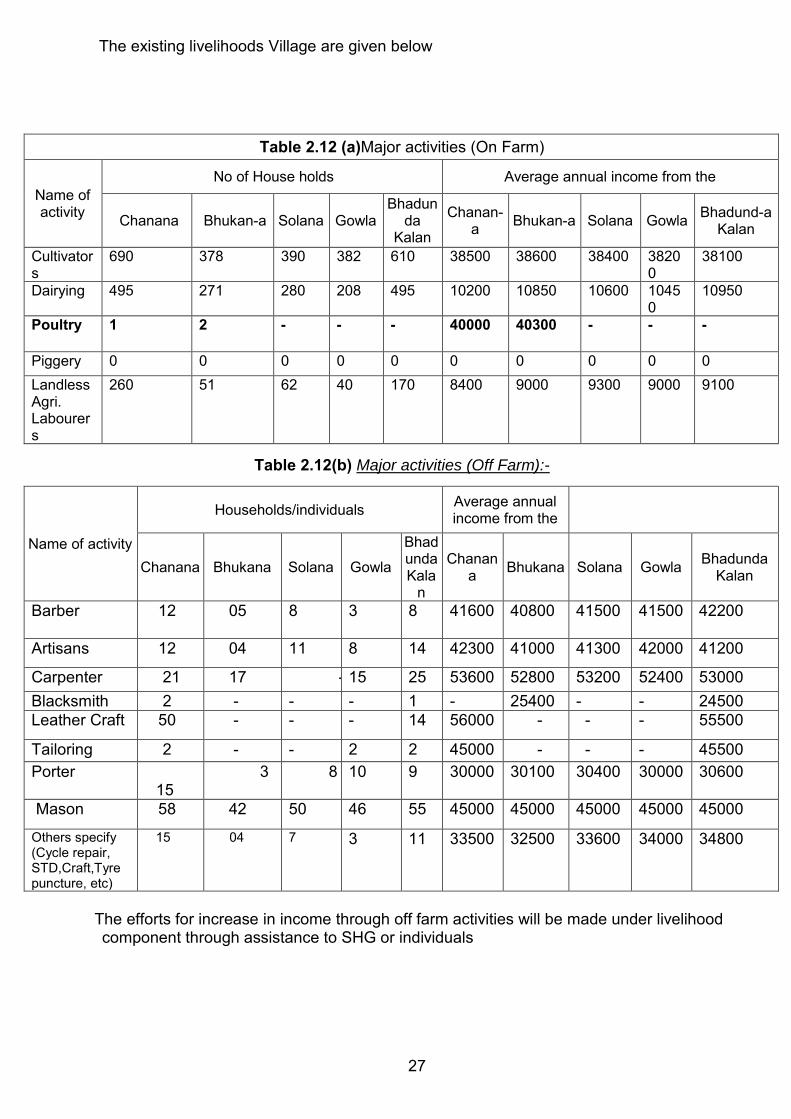
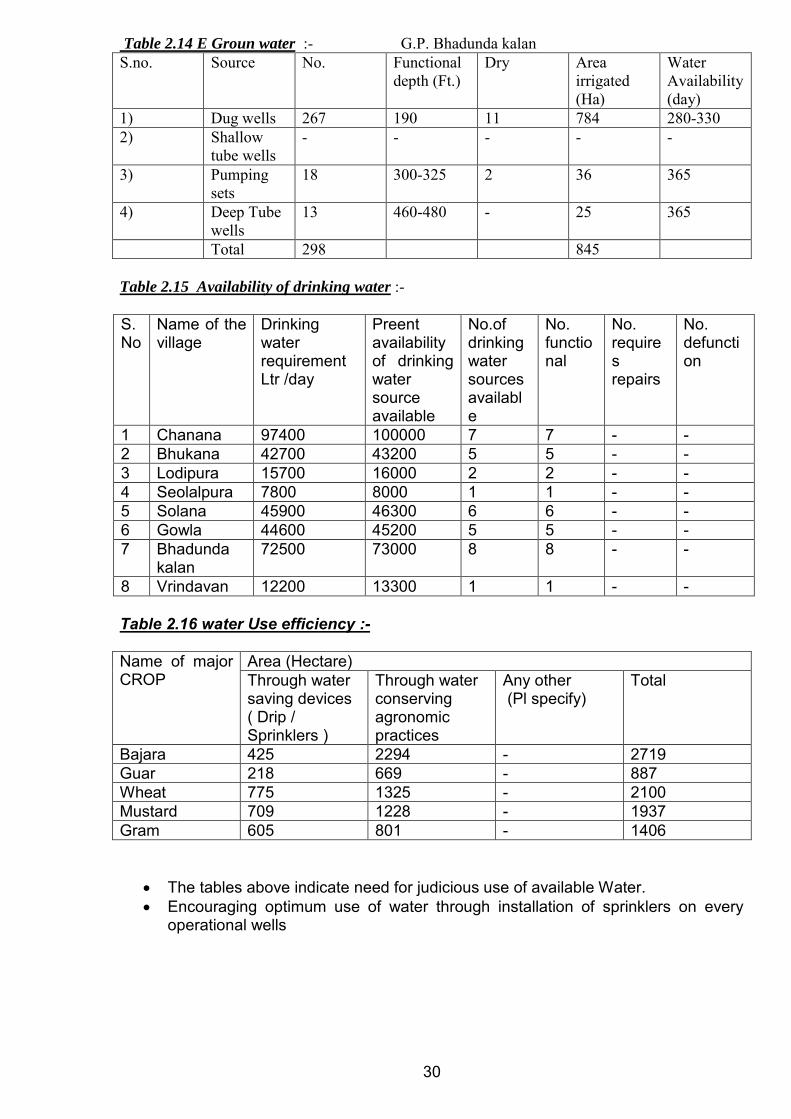
The tables above indicate need for judicious use of available Water. Encouraging optimum use of water through installation of sprinklers on every
operational wells
30
Table 2.17 Slope details. :_-
Slope of Watershed S.No. Slope percentage
Area in hectares
1 0 to 3% 4462 2 3 to 8% 1292 3 8 to 25% 118 4 > 25% 0
As most of the area has slope less than 3% construction of contour bunds can solve the
problem of water erosion in agriculture fields and protect washing of top soil and
manures/fertilisers
Table 2.18. Soil details :-
A Soil Profile S.No. Major Soil Classes Area in hectares
1 Sandy Loam 3867 2 Loamy 2005
B Soil Depth : Depth (Cms.) Area in hectares
1 0.00 to 7.50 58 2 7.50 to 45.00 3935 3 > 45.00 1879
C Soil fertility Status Present value in w/s area
Recommended
N 54 kg/ha 70-140 kg/ha P 42 kg/ha 38-76 kg/ha K 380 kg/ha 0-17 kg/ha Micronutrients Zink 0.4 to 0.59 PPM Zink 0.6 PPM Iron 3.5 to 4.49 PPM Iron 4.5 PPM Mn. 2.0 PPM Mn. 2.0 PPM
The analysis of table shows need to improve and maintain soil fertility. Soil health card
to every farmer every crop season will be provided, which will include the
recommendation for Application micro nutrient and fertilizers
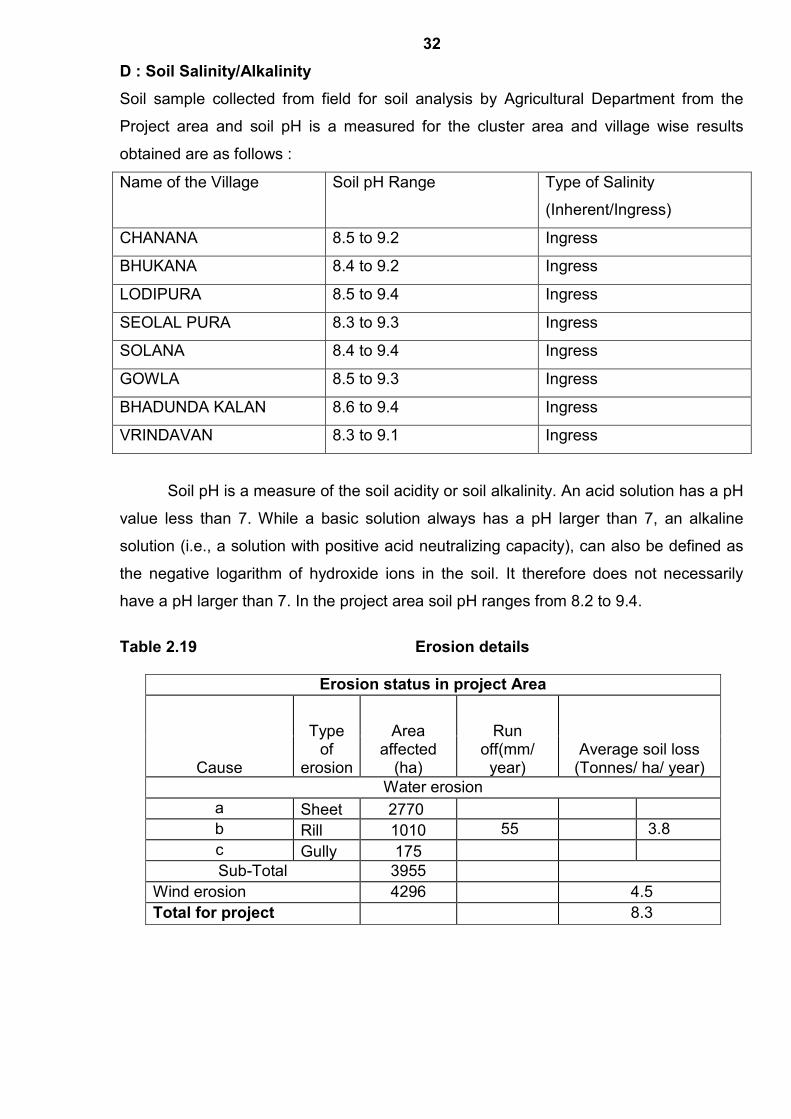
32 D : Soil Salinity/Alkalinity Soil sample collected from field for soil analysis by Agricultural Department from the
Project area and soil pH is a measured for the cluster area and village wise results
obtained are as follows :
Name of the Village Soil pH Range Type of Salinity
(Inherent/Ingress)
CHANANA 8.5 to 9.2 Ingress
BHUKANA 8.4 to 9.2 Ingress
LODIPURA 8.5 to 9.4 Ingress
SEOLAL PURA 8.3 to 9.3 Ingress
SOLANA 8.4 to 9.4 Ingress
GOWLA 8.5 to 9.3 Ingress
BHADUNDA KALAN 8.6 to 9.4 Ingress
VRINDAVAN 8.3 to 9.1 Ingress
Soil pH is a measure of the soil acidity or soil alkalinity. An acid solution has a pH
value less than 7. While a basic solution always has a pH larger than 7, an alkaline
solution (i.e., a solution with positive acid neutralizing capacity), can also be defined as
the negative logarithm of hydroxide ions in the soil. It therefore does not necessarily
have a pH larger than 7. In the project area soil pH ranges from 8.2 to 9.4.
Table 2.19 Erosion details
Erosion status in project Area
Cause
Type of
erosion
Area affected
(ha)
Run off(mm/
year) Average soil loss
(Tonnes/ ha/ year) Water erosion
a Sheet 2770 b Rill 1010 55 3.8 c Gully 175 Sub-Total 3955
Wind erosion 4296 4.5 Total for project 8.3
33 The need is:
To check land degradation
To reduce excessive biotic pressure by containing the number and increase of
livestock
To check cultivation on sloping lands without adequate precautions of soil and water
conservation measures
To discourage cultivation along susceptible nallah beds
To check Faulty agriculture techniques
To check Uncontrolled grazing and developed cattle tracks
To check Deforestation of steep slopes
To check erosive velocity of runoff, store Runoff, to arrest silt carried by runoff and to
recharge Ground Water structures life Earthen check dams, gully plugs, Bank
Stabilisation, Loose stone check Dams, Gabions, Earthen embankment (Nadi) and
Anicuts would be taken up.
34
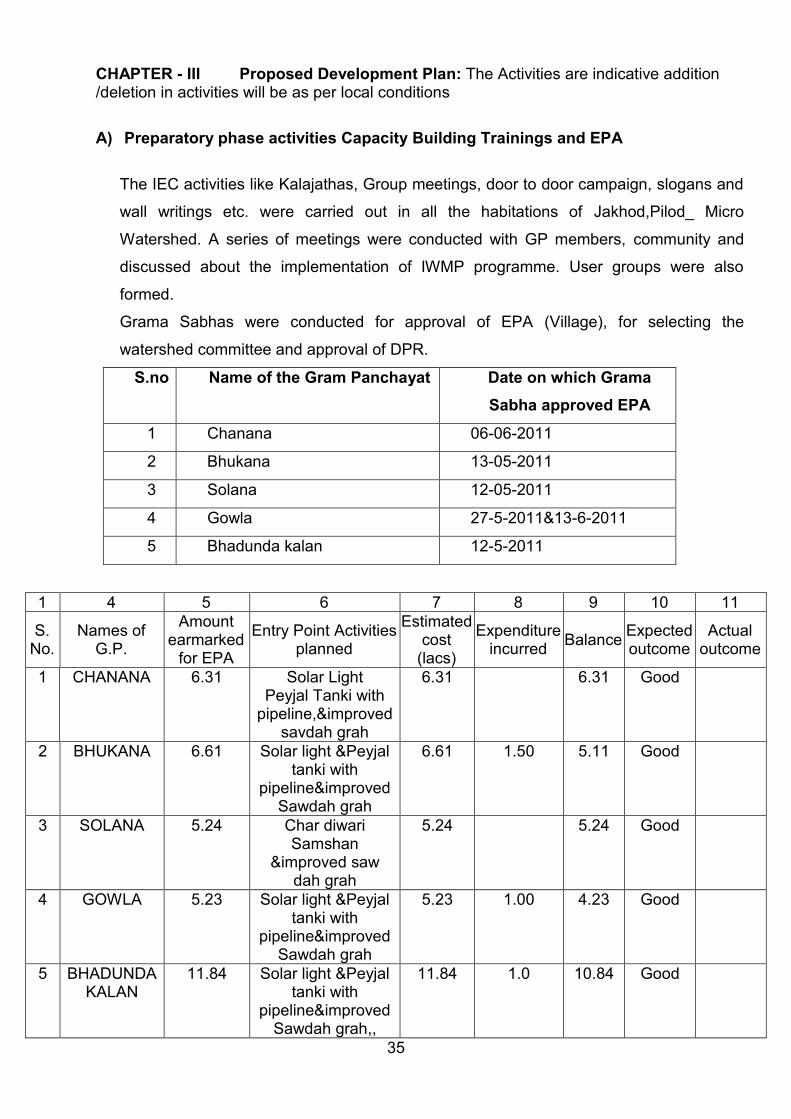
CHAPTER - III Proposed Development Plan: The Activities are indicative addition /deletion in activities will be as per local conditions
A) Preparatory phase activities Capacity Building Trainings and EPA
The IEC activities like Kalajathas, Group meetings, door to door campaign, slogans and
wall writings etc. were carried out in all the habitations of Jakhod,Pilod_ Micro
Watershed. A series of meetings were conducted with GP members, community and
discussed about the implementation of IWMP programme. User groups were also
formed.
Grama Sabhas were conducted for approval of EPA (Village), for selecting the
watershed committee and approval of DPR.
S.no Name of the Gram Panchayat Date on which Grama Sabha approved EPA
1 Chanana 06-06-2011
2 Bhukana 13-05-2011
3 Solana 12-05-2011
4 Gowla 27-5-2011&13-6-2011
5 Bhadunda kalan 12-5-2011
1 4 5 6 7 8 9 10 11
S. No.
Names of G.P.
Amount earmarked
for EPA
Entry Point Activities planned
Estimated cost
(lacs)
Expenditure incurred Balance Expected
outcome Actual
outcome
1 CHANANA 6.31 Solar Light Peyjal Tanki with
pipeline,&improved savdah grah
6.31 6.31 Good
2 BHUKANA 6.61 Solar light &Peyjal tanki with
pipeline&improved Sawdah grah
6.61 1.50 5.11 Good
3 SOLANA 5.24 Char diwari Samshan
&improved saw dah grah
5.24 5.24 Good
4 GOWLA 5.23 Solar light &Peyjal tanki with
pipeline&improved Sawdah grah
5.23 1.00 4.23 Good
5 BHADUNDA KALAN
11.84 Solar light &Peyjal tanki with
pipeline&improved Sawdah grah,,
11.84 1.0 10.84 Good
35
Capacity Building : Capacity Building is the process of assisting the group or individuals to identify and address
issues and gain the insights, knowledge and experience needed to solve problems and
implement charges.
There is a realization in the development sector that there is a need to appraise the
success of development interventions by going beyond the conventional development targets
and measures of success (e.g. in the form of commodities, goods and services) to take into
account improvement to human potential. Capacity building stakeholders Is also increasingly
viewed as an important factor in developmental projects that involve participation of
stakeholders at all levels for effective implementation of projects.
Scope of capacity building at CHANANA Watershed area :
Alternative Land Use Plan
Scientific technique of soil and moisture conservation
Improved and Scientific agriculture practices
Fodder development and Management
Afforestation
Meteorological Information
Dairy Development and Management
Rural Craft
Income Generaiton Activities
o Stitching
0 Food Processing
o Post Harves Management Practices
0 Making Carpets
The PRA exercise was carried out in all the villages on the dates shown below:
S.no. Name of the G.P. village/Habitation Date on which PRA conducted
1 Chanana 16-4-2012
2 Gowla 17-4-2012
3 Solana 18-4-2012
4 Bhadunda kalan 19-4-2012
5 Vrindavan 19-4-2012
6 Bhukana 20-4-2012
7 Lodipura 23-4-2012
8 sheolalpura 23-4-2012
36
Transact walk were carried out involving the community for Social mapping, Resource
mapping. Detailed discussions and deliberations with all the primary stakeholders were carried
out.
Socio-economic survey was carried out during 16.09.11 to 29.05.12 period covering all the
households and primary data on demography, Land holdings, Employment status, Community
activities etc. was collected as mentioned in chapter 2.
State remote sensing department was assigned the work of preparing various
thematic layers using Cartosat-1 and LISS-3 imageries for Creation, development and
management of geo-spatial database depicting present conditions of land (terrain), water and
vegetation with respect to watershed under different ownerships at village level
Various thematic layers provided by SRSAC are :
Delineation of Macro/Micro watershed boundaries. Digitised Khasara maps of the villages falling in project area. Network of Drainage lines, existing water bodies, falling in the project area. Base maps (transport network, village/boundaries, and settlements). Land Use / Land cover map. Contours at 1 meter interval, slope map
Based on GIS thematic layers, Field visits , PRA and analysis of benchmark data (as
discussed in chapter 2) final Treatment plan on revenue map for implementation has been
framed. Thus each intervention identified has been marked on revenue map (map enclosed
in DPR as annexure------).The GIS based intervention map, PRA based intervention map are
annexed as -----
37
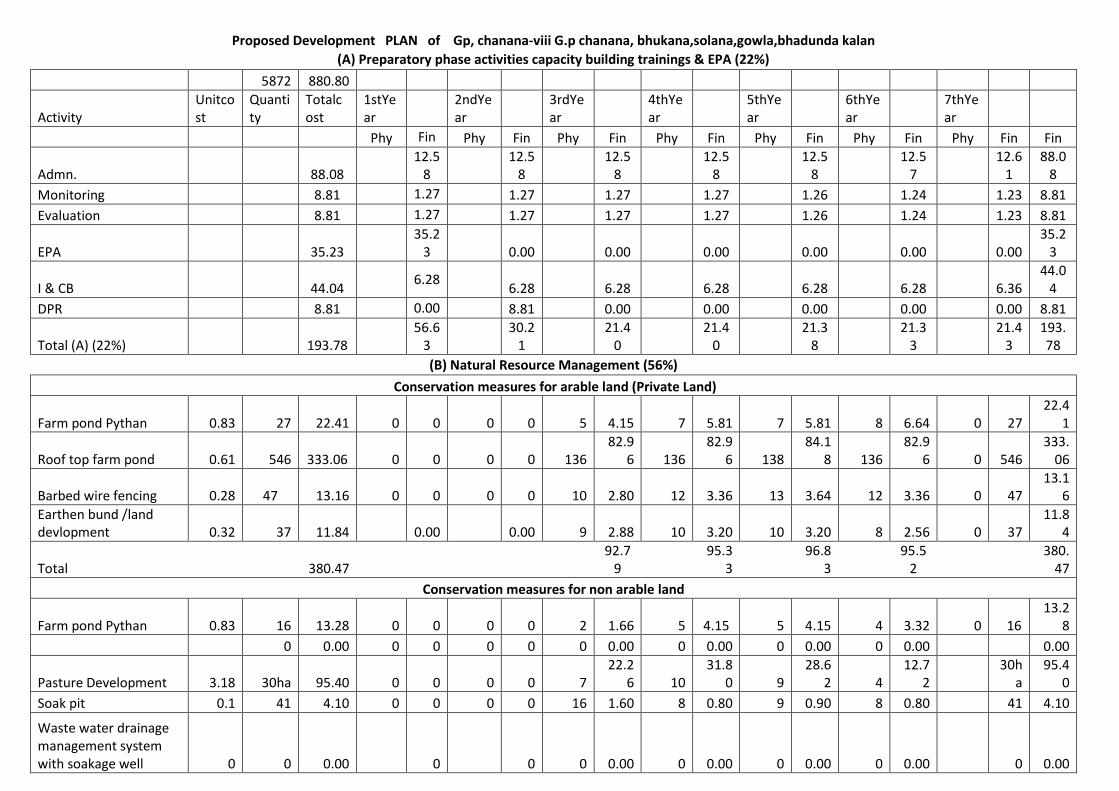
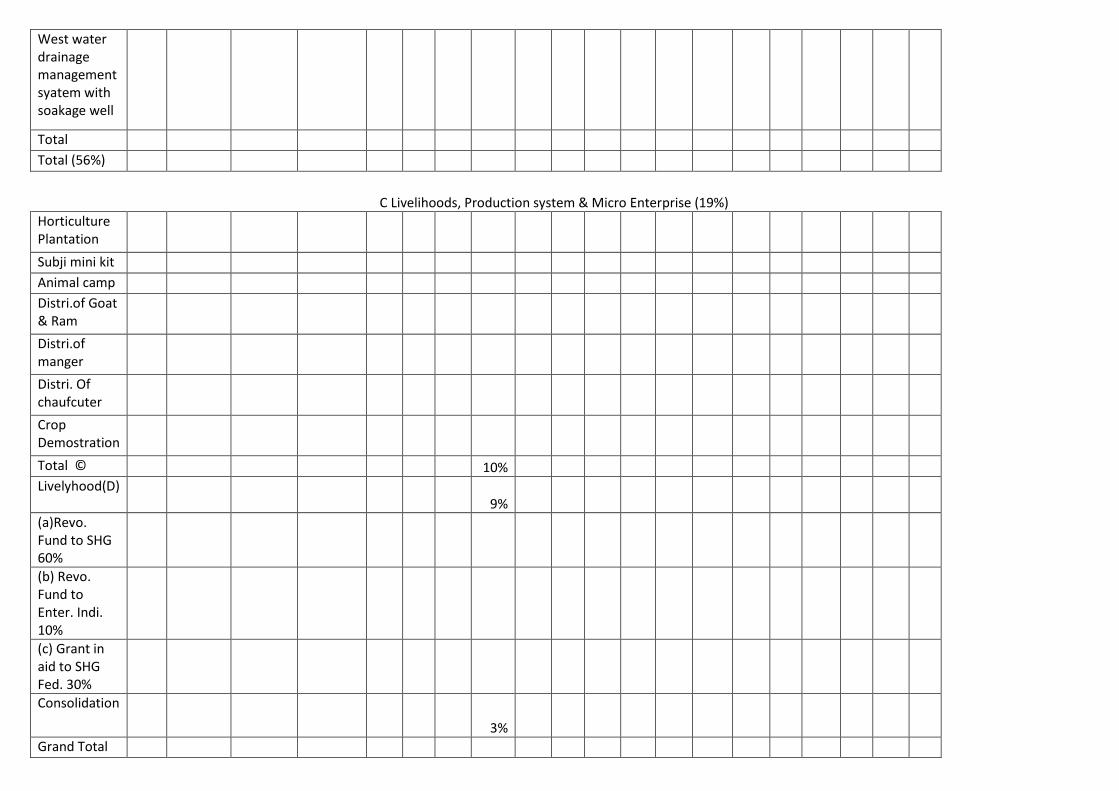
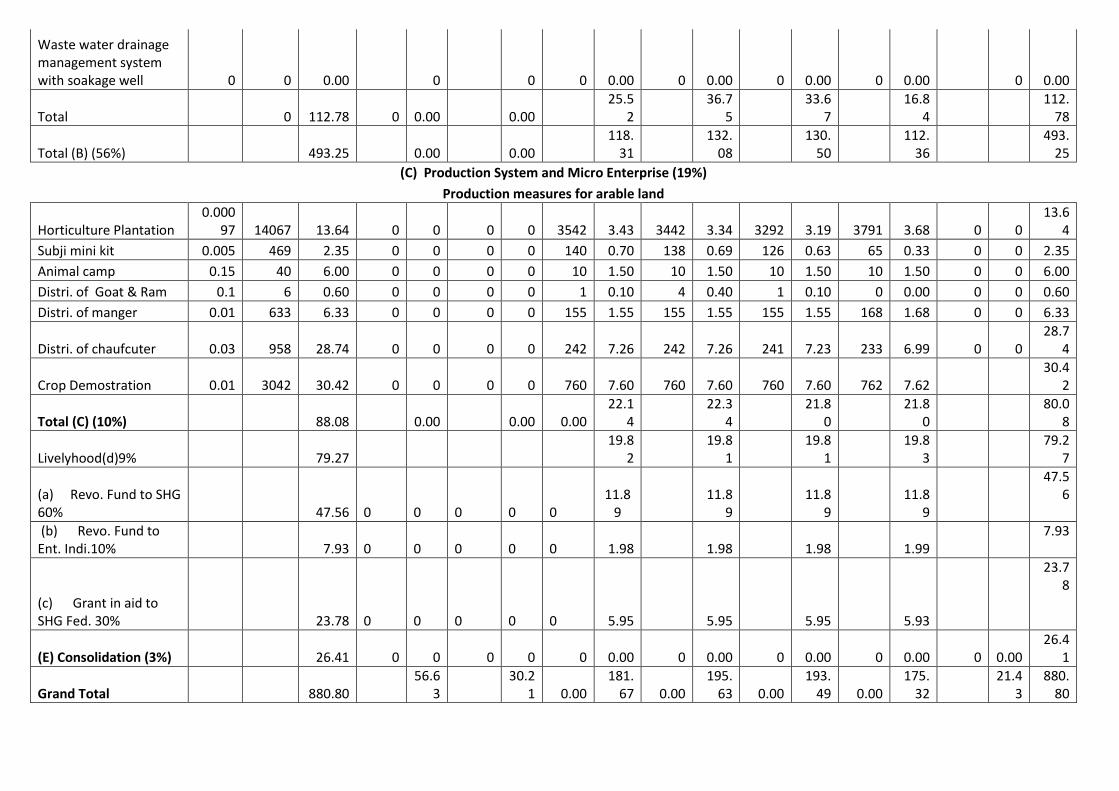
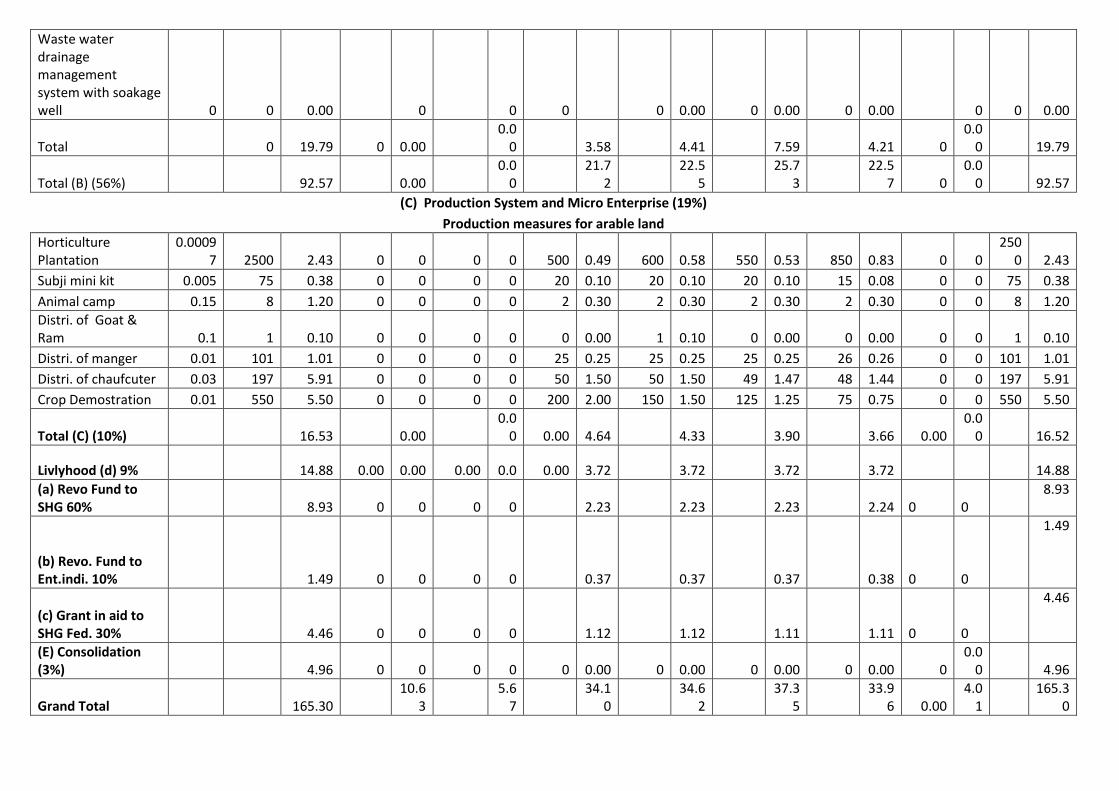
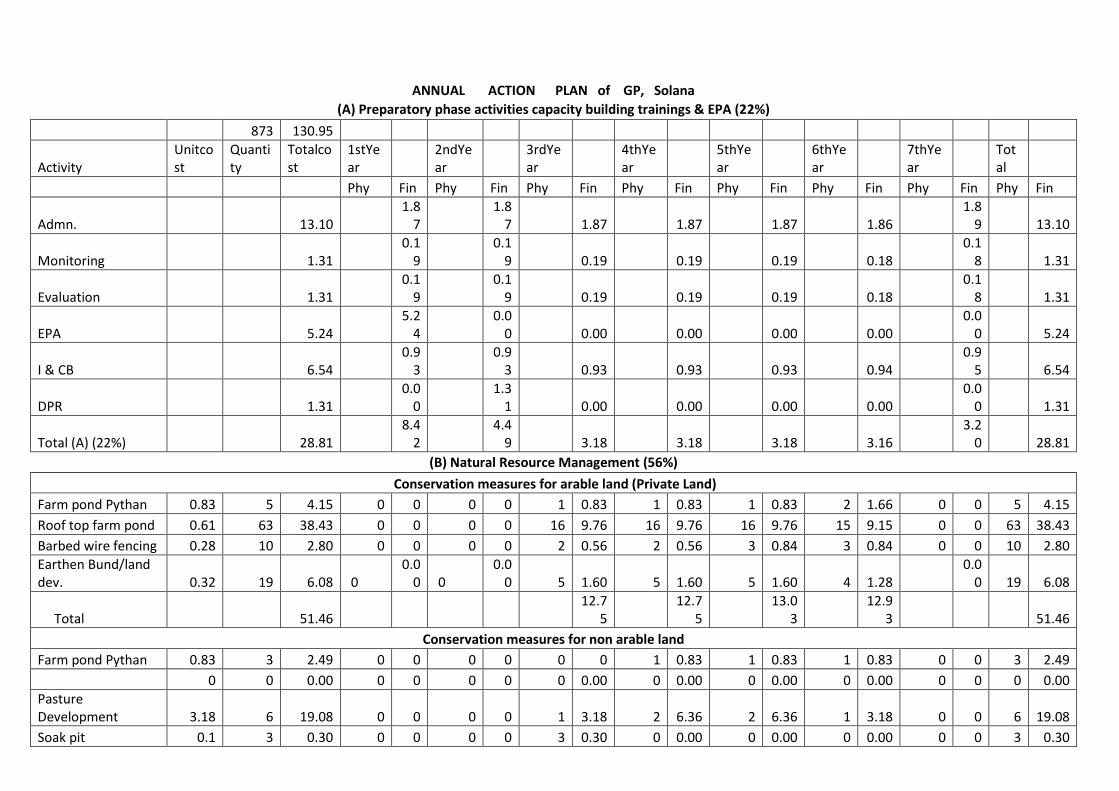
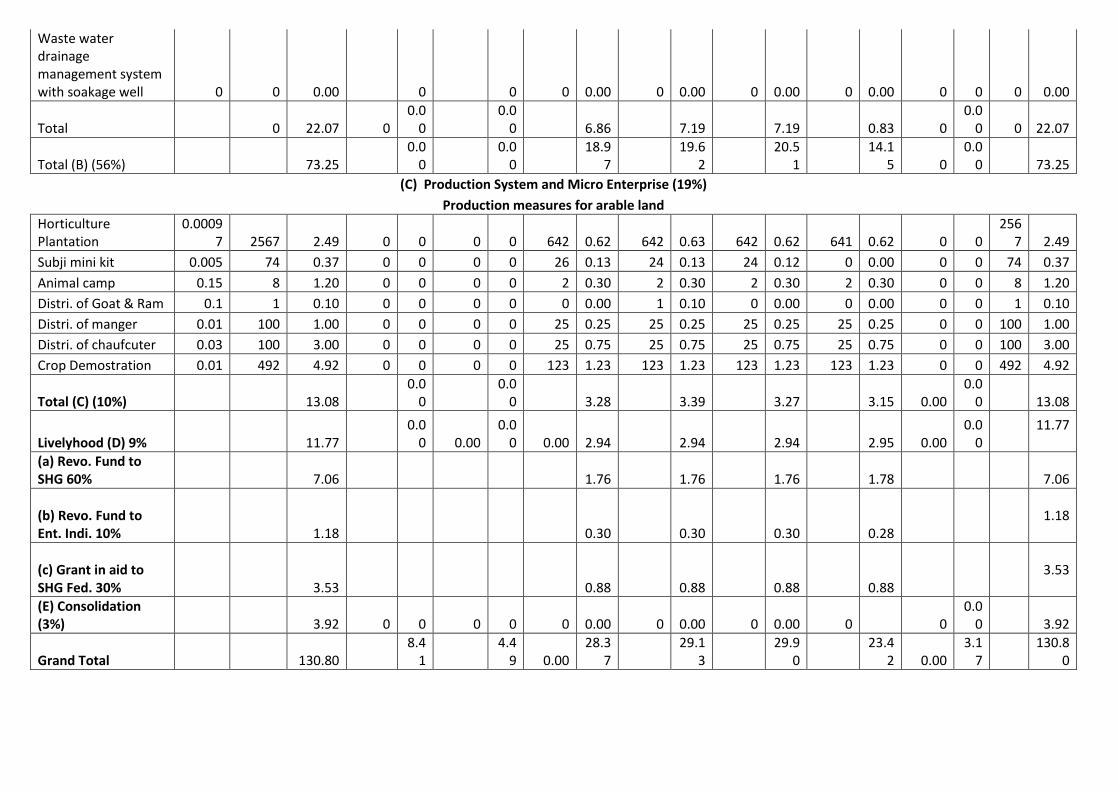
Proposed Development PLAN of Gp, chanana-viii G.p chanana, bhukana,solana,gowla,bhadunda kalan
(A) Preparatory phase activities capacity building trainings & EPA (22%)
5872 880.80
Activity Unitcost
Quantity
Totalcost
1stYear
2ndYear
3rdYear
4thYear
5thYear
6thYear
7thYear
Phy Fin Phy Fin Phy Fin Phy Fin Phy Fin Phy Fin Phy Fin Fin
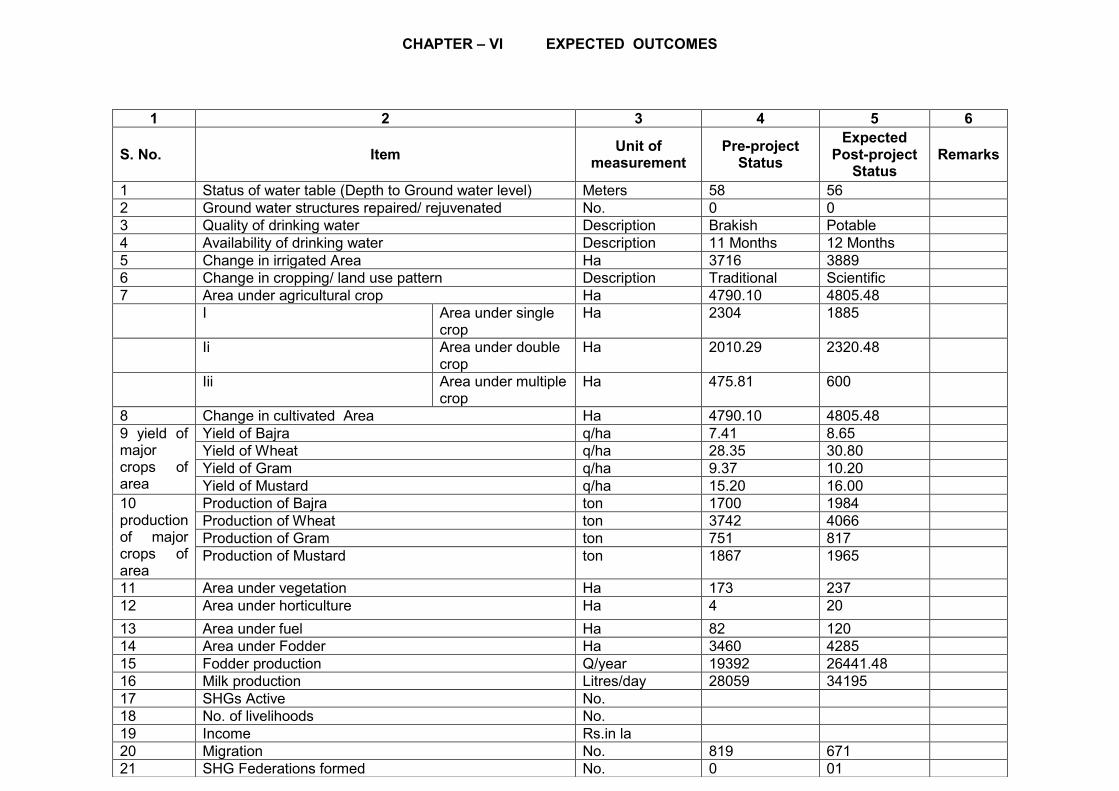
1 Status of water table (Depth to Ground water level) Meters 58 56 2 Ground water structures repaired/ rejuvenated No. 0 0 3 Quality of drinking water Description Brakish Potable 4 Availability of drinking water Description 11 Months 12 Months 5 Change in irrigated Area Ha 3716 3889 6 Change in cropping/ land use pattern Description Traditional Scientific 7 Area under agricultural crop Ha 4790.10 4805.48 I Area under single
crop Ha 2304 1885
Ii Area under double crop
Ha 2010.29 2320.48
Iii Area under multiple crop
Ha 475.81 600
8 Change in cultivated Area Ha 4790.10 4805.48 9 yield of major crops of area
Yield of Bajra q/ha 7.41 8.65 Yield of Wheat q/ha 28.35 30.80 Yield of Gram q/ha 9.37 10.20 Yield of Mustard q/ha 15.20 16.00
10 production of major crops of area
Production of Bajra ton 1700 1984 Production of Wheat ton 3742 4066 Production of Gram ton 751 817 Production of Mustard ton 1867 1965
11 Area under vegetation Ha 173 237 12 Area under horticulture Ha 4 20 13 Area under fuel Ha 82 120 14 Area under Fodder Ha 3460 4285 15 Fodder production Q/year 19392 26441.48 16 Milk production Litres/day 28059 34195 17 SHGs Active No. 18 No. of livelihoods No. 19 Income Rs.in la 20 Migration No. 819 671 21 SHG Federations formed No. 0 01
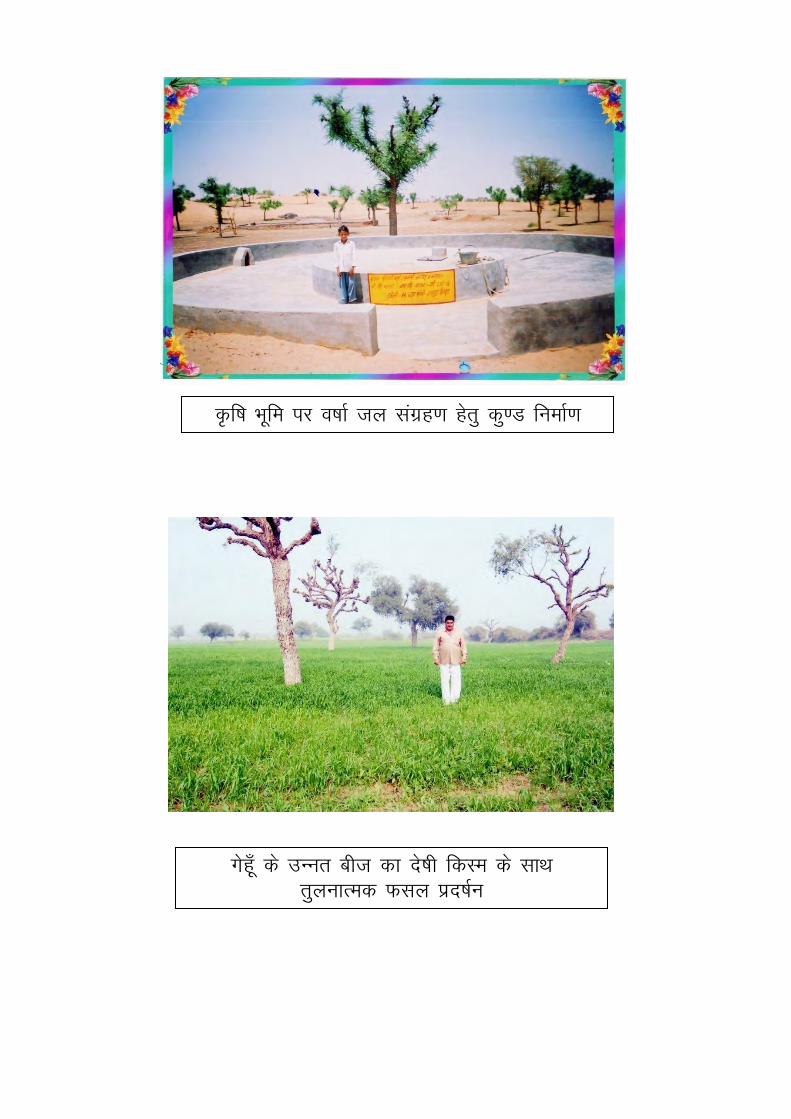
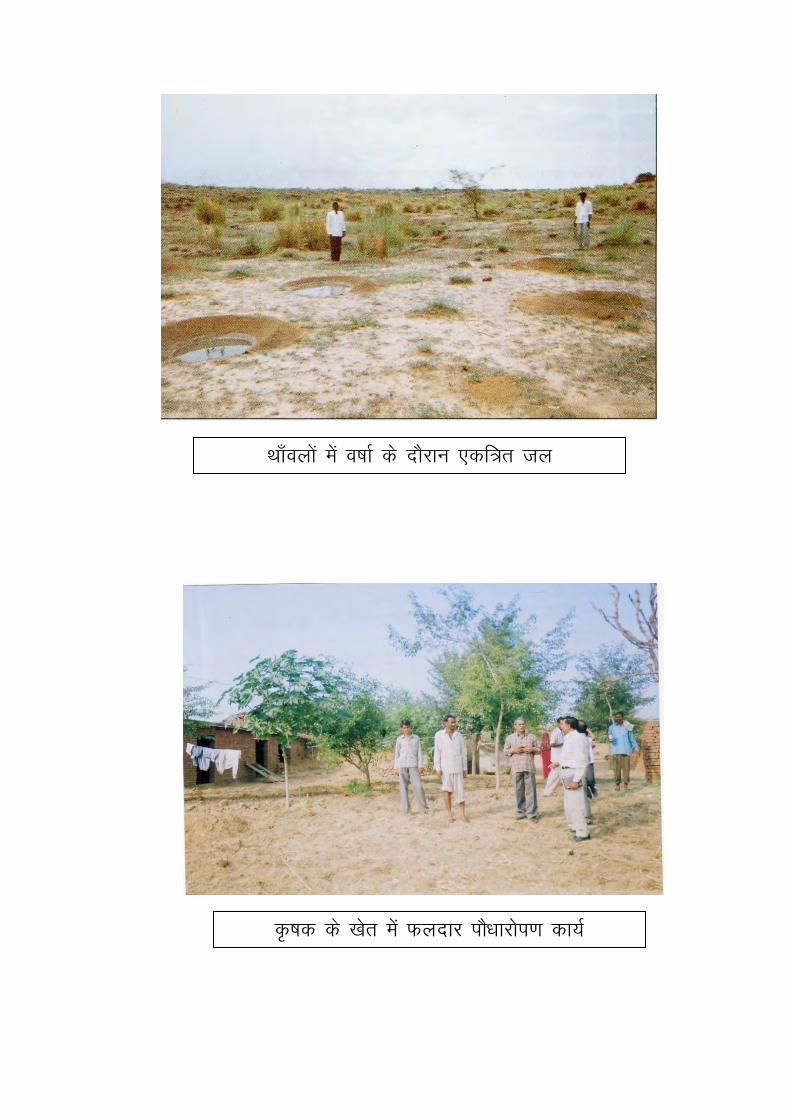
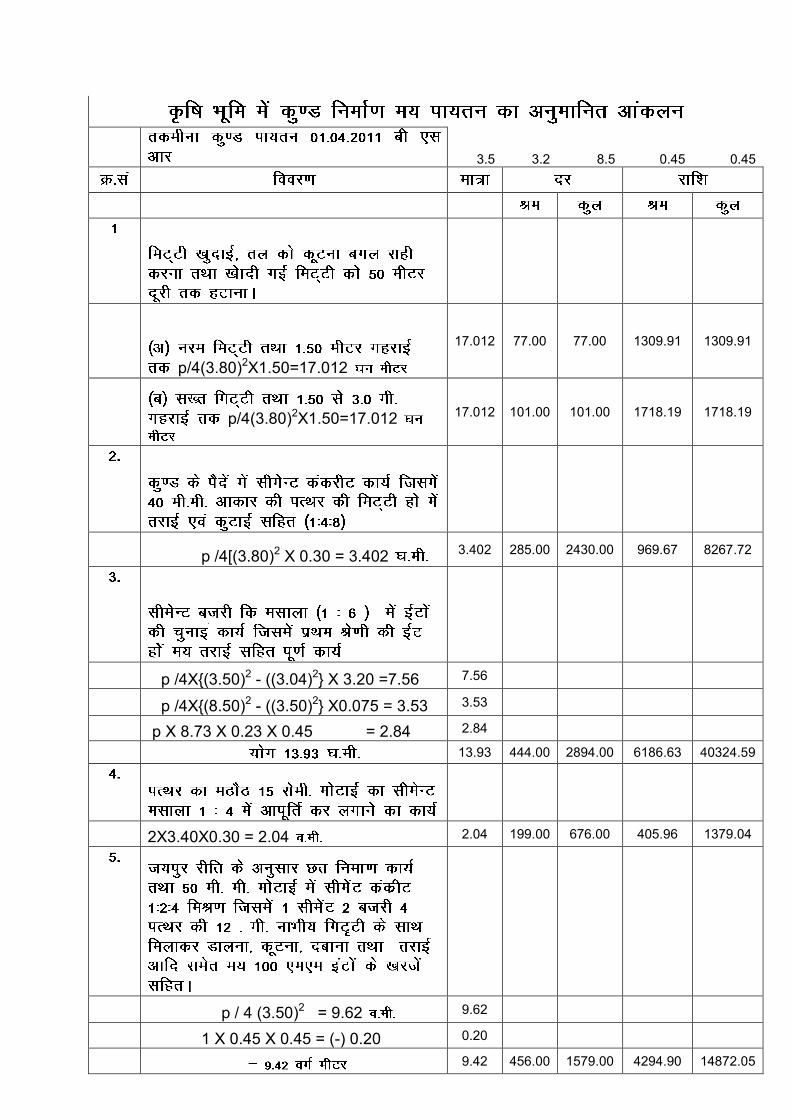
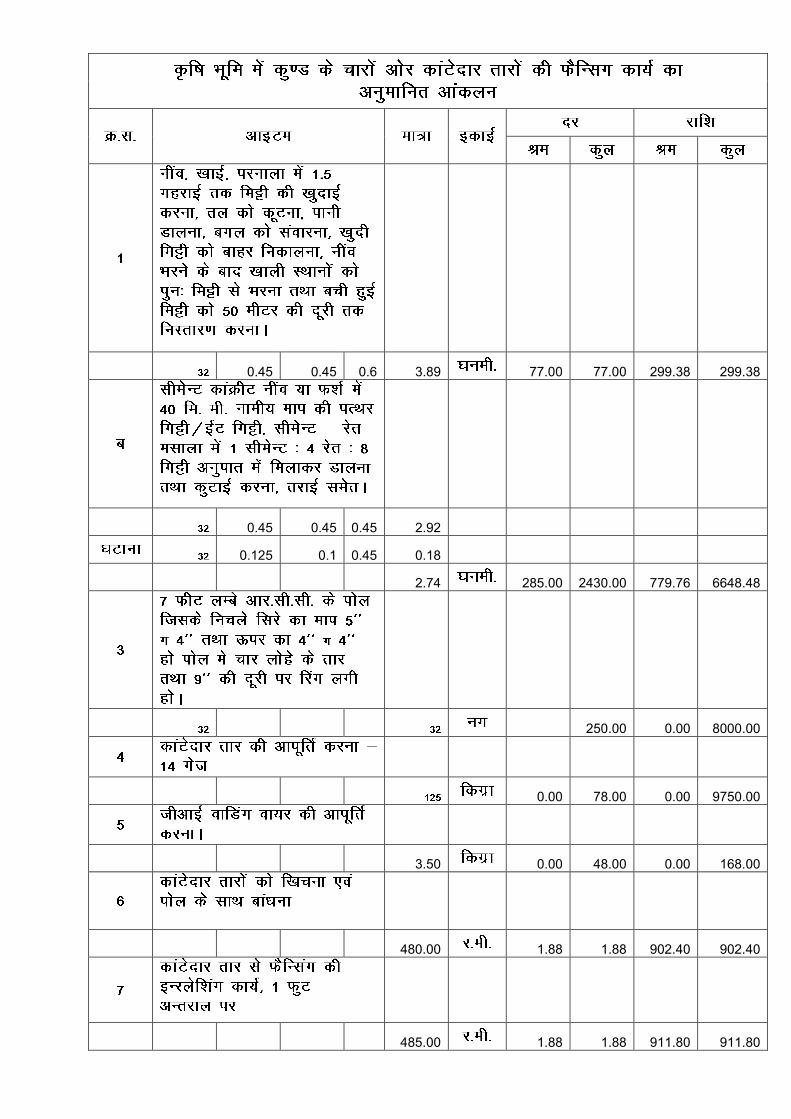
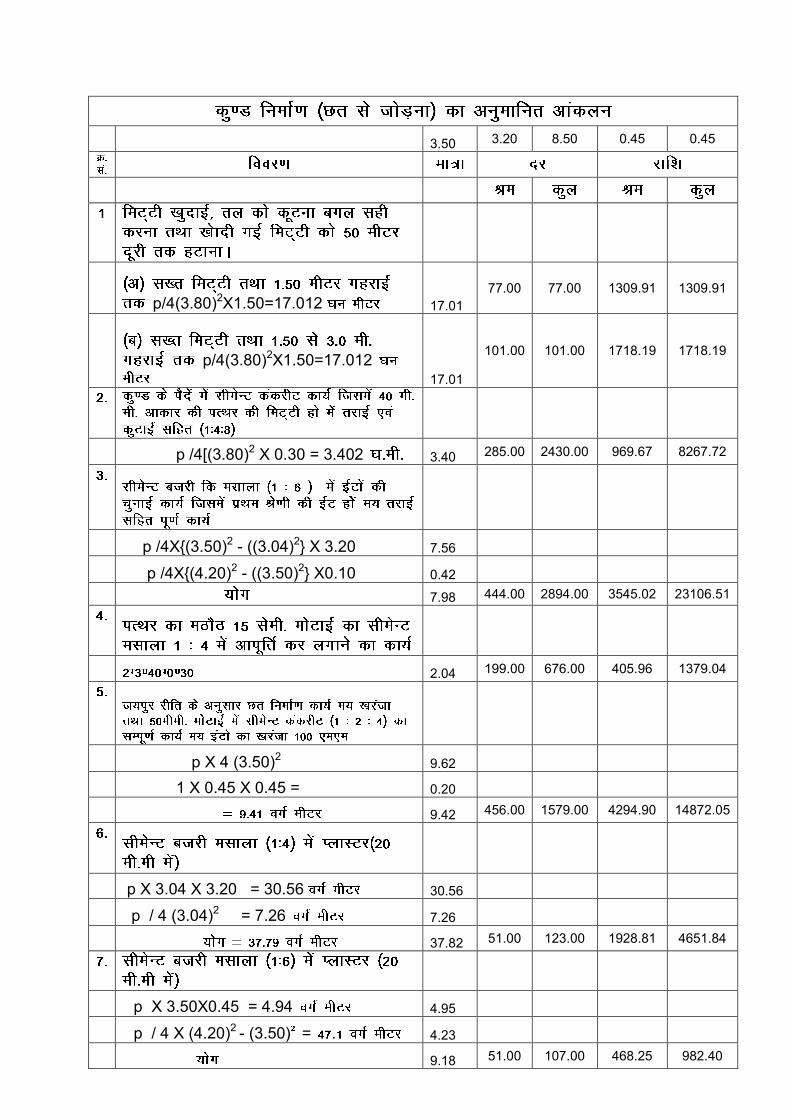
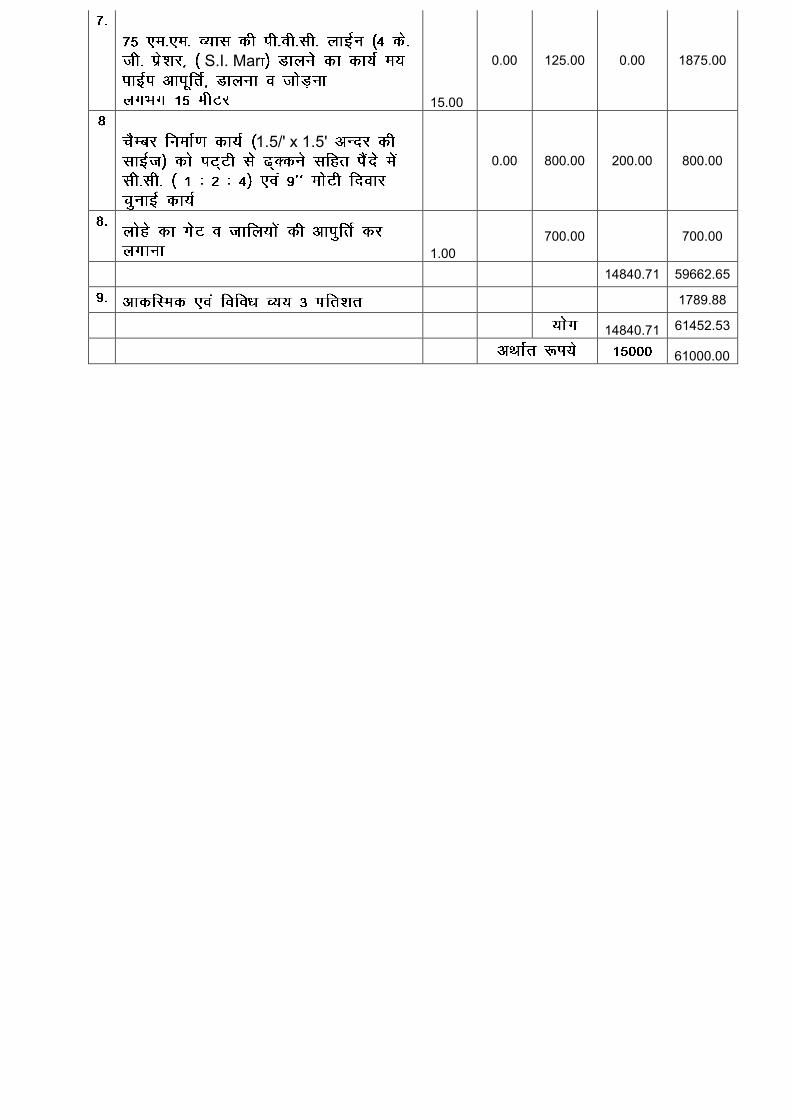
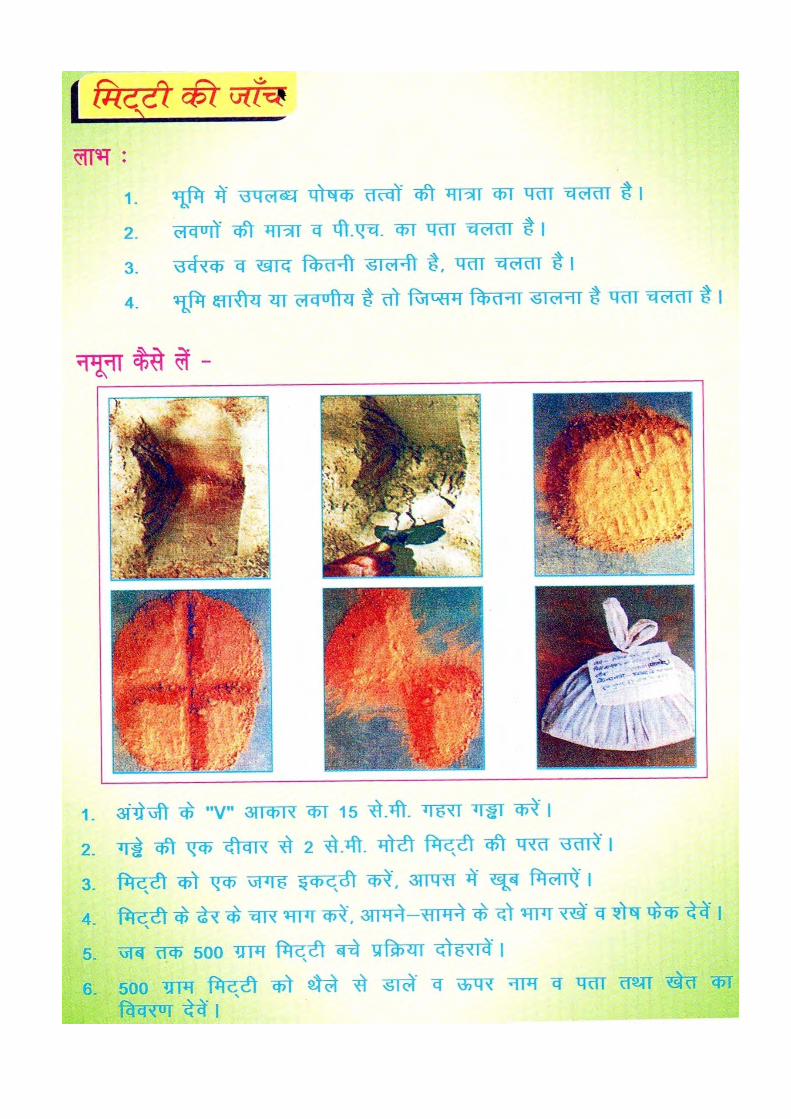
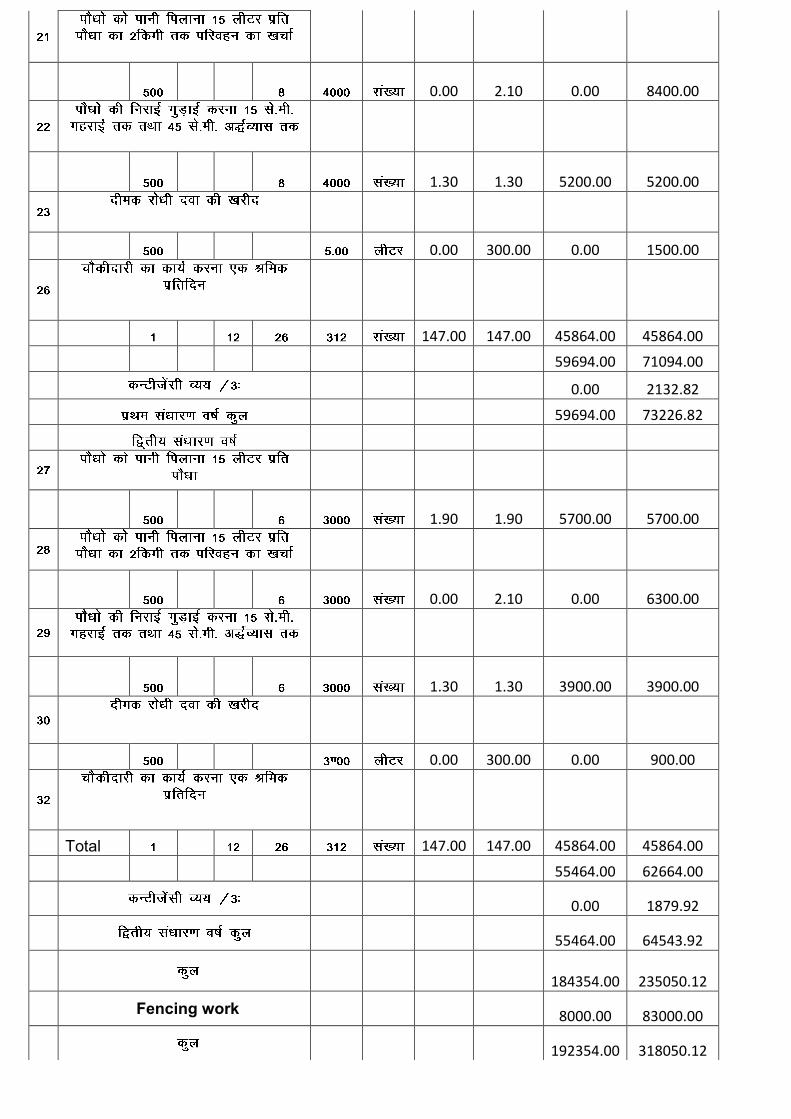
Ñf"k Hkwfe ij o"kkZ ty laxzg.k gsrq dq.M fuekZ.k
xsgw¡ ds mUur cht dk ns’kh fdLe ds lkFk
rqyukRed Qly izn’kZu
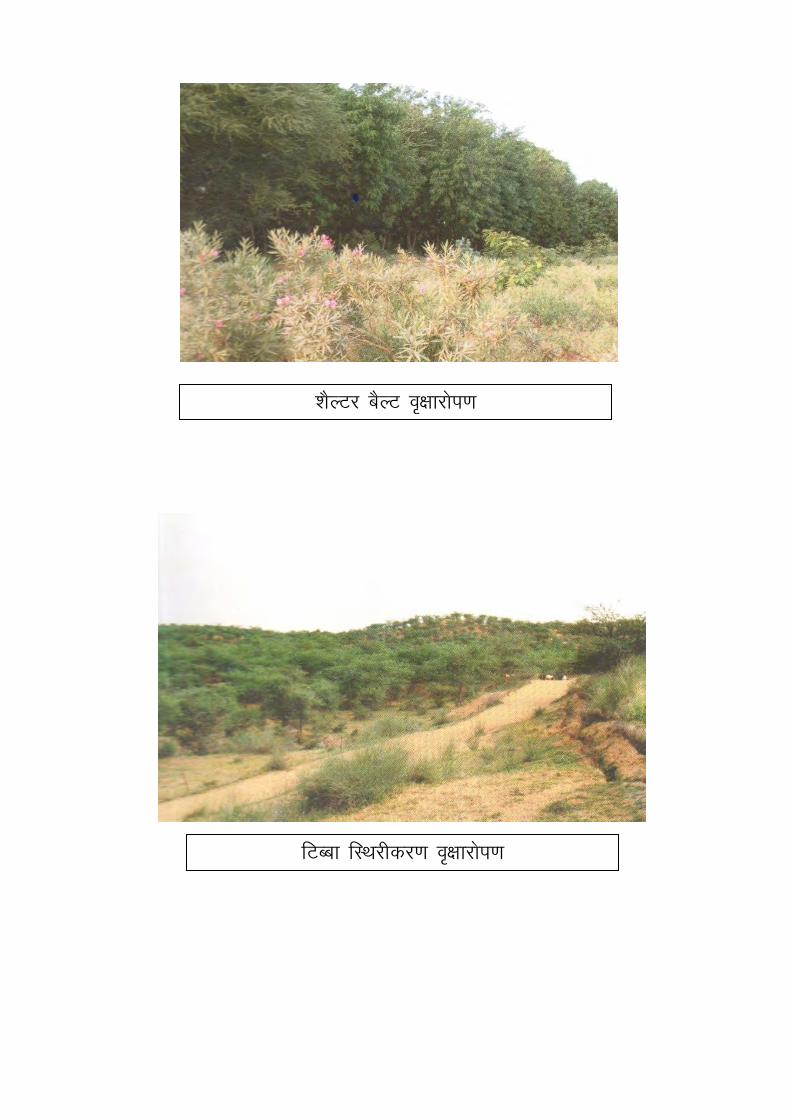
fVCck fLFkjhdj.k o`{kkjksi.k
'kSYVj cSYV o`{kkjksi.k
Fkk¡oyksa esa o"kkZ ds nkSjku ,df=r ty
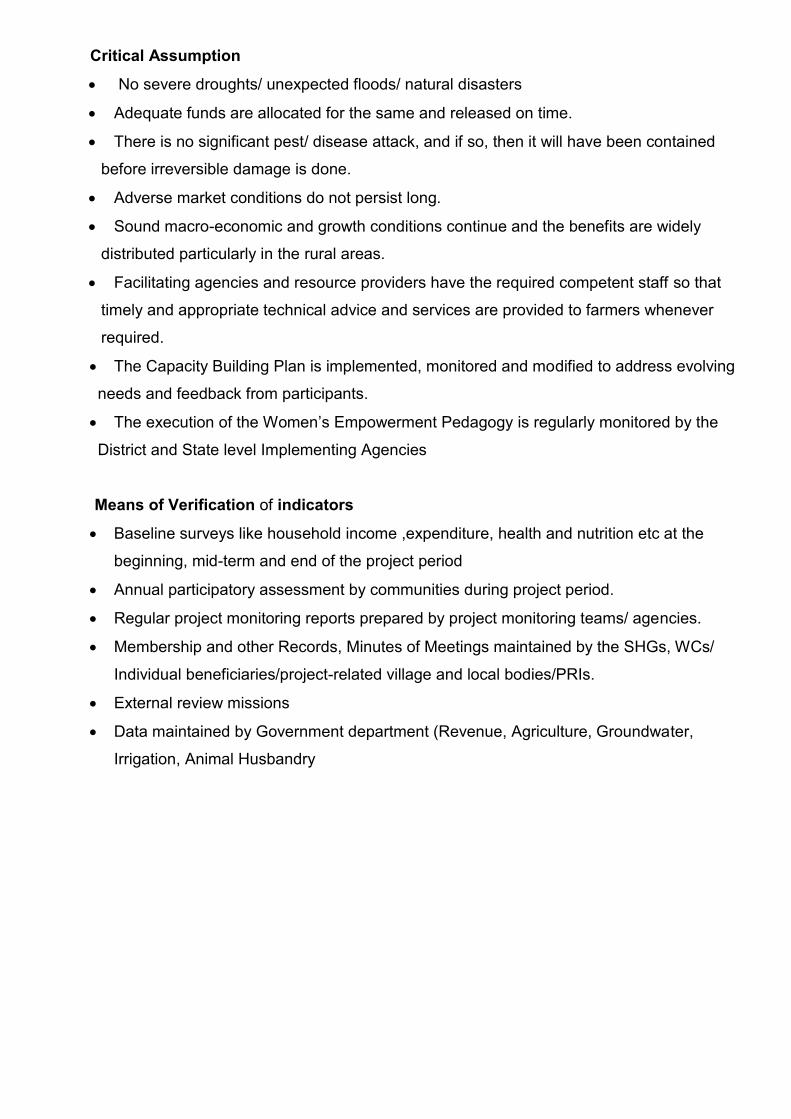
Ñ"kd ds [ksr esa Qynkj ikS/kkjksi.k dk;Z
Critical Assumption
No severe droughts/ unexpected floods/ natural disasters
Adequate funds are allocated for the same and released on time.
There is no significant pest/ disease attack, and if so, then it will have been contained
before irreversible damage is done.
Adverse market conditions do not persist long.
Sound macro-economic and growth conditions continue and the benefits are widely
distributed particularly in the rural areas.
Facilitating agencies and resource providers have the required competent staff so that
timely and appropriate technical advice and services are provided to farmers whenever
required.
The Capacity Building Plan is implemented, monitored and modified to address evolving
needs and feedback from participants.
The execution of the Women’s Empowerment Pedagogy is regularly monitored by the
District and State level Implementing Agencies
Means of Verification of indicators
Baseline surveys like household income ,expenditure, health and nutrition etc at the
beginning, mid-term and end of the project period
Annual participatory assessment by communities during project period.
Regular project monitoring reports prepared by project monitoring teams/ agencies.
Membership and other Records, Minutes of Meetings maintained by the SHGs, WCs/
Individual beneficiaries/project-related village and local bodies/PRIs.
External review missions
Data maintained by Government department (Revenue, Agriculture, Groundwater,
Irrigation, Animal Husbandry
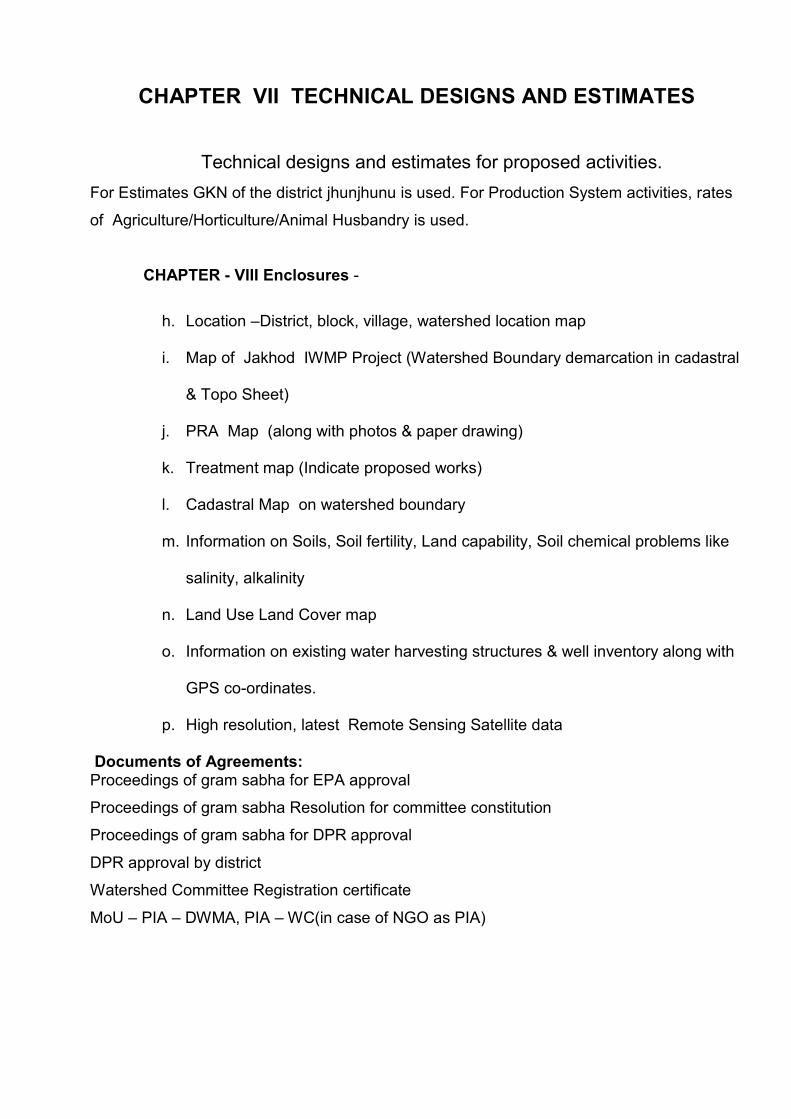
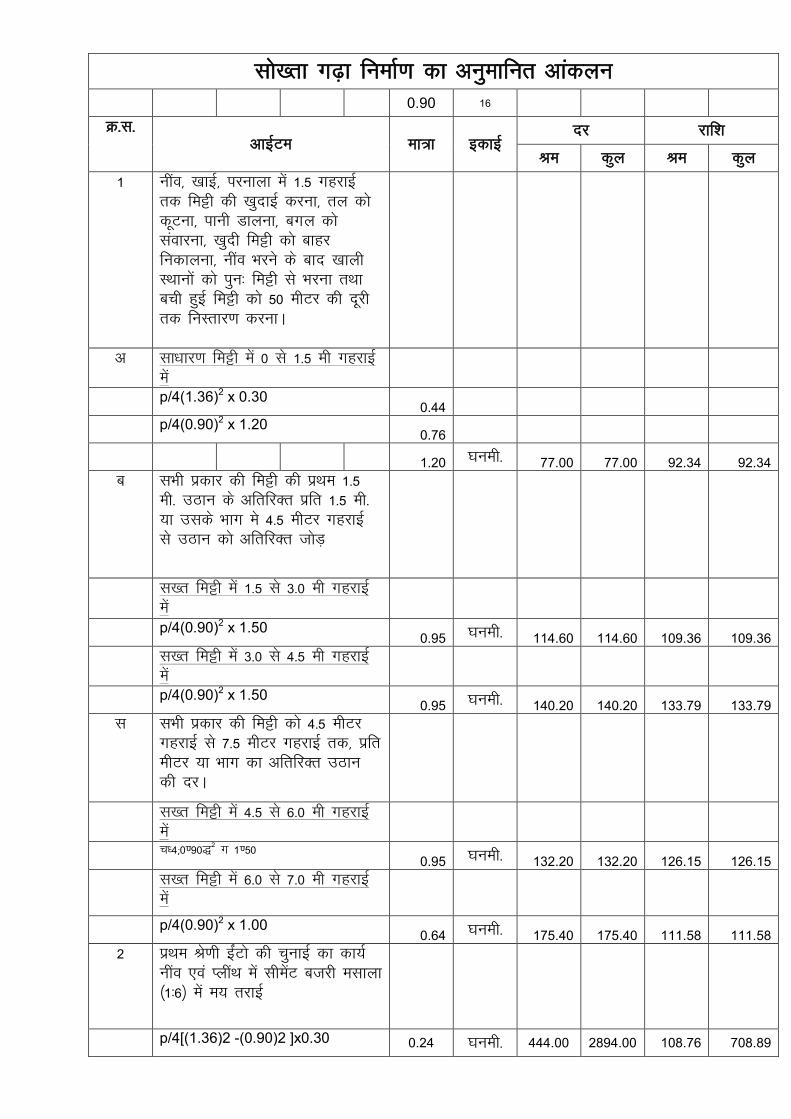
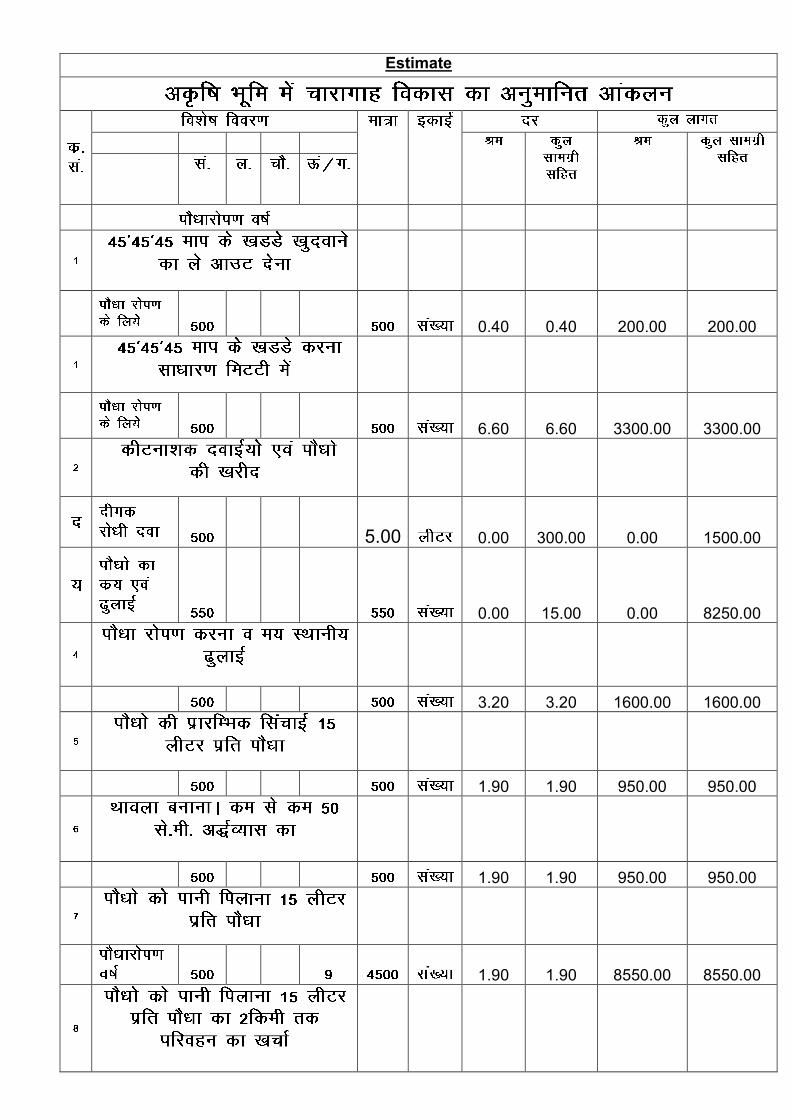
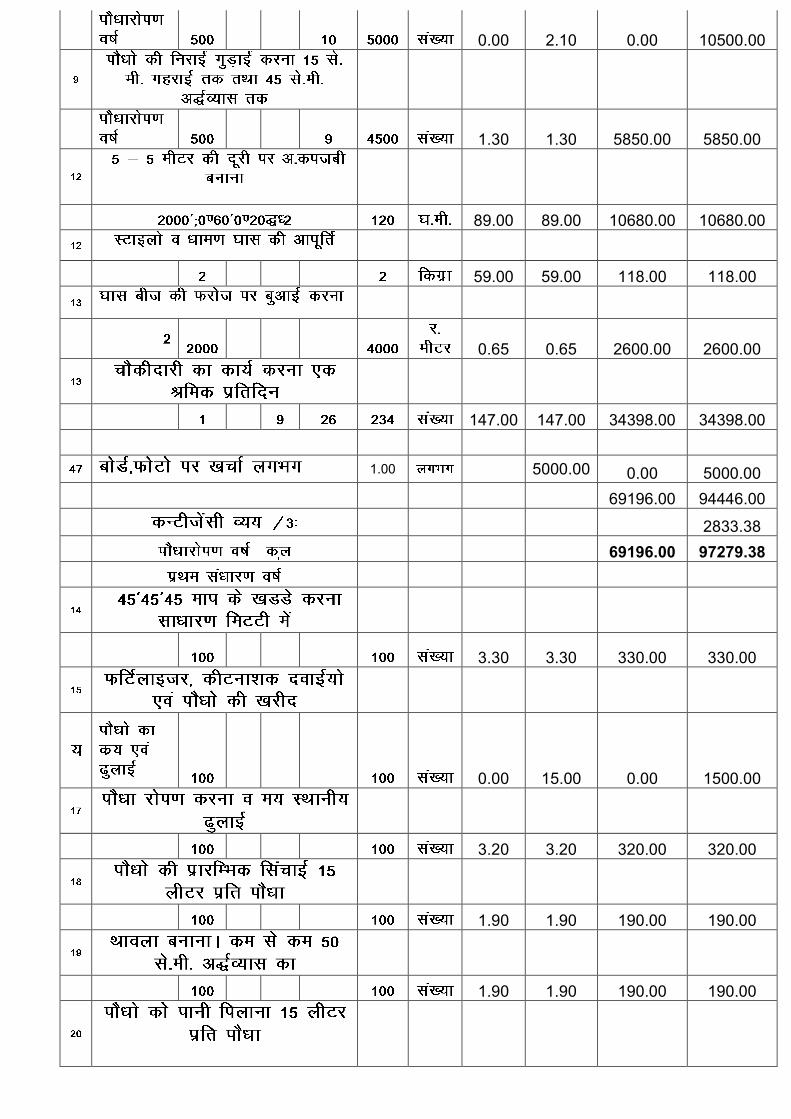
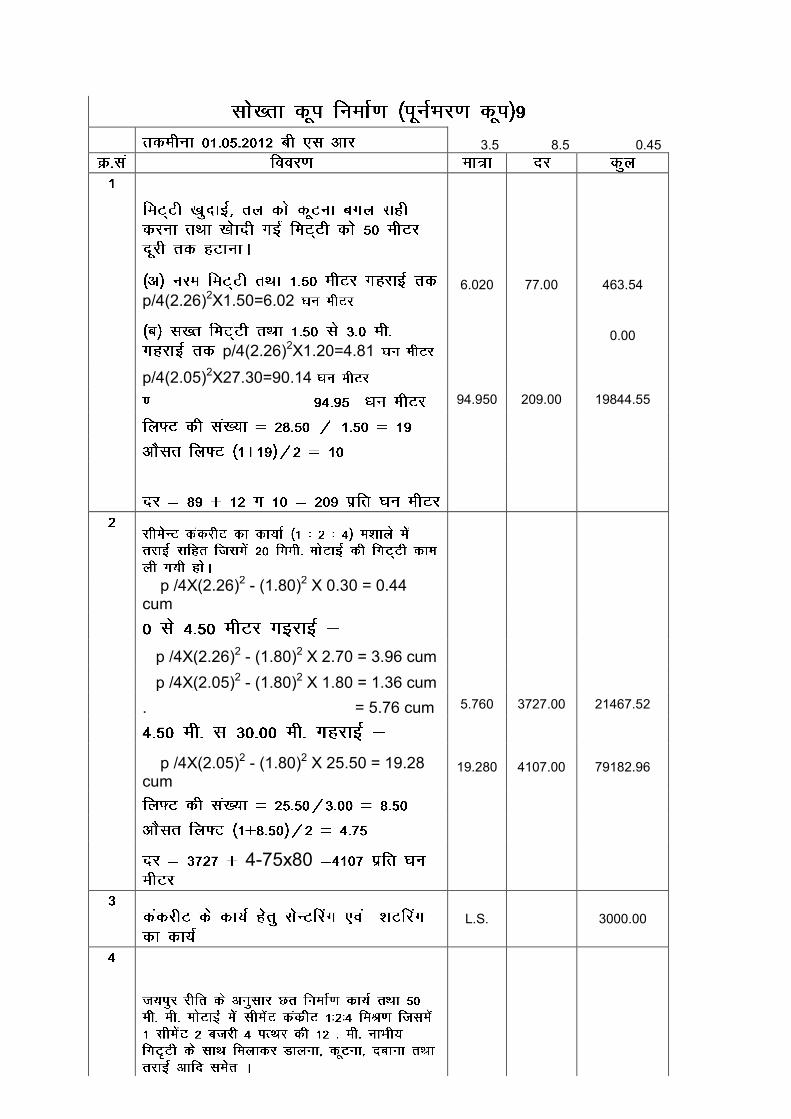
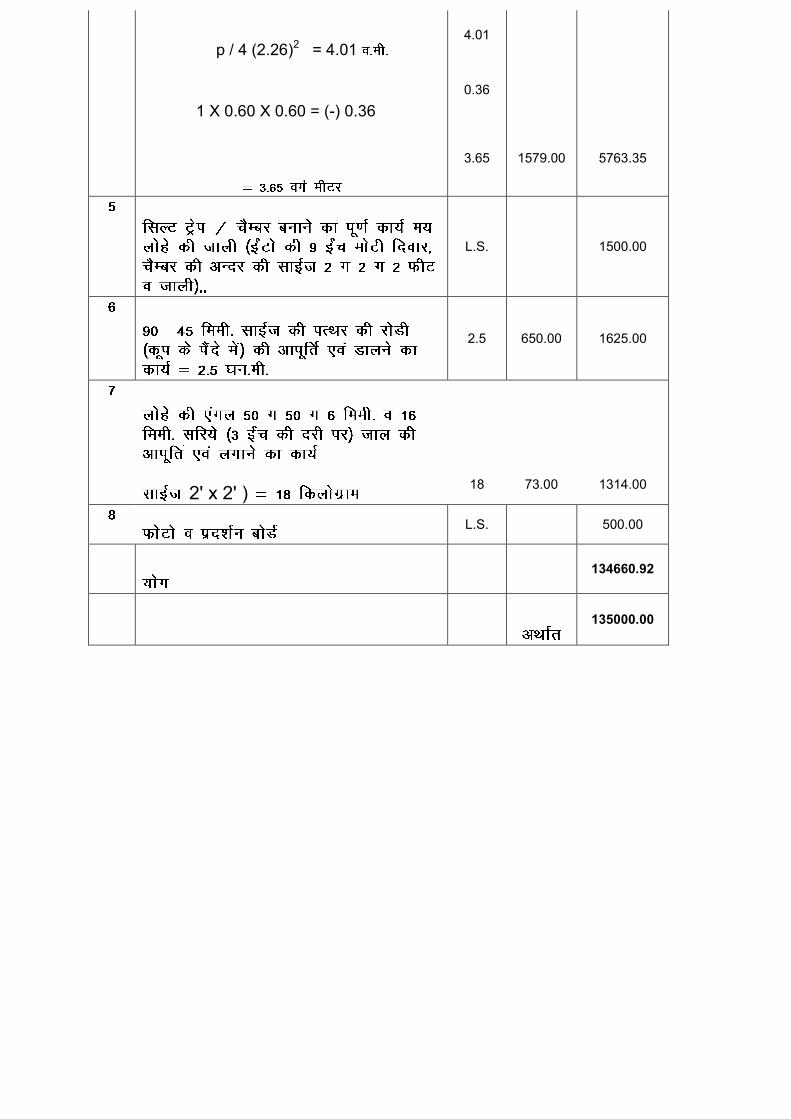
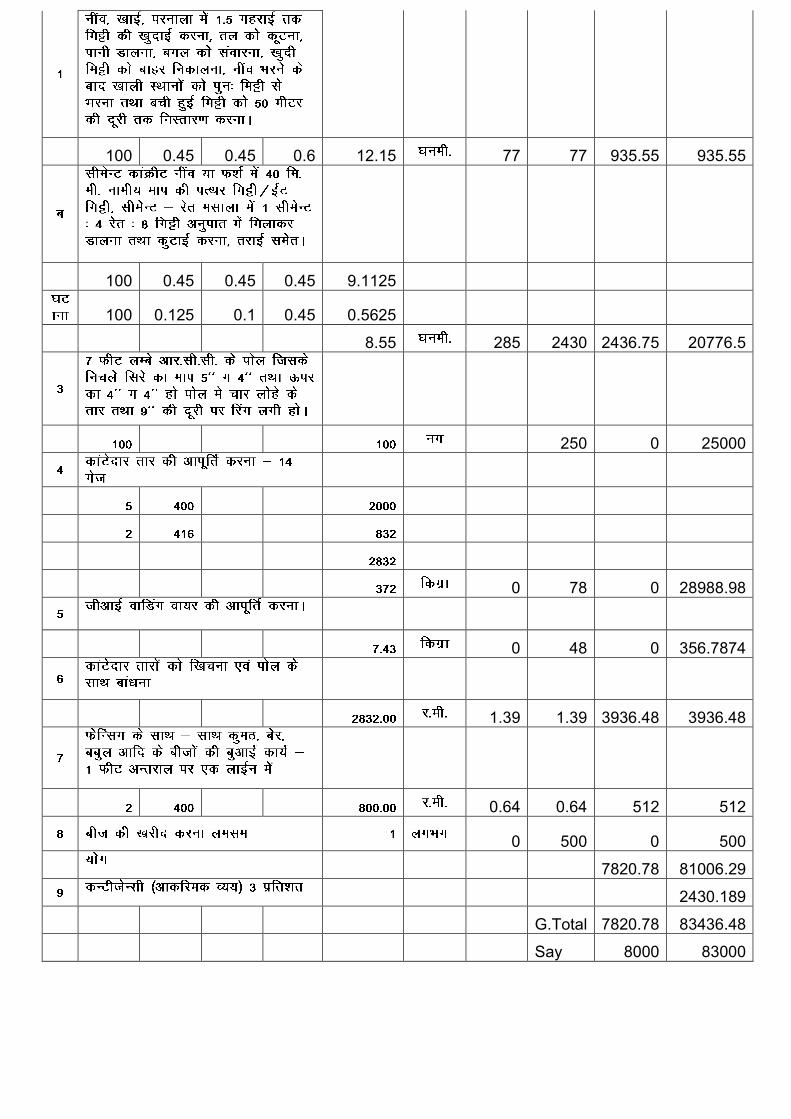
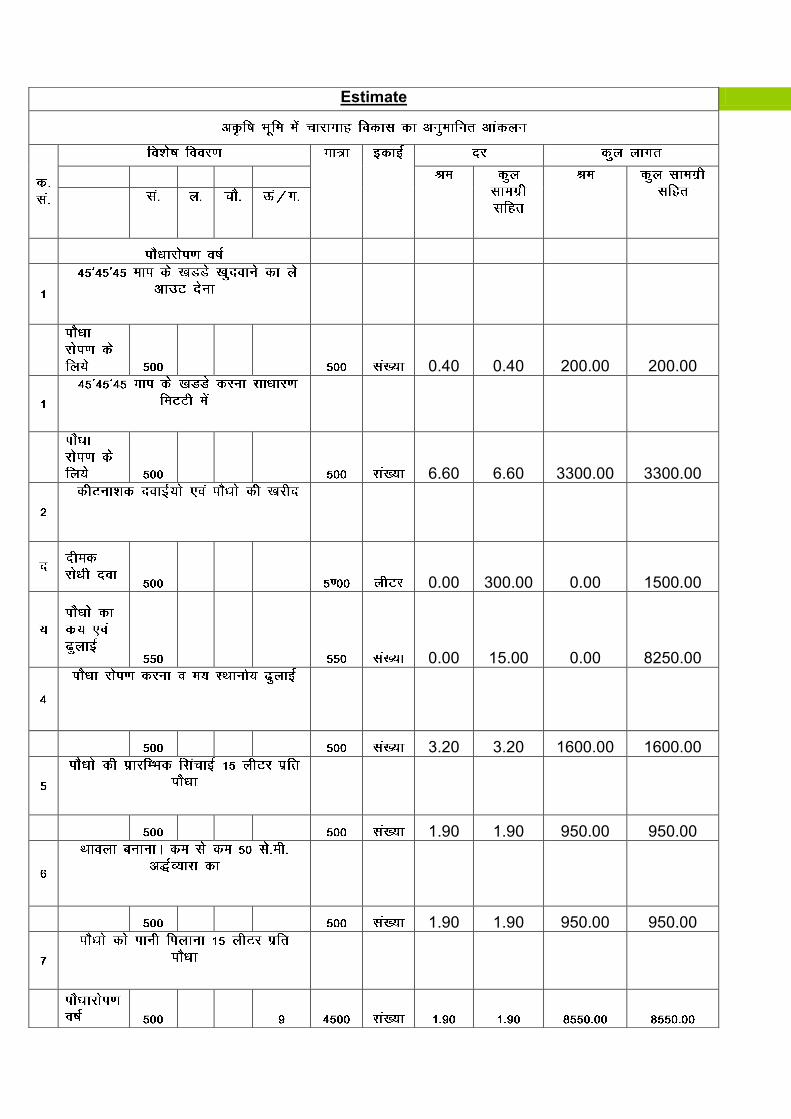
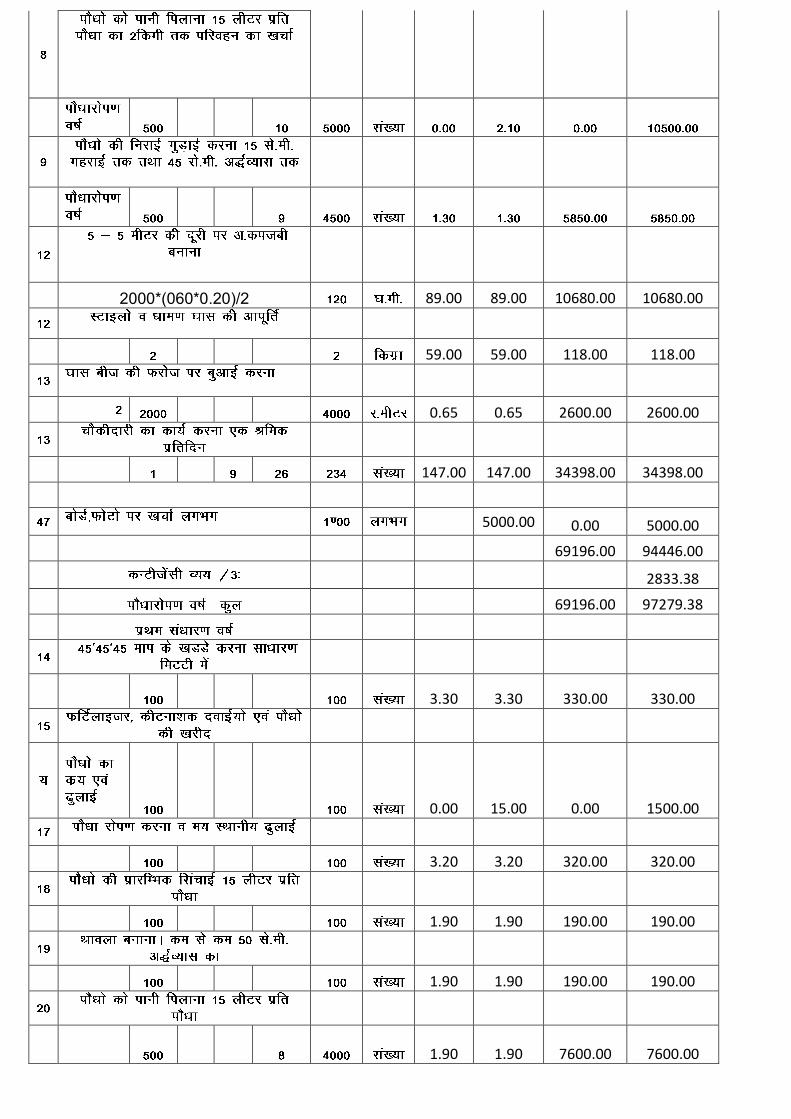
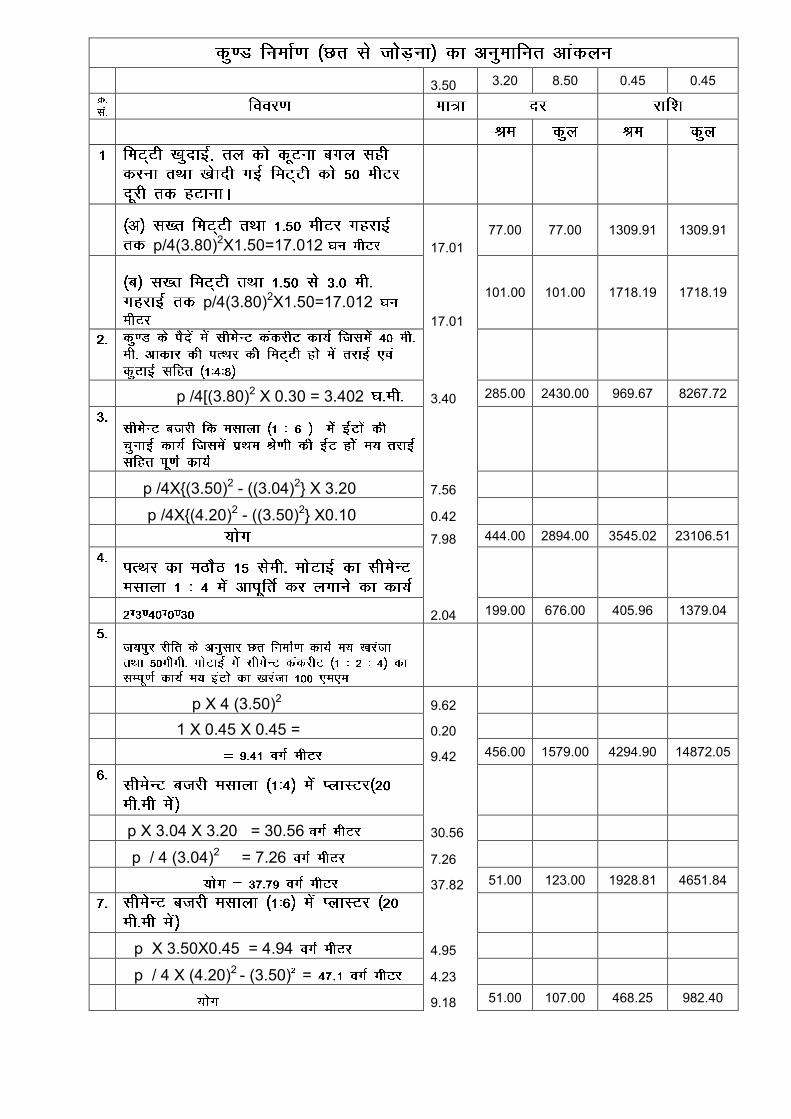
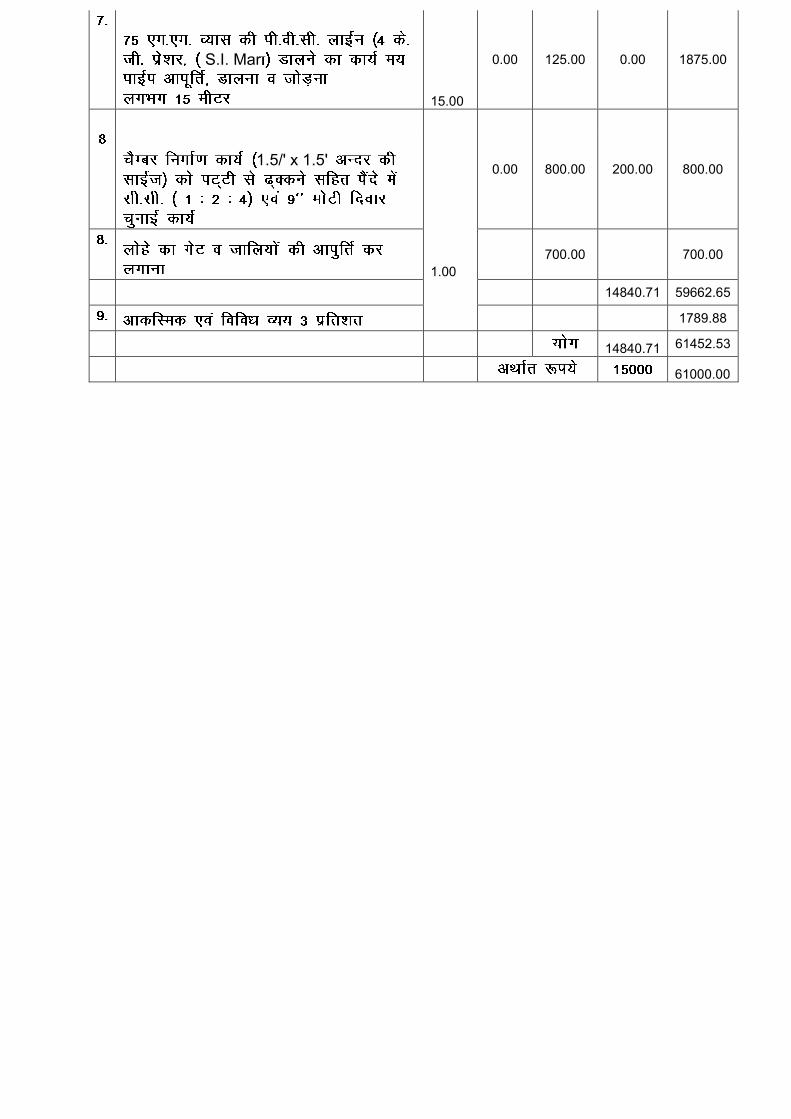
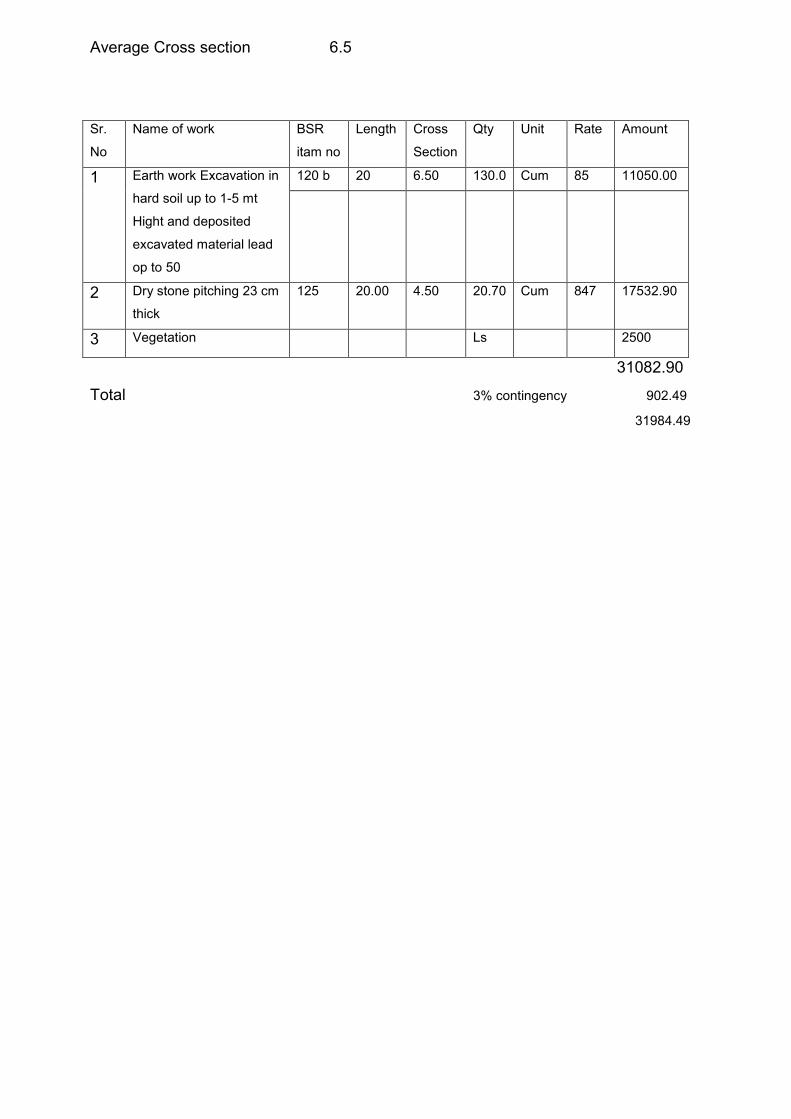
CHAPTER VII TECHNICAL DESIGNS AND ESTIMATES
Technical designs and estimates for proposed activities. For Estimates GKN of the district jhunjhunu is used. For Production System activities, rates
of Agriculture/Horticulture/Animal Husbandry is used.
CHAPTER - VIII Enclosures -
h. Location –District, block, village, watershed location map
i. Map of Jakhod IWMP Project (Watershed Boundary demarcation in cadastral
& Topo Sheet)
j. PRA Map (along with photos & paper drawing)
k. Treatment map (Indicate proposed works)
l. Cadastral Map on watershed boundary
m. Information on Soils, Soil fertility, Land capability, Soil chemical problems like
salinity, alkalinity
n. Land Use Land Cover map
o. Information on existing water harvesting structures & well inventory along with
GPS co-ordinates.
p. High resolution, latest Remote Sensing Satellite data
Documents of Agreements: Proceedings of gram sabha for EPA approval
Proceedings of gram sabha Resolution for committee constitution
Proceedings of gram sabha for DPR approval
DPR approval by district
Watershed Committee Registration certificate
MoU – PIA – DWMA, PIA – WC(in case of NGO as PIA)
H. Location –District, block, village, watershed location map
i.
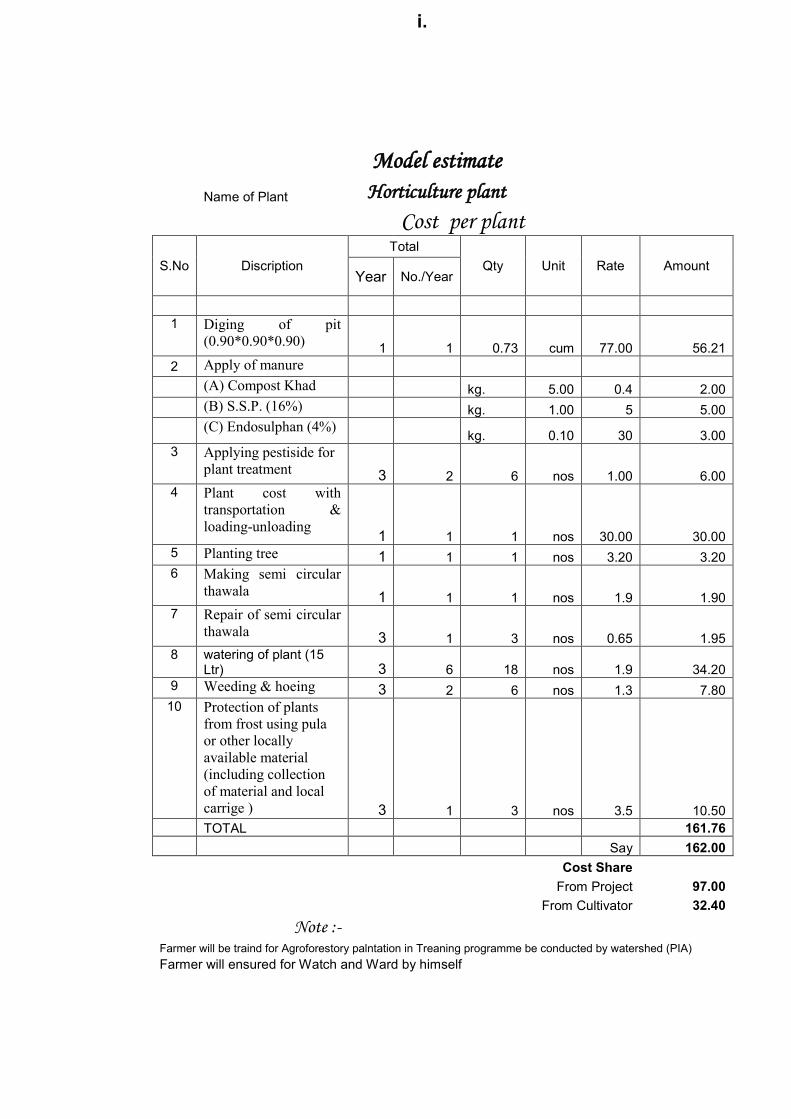
Model estimate
Name of Plant Horticulture plant
Cost per plant
S.No Discription Total
Qty Unit Rate Amount
Year No./Year
1 Diging of pit (0.90*0.90*0.90) 1 1 0.73 cum 77.00 56.21
2 Apply of manure (A) Compost Khad kg. 5.00 0.4 2.00 (B) S.S.P. (16%) kg. 1.00 5 5.00
(C) Endosulphan (4%) kg. 0.10 30 3.00
3 Applying pestiside for plant treatment 3 2 6 nos 1.00 6.00
4 Plant cost with transportation & loading-unloading 1 1 1 nos 30.00 30.00
5 Planting tree 1 1 1 nos 3.20 3.20
6 Making semi circular thawala 1 1 1 nos 1.9 1.90
7 Repair of semi circular thawala 3 1 3 nos 0.65 1.95
8 watering of plant (15
Ltr) 3 6 18 nos 1.9 34.20 9 Weeding & hoeing 3 2 6 nos 1.3 7.80
10 Protection of plants from frost using pula or other locally available material (including collection of material and local carrige ) 3 1 3 nos 3.5 10.50
TOTAL 161.76 Say 162.00 Cost Share From Project 97.00 From Cultivator 32.40
Note :- Farmer will be traind for Agroforestory palntation in Treaning programme be conducted by watershed (PIA) Farmer will ensured for Watch and Ward by himself