__________________________________________
IWT Sector Development Strategy and Business
Development Study for Capacity Augmentation of
National Waterway 1 from Haldia to Allahabad
Volume I: Report Part A
June 2016
IWT Sector Development Strategy and Business
Development Study for Capacity Augmentation of
National Waterway 1 from Haldia to Allahabad
Report Part A
This report has been prepared by:
HPC Hamburg Port Consulting GmbH
Container Terminal Altenwerder
Am Ballinkai 1
21129 Hamburg,
Germany
UNICONSULT
Universal Transport Consulting GmbH
Container Terminal Burchardkai 1
21129 Hamburg
Germany
SubConsultants:
IMS Ingenieurgesellschaft mbH, Stadtdeich 7, 20097 Hamburg, GERMANY
Ramboll, The Epitome Building No.5, Tower–B, DLF Cyber Terrace Phase-III, Gurgaon-122 002, India
UNICONSULT Universal Transport Consulting GmbH
Phone: +49-40-74008 106
Fax: +49-40-322764
E-mail: [email protected]
Web: www.uniconsult-hamburg.de
Copyright © by UNICONSULT Universal Transport Consulting GmbH
18 May 2016
IWT Sector Development Strategy and Business Development Study for Capacity Augmentation of National Waterway 1 from Haldia to Allahabad iii
Table of Contents
Page
List of Figures ........................................................................................................................................... 1 List of Tables ............................................................................................................................................ 5 List of Abbreviations .............................................................................................................................. 10 1 Management Summary ................................................................................................................. 11
Waterway & Infrastructure ............................................................................................................. 11
Market Survey Methodology ......................................................................................................... 11
Market Assessment ........................................................................................................................ 12
Commodity Share ........................................................................................................................... 12 Thermal Coal ............................................................................................................. 12
Construction Materials............................................................................................... 12
Industrial inputs ......................................................................................................... 13
Agricultural inputs and Food products ...................................................................... 13
Consumer Goods and Containers .............................................................................. 13
Transport Forecast model ............................................................................................................... 14
Infrastructure Cases ........................................................................................................................ 14
Transportation Costs ...................................................................................................................... 15
IWT Promotion and Incentives ...................................................................................................... 15
Freight Market Projections ............................................................................................................. 16
Socio Economic Advantages of Modal Shift to IWT ..................................................................... 20 2 Macro-Economic Growth and Policies ........................................................................................... 20
2.1 Background economic growth ................................................................................................ 21
2.1.1 Uttar Pradesh ............................................................................................................. 21
2.1.2 Bihar ........................................................................................................................... 24
2.1.3 Jharkhand................................................................................................................... 26
2.1.4 West Bengal ............................................................................................................... 29
2.1.5 Madhya Pradesh ........................................................................................................ 32
2.1.6 Summary .................................................................................................................... 34
2.2 Indian Government IWT policies and subsidies.................................................................... 37
2.2.1 Background ................................................................................................................ 37
2.2.2 Scheme for Incentivizing Modal Shift of Cargo (SIMSC) ............................................ 40
2.2.3 Possible application of policies and subsidies ........................................................... 41
2.3 Policies and subsidies to the favor of IWT in Europe ............................................................. 42
2.3.1 The European Union Marco Polo Program ................................................................ 44
2.3.2 The EU funding program TEN-T (Connecting European Facilities CEF) ..................... 49
2.3.3 The EU funding program INTERREG IV A Upper Rhine .............................................. 50
2.3.4 The EU funding program NAIADES ............................................................................ 52
2.3.5 The EU funding projects PLATINA and PLATINA 2 ..................................................... 54
2.3.6 Conclusions on the Marco Polo and other EU incentive programs in respect of inland waterway transport in India ...................................................................................... 56
2.4 Policies and subsidies to the favor of IWT in China ................................................................ 57
2.4.1 Modal shift from land transport to waterway transport........................................... 58
2.4.2 Encouraging establishment of inland waterway transport service companies......... 61
2.4.3 Encouraging recycling of ship wastes ........................................................................ 61
2.4.4 Technological innovation of inland water vessels ..................................................... 63
2.4.6 Traffic control of inland water transport .................................................................. 67
IWT Sector Development Strategy and Business Development Study for Capacity Augmentation of National Waterway 1 from Haldia to Allahabad iv
2.4.7 Summary on incentives and first conclusions from the Chinese example ................ 68 3 Regional Demand ........................................................................................................................... 70
3.1 The NW-1 hinterland ............................................................................................................ 70
3.1.1 Haldia-Farakka sector ................................................................................................ 70 3.1.1.1 Zone 1: Kolkata-Howrah ............................................................................. 70
3.1.1.2 Zone 2: Haldia ............................................................................................. 71
3.1.1.3 Zone 3: Durgapur-Raniganj-Burdwan ......................................................... 72
3.1.1.4 Zone 4: Rampurhat-Nalhati-Pakur-Berhampore ........................................ 73
3.1.1.5 Zone 5: Indo-Bangladesh Protocol Route ................................................... 73
3.1.2 Farakka-Munger sector .............................................................................................. 74
3.1.3 Ballia-Allahabad sector .............................................................................................. 77
3.2.1 Terminals ................................................................................................................... 79 3.2.1.1 Terminal capacities ..................................................................................... 79
3.2.1.2 Hinterland connectivity of existing terminals ............................................ 80
3.2.2 Facilities other than terminals ................................................................................... 81 3.2.2.1 Storage infrastructure ................................................................................ 81
3.2.2.2 Haldia-Farakka sector ................................................................................. 81
3.2.2.3 Farakka-Munger sector .............................................................................. 82
3.2.2.4 Munger-Ballia sector .................................................................................. 82
3.2.2.5 Ballia-Allahabad sector ............................................................................... 83
3.3 Special economic & industrial zones .................................................................................. 84
3.4 Facilities and infrastructurerequired to enhance modal shift ................................................ 86
3.5 Eastern Dedicated Freight Corridor ........................................................................... 89
3.6 Existing transport demand ........................................................................................ 90
3.6.1 Haldia – Farakka sector .............................................................................................. 91 3.6.1.1 Thermal coal ............................................................................................... 91
3.6.1.2 Fly ash ......................................................................................................... 92
3.6.1.3 Stone chips ................................................................................................. 93
3.6.1.4 Cement ....................................................................................................... 93
3.6.1.5 Sand ............................................................................................................ 93
3.6.1.6 Iron & steel ................................................................................................. 93
3.6.1.7 Fertilizer ...................................................................................................... 93
3.6.1.8 Agro-equipment ......................................................................................... 94
3.6.1.9 Food grains and flour ................................................................................. 95
3.6.1.10 Crude vegetable oil .................................................................................... 95
3.6.1.11 Other raw materials ................................................................................... 95
3.6.1.12 Consumer goods ......................................................................................... 95
3.6.1.13 Over-dimensional cargo (ODC) ................................................................... 95
3.6.2 Farakka-Munger sector .............................................................................................. 96 3.6.2.1 Around Sahibganj ....................................................................................... 96
3.6.2.2 Sakrigali ...................................................................................................... 96
3.6.2.3 Mirzachowk ................................................................................................ 96
3.6.2.4 Rajmahal ..................................................................................................... 96
3.6.2.5 Pirpainti ...................................................................................................... 96
3.6.2.6 Bakudi ......................................................................................................... 97
3.6.2.7 Barharwa .................................................................................................... 97
3.6.2.8 Pakur........................................................................................................... 97
3.6.2.9 Baghalpur ................................................................................................... 97
IWT Sector Development Strategy and Business Development Study for Capacity Augmentation of National Waterway 1 from Haldia to Allahabad v
3.6.2.10 Kahalgaon ................................................................................................... 98
3.6.3 Munger-Ballia sector ............................................................................................... 100 3.6.3.1 Patna ........................................................................................................ 100
3.6.3.2 Gaya .......................................................................................................... 101
3.6.3.3 Munger ..................................................................................................... 101
3.6.3.4 Barauni ..................................................................................................... 101
3.6.3.5 Barh .......................................................................................................... 101
3.6.3.6 Ballia ......................................................................................................... 101
3.6.4 Ballia-Allahabad sector ............................................................................................ 102 3.6.4.1 Coal ........................................................................................................... 102
3.6.4.2 Building materials ..................................................................................... 102
3.6.4.3 Agricultural inputs .................................................................................... 102
3.6.4.4 Food grains and flour ............................................................................... 102
3.6.4.5 Edible oil ................................................................................................... 102
4 Freight Costs and Tariffs .............................................................................................................. 103
4.1 Capital-cost recovery mechanism of railway system ........................................................... 103
4.2.2 Road ......................................................................................................................... 113
4.2.3 Inland-waterway transport ..................................................................................... 115 5 Regional Traffic Flows .................................................................................................................. 117
5.1 Freight transport patterns .................................................................................................... 117
5.1.1 Haldia – Farakka sector ............................................................................................ 117 5.1.1.1 Commodity movements and freight tariff rates ...................................... 117
5.1.1.2 Thermal coal ............................................................................................. 121
5.1.1.3 Stone chips ............................................................................................... 121
5.1.1.4 Cement ..................................................................................................... 121
5.1.1.5 Iron & steel ............................................................................................... 121
5.1.1.6 Fertilizer (urea) ......................................................................................... 122
5.1.1.7 Food grains ............................................................................................... 122
5.1.1.8 Agro-equipment ....................................................................................... 122
5.1.1.9 Limestone ................................................................................................. 122
5.1.1.10 Other raw materials ................................................................................ 122
5.1.1.11 Consumer goods ...................................................................................... 122
5.1.1.12 Over-dimensional cargo (ODC) ................................................................ 122
5.1.2 Farakka-Munger sector ............................................................................................ 124 5.1.2.1 Around Sahibganj ..................................................................................... 124
5.1.2.2 Sakrigali .................................................................................................... 125
5.1.2.3 Mirzachowk .............................................................................................. 129
5.1.2.4 Rajmahal ................................................................................................... 129
5.1.2.5 Pirpainti .................................................................................................... 130
5.1.2.6 Bakudi ....................................................................................................... 131
5.1.2.7 Barharwa .................................................................................................. 132
5.1.2.8 Pakur......................................................................................................... 133
5.1.2.9 Baghalpur ................................................................................................. 134
5.1.2.10 Kahalgaon ................................................................................................. 137
5.1.3 Munger-Ballia sector ............................................................................................... 141
5.1.4 Ballia-Allahabad sector ............................................................................................ 142 5.1.4.1 Coal ........................................................................................................... 142
5.1.4.2 Building materials ..................................................................................... 142
IWT Sector Development Strategy and Business Development Study for Capacity Augmentation of National Waterway 1 from Haldia to Allahabad vi
5.1.4.3 Agricultural inputs .................................................................................... 142
5.1.4.4 Food grains and flour ............................................................................... 142
5.1.4.5 Edible oil ................................................................................................... 143
5.1.4.6 Local hand-loom silk products.................................................................. 143
5.1.4.7 Over-dimensional cargo (ODC) ................................................................. 143
5.2 Bottlenecks by transport mode and route .............................................................. 145
5.2.1 Railways ................................................................................................................... 145
5.2.2 Roads ....................................................................................................................... 145 6 General Competitiveness of IWT ................................................................................................. 151
6.1 Supply chain review ........................................................................................................... 151
6.3 Service attributes of IWT compared with road and rail ....................................................... 158
6.4 Required improvements to attract more traffic ............................................................... 163
6.5 Business development plan ............................................................................................... 165
6.5.1 Cargo services .......................................................................................................... 166
6.5.2 Passenger services ................................................................................................... 169
6.5.3 Ferry services ........................................................................................................... 170 6.5.3.1 Uttar Pradesh ........................................................................................... 172
6.5.3.2 Bihar ......................................................................................................... 172
6.5.3.3 Jharkhand ................................................................................................. 172
6.5.3.4 West Bengal.............................................................................................. 172
7 IWT Competitiveness ................................................................................................................... 174
7.1 NW-1 potential and constraints ....................................................................................... 174
7.1.1 General potential ..................................................................................................... 174
7.1.2 Cargo sector ............................................................................................................. 175 7.1.2.1 Haldia-Farakka sector ............................................................................... 175
7.1.2.2 Farakka-Munger sector ............................................................................ 176
7.1.2.3 Muner-Ballia sector .................................................................................. 178
7.1.2.4 Ballia-Allahabad sector ............................................................................. 178
7.1.3 Passenger sector ...................................................................................................... 180 8 Cost Competitiveness .................................................................................................................. 181
8.1 Cost competitiveness comparison rail against IWT .............................................................. 181
8.2 Unit cost of transportation for IWT as against rail and road................................................ 185
8.2.1 Case I and II: 16-tons and 24-tons capacity trucks .................................................. 186
8.2.2 Case III: Rajmahal Coal Mines .................................................................................. 188
8.2.3 External costs ........................................................................................................... 190 9 Traffic Forecast – General ............................................................................................................ 192
9.1 Background indicators .......................................................................................................... 192
9.2 Impact of background economic growth on future transport demand ............................... 193
9.3 Freight volume growth as expected by producers and operators .................................. 194 10 Traffic Forecast – on O/D Routes ................................................................................................. 195
10.1 Methodology and future trends ........................................................................................... 195
10.1.1 Overview of the forecast modelForecast Model .................................................... 195
10.1.2 Evaluation of modal shifts ....................................................................................... 197
10.1.3 Parameter assumptions used in the model ............................................................. 199
10.1.4 Volume forecasts ..................................................................................................... 201
10.2 Results of traffic forecast for existing and augmented NW-1 ............................................ 204
10.2.1 Total cargo volumes by case .................................................................................... 205
10.2.2 Cargo flows by original transport mode .................................................................. 206
10.2.3 Cargo volumes upstream against downstream flows ............................................. 206
IWT Sector Development Strategy and Business Development Study for Capacity Augmentation of National Waterway 1 from Haldia to Allahabad vii
10.2.4 Volumes by cargo types ........................................................................................... 207
10.2.5 Cargo volumes by commodity ................................................................................. 208
10.3 Examination of origin-destination pairs .................................................................. 212
10.4 IWT-cargo volumes through existing and planned major multi-modal terminals .. 213
10.4.1 Haldia Multi-modal Terminal and Sagar Island ....................................................... 213
10.4.2 Kolkata Garden Reach Terminal .............................................................................. 217
10.4.3 Sahibganj Multi-modal Terminal ............................................................................. 220
10.4.4 Patna Terminal ......................................................................................................... 222
10.4.5 Ramnagar Multi-modal Terminal............................................................................. 225
10.4.6 Ghazipur Multi-modal Terminal .............................................................................. 228
10.4.7 Kalughat Multi-modal Terminal ............................................................................... 236
10.4.8 Tribeni transshipment terminal ............................................................................... 238
10.5 Demand distribution between various transport corridors and modes ............................. 239
11 Socio Economic and Environment Benefits .......................................................................... 242
11.1 Absolute and comparative benefits to environment due to the modal shift and transportation of cargo using IWT sector ............................................................................ 242
12. Annexes ........................................................................................................................................ 251
Annex 1: List of Market-Survey Interviews .................................................................................. 252
Annex 2: Roadside Interviews to identify Truck Loads ................................................................ 266
Annex 3: Commodities identified in Haldia-Farakka NW-1 sector (tons) .................................... 269
Annex 4: Farakka-Munger Survey Information ............................................................................ 270
Annex 5: Monthly Cargo Movements (tons) ................................................................................ 271
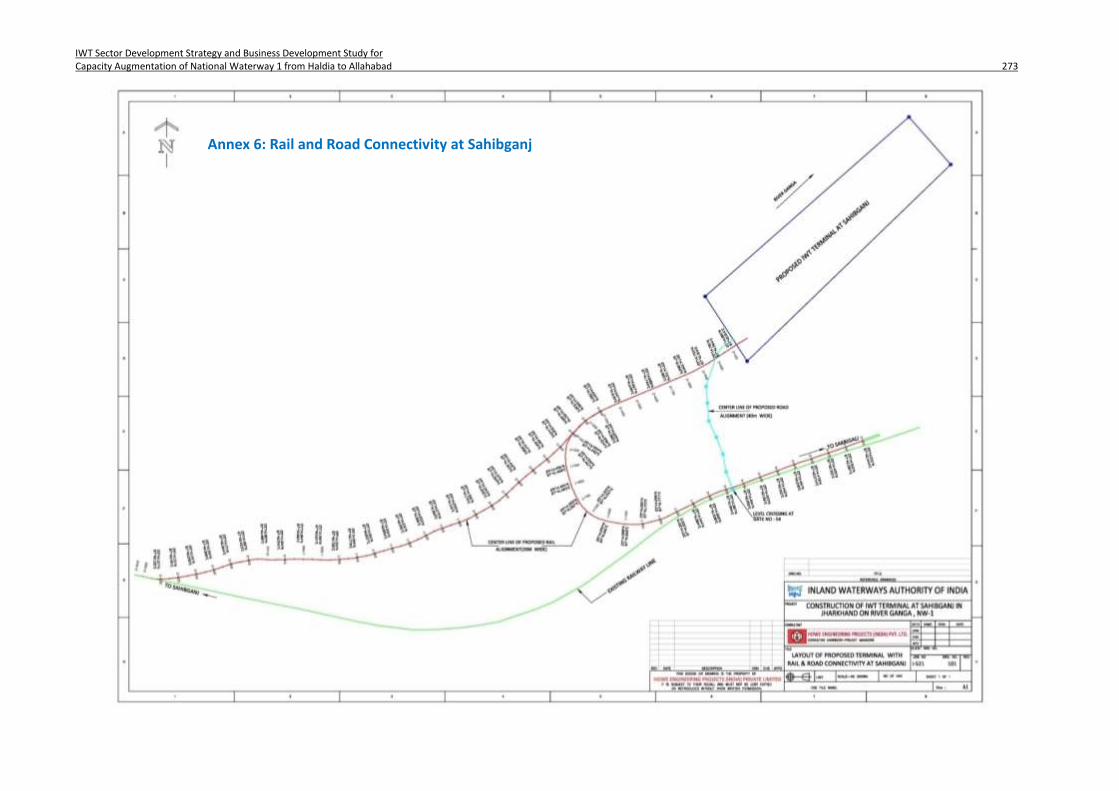
Annex 6: Rail and Road Connectivity at Sahibganj ....................................................................... 273
Annex 7: Railway Freight Charges for Class 150-Type Commodity .............................................. 274
Annex 8: Cost comparison of O/D pairs identified during through our market survey, calculated against potential O/D pairs channeled through Ghazipur ....................................... 275
Annex 9: Potential Transhipment Cargo via Tribeni (MAC augmentation case, tons)................. 276
IWT Sector Development Strategy and Business Development Study for Capacity Augmentation of National Waterway 1 from Haldia to Allahabad 1
List of Figures Page
Figure 1: Map of Uttar Pradesh ................................................................................................ 22
Figure 2: Map of Bihar .............................................................................................................. 25
Figure 3: Map of Jharkhand ..................................................................................................... 27
Figure 4: Map of West Bengal .................................................................................................. 30
Figure 5: Map of Madhya Pradesh ........................................................................................... 33
Figure 6: Progress in IWT development on national waterways ............................................. 39
Figure 7: Marco Polo- facts and figures .................................................................................... 48
Figure 8: Demarcation of Zone 1 (Kolkata-Howrah and vicinity) and Zone 2 (Haldia and
vicinity) 71
Figure 9: : Haldia Multi-Modal Terminal at present .............................................................................. 72
Figure 10 Demarcation of Zone 3 (Durgapur-Raniganj-Burdwan and vicinity) ......................... 72
Figure 11: Demarcation of Zone 4 (Rampurhat-Nalhati-Pakur-Berhampore and vicinity)......... 73
Figure 12: Demarcation of Zone 5 (Indo-Bangladesh Protocol Route)...................................... 74
Figure 13: Influence and core region-Sahibganj ......................................................................... 75
Figure 14: Loading points in the influence region ...................................................................... 75
Figure15: Survey area covered around Patna ........................................................................... 76
Figure16: Survey area covered within the Ballia-Allahabad sector ........................................... 77
Figure 17: Location of IWAI facilities in relation to potential cargo locations............................ 79
Figure 18: Existing Patna terminal ............................................................................................. 83
Figure 19: Location of special economic zones .......................................................................... 85
Figure20: Aspects enhancing modal shift from road/rail to IWT .............................................. 88
Figure 21 : Course and construction progress of EDFC ......................................................................... 89
Figure 22: Coal fields and coal-fired thermal power plants ....................................................... 92
Figure 23: Location of fertilizer companies ................................................................................ 94
Figure 24: Transport and NW-1 loading stations at Bhagalpur .................................................. 98
Figure25: Transport and NW-1 loading stations at Kahalgaon .................................................. 99
IWT Sector Development Strategy and Business Development Study for Capacity Augmentation of National Waterway 1 from Haldia to Allahabad 2
Figure 26: Munger-Ballia sector with major industrial centers ........................................................... 100
Figure 27: Development of total traffic earnings and cargo traffic earnings (in Rs million) ... 106
Figure 28: Distribution of construction costs ........................................................................... 107
Figure 29: Development of ordinary working expenses (in Rs million) .............................................. 108
Figure 30: Development of ton-km by commodities (in million ton-km) ................................ 108
Figure 31: Distribution of %-share of ton-km by commodities in 2012/13 ......................................... 109
Figure 32: Development of annual earnings per ton-km ......................................................... 109
Figure 33: Commodities moved through Haldia and Sagar Island ...................................................... 117
Figure 34: Commodities moved through Haldia and Sagar ................................................................. 119
Figure 35: Commodities moved through Kolkata-Farakka region ....................................................... 120
Figure 36: Commodities moved through Kolkata and Pakur ............................................................... 123
Figure 37: Route map-Sakrigali to Manihari by naukas ....................................................................... 127
Figure 38: Means of commodity transport ......................................................................................... 128
Figure 39: Severe damage inflicted due to heavy truck loads ............................................................ 129
Figure 40: Commodities moved in Farakka-Munger Sector ..................................................... 138
Figure 41: Cargo moved in the Farakka-Munger sector (tons 2015)........................................ 140
Figure 42: Commodities moved in Munger-Ballia Sector ......................................................... 141
Figure 43: Commodities moved through Ballia-Allahabad sector (tons) ................................. 144
Figure 44: Supply chain ............................................................................................................ 151
Figure 45: Determining factors in modal shift for freight transportation ................................ 160
Figure 46: Strategic business development ............................................................................. 166
Figure 47: Potential ro-ro ferry connections along NW-1 ................................................................... 173
Figure 48: Ferry at Kochuberia Ghat.................................................................................................... 173
Figure 49: Map of transport cases Kolkata-Barh ..................................................................... 182
Figure 50: Rail connection Kakinda to Bhagalpur..................................................................... 184
Figure 51: Average degression of IWT unit costs per ton-km according to effective draft
(Europe) 187
Figure 52: Location of Rajmahal Coal Mines ............................................................................ 189
IWT Sector Development Strategy and Business Development Study for Capacity Augmentation of National Waterway 1 from Haldia to Allahabad 3
Figure 53: Average external costs by transport mode (in € per 1,000 tkm) ............................ 191
Figure 54: Methodology of the forecast model ....................................................................... 195
Figure 55: India’s construction spendings ............................................................................... 204
Figure 56: Cargo volumes projected 2020-2045 – by scenario (tons) ................................................. 205
Figure 57: Cargo volumes by original transport mode before deviation (million tons) ...................... 206
Figure 58: Cargo flows upstream vs downstream 2020-2045 (million tons) ...................................... 207
Figure 59: Cargo volumes by type projected 2015-2045 (million tons) ............................................. 208
Figure 60: Cargo volume projection by commodity group 2015-2045 (million tons) ........................ 209
Figure 61: Cargo volume projection by individual commodity 2015-2045 (tons) .............................. 211
Figure 62: Haldia MMT loaded versus unloaded cargo 2020-2045 (million tons) .............................. 213
Figure 63: Haldia MMT - 2020-2045 cargo forecast by cargo type (million tons) ............................... 214
Figure 64: Haldia MMT - 2020-2045 cargo forecast by commodity group (million tons) ................... 216
Figure 65: Kolkata GRT loaded vs unloaded cargo 2020-2045 (million tons) ..................................... 217
Figure 66: Kolkata GRT - 2020-2045 cargo forecast by cargo type (million tons) ................................ 218
Figure 67: Kolkata GRT - 2020-2045 cargo forecast by commodity group (million tons) .................... 219
Figure 68: Sahibganj MMT loaded versus unloaded cargo 2020-2045 (million tons) ......................... 220
Figure 69: Sahibganj MMT - 2020-2045 cargo forecast by cargo type (million tons) .......................... 221
Figure 70: Patna Terminal loaded versus unloaded cargo 2020-2045 (million tons) .......................... 222
Figure 71: Patna Terminal - 2020-2045 cargo forecast by cargo type (million tons) ........................... 223
Figure 72: Patna Terminal - 2020-2045 cargo forecast by commodity group (million tons) ............... 224
Figure 73: Ramnagar MMT loaded versus unloaded cargo 2020-2045 (million tons) ........................ 225
Figure 74: Ramnagar MMT - 2020-2045 cargo forecast by cargo type (million tons) ......................... 226
Figure 75: Ramnagar MMT - 2020-2045 cargo forecast by commodity group (million tons) ............. 228
Figure 76: Preferred location for potential multi-modal terminal at Ghazipur, U.P. ........................... 229
Figure 77: Possible location for a multi-modal terminal in Ghazipur, U.P. .......................................... 229
Figure 78: Location of one or more interviews with producing units in the Allahabad-Munger sector
(red dots) ............................................................................................................................................. 231
Figure 79: GhazipurMMT loaded versus unloaded cargo 2020-2045 (million tons) ........................... 235
IWT Sector Development Strategy and Business Development Study for Capacity Augmentation of National Waterway 1 from Haldia to Allahabad 4
Figure 80: Ghazipur MMT - 2020-2045 cargo forecast by cargo type (million tons) ........................... 235
Figure 81: Regional location of Kalughat Multi-modal Terminal ......................................................... 236
Figure 82: Possible location for an alternative multi-modal terminal at Kalughat .............................. 237
Figure 83: Kalughat Terminal loaded versus unloaded cargo 2020-2045 (million tons) ..................... 237
Figure 84: Kalughat Terminal - 2020-2045 cargo forecast by cargo type (million tons) ...................... 238
Figure 85: Possible location for a transhipment terminal in Tribeni, W.B. .......................................... 239
Figure 86: Comparison of cargo capacity of different modes of transport .............................. 243
Figure 87: Energy efficiency of different modes of transport .................................................. 244
Figure 88: Comparison of distances transported for one ton of freight given the same energy
input 245
Figure 89: Comparison of emissions per ton-mile ................................................................... 245
Figure 90: Comparison analysis between road, rail and IWT emissions .................................. 246
IWT Sector Development Strategy and Business Development Study for Capacity Augmentation of National Waterway 1 from Haldia to Allahabad 5
List of Tables Page
Table 1: State-wise road network indicators .......................................................................... 34
Table2: State-wise rail density (area and population) ...................................................................... 35
Table3: State-wise length of rivers, canals and lakes, and infrastructure endowment ......... 36
Table 4: State-wise food grain storages, cold storages, warehouses and container depots .. 36
Table 5: Focus of funding of different EU incentive and promotion programs..................... 57
Table 6: Summary of incentive measures for IWT in Hunan Province .................................... 69
Table 7: Traffic-generating regions and the nearest location ................................................. 78
Table 8: Size of existing terminals ........................................................................................... 79
Table 9: Nearest road and rail locations to NW-1 .................................................................. 80
Table 10: Number of food-grain storages, warehouses and container depots (as of 31 March
2012) 81
Table 11: Coverage of food-grain storages, warehouses and container depots (by area and
population) 81
Table 12: Facilities (terminals, cold storages) identified in the Haldia-Farakka sector ............. 81
Table 13: Facilities (terminals, cold storages) identified in the Farakka-Munger sector .......... 82
Table 14: Facilities (terminals, cold storages) identified in the Ballia-Allahabad sector ........... 83
Table 15: Exporting special economic zones in West Bengal and Uttar Pradesh (examples) .. 86
Table 16: Traffic projection on EDFC (MMT/year) .................................................................................. 90
Table 17: Feasible cargo OD-pair via Kolaghat – Fly ash ........................................................... 93
Table 18: Year-wise consumption, production and imports of fertilizers (billion tons) ............ 94
Table 19: Variable costs of rail services .................................................................................. 105
Table 20: Choice of freight rates (valid since April 2015) in Rs per km ................................... 111
Table 21: Railway costs for movement of cargo by cost elements (in Rs per ton-km) ............ 112
Table 22: Railway costs in average per commodity for movement of cargo (in Rs Per ton-km)
112
Table 23: Road freight rates per region and cargo group (in Rs per ton-km) ......................... 114
Table 24: Road costs for movement of cargo (Rs per ton-km) ............................................... 114
Table 25: IWT costs for movement of cargo (Rs per net ton-km) ........................................... 115
IWT Sector Development Strategy and Business Development Study for Capacity Augmentation of National Waterway 1 from Haldia to Allahabad 6
Table 26: IWT costs for movement of cargo – cost verification (Rs per net ton-km) ............. 115
Table 27: Commodities by origin and destination in Haldia and Sagar Island (tons) ............. 118
Table 28: Commodities by origin and destination in the Kolkata-Farakka region (tons) ........ 120
Table 29: Destinations served from Sahibganj railway station - Stone chips and aggregate .. 124
Table 30: Origin of commodities unloaded at Sahibganj railway station ............................................ 125
Table 31: Feasible cargo OD-pair via Sahibganj - Stone chips and aggregates ....................... 125
Table 32: Destinations served from Sakrigali railway station - Stone chips and aggregates .. 126
Table 33: Destinations served from Mirzachowk railway station - Stone chips and aggregates
129
Table 34: Destinations served from Rajmahal railway station - Silica sand ............................ 130
Table 35: Destinations served from Pirpainti railway station – Coal ...................................... 131
Table 36: Destinations served from Bakudi railway station - Stone chips and aggregate ...... 132
Table 37: Destinations served from Barharwa railway station - Stone chips and aggregate .. 132
Table 38: Destinations served from Pakur railway station - Stone chips and aggregate ........ 133
Table 39: Destinations served from Pakur railway station – Coal ........................................... 133
Table 40: Origin of cement unloaded at Bhagalpur Railway Station ...................................... 134
Table 41: Origin of rice unloaded at Bhagalpur Railway Station............................................. 135
Table 42: Origin of wheat unloaded at Bhagalpur Railway Station ........................................ 136
Table 43: Origin of fertilizer unloaded at Bhagalpur Railway Station ..................................... 137
Table 44: Feasible cargo OD-pair via Bhagalpur - Fertilizer .................................................... 137
Table 45: Destinations served from Kahalgaon Thermal Power Station railway siding .......... 138
Table 46: Coal provided to Kahalgaon Thermal Power Station railway siding ........................ 138
Table 47: Fertilizer provided to Katihar Railway Station ......................................................... 138
Table 48: Commodities by origin and destination in Farakka-Munger sector (tons).............. 139
Table 49: Commodities by origin and destination in Munger-Ballia sector (tons) ................. 141
Table 50: Commodities by origin and destination in Ballia-Allahabad sector (tons) ............... 144
Table 51: Total road length of NW-1 riparian states versus national (km/’000 km2) .............. 146
Table 52: Total road length of NW-1 riparian states versus national (% km/’000 heads) ....... 146
IWT Sector Development Strategy and Business Development Study for Capacity Augmentation of National Waterway 1 from Haldia to Allahabad 7
Table 53: Important commodities divertible onto NW-1 as identified through the Consultants’
market survey 149
Table 54: Comparison of investment cost by mode in India (Rs) ........................................... 157
Table 55: Modal comparative operating costs in India .......................................................... 157
Table 56: Comparison of freight costs by mode and commodity in NW-1 area (Rs) ............. 158
Table 57: SWOT-analysis IWT ................................................................................................. 161
Table 58: SWOT-analysis Rail .................................................................................................. 162
Table 59: SWOT-analysis Road ............................................................................................... 163
Table 60: Identified IWT limitations and remedial measures for NW-1 ................................. 164
Table 61: Important commodities via NW-1 - multi-modal transport parametersand associated costs
............................................................................................................................................................. 168
Table 62: Potential and constraints of commodities transported on NW-1 ........................... 176
Table 63: Potential and constraints of commodities transported on NW-1 ........................... 177
Table 64: Potential and constraints of commodities transported on NW-1 ........................... 178
Table 65: Comparison of freight tariff levels of road, rail and IWT along NW-1 (Rs/ton-km) 181
Table 66: Costs and earnings per trip for road transport of coal/cement between Kolkata and
Barh 182
Table 67: Costs and earnings per trip for rail transport of coal/cement between Kolkata and
Barh 183
Table 68: Costs and earnings per trip for IWT transport of coal/cement between Kolkata and
Barh 183
Table 69: Costs and earnings per trip for IWT transport of fertilizer between Kakinada and
Bhagalpur 183
Table 70: Costs and earnings per trip for IWT transport of coal/cement between Kolkata and
Barh 184
Table 71: Comparison of transport modes concerning transport of 3,000 tons of cargo
between Kolkata and Barh .................................................................................................................. 185
Table 72: Unit cost comparison of transport modes (Rs per ton-km) .................................... 186
Table 73: Comparison freight tariffs and costs on Haldia-Farakka sector (Case I: 16 tons per
truck) 188
Table 74: Comparison freight tariffs and costs on Haldia-Farakka sector (Case II: 24 tons per
truck) 188
IWT Sector Development Strategy and Business Development Study for Capacity Augmentation of National Waterway 1 from Haldia to Allahabad 8
Table 75: Comparison of transport cost of different supply chain between Rajmahal and
Varanasi 190
Table 76: Average external costs by mode (in € per 1,000 tkm)............................................. 191
Table 77: State-wise installed generating capacity of electricity ............................................ 193
Table 78: Freight elasticities with respect to GDP .................................................................. 193
Table 79: Growth expectations of commodity volumes ......................................................... 194
Table 80: Transport model scenariosModel Scenarios ........................................................... 196
Table 81: Criteria for modal shift ............................................................................................ 199
Table 82: Parameter Assumptions .......................................................................................... 199
Table 83: Earliest consideration of NW-1 term-inals for forecast calculation (per time block) ........... 201
Table 84: Forecast growth rates – Weighting of specific and general market expectations by
year 202
Table 85: Real GDP and population forecast India (annual %-change) ................................... 202
Table 86: General market growth factors for traffic forecast (2015-2045) ............................ 203
Table 87: Cargo volumes projected 2020-2045 – by scenario (tons) ................................................. 205
Table 88: Cargo flows by original transport mode before deviation (MAC, million tons) ................... 206
Table 89: Cargo flows upstream vs downstream – development 2020-2045 (MAC, million tons) ..... 207
Table 90: Cargo volumes by type projected 2015-2045 (MAC, million tons) ..................................... 208
Table 91: Cargo volume forecast 2015-2045 by commodity group (MAC, million tons) .................... 209
Table 92: Cargo volume forecast 2015-2045 by individual commodity (MAC, tons) ......................... 210
Table 93: Important commodities via NW-1 & respective growth rates ........................................... 212
Table 94: Haldia MMT - 2020-2045 forecast by loaded versus unloaded cargo (MAC, million tons) 213
Table 95: Haldia MMT - 2020-2045 cargo forecast by cargo type (MAC, million tons) ...................... 214
Table 96: Haldia MMT - 2020-2045 cargo forecast by commodity groups (MAC, million tons) ......... 215
Table 97: Kolkata GRT - 2020-2045 forecast by loaded versus unloaded cargo (MAC, million tons) . 217
Table 98: Kolkata GRT - 2020-2045 cargo forecast by cargo type (MAC, million tons) ....................... 218
Table 99: Kolkata GRT - 2020-2045 cargo forecast by commodity groups (MAC, million tons) ......... 218
Table 100: Sahibganj MMT - 2020-2045 forecast by loaded versus unloaded cargo (MAC, million tons)
............................................................................................................................................................. 220
IWT Sector Development Strategy and Business Development Study for Capacity Augmentation of National Waterway 1 from Haldia to Allahabad 9
Table 101: Sahibganj MMT - 2020-2045 cargo forecast by commodity groups (MAC, million tons) . 221
Table 102: Patna - 2020-2045 forecast by loaded versus unloaded cargo (MAC, million tons) ......... 222
Table 103: Patna Terminal - 2020-2045 cargo forecast by cargo type (MAC, million tons) ................ 223
Table 104: Patna Terminal - 2020-2045 cargo forecast by commodity groups (MAC, million tons) .. 223
Table 105: Ramnagar MMT - 2020-2045 forecast by loaded versus unloaded cargo (MAC, million
tons) ..................................................................................................................................................... 225
Table 106: Ramnagar MMT - 2020-2045 cargo forecast by cargo type (MAC, million tons) .............. 226
Table 107: Ramnagar MMT - 2020-2045 cargo forecast by commodity groups (MAC, million tons) 228
Table 108: Detail of Trucks/Cargo at Ghazipur Route (number of trucks per 24-hour day) ................ 233
Table 109: Ghazipur Terminal - 2020-2045 forecast by loaded versus unloaded cargo (MAC, million
tons) ..................................................................................................................................................... 234
Table 110: Ghazipur Terminal - 2020-2045 cargo forecast by cargo type (MAC, million tons) .......... 235
Table 111: Kalughat Terminal cargo forecast, 2020-2045 (MAC, tons) ............................................... 238
Table 112: Tribeni transshipped cargo volume forecast, 2020-2045 (MAC, tons) .............................. 239
IWT Sector Development Strategy and Business Development Study for Capacity Augmentation of National Waterway 1 from Haldia to Allahabad 10
List of Abbreviations BSSDC Bihar State Sugar Development Corporation CFS Container Freight Station CO2 Carbon Dioxide € Euro AdCOM Advisory Committee CNY Chinese Yuan crore 10,000,000 DG Director General dwt dead weight ton e.g. example given EA Executive Agency ECL Eastern Coalfields Ltd EIA Environmental Impact Assessment EU European Union ExBoard Executive Board GDP Gross Domestic Product Grt gross registered ton GRT Garden Reach Terminal IFFCO Indian Farmers Fertilizer Corporation INEA Innovation and Networks Executive Agency IR Indian Railways IWAI Inland Waterway Authority of India IWT Inland Waterway Transport KhSTPP Kahalgaon Super Thermal Power Station Km Kilometer LAD least available depth lakh 100,000 Lbs Pound LNG Liquefied Natural Gas LR Low Rate M&R Maintenance and Repair MCOM Management Committee MMT million metric tons MMT Multi-modal Terminal MoS Motorways of the Sea MRO Maintenance-Repair-Overhaul MW megawatt NH National Highway NOX Nitrogen Oxide NTDPC National Transport Development Policy Committee ntkm net ton-kilometer NTPC National Thermal Power Corporation NW National Waterway ODC Over-Dimensional Cargo PM Particulate Matter PMO Prime Minister’s Office PRC People's Republic of China R&D Research & Development RIS River Information Services ro-ro roll-on/roll-off Rs Indian Rupee RSV River-Sea Vessel SCM Supply-Chain Management SCR Selective Catalytic Reduction SH State Highway SME Small or Medium Enterprise SOX Sulfur oxides SEZ Special Economic Zone TEN-T Trans-European Network for Transport TEU Twenty-foot Equivalent Unit (container of 20 feet length) TS Technical Secretariat U.P. Uttar Pradesh USA United States of America VAT Value-Added Tax VTMS Vessel Traffic Management System W.B. West Bengal
IWT Sector Development Strategy and Business Development Study for Capacity Augmentation of National Waterway 1 from Haldia to Allahabad 11
1 Management Summary
Waterway & Infrastructure
The Ganga-Bhagirathi-Hooghly river system from Haldia to Allahabad declared as National Waterway-
1 (NW-1) in 1986 is of national significance passing through four states of Uttar Pradesh, Bihar,
Jharkhand, and West Bengal. The waterway is potentially serving the major cities of Haldia, Howrah,
Kolkata, Tribeni, Katwa, Behrampur, Farakka, Rajmahal, Sahibganj, Bhagalpur, Patna, Ballia, Buxer,
Ghazipur, Varanasi and Allahabad, their industrial hinterlands, and several industries located along the
Ganga basin. Moreover the National Highway -2 (NH-2), the erstwhile Grant Trunk Sher Shah Suri
Marg from Amritsar to Kolkata runs parallel to the waterway from Allahabad onwards and then crosses
the waterway at Varanasi. Additionally the waterway runs nearly East West from Allahabad to Farakka
horizontally dividing the states of UP and Bihar and North south from Farakka to Haldia.
The waterway is planned to be developed with 45m width from Haldia to Varanasi. The Least Available
Depth (LAD) is being developed stretch wise Haldia to Tribeni 4m, Tribeni to Barh 3m, Barh to
Ghazipur 2.5m and Ghazipur to Varanasi 2.2m. Based on the market study Multimodal Terminals are
being constructed at Varanasi, Ghazipur, Kalughat, Sahebganj, Tribeni and Haldia. Ten number Ro-Ro
terminals have also been proposed.
Market Survey Methodology
The river system serves richly endowed natural reserve areas as well as a large number of industrial
units comprising thermal power plants, iron & steel plant, sugar mills, cement industry, small scale
industries etc. The market data has been collected using primary survey by conducting road-side
interviews and producer interviews covering 100km on either side of the waterway. The data has been
cross verified using the secondary data sourced from users, ports, railway sidings and relevant websites.
For conducting survey and analysing the data the consultants divided waterway in four sectors namely
Haldia - Farakka, Farakka - Mungher, Mungher- Ballia, Ballia - Allahabad.
IWT Sector Development Strategy and Business Development Study for Capacity Augmentation of National Waterway 1 from Haldia to Allahabad 12
Market Assessment
National Waterway 1, Ganges-Bhagirthi–Hooghly river system passes through the states of Uttar
Pradesh, Bihar, Jharkhand and West Bengal, a distance of about 1,620 km, serving nearly 42 traffic
regions, between Allahabad and Haldia (Sagar). Major ports such as Haldia and Kolkata and important
cities like Kolkata, Patna, Varanasi and Allahabad fall under its primary hinterland. The river system
serves richly endowed natural reserve areas as well as a large number of industrial units comprising
thermal power plants, iron & steel plant, sugar mills, cement industry, small scale industries etc.
In order to undertake survey and analyse the cargo that has a potential to pass through the region and to
be handled at the future multi-modal terminals has been broken down into the following seven
commodity groups (containing the major commodities):
1. Thermal coal (imported high-calorie coal, domestic low-calorie coal), coking coal and pet coke;
2. Construction materials (stone chips, cement, sand, steel coils/wires/girders);
3. Agricultural Inputs (fertilizer (urea), poultry feed, agro equipment);
4. Foodstuff (sugar, wheat, corn, rice, flour, vegetable oil, other foodstuff);
5. Industrial inputs (steel/iron, manganese ore, spirits, fly ash, limestone, plastics, paper);
6. Consumer goods (motor bikes, cars, general container loads); and
7. Project cargo (ODC Over-Dimensional Cargo, heavy lifts, spare parts, etc).
Commodity Share
During the survey it has been found that the Construction materials and Thermal Coal are the two major
commodities that are being moved along and in the vicinity of NW-1 and has great potential to shift on
the waterway for transportation. The freight share of the two commodities in 2045 is expected to be
30.81% for coal and 35.72% for naatural aggregates. The other commodities that has substantial share
are Industrial inputs and Agricultural inputs.
Thermal Coal
The forecasted growth of transportation of coal by IWT is likely to be initially at 8.76% till 2020 on the
coal demand by existing and upcoming thermal power plants, due to the policy to use more domestic
coal and reduce import of coal, the share of domestic call in transportation of coal will increase 8.76%
in 2020 to 30.81% in 2045. However the coking coal shall continue to be imported for steel plants etc.
Coal has two sources i.e. imported and from domestic mines, the imported coal comes from Indonesia,
South Africa to Sandheads/Paradeep and is then transported by rail and road to thermal plants. Eleven
existing thermal power plants on either side of the river between Haldia and Allahabad and ten more
upcoming power projects have boosted the prospect of the NW-1 like never before for transporting
imported coal to power stations. With the use of fly ash in the manufacturing of cement and in the
construction of roads, the NW-1 could be utilized for evacuation of fly ash from power plants on its
banks. With 11 more power plants scheduled to be commissioned within the next five to eight years the
demand for coal transportation will further increase. However with the change in policy of the
government to reduce use of imported coal in Thermal Plants the demand shall reduce over time till the
production of domestic coal is sufficient to meet the demand.
Construction Materials
Over nine and half million metric tonnes [9.97MMT] of the construction material forming about 45%
of the freight is likely to be moved on the National Waterway-1. The government is focussing on the
development of Eastern India and more so with regards to infrastructure development in terms of road
network etc.. Moreover with the focus on economic growth of the rural India the construction of houses
etc. along the agrarian belt on both sides of waterway will further push up the demand of construction
material. It is expected that the demand on IWT freight on account of construction material is likely to
increase from 45% to 50%.
IWT Sector Development Strategy and Business Development Study for Capacity Augmentation of National Waterway 1 from Haldia to Allahabad 13
Stone Chips
Stone chips is one of the major commodity in construction material group, it is presently being moved
from Sahebganj to Patna upstream on the waterway and to Nepal, Purnia away from the waterway. From
Pakur the stone chips is being transported to meet the demands upto Sagar downstream on the waterway.
Presently about 1million Metric Tonnes of Stone chips is being moved ex Sahebganj the numbers shall
increase with construction of Ganga Path at Patna, Construction of new bridges across the Ganges,
development of port at Sagar and GDP growth of rural India along the Ganges-Bhagirathi river basin.
Cement
Cement is another commodity component of construction material. Cement has been moving along the
waterway for last five years though in very small quantity. With Cement plants and grinding units of
Jaypee Cement at Chunar and Ambuja Cement at Farakka and Sankrail on the National Waterway-1 and
Grinding Units, plants of Shree Cement at Aurangabad, ACC cement at Tekaria in UP, Kalyanpur
Cement Plant in Rohtas and upcoming cement dumps of Ultratech and ACC cement the likelihood of
transportation of cement on National Waterway-1 is to increase at rate of about 5.5% till 2025. Though
the demand of cement movement along the waterway has been about 300MT in the past months.
Industrial inputs
The major industries in the hinterland of NW-1 are cement manufacturing plants. The main industrial
inputs being fly ash, gypsum, limestone in the manufacturing of cement. With eleven existing thermal
power plants on either side of the river between Haldia and Allahabad and ten more upcoming power
projects sufficient fly ash will be available for cement plants and NW-1 is ideal for evacuation of fly ash
from power plants to the cement manufacturing units.
Agricultural inputs and Food products
The river basin of the Ganges is fertile and is extensively used for agriculture, resulting in significant
transport demand. Fertilizer is required for the crops in the area, hence a number of fertilizer distribution
centres are situated on the NW-1. The fertilizer plants are located in Phulpur about 50km from
Allahabad, Haldia and Paradip. Hence there is substantial potential for transporting fertilizers from
plants located near Allahabad and Haldia to various locations in Uttar Pradesh, Bihar and West Bengal.
The agro-products like Food Grain, Flour and Sugar though in small parcel size are moved on regular
basis from the Allahabad – Farraka belt to Kolkata and is potential for shifting to IWT on smaller vessels
or aggregation would be required at the terminals.
Consumer Goods and Containers
With an AAGR of about 13%, container traffic growth is expected to be relatively high during the initial
years, driven by the general economic development as well as increasing containerization. The latter
effect is likely to be significant in particular after opening of multimodal terminals along NW-1, which
will facilitate the multi-modal transport in the corridor. It should be noted, however, that the mentioned
effects will decrease over time. As a consequence, the Consultants calculated the AAGR to decline to
3% by the year 2045 based on decreasing elasticities. The distance from Inland Container Depots at
Delhi NCR to Nhava Sheva and Kolkata is same but more than 60% of containers move through Nhava
Sheva even if the export is towards Far East. Most of the import cargo originating from Far East is also
imported through Nhava Sheva in spite of distance to Delhi from Singapore through Kolkata being
1500Km less than the distance to Delhi via Mumbai. Hence if container handling facilities and
turnaround time improve at Kolkata/Haldia the growth of containerisation is bound to accelerate.
IWT Sector Development Strategy and Business Development Study for Capacity Augmentation of National Waterway 1 from Haldia to Allahabad 14
Transport Forecast model
The data collected has been analysed for potential model shift using a transport forecast model that
analyses traffic between over 500 Origin Destination pairs. The potential model shift to waterway has
been selected by comparison of modal costs of transportation of commodities between the different
modes including cost of first mile connectivity and last mile connectivity @1.5 times the normal costs
for road transport, handling costs applied at Kolkata and inventory costs. The mathematical model is
dependent on seven [7] Commodity Type, twenty six [26] Origin - Destination pairs, Least Available
Depth [LAD] for different stretches, Vessel Size according to LAD and commodity growth potential
based on population growth, industrial and economic growth of the region and country. The
mathematical model calculates the market forecast for years up to 2045.
The Consultant’s integrated Transport Forecast Model adapted to the Indian context calculated future
freight flows on the basis of origin-destination pairs (O/D-pairs) collected during their market survey
from late July until early November 2015. As a result of the market survey and calculations through an
adapted transport forecast model, the Consultants established cargo potential volumes on the NW 1 by
three different scenarios:
1. Low augmentation: 9.21 MMT for the year 2020 and about 13.68 MMT for the year 2045;
2. Medium augmentation: 21.89 MMT for the year 2020 and about 65.45 MMT for the year 2045;
3. Full augmentation: 21.89 MMT for the year 2020 and about 128.77 MMT for the year 2025.
Infrastructure Cases
Low Augmentation Case (Base Case): No changes or improvements on infrastructure and IWT
policy/promotion: LAD of 3 m until Farakka; LAD of 2,50 m until Patna, LAD of 1,50-2,00 m until
Varanasi; LAD of 1,00-2,00 m until Allahabad but Construction of Multi-modal Terminals at Haldia,
0.00
10.00
20.00
30.00
40.00
50.00
60.00
70.00
2020 2025 2035 2045
Fore
cast
in M
illio
n T
on
ne
s
Forecast Year
Cargo Volume Projection by Commodity Group 2020-2045 (In Million Tonnes)
Coal Construction Material Minerals & Chemicals Fertilizer
Gas & Petroleum Project Cargo Consumer Goods Food & Food Stuff
Container Vehicles
IWT Sector Development Strategy and Business Development Study for Capacity Augmentation of National Waterway 1 from Haldia to Allahabad 15
Kolkata, Sahibganj, Patna and Varanasi is assumed and Regular growth rates in the IWT based on
macroeconomic growth rates and regional economic development
Medium Augmentation Case: 3 m water depth until Barh; 2.50 m until Ghazipur and 2.2 m LAD until
Varanasi with Supporting IWT policy from the national and state government and implementation of
IWT promotion concept to market the quality and services of IWT. Availability of financial incentive
for the promotion of IWT along with development of terminals and Ro-Ro facilities.
Full Augmentation Case: Major changes and improvement on the NW1 river infrastructure (dredging,
weirs, and locks): LAD until Patna of 3.00 m; LAD until Varanasi 2.50 m with Supporting IWT policy
from the national and state government and implementation of IWT promotion concept to market the
quality and services of IWT. Availability of financial incentive for the promotion of IWT The full
augmentation case is based on a larger least available depth (LAD) of the waterway upstream of Patna.
The cost of dredging to attain and maintain depth of 2.5m up to Varanasi is exorbitantly high and same
did not seem to be economically viable. Also the low augmentation (base) assumes an improvement of
the river navigation and the existence of new multi modal terminals on the NW 1, but does not consider
any of the intended additional supporting promotion and incentives policy of the government, hence the
study provides data and analyses for medium augmentation case.
Transportation Costs
The model has assumed 300working days, commodity based rates for road, rail and waterway transport
with speeds of 20km for road and rail and 7km for water transport taking in account all delays and
average night halts. The Consultants developed rates by considering provision of rates that cover the
generated costs per ton-kilometer on the one side, and seem to be competitive to the rates of the other
transport modes on the other side. Often times a price advantage of NW-1 shipments is levelled out by
additional costs, as inland-waterway transport cannot offer door-to-door services where producers
and/or users are not located directly on the waterway. Instead, pre- and onward carriage is usually
required to cover for the ‘last mile’ with cost implications arising from additional cargo handling.
Normally Coal and iron ore are supposed to be trucked by road only on short distances, mainly from the
mines to the rail sidings. Feeder routes would then carry the coal or iron ore from the rail sidings to the
trunk routes. The trunk routes would carry the minerals long distances, usually between distant states.
Close to the destination, feeder routes would finally move the materials from the trunk route to the rail
siding at the power or steel plant.
However, the Consultants’ market survey established that large volumes are being trucked on Indian
roads over large distances. Opportunities will therefore open up when intermodal services are available
at the planned multi-modal terminals (MMTs). For some companies a MMT would provide immense
advantages for their commodities on the NW-1, as origins and destinations of their cargoes lay exactly
on the NW-1 route. Roll-on/roll-off facilities for heavy lift and ODC cargo should be provided which
will surely offer a lot of opportunities to meet the requirement for shipping such commodities along the
NW-1 and NW-2. Perspectives for utilization of the NW-1 are thus very good, once the waterway has
been dredged to a sufficient depth.
IWT Promotion and Incentives
A comparative overview of European Union (EU) incentive and development programs to initiate
inland-waterway transport indicates the wide range of instruments, which was deemed to be necessary
for a mature EU transport industry, infrastructure and market driven forces deciding on which transport
mode will be chosen to serve the market. Another comparative overview of the Chinese incentive and
development programs to initiate and support inland-waterway transport indicates the wide range of
instruments, which was deemed to be necessary for a mature transport industry and infrastructure. It
also indicates the engagement of the national ministries when it comes to rules and regulations. The
IWT Sector Development Strategy and Business Development Study for Capacity Augmentation of National Waterway 1 from Haldia to Allahabad 16
Indian IWT transport market is currently in a less mature stage. Obviously, the question on the quality
of infrastructure needs to be primarily solved prior to discussing similar instruments which are applied
in highly developed IWT markets and infrastructures. Availability of barges is major concern in IWT
sector in India Chinese example of supporting the barging trade given below is a good case for India to
follow.
Freight Market Projections
The freight market projection for Medium Augmentation Case of infrastructure development
with LAD stated above, channel width of 45m, construction of 6 MMT and 10 Ro-Ro jetty pairs
is shown below:
IWT Sector Development Strategy and Business Development Study for Capacity Augmentation of National Waterway 1 from Haldia to Allahabad 17
Commodity 2020 2025 2035 2045
Coal 1.92 8.12 13.39 20.98
Construction
Material 9.97 17.97 29.71 31.43
Minerals &
Chemicals 1.61 2.26 2.35 2.4
Food & Food
Stuff 2.26 2.38 2.46 2.48
Others 6.12 6.59 7.72 8.16
Total 21.88 37.32 55.63 65.45
The Consultants have divided the National Waterway – 1 in following sectors:
Sector 1 : Haldia/Kolkata-Farakka-Haldia/Kolkata
Sector 2 : Farakka-Sahibganj-Farakka
Sector 3 : Sahibganj-Patna-Sahibganj
Sector 4 : Patna-Varanasi-Patna
Sector 5 : Varanasi-Allahabad-Varanasi
0
10
20
30
40
50
60
70
2020 2025 2035 2045
Cargo Projection :2020-2045(In million Tonnes)
coal Construction Material Minerals & Chemicals Food & Food Stuff Others
IWT Sector Development Strategy and Business Development Study for Capacity Augmentation of National Waterway 1 from Haldia to Allahabad 18
The sector wise cargo projections for the medium augmentation case is shown below:
Exit Sector 3 4
Entry Sector 2020 2025 2035 2045 2020 2025 2035 2045
1 1.47 8.80 12.16 12.49 3.98 5.87 5.93 6.25
2 0.00 0.40 0.50 0.51 0.00 0.99 1.34 1.36
3 5.12 8.17 10.73 12.08 2.33 2.55 2.94 3.00
4 0.10 0.10 0.11 0.11 1.59 1.70 1.77 1.80
5 0.00 0.00 0.10 0.10 0.00 0.00 1.32 1.35
Exit Sector 3 4 5
Entry Sector 2020 2025 2035 2045 2020 2025 2035 2045 2020 2025 2035 2045
1 1.47 8.80 12.16 12.49 3.98 5.87 5.93 6.25 0.02 0.02 0.08 0.08
2 0.00 0.40 0.50 0.51 0.00 0.99 1.34 1.36 0.00 0.00 0.00 0.00
3 5.12 8.17 10.73 12.08 2.33 2.55 2.94 3.00 0.00 0.00 0.00 0.00
4 0.10 0.10 0.11 0.11 1.59 1.70 1.77 1.80 0.00 0.00 0.02 0.02
5 0.00 0.00 0.10 0.10 0.00 0.00 1.32 1.35 0.00 0.00 0.00 0.00
The important commodities divertible from other nodes to IWT sector is outlined in the table
below:
IWT Sector Development Strategy and Business Development Study for Capacity Augmentation of National Waterway 1 from Haldia to Allahabad 19
Infrastructure Constraints for Current Use and Further Development of NW 1
The major constraints for the current use and further development of National Waterway No. 1
can be summarized as follows:
The target depths (Least Available Depth – LAD) proclaimed by IWAI for the maintenance
of NW-1 (year 2014/15: 1.5 m – 3.0 m) could not be reached during recent years, at least
during the last weeks of the lean season that ends mid of June, due to a lack of dredging and
bandalling capacity. Thus, these target depths are not reliable for the shipping community
throughout the year. Especially on the upper stretch of NW 1, upstream of Patna (km 955 –
km 1,620), the minimum water depth of the fairway has been in the range between 0.8 m
and 1.5 m during recent years, making the transport of goods with vessels with a minimum
draft of 2.0-2.5 m uneconomic or even impossible.
The fairway width on NW 1 of 45 m and the existence of bends with a critical radius of less
than 600 m on some stretches of the waterway hinder the economic use of 2,000 – 2,500
dwt cargo vessels or pusher/barge convoys.
Farakka lock with one chamber only, processing times of 40 minutes to half a day and no
processing during night and weekends makes shipping through this lock uneconomic.
HOWE / HR Wallingford identified at least 89 potential navigationally significant
obstructions that might hinder navigation on NW 1, such as bridges with insufficient
clearance heights and/or widths, power transmission lines crossing the waterway, etc.
IWAI maintains 20 floating terminals and several RCC jetties along NW 1 for handling of
cargo vessels, tourist vessels and other IWT vessels. The length of the floating terminals of
35 – 70 m limits berthing of vessels. Most of the terminals have no areas for storage of
goods or open storage areas, which makes protected storage of goods impossible. Only
Patna and Sahibganj terminals are equipped with handling equipment, which means that
unloading/loading of cargo vessels on all other terminals has to be done with ship’s gear or
manually.
The River Information System (RIS), which improves safety of navigation and makes the
use of navigation marks and of pilots more and more obsolete, has yet not been realized
upstream of Farakka. The application of RIS on board of vessels navigating on NW 1 is
voluntary (except for ODC vessels) and costs for purchase of equipment and software
obviously hinder that all cargo and passenger vessels are equipped with this system.
Night navigation aids are provided solely on the stretch between Tribeni and Jangipur (Km
193- KM 505) and shall be extended up to Varanasi, thus 24 hours safe navigation is actually
possible only on 1/3 of the waterway.
The greater part of the vessels and barges operating on NW 1 have a fully laden draft of 3
– 4 m, which means that at least upstream of Farakka lock they cannot be operated with the
maximum cargo load of 2,500 tons. Pushed convoys that would allow the same maximum
cargo load with a draft of 2.0 – 2.5 m are today not used for cargo transport on NW 1.
Vessels and Push Tug Barge Flotilla is required to be designed to carry maximum cargo
safely and efficiently in different stretches of National Waterway-1. The stretch between
Haldia to Tribeni, Tribeni to Farakka, Farakka to Barh, Barh to Ghaziabad and Ghaziabad
to Varanasi and Varanasi to Allahabad are different in characteristics with regards to LAD,
Vertical Clearance, Bend Radius, width and Currents.
The engineering interventions for augmenting capacity is being independently studied by
Howe Consortium.
IWT Sector Development Strategy and Business Development Study for Capacity Augmentation of National Waterway 1 from Haldia to Allahabad 20
Socio Economic Advantages of Modal Shift to IWT
Without doubt the modal shift towards Inland Water Transport brings down logistic and fuel
consumption costs and also bears social cost benefits from decongesting roads and minimizing
road accidents. According to the Planning Commission’s Total Transport System Study by
RITES, cost for air pollution by SO x or particles vary considerable between Road (Rs. 0.202
per ton-km); rail (Rs 0.0366 per ton -km) and IW Shipping (Rs. 0.03 per ton-km). Accident cost
are counted as Rs. 0.062 per ton-km for road transport and Rs 0.001 per ton-km for rail
transport, whereas such cost are negligible for IWT.
2 Macro-Economic Growth and Policies
Inland Waterway Transport (IWT) hinges on the specific transport demand of a region to be
served. Transport is a function of the amount of goods and products as well as of its sources
and destinations. The more vibrant a region in its the production and consumption of goods
and products is the more transport services are offered, preferable meeting the market
demands in terms of transport quality. The cargo structure, volumes and the transport network
defines the utilization on IWT.
The first sub-chapter provides a first overview about the regions and cities which are located
in the four states along the Ganges River. It shall prepare a first introduction into the question
of a future market for the IWT on the NW-1.
Apart from market-driven factors, the integration, consideration and attention received of the
IWT mode by the governmental policy plays a significant role when it comes to its development
and success. It is universally recognized that transport of goods and passengers is crucial for
sustained economic growth and modernization. Adequacy of this vital infrastructure is an
important determinant of the success of a nation’s effort in diversifying its production base,
expanding trade and linking together resources and markets into an integrated economy. It is
also necessary for connecting villages with towns, market centers and in bringing together
Unit Forecast 2020 Forecast 2025 Forecast 2035 Forecast 2045
Total Traffic (MAC) Ton-Km 73765,77,955 125793,42,377 182988,21,109 216056,20,214
Reduction in Air Pollution Rs. 9966,91,642 16996,66,903 25329,27,699 29803,88,117
Reduction in Accident Cost Rs. 3706,78,059 6321,20,509 9420,17,253 11084,31,571
Reduction in Noise Rs. 201,13,302 342,99,388 511,14,644 601,44,424
Reduction in CO2 Emmissions Rs. 2402,79,044 4097,49,939 6106,29,629 7185,01,870
IWT Operating Cost Savings Rs. 17721,84,158 30221,21,018 45037,14,242 52993,28,683
Value of Time versus Rail Rs. 12,50,232 21,32,031 31,77,258 37,38,544
Total Benefits Rs. 34011,96,436 58000,89,788 86435,80,725 101705,33,208
Socio-Economic Environment Benefits generated by IWT [Year]
Sagar Island, Central & Northern India + Nepal (NW-1)
Source : HPTI, 2016
IWT Sector Development Strategy and Business Development Study for Capacity Augmentation of National Waterway 1 from Haldia to Allahabad 21
remote and developing regions closer to one another. Transport, therefore, forms a key input
for production processes and adequate provision of transport infrastructure and services helps
in increasing productivity and lowering production costs.
The next subchapters shall describe what government macro-economic policies and subsidies
on IWT currently exist in India.
Although IWT is one of the oldest modes of transport in historical terms, its relevance was
diminishing to the same extent as to the relevance of railway and truck transportation has
increased throughout the previous century. This development has taken place in many other
economies and countries all over the world. Since a number of decades, the importance of this
environmental friendly mode of transport has been put on the agenda by national, European
and international political bodies. Because of the well-known system relevant characteristics
of this mode, other economies have developed a set of policies and instruments to promote
the development of IWT.
Examples shall be given from IWT incentive and development programs in Europe as well as in
China. This comprehensive description provides an overview on possible instruments and
measures and shall prepare the ground for best practice approaches with examples given on
national and European governmental policies and subsidies which are applied in other
economies in the “Strategy for Development IWT Sector” Part C to be delivered at a later stage.
2.1 Background economic growth
2.1.1 Uttar Pradesh
Uttar Pradesh (U.P.) is located in the northern region India, spread over 240,928 km2. The
state shares its borders with Nepal and states like Bihar and Jharkhand. The state also borders
the capital of India New Delhi along with the newly formed state of Uttarakhand (carved out
of the state of Uttar Pradesh in the year 2000 and covers now about 7% of India's total area).
It has been one of the oldest states in the country and boasts of some of the biggest tourist
destinations in the country. The GDP growth at constant prices leveled around 6% in the last
years. The capital of U.P. is Lucknow.
IWT Sector Development Strategy and Business Development Study for Capacity Augmentation of National Waterway 1 from Haldia to Allahabad 22
Figure 1: Map of Uttar Pradesh
Source: Maps of India
Uttar Pradesh has been one of the most highly populated states in India for a long time now.
According to the Census 2011 the state has a population of almost 200 million and with
20% (census 2011 compared to census 2001) one of the highest population growth rates in the
country. The population density is therefore over 800 people per km2 which is way above the
national average of about 380. The sex ratio in 2011 is almost on a par with the national
average and stands at about 900 women at 1,000 men1.
The state has some of the most important educational institutions. The literacy rate in the
state has gone up in recent years and reached a level of nearly 70% (2011) which is below the
national average of 74%. It stands out that there is still a gap between men (77.3% literate)
and women (57.2% literate).
Of the total population of Uttar Pradesh state, around 77.7% live in the villages of rural areas
(22.3% in urban regions). In actual numbers total population of rural areas of Uttar Pradesh
1 See for the whole Chapter 1: http://www.census2011.co.in (accessed 22 Oct 15)
IWT Sector Development Strategy and Business Development Study for Capacity Augmentation of National Waterway 1 from Haldia to Allahabad 23
state was 155,317,278. Average literacy rate in U.P. for rural areas was 65.5% whereas in urban
regions 74.2% of the people can read and write.
A large part of the revenue of the state comes from the agriculture and the services sector.
The chief crops are rice, wheat, and sugarcane. Since the late 1960s, with the introduction of
high-yielding varieties of seed for wheat and rice, greater availability of fertilizers and
increased use of irrigation, the state has become a major producer of food grains in the
country. Many of its farmers however, still suffer from two major constraints: small
landholdings and insufficient resources to invest in the technology required for improved
production.
In terms of manufacturing, textiles and sugar refining are both long-standing industries in Uttar
Pradesh which employ an important percentage of the state’s total factory labor. Other resource-
based industries in Uttar Pradesh produce vegetable oil, jute, and cement. The Indian government
has established a number of large factories that manufacture heavy equipment, machinery, steel,
aircraft, telephone and electronics equipment and fertilizers. The national government has
funded an oil refinery at Mathura. Handicrafts constitute a significant portion of exports. Carpets
from Bhadohi and Mirzapur, for example, are prized worldwide. Among other local specialties are
the silks and brocades of Varanasi, ornamental brass ware from Moradabad, chikan embroidery
from Lucknow, ebony work from Nagina, glassware from Firozabad, and carved woodwork from
Saharanpur. 2
The minerals found in Uttar Pradesh include limestone, glass sand and coal in considerable
quantities. There also are small reserves of gypsum, magnesite, phosphorite, and bauxite.3
Transportation: A vast network of roads, including a number of national highways, and railways
connects the state’s cities and towns. For example the Yamuna Expressway, the rapid transit
corridor between Delhi and Agra. It reduces the travel time between the capital and Agra by
nearly four hours. The 165 km long Yamuna expressway is one of the longest access-controlled
six-lane paved roads in India. It can be extended to 8 lanes in the future and would provide direct
access to the forthcoming Yamuna Economic Zone and the international airport and aviation hub
at Jewar, which are slated to be constructed along the Yamuna Expressway. Agra is already well
connected to Kolkata, Mumbai, and Jaipur etc. by a network of national highways. This, along with
the expressway, will provide high level connectivity to all these destinations from Delhi,
especially when the proposed ring road around Agra town comes into being.4
The Agra Lucknow Expressway is an under construction 302 km controlled-access 6-lane
expressway (expandable to 8 lanes). It is expected to be constructed until the end of 2016. The
aim is to reduce traffic in already congested roads and highways. It would also ensure the
development of adjoining areas as several townships are planned along the expressway. It
would cut travel time between Agra and Lucknow almost in half. This expressway will be
connected to Yamuna Expressway through the under-construction Agra Ring Road.5 In addition
2 For further information, see http://www.ibef.org/download/Uttar-Pradesh-August-2015.pdf (accessed 27 Jan 16) 3 See for the whole Chapter 1.1: http://www.britannica.com/place/Uttar-Pradesh 4 See http://articles.economictimes.indiatimes.com/2012-04-07/news/31304852_1_yamuna-expressway-noida-greater-
noida-expressway-jewar 5 See https://en.wikipedia.org/wiki/Agra_Lucknow_Expressway
IWT Sector Development Strategy and Business Development Study for Capacity Augmentation of National Waterway 1 from Haldia to Allahabad 24
to that a new 382 km six-lane expressway highway between Lucknow and Ballia is talked
about.6
Concerning rail transport, the Eastern Dedicated Freight Corridor Project was established to
provide additional capacity, improve service quality and higher freight throughput on the 343
km Khurja-Kanpur section of the Eastern rail corridor.7
Besides the Ganges River, the inland waterways Yamuna and Ghaghara also play a substantial
part in the state’s transportation system. As in 2007/2008, inland waterways with a total length
of 425 km were navigable (18.1% of the total length of U.P.’s rivers, canals and lakes).8
In 2007/2008 a total volume of more than 127 MMT of inter-regional freight traffic originated
in U.P. (8.3% of the national total), with about 16 MMT having the state as a terminus. Of the
total volume, a share of 40.9% was transported by rail, while 59.1% was apportioned to road
traffic.9
2.1.2 Bihar
Located in the eastern region of India, Bihar is spread over 94,163 km². In November 2000 the
state of Jharkhand was created from Bihar’s southern provinces and thereby decreased Bihar’s
size remarkably. Bihar is naturally divided by the Ganges River into two regions: North Bihar
and South Bihar. It shares boarders with Nepal and the states Jharkhand, Uttar Pradesh and
West Bengal (W.B.). The GDP growth at constant prices over the last ten years was very volatile
and results in an average of 9.5%. The city Patna is Bihar’s capital.
6 See http://timesofindia.indiatimes.com/city/lucknow/Plan-for-expressway-from-Lucknow-to-Ballia-6-lane-highway-to-
pass-Azamgarh-reach-Bihar-border/articleshow/46137244.cms 7 See http://www.worldbank.org/projects/P114338/eastern-dedicated-freight-corridor?lang=en 8 See Government of India, Statistics of Inland Water Transport 2013-14 (accessed 27 Jan 16) 9 See http://planningcommission.nic.in/reports/genrep/trans/Chapter_3.pdf (accessed 27 Jan 16)
IWT Sector Development Strategy and Business Development Study for Capacity Augmentation of National Waterway 1 from Haldia to Allahabad 25
Figure 2: Map of Bihar
Source: Maps of India
As per details from Census 2011, Bihar has a population of 104.1 million, an increase from a
little over 25% compared to the 2001 Census. In relation with the states size the population
density is 1,106 people per km² and is with that the highest in the country. The sex ratio
amounts 918 (census 2011) which is represented by 54.3 million male and 49.8 million female
citizens. The population of Bihar forms 8.6 percent of India in 2011, but it belongs also to the
poorest states of India.
Literacy rate in Bihar has seen an upward trend and has reached 61.8% (2011 census). Of that
male literacy stands at 71.2% while only every second woman can read and write. In 2001 total
literacy rate in Bihar only stood at 47.0% which is about one third less than in 2011. But
compared to the country average Bihar still lags behind in literacy.
Like in other states major parts of the population live in rural areas (88.7%). Only little above
10% is living in urban regions where the literacy rate is noticeably higher than in rural areas.
Agriculture is the backbone of Bihar's economy. The percentage of population employed in
agriculture production system in Bihar is estimated at 81%, which is much higher than the
national average. Those 81% generate nearly 42% of the State Domestic Product. The principal
agricultural crops are rice, paddy, wheat, jute, maize and oil seeds. Cauliflower, cabbage,
tomato, radish, carrot, beat, sugarcane, potato and barley are also grown in the state.10
Manufacturing: Bihar has been slow to develop industry. Among the agriculturally based
industries are sugar refining, tobacco processing, silk production, and jute milling. Traditional
cottage industries are popular in Bihar. In particular they include sericulture (raising of
10 See http://krishi.bih.nic.in/
IWT Sector Development Strategy and Business Development Study for Capacity Augmentation of National Waterway 1 from Haldia to Allahabad 26
silkworms and raw silk production), lac (resin used to produce shellac) and glasswork,
handloom products, brassware, and pottery.
Bihar’s mineral wealth was virtually depleted in 2000 when the mineral-rich Chota Nagpur
plateau became part of Jharkhand. But there are still little resources left like bauxite, dolomite,
glass sand, cement mortar, and other minerals like Mica and Salt.
Transportation: Several national highways pass through the state, including the Grand Trunk
Road, which is one of India’s oldest roadways. However, large parts of the highways are in bad
shape. To counter this problem, the state government has set out an agenda to improve road
infrastructure in Bihar over the next one year in which the Road Construction department
(RCD) will undertake repair of 1,855 km roads and 124 bridges.11 If it comes through, the
expressway between Lucknow and Ballia would touch Ballia on the U.P.-Bihar border.
The rail line between Kolkata (Calcutta) and Delhi, which crosses Bihar, opened in 1864.
Because of the dense population the railways carry a heavy load of traffic. But there are new
rail way projects in sight. The Indian Railway projects in Bihar, including the sick Bharat Wagon
Engineering Limited (BWEL), are rolling on the right track and a couple of them have already
started operating according to a Railway Board member.12 The implementation of the long-
stalled Madhepura electric loco plant and the Marhaura diesel loco plant has been accelerated
with the projects been chosen for execution using foreign direct investment (FDI).13
The total length of Bihar’s rivers, canals and lakes amounts to 2,229 km. In 2013/2014, 62.4%
of these waterways (1,391 km) were navigable and a total cargo volume of about 2,400 tons
was carried.14
In 2007/2008, a total volume of 40 MMT of inter-regional freight traffic originated in Bihar
(1.7% of the national total), with 5.8 MMT tons having the state as a terminus. Of the total
volume, a share of 27.7% was transported by rail while 72.3% was apportioned to road traffic.15
2.1.3 Jharkhand
Jharkhand is a land locked state also located in the eastern region of India. Its total area adds
up to 79,716 km². Among other, the state shares boarders with Bihar, Uttar Pradesh and West
Bengal. The state’s east peak connects to the Ganges River and on Jharkhand’s west corner the
border aligns with the Son River which is the second largest of the Ganges' southern tributaries
after the Yamuna River. Jharkhand’s GDP growth at constant prices has seen its ups and downs
over the last decade. It reached from -3.2% in 2005/06 to 20.5% in 2007/08. The average
growth amounts to almost 7% (6.98%). The capital of Jharkhand is Ranchi.
11 See http://articles.economictimes.indiatimes.com/2014-10-17/news/55148431_1_rcd-bridges-gandhi-setu 12 See http://economictimes.indiatimes.com/industry/transportation/railways/railway-projects-in-bihar-rolling-on-
track/articleshow/47605480.cms 13 See http://economictimes.indiatimes.com/industry/transportation/railways/rail-projects-in-bihar-put-on-fast-track-with-assembly-elections-around-the-corner/articleshow/47593507.cms 14 See Government of India, Statistics of Inland Water Transport 2013-14 15 See http://planningcommission.nic.in/reports/genrep/trans/Chapter_3.pdf (accessed 27 Jan 16)
IWT Sector Development Strategy and Business Development Study for Capacity Augmentation of National Waterway 1 from Haldia to Allahabad 27
Figure 3: Map of Jharkhand
Source: Maps of India
As per details from Census 2011, Jharkhand had a population of 33 million. Compared to 2001,
the total population growth in this decade was 22.4%. The population density of Jharkhand
amounts to 414 per km² which is still above nation average (382). The sex ratio in 2011 was
948 women per 1,000 men.
Literacy climbed up 24% in the last decade to a level of 66.4% (population Census 2011) and
had already surpassed 50% in 2001. As seen in Bihar and Uttar Pradesh male literacy stands at
76.8% higher than female literacy with only 55.4%.
Of the total population of Jharkhand more than two thirds (75.9%) live in rural areas where
the literacy rate for women is still below 50% (46.6%, males 72.9%). Average literacy rate in
Jharkhand for rural areas was 61.1% and female sex ratio per 1,000 males was 961. In urban
regions the literacy rate is higher (82.3% men, 67.8% women), but the sex ratio is by fifty
women lower.
The agriculture sector is of great significance for Bihar. The state’s agricultural-development
programs have especially emphasized the raising of livestock for meat, dairy products, and
wool. Major crops cultivated in the state are maize, rice and wheat.16
16 See http://www.icar.org.in/files/state-specific/chapter/62.htm (accessed 22 Oct 15)
IWT Sector Development Strategy and Business Development Study for Capacity Augmentation of National Waterway 1 from Haldia to Allahabad 28
The majority of the manufacturing workforce of Jharkhand works in the traditional cottage
industry. They engage in sericulture, lac and glasswork, handloom products, brassware, stone
carvings, cane and bamboo products, various woodworks, and pottery. Most of the remaining
workforce is employed in metal- and agriculture-based industries. Among the principal
agricultural industries are sugar refining, tobacco processing, and jute milling.17
Minerals: The Chota Nagpur plateau is the richest mineral belt in India, and it is responsible for
a significant share (by value) of the country’s mineral yield. Jharkhand produces almost the
entire national output of copper, kyanite, pyrite, and phosphate, as well as much of the output
of bauxite, mica, kaolin and other clays, and iron ore. Most of these minerals are mined in the
districts of East and West Singhbhum. Coal, however, accounts for the bulk of Jharkhand’s
mineral production. The principal coalfields, all in the Damodar River valley in eastern
Jharkhand, supply most of the coking coal of India. The State of Jharkhand had the maximum
share (26.8%) in the overall reserves of coal in the country as on 31 March 2014 followed by
the State of Odisha (24.9%).18
Transportation: A number of national highways pass through the state, including the Grand
Trunk Road (one of the oldest roads in India). Although the road network has expanded over
the last years, not even half of the villages can be reached by roads which can withstand the
rain. For further improvement the state cabinet engaged a leading finance company as
transaction manager for an expressway linking Ranchi, Jamshedpur and Dhanbad.
Infrastructure Development Finance Company (IDFC) has been made the transaction manager
to construct an expressway that aims to link Dhanbad with Ranchi and Jamshedpur (Golden
Triangle) in public-private-partnership (PPP) mode.19 Another project concerning Physical
Infrastructure and especially Transportation is the Hazaribagh Ranchi Expressway Limited. This
project includes the development of four lanes with an aggregate length of approximately 319
lane-km connecting Hazaribagh to Ranchi in the State of Jharkhand.20
The Kolkata-Delhi rail line, which opened in 1864, crosses Jharkhand. Extensive goods handling
facilities are located along the rails at Ranchi, Bokaro, Dhanbad, and Jamshedpur. In addition,
ore-loading facilities are available at Lohardaga, in west-central Jharkhand, and at all the coal
mines.21 All in all are in Jharkhand 980.32 route km including loops and slings.22
In 2007/2008, a total volume of 134.4 MMT tons of inter-regional freight traffic originated in
Jharkhand (5.6% of the national total), with 75.4 MMT tons having the state as a terminus. Of
the total volume, a share of 81.7% was transported by rail while 18.3% was apportioned to
road traffic.23
17 For further information, see http://www.ibef.org/download/Jharkhand-August-2015.pdf (accessed 27 Jan 16) 18 See http://mospi.nic.in/Mospi_New/upload/Energy_stats_2015_26mar15.pdf?status=1&menu_id=243 (accessed 22 Oct
15) 19 See http://www.telegraphindia.com/1150520/jsp/jharkhand/story_20929.jsp#.VfZjuUaAC71 (accessed 22 Oct 15) 20 See http://www.ilfsindia.com/projects.aspx?prid=9&catid=1&slnk=156&cid=5 21 See http://www.britannica.com/place/Jharkhand 22 See http://www.ser.indianrailways.gov.in/uploads/files/1427374984205-Part%20data%20SER.pdf 23 See http://planningcommission.nic.in/reports/genrep/trans/Chapter_3.pdf (accessed 27 Jan 16).
IWT Sector Development Strategy and Business Development Study for Capacity Augmentation of National Waterway 1 from Haldia to Allahabad 29
2.1.4 West Bengal
West Bengal (W.B.) is a state in eastern India and spreads over 88,750 km². The state borders
with Bangladesh on the east side, Bhutan on the north side, the states Bihar and Jharkhand in
the West and connects to the Indian Ocean on its south End. The Ganges flows through the
middle of the state and passes the cities Rajshahi and Farakka. The capital GDP growth at
constant prices in W.B. averaged 6.6% in the last 10 years. The state’s capital is Kolkata.
IWT Sector Development Strategy and Business Development Study for Capacity Augmentation of National Waterway 1 from Haldia to Allahabad 30
Figure 4: Map of West Bengal
Source: Maps of India
According to the West Bengal Census 2011, it is the fourth most populated state in India. The
total population counts 91.3 million, which is almost 14% more than what was counted in 2011.
The population density of W.B. is 1,028 per km² and therefore exceeded the one thousand
IWT Sector Development Strategy and Business Development Study for Capacity Augmentation of National Waterway 1 from Haldia to Allahabad 31
mark like Bihar did. The total population consists of 46.9 million men and 44.4 million women,
which is reflected in a sex ratio of 918.
The state is home to a number of renowned educational Institutions and higher learning
Centers. There are 18 universities in the state along with sizeable research institutes.24 Total
literacy rate in West Bengal is 77.1%.
Out of total population of West Bengal, 31.9% people live in urban regions, which is more than
in the other three discussed states. Sex Ratio in urban regions of West Bengal was 944 females
per 1,000 males. Average literacy rate was 84.8% (88.4% male literacy 76.0% female as of 2011
Census). Around 68% live in villages of rural areas. The literacy rate for males and female stood
at 78.4% and 62.0%. Average literacy rate in rural areas was 72.1% and the sex ratio slightly
more balanced (953).
Agriculture is the mainstay of the state’s economy and accounts for the largest share of labor
force. W.B. is, with over 15 tons, the largest rice producer in India. Besides rice, potatoes are
the principle crops of West Bengal, followed by Jute, Sugarcane, Wheat and Maize. The state
supplies nearly 100% of the potato requirement and 66% of the jute requirements of India.
Tea is another important cash crop and especially Darjeeling is famous for tea plantation.
Manufacturing: State industries are mostly localized in the Kolkata region and the mineralrich
western highlands as well as Haldia port region. There are up to 10,000 registered factories in
the state. Kolkata is noted as one of the major center for industries including the jute industry.
There are numerous steel plants in the state. The center has established a number of industries
in the areas of tea, sugar, chemicals and fertilizers. Natural resources like tea and jute has
made West Bengal a major center for the jute and tea industries.25
Among the minerals which can be found in West Bengal are coal, cement, iron, lignite,
limestone and fireclay.26
Transportation: West Bengal offers excellent connectivity to the rest of India in terms of
railways, roadways, ports and airports. As of 2011, West Bengal has a total road length of
92,023 km, with a road density of 1.04 km per km². Of this, national highways constitute 2,578
km and state highways 2,393 km. The Golden Quadrilateral (GQ) project undertaken by the
National Highway Authority of India (NHAI) passes through major districts in North part of
West Bengal. As of July 2011, four-laning of Dhankuni-Kolaghat (54.4 km) KologhatKharagpur
(60.5 km) and Kharagpur-Laxmanath (65.8 km) sections had been completed. A number of road
development projects have been taken up under public private partnerships, for example the
Kolkata-Durgapur expressway, Palsit-Dankuni road project and PanagarghPalsit road project.
The railway route length in the state is around 4,481 km. The state has namely three railway
stations: Howrah, Sealdah and Calcutta for accessing the city of Kolkata and New Jalpaiguri.
24 See for the whole Chapter 1.4: http://www.ibef.org/download/West_Bengal_271211.pdf 25 See http://www.wbidc.com/about_wb/industrial_infrastructure.htm 26 See http://www.mapsofindia.com/maps/westbengal/westbengalminerals.htm
IWT Sector Development Strategy and Business Development Study for Capacity Augmentation of National Waterway 1 from Haldia to Allahabad 32
Once Kolkata is reached, all tourist destinations in West Bengal are very well connected from
there.27
The total length of West Bengal’s waterways (rivers, canals and lakes) amounts to 4,741 km of
which 96.9% (4,593 km) were navigable in 2013/2014. During this time span, a cargo volume
of about 11.5 MMT was carried by IWT.28
In 2007/2008, a total volume of 83.2 MMT tons of inter-regional freight traffic originated in
W.B. (3.5% of the national total), with 126.2 MMT having the state as a terminus. Of the total
volume, a share of 63.6% was transported by rail while 31.7% was apportioned to road traffic.29
2.1.5 Madhya Pradesh
Though not directly located alongside the NW-1, the state of Madhya Pradesh (M.P.) can
nevertheless be considered as potential hinterland of the inland waterway corridor. With a
size of around 308,000 km² (about 9.4% of India’s total area), M.P. is India’s second largest
state and occupies a geographically central position in the country. The landlocked state shares
borders with U.P., Rajasthan, Gujarat, Maharashtra and Chhattisgarh. The state capital is the
city of Bhopal. Though quite volatile in the past, in recent years M.P. showed a yearover -year
GDP growth at constant prices in the region of 10%.30
According to the 2011 census, M.P. has a population of 72.6 million which constitutes an
increase of just over 20% compared to the 2001 census. The population density ranges in the
region of 236 people per km2 which is below the national average. The sex ratio stands at 931
women/1,000 men.
The literacy rate in M.P. accounts to 69.3% (2011 census) which is slightly below the national
average. Furthermore the state is characterized by a rather large gender gap in the educational
level: while the statewide literacy rate for men is at 78.7%, the corresponding value for women
accounts to just 59.2%.
With just 27.6% of its population living in urban areas, M.P.’s level of urbanization is below the
national average of 31.2%. In line with expectations, the literacy rate is higher among people
living in urban areas than among those living in rural areas.31
As a vast majority of 72.4% of M.P.’s population lives in rural areas, the agricultural sector is
central to the state’s economy. M.P. is the largest producer of pulses, oil seeds and soybean
in India and a major growing area for garlic and coriander. Various crops such as wheat, rice,
maize, cotton and mustard are cultivated. M.P.’s total food grain production in 2013/2014
accounted to around 27.6 MMT.
27 See http://www.westbengaltourism.gov.in/web/guest/rail 28 See Government of India, Statistics of Inland Water Transport 2013-14 29 See http://planningcommission.nic.in/reports/genrep/trans/Chapter_3.pdf (accessed 22 Oct 15) 30 See http://planningcommission.nic.in/data/datatable/data_2312/DatabookDec2014%2059.pdf (accessed 22 Oct 15) 31 See http://www.dataforall.org/dashboard/censusinfoindia_pca/ (accessed 27 Jan 16)
IWT Sector Development Strategy and Business Development Study for Capacity Augmentation of National Waterway 1 from Haldia to Allahabad 33
Figure 5: Map of Madhya Pradesh
Source: Maps of India
Regarding its industrial structure, Madhya Pradesh has attracted an increasing number of high-
tech industries, including companies from the electronics, pharmaceutical, automobile and
information technology sectors. The city of Indore is one of M.P.’s commercial centers and
home to a special economic zone. Also within the same region, a large number of automobile
industries have located themselves at the city of Pithampur. M.P. is also well known for
traditional manufacturing of handicrafts and handloom cloths. The cities of Chanderi and
Maheshawar are centers for these industries.
M.P. has one of the largest reserves of minerals in India. Among the variety of different
minerals produced are dolomite, diamond, limestone, bauxite, copper and coal.
Transportation: Due to its central location, M.P. is well connected to India’s major cities,
consumer markets and the west coast ports. 19 national highways with a total length of 5,185
km stretch throughout the state. These are complemented by 10,859 km of state highways
and 19,574 km of major district roads. Public-Private-Partnerships are used as a mean in the
development of the road network. As of March 2015, the state had a total of 185 PPP projects
in the road sector.
Due to its central location, M.P. has a fairly well-developed railway network. The state capital
Bhopal is home to one of the country’s main railway junctions and railway lines with a total
length of around 4,954 km are passing through the state. In particular, the railway network is
IWT Sector Development Strategy and Business Development Study for Capacity Augmentation of National Waterway 1 from Haldia to Allahabad 34
of great importance to the states mineral and agro-based businesses as it helps these
industries by transporting bauxite, dolomite and limestone as well as fertilizer and de-oiled
cake.32
In 2007/2008 a total volume of 147.5 MMT of inter-regional freight traffic originated in M.P.
(6.2% of the national total), with 127.7 MMT having the state as a terminus. Of the total
volume, a share of 34.7% was transported by rail while 65.3% was apportioned to road traffic.33
2.1.6 Summary
As stated in the previous chapters, in all four states along the NW-1 agriculture plays an
important role. Huge amounts of crops have to be distributed throughout the whole country
either to serve the domestic demand or have to be moved to harbors for the purpose of export.
An easy way of transportation would be to use an inland waterway craft to ship the crops as
dry bulk goods to their destination. The upper part of the Ganges River is dividing an
agricultural region (north) from a manufacturing one (south). Across the river, not only crops
have to be transported southwards, but also fertilizer which is needed to grow the crops has
to be brought northwards. This is a good way to use inland waterway crafts on the NW-1 and,
as there do not exist sufficient bridges across the river, ro-ro crossings would be required at
highly frequented places.
Road Network
The road transport infrastructure in India has expanded manifold during more than six decades
after independence, both in terms of spread (total road length and road density) and capacity
(number of registered vehicles on road and the volume of passenger and freight traffic
handled). Indian road network consists of National Highways, Expressways, state highways,
major district roads, village roads etc.
Table 1: State-wise road network indicators
States Total Road
Length (km) Surfaced Road (%)
Road Density (per 1000
km2)
Road Density (per 1000
population)
Registered motor vehicles
(per '000 heads)
Uttar Pradesh 403,102 7.26 1,673.12 1.97 31.44 Bihar 138,517 47.18 1,471.03 1.40 98.98 Jharkhand 26,277 71.68 329.64 0.82 75.62 West Bengal 315,404 41.82 3,553.77 3.49 42.75 Madhya Pradesh 201,261 63.57 652.93 2.74 71.33
Total India 3,965,394 63.41 1,206.29 3.28 132.02
Source: Infrastructure Statistics -2014 (Third Issue, Vol. I), Central Statistics Office, New Delhi, p.40
Whereas national highways and state highways are well maintained, with more than 90% being
surfaced; urban and rural roads are not in good condition. Only 48% of rural roads are surfaced.
Comparison of rural and urban road density indicates significant increase in urban road
network whereas that in rural area has remained almost same during last five years. Rural
areas are lagging behind in accessibility to roads whereas urban roads are more congested.
Important hubs for transportation – particularly between the heavily populated and
32 See http://www.ibef.org/download/Madhya-Pradesh-August-2015.pdf (accessed 27 Jan 16) 33 See http://planningcommission.nic.in/reports/genrep/trans/Chapter_3.pdf (accessed 27 Jan 16)
IWT Sector Development Strategy and Business Development Study for Capacity Augmentation of National Waterway 1 from Haldia to Allahabad 35
industrialized northwest and the rather agricultural and mineral-endowed southeast regions,
are Kanpur, Allahabad and Varanasi in Uttar Pradesh, Patna and Aurangabad in Bihar state,
Dhanbad and Ranchi in Jharkhand, and Purulia, Asansol and Durgapur in West Bengal. Of these
hubs, the cities of Allahabad, Varanasi and Patna are located on the NW-1 and thus provide
great opportunities for multi-modal cargo transportation.
Rail Network
Heavy industries are linked by rail transportation. However, the total route length of railway
network has increased only marginally during the last decade. In a recent development, rail
travel has shown significant improvement in quality in terms of positive growth in
electrification of track and gauge conversion from narrow gauge, meter gauge to broad gauge.
The below table indicates that, while the railway network has a density above the Indian
average for the three states Bihar, U.P. and W.B., it is comparatively low in Jharkhand.
Table2: State-wise rail density (area and population)
States Route
Kilometrage (numbers)
Rail Density (per 1000 km²)
Rail Density (per 1000 population)
Share of broad in total gauge (%)
Uttar Pradesh 344.91 1 0.00 84 Bihar 3,598.09 38 0.04 100 Jharkhand 2,040.04 26 0.06 82 West Bengal 4,000.38 45 0.04 94 Madhya Pradesh 4,954.32 16 0.07 86
Total India 64,600.47 20 0.05 87
Source: Infrastructure Statistics -2014 (Third Issue, Vol. I), Central Statistics Office, New Delhi, p.45
However, passenger fares have been increased only marginally, despite steep rises in fuel and
other costs. Freight rates have been increased frequently to subsidize passenger services. In
the past, railway development had lacked commercial orientation and little had been invested
for the growth of freight traffic, despite freight being the mainstay of earnings. As a result,
during the last decades the railways had steadily lost share in freight movement to road
transport. Its share has dropped to 30% from a peak of 89% over 60 years ago. Studies suggest
that the rail's share of freight transportation will fall to 25% by 2020.34
Inland-Waterway Network
With 4,741 km, West Bengal is endowed with the second longest waterway net of the entire
Indian country. The ratio of the navigable length to the total length of the river/canal best
reflects the potential for IWT. This ratio is about 97% in the State of West Bengal, and still more
than 62% in Bihar. Compared with navigable length of their waterways, infrastructure
endowment in these two states is relatively low. In contrast, in Uttar Pradesh the ratio of the
navigable length to the total length of its waterways is as low as 18%.
34 See http://www.platts.com/news-feature/2015/coal/india-coal-transport/railway-funding (accessed 11 Feb 16)
IWT Sector Development Strategy and Business Development Study for Capacity Augmentation of National Waterway 1 from Haldia to Allahabad 36
Table3: State-wise length of rivers, canals and lakes, and infrastructure endowment
States Total Length
(km) Navigable Length
(km) Berths
(numbers) Infrastructure
Endowment (km/berth)
Uttar Pradesh 6,444 425 - 3 floating 142 Bihar 3,763 1,391 1 fixed, 5 floating 232 Jharkhand 81 81 - 2 floating 41 West Bengal 4,741 4,593 3 fixed, 10 floating 353
Source: Statistics of Inland Water Transport 2013-14, Ministry of Road Transport & Highways, New Delhi, pp. 1-7
As a result, IWT in India takes a share of 3% of national cargo and passenger transport output,
whereas this share lies in China at 47%, in Japan at 41%, in Korea at 44% per cent and in
European countries at over 40%.
Logistics Network
There are three agencies in the public sector which are engaged in building large scale storage/
warehousing capacity- Food Corporation of India (FCI), Central Warehousing Corporation
(CWC) and 17 State Warehousing Corporations (SWCs). In addition to storage of food grains,
storage also includes industrial warehousing, custom-bounded warehouses, container freight
stations, inland clearance depots and air cargo complexes.
Table 4: State-wise food grain storages, cold storages, warehouses and container depots
States Food grain
Storages (in MT) Cold Storages (in number)
Warehouses (in number)
Container Depots (in number)
Uttar Pradesh 680,503 48 7 Bihar 87,675 16 Jharkhand 19,300 3 West Bengal 164,160 1 37 2 Madhya Pradesh 310,839 26
Total India 5,264,854 4 467 37
Source: Infrastructure Statistics -2014 (Third Issue, Vol. I), Central Statistics Office, New Delhi, p.45
Another commodity of dry bulk freight and of great importance besides agricultural goods is
mined ores. The states have rich mineral resources and extraction sites. Therefore inland
waterway crafts play an important way of transportation again.
Sensitivity Analysis of main Drivers
The population is growing constantly. As consequence thereof the domestic demand for food
and goods will rise. In addition to that there are more people who need transportation and will
be affluent enough to afford it. On the other hand, diesel prices will, in the medium term, rise
again thus giving motivation for cargo owners to shift transport onto affordable modes. The
plans to improve street and rail infrastructure have not all been finished and even if there are
better and more roads, there are more people and cars as well, which still leaves limited
capacities for commodity transportation. Cargo-carrying capacities on both road and rail have
reached or exceeded their limits. Before the year 2020, the Eastern Dedicated Freight Corridor
(EDFC) will not be completed to unplug this bottleneck (see Chapter2.2.4). Even then, the EDFC
will connect Kolkata, Varanasi and Allahabad with Delhi, but will pass in a large distance the
other cargo-generating centers in vicinity of the NW-1.
Therefore it is obvious that, to manage the amounts of goods and cargo, an inland-waterway
transportation system is very much needed. However, in the long term, operations on the NW-
IWT Sector Development Strategy and Business Development Study for Capacity Augmentation of National Waterway 1 from Haldia to Allahabad 37
1 face a challenge: One of the primary sources of fresh water supply to the Ganges River, the
30.2 km long Gangotri glacier, has been found to have retreated by more than 1.5 km in the
last 70 years. During the past decade, this process has accelerated: Since the year 2000, annual
snowfall decreased by 37 cm, while maximum and minimum temperatures increased by 0.90 C
and 0.050 C respectively.35 The GoI therefore needs to develop appropriate mitigation
measures against the NW-1 losing too much of its primary ingredient: water.
2.2 Indian Government IWT policies and subsidies
2.2.1 Background
The National Waterways Bill, 2015 was introduced in Lok Sabha on 05 May 2015 by the
Minister of Road Transport and Highways and Shipping.
The Bill identifies additional 101 waterways as national waterways. The Schedule of the Bill
also specifies the extent of development to be undertaken on each waterway.
The Statement of Objects and Reasons of the Bill states that while inland waterways are
recognized as a fuel efficient, cost effective and environment friendly mode of transport, it has
received lesser investment as compared to roads and railways. Since inland waterways are
lagging behind other modes of transport, the central government has evolved a policy for
integrated development of inland waterways.
Promotion of waterways is a priority for this government as it is a cheaper mode of
transportation as compared to roads and railways.
India is estimated to have nearly 14,500 km of navigable inland waterways, even though the
exploitation of sector has remained neglected as most waterways in the country require
constant dredging on account of heavy silting and draft is available only seasonally. Besides,
not many entrepreneurs are willing to invest in inland vessels, which have resulted in
underutilization of whatever infrastructure is created, thereby spelling trouble for the
development of the sector.
Other, technical constraints are hindering the development of IWT such as:
Diversion of water for irrigation, industrial and other needs reducing the flows in the rivers
resulting in the reduction of depth and shoal formation.
Excessive silt loads from erosion of uplands due to bad catchment management and
increased deforestation.
Inadequate river conservancy measures, resulting in gradual deterioration of waterways.
Non availability of adequate navigational aids resulting in unsafe passage and high travel
time.
Inadequate vertical and horizontal clearances for plying vessels of economic size in many
traditional waterway routes.
35 Snow and Avalanche Study Establishment, Defense Research and Development Organisation (DRDO), Chandigarh / India,
December 2015
IWT Sector Development Strategy and Business Development Study for Capacity Augmentation of National Waterway 1 from Haldia to Allahabad 38
Lack of adequate terminal facilities at the loading and unloading points being non-existent
and where existent.
The above constraints are well known by the appropriate ministries. The NDA government
has emphasized that developing the IWT sector is a priority. A Bill regarding the
development of the IWT sector has already been moved in Parliament. Conferences to
integrate the IWT stakeholders are taken place in Delhi, the most actual one is planned for
27 October 2015.
The Ministry says that they would ask the state governments to have a stake of 26 per cent
in development of the waterways in the new Bill that would be placed in Parliament the
Centre would bear the rest of the cost. The Bill was tabled in the Lok Shaba during the
Budget session and referred to the Parliamentary Standing Committee on Transport.
Slow progress has been a constant problem in this Sector. Even after two decades, the
waterway development remains incomplete. Targets in terms of fairway capacity, cargo,
vessels and IWT operations have only declined, one of the former members (Technical),
IWAI stated.
It is against this background that the government has now decided to launch projects for
setting up dry and satellite ports, besides converting river ways into waterways.
The development of IWT is seen as a prerequisite to remain globally competitive. In the
national plan for logistics and transport the modal split of water transport (IWW and coastal
shipping) is expected to increase from 13% in 2005 to 29% in 2025. The Working Group Report
on Shipping and Inland Transport for the Eighth Five-Year Plan 2007-2012 also states that the
2024-25 cargo volume in inland waterways is expected to be 0.10 MMT which roughly works
out to be 26.2% from the 2005 figure. Also, ET reports may be by Feb 2015 that it would grow
by 29%.
However, concordantly the benefits for an increase in inland waterway transport can be seen
in the improved land-use, more efficient usage of surface modes, greater energy efficiency
(through more efficient vessel utilization) and pollution prevention.
While the IWAI has been actively working on dredging, surveys, channel marking, river
conservancy works, construction of terminals and procurement of hardware like dredgers,
demonstration barges, survey launches since 1986, neither the number of cargo vessels nor
the quantum of cargo movement has shown any improvement, except some cases of coal and
fertilizer movement on the Haldia-Farakka stretch on the Ganges River as per the following
picture.
IWT Sector Development Strategy and Business Development Study for Capacity Augmentation of National Waterway 1 from Haldia to Allahabad 39
Figure 6: Progress in IWT development
on national waterways
Source: Indian Express, 19 August 2015
Delays / turnaround time and water depth is another big problem in Inland waterways.
Sustainable depth in terms of river morphology and environment should also be the basis for
classification to avoid conflicts and delays. The problem is that most of the waterways included
in the list of 101 new waterways are fresh water rivers, which even dry up completely during
post monsoon period. The diversion of water for navigation should not be at the cost of other
priority use such as drinking and irrigation. According to some, unless a very detailed study is
done on the balanced use of water, the 101 NW proposals is bound to face opposition from
many state governments.
Some of the important issues to be debated before the National Waterway Bill, 2015, include
the point whether the declaration of a national waterway is a legislative function of Parliament.
There are question marks over whether the state governments been taken into confidence on
the proposal. Experts point to the need for setting up of Statutory Autonomous Boards with
representatives of central and state governments and technical experts for each national
waterway.
Without some of these niggling issues being sorted out, the government’s new waterway
thrust could well end up with the same problems facing the handful of waterways operational
currently stranded amid heavy silt and sheer a lack of impetus.
With a view to providing an impetus for development for inland water transport mode, the
Government of India had approved an Inland Water Transport Policy which includes fiscal
concessions, and policy guidelines for rapid development of the mode and to encourage
IWT Sector Development Strategy and Business Development Study for Capacity Augmentation of National Waterway 1 from Haldia to Allahabad 40
private sector participation in development of infrastructure and ownership and operation of
inland vessels.
In order to reduce the capital burden on the IWT operators, and to enhance their profitability,
an inland vessel building subsidy scheme existed some years ago under which 30 per cent cost
of an inland vessel is subsidized by the Central Government. This is applicable to both cargo
and passenger inland vessels meant for operation in National Waterways, Sunderbans
waterways and Indo-Bangladesh Protocol Route. However, the scheme has ended 31st 2007.
Efforts are being made to extend this scheme for some more years.
For exploring possibility of joint ventures and BOT projects in IWT sector, interactions were
held with many interested firms and thereafter, some priority projects having potential of Joint
Venture projects were short-listed. For some of these projects, bids were invited by IWAI. This
initiative of IWAI has succeeds in attracting some private player to IWT sector and four
Memorandum of Understanding (MOU)'s have been signed between IWAI and respective
successful bidders for setting up and management of jetties at various locations.
2.2.2 Scheme for Incentivizing Modal Shift of Cargo (SIMSC)
Following the acknowledgement and national economic relevance of Inland Waterway
Transport, the Ministry of Transport has currently started one initiative on supporting the IWT
by a specific co-financing program.
In a bid to decongest the country’s road and railway networks and encourage coastal and
inland waterways transportation, the Ministry of Shipping is initiating a Scheme for
Incentivizing Modal Shift of Cargo (SIMSC) under which certain identified commodities,
containerized cargo and automobiles when moved through coastal shipping in various forms
will be monetarily incentivized. The commodities identified for incentivizing under the scheme
have high potential for transportation through coastal and inland waterways but are currently
reliant on other modes of transportation.
The Scheme for Incentivizing Modal Shift of Cargo, in addition to promoting coastal shipping
and inland waterway transportation as a viable alternative to road and railway transportation,
aims to minimize the environmental impacts as well as the social costs of congestion in road
and railway networks. It was planned to be initially implemented during the period 01 April
2015 to 31 March 2017 of the 12th Five-Year Plan. A provision of Rs 2.96 billion has been made
for implementation of the scheme during the plan period. The scheme will be reviewed at the
end of the plan period for continuation in the 13th Five-Year Plan.
The SIMSC could be availed by shippers who transport the identified categories of cargo
through coastal shipping or inland waterways or both using Indian flag vessels, river sea vessels
or barges. The coastal shipping or inland waterway routes through which the eligible cargo is
transported should involve at least one major port, designated non-major port or Inland
Waterways Authority of India terminal/jetty at the point of loading or discharge. The shipper
is the person who has ownership of the cargo and may be the consignor or the consignee. The
categories of cargo eligible for incentives under the scheme include bulk or break-bulk cargo
commodities such as fertilizers, food grains, marbles, tiles, sugar, edible salt and over-
dimensional cargo, any type of commodity carried in containers in full container load and
automobiles in the form of two wheelers, three wheelers and four wheelers (HMV & LMV). In
IWT Sector Development Strategy and Business Development Study for Capacity Augmentation of National Waterway 1 from Haldia to Allahabad 41
case of trucks or trawlers carrying automobiles, containers (any commodity) or identified bulk
or break-bulk cargo that are transported on Ro-Ro vessels, the incentives will be provided only
for the respective commodities.
The Ministry of Shipping in its guidelines for implementing the scheme has fixed the rate of
incentive for each of the identified categories of cargo. For transportation of bulk or breakbulk
cargo pertaining to the seven commodities, the shipper will be eligible to get incentive at the
rate of Rs 1 per ton per nautical mile up to a maximum of 1,500 nautical miles in each trip
starting from origin and ending at the destination. Transportation of any commodity in
containers in full container load will be eligible for an incentive at the rate of Rs 3,000 per TEU.
The transportation of any commodity through forty feet or other larger sized containers will
be incentivized based on number of times the said container size can be converted into TEUs.
In case of vehicles transported through Ro-Ro vessels, the rate of incentive has been fixed at
Rs 300 per two-wheeler, Rs 600 per three-wheeler and Rs 3,000 for other vehicles.
The SIMSC will be implemented using the Port Community System. The shippers eligible for
grant of incentives under the scheme have to register on PCS at the Indian Ports Association
website. The PCS is a single technology based platform that brings together all stakeholders
and shares information on cargo movement at ports. It is managed by IPA.
By 2020, the government hopes that the Jal Marg Vikas project will enable commercial
navigation of at least 1,500-tonne vessels to Allahabad round the year, as well as cruise tours
connecting religious places. At present, cruise ships operate between Kolkata and Varanasi for
about eight months in a year.
Meanwhile, the government is formulating a cabinet note for Rs 1,050 billion investment in
national waterways projects. Of this, Rs 250 billion will come from the government while Rs
800 billion is likely to be garnered from the private sector to accomplish the target of building
national waterways through public-private partnership.
2.2.3 Possible application of policies and subsidies
Deriving from the above discussion on current challenges of the IWT in India first set of ideas
have been collected and are discussed hereunder.
A review of the public sector investment in the transport sector since the First Five Year Plan
reveals that the average investment in the shipping sector per plan was only 5% as against
60%for railways and 50% for road sector. Even this meager investment was almost entirely
allocated to overseas shipping and ports sector. In the port sector also, very little investment
has been made by the maritime states on the development of minor ports and by the central
government for major ports on creating earmarked facilities for inland cargo.
Globally, countries are adopting freight modal shift programs by providing incentives as a
financial reward for switching the shipping method of choice from truck to rail or marine. The
ground for such an incentive is that this shift would generate social benefits that offset the
cost of the incentives provided. Countries like, Australia, UK, China, Brazil, Canada are resorting
to reducing their emission levels by rationalizing their transport systems. Most countries are
contemplating promotional mechanisms by way of grant assistance to viable modal shift from
road to rail or waterways.
IWT Sector Development Strategy and Business Development Study for Capacity Augmentation of National Waterway 1 from Haldia to Allahabad 42
2.3 Policies and subsidies to the favor of IWT in Europe
The policy instruments that are applied for promoting IWT differ between European Union
(EU)-level and the national and sub-national levels, because of different political competences.
A. EU-level policy instruments
The most important instruments on European Union-level in the last decade up to today have
been:
Co-funding of infrastructure projects through a Fund for the development of the Trans –
European Network for Transport (TEN-T). This fund is to encourage Member States to
invest in infrastructure (including port infrastructure) which is of international importance
to Europe. The fund, recently renamed into Connecting-Europe-Facility, cofinances up to
20% of the infrastructure works and up to 50% of studies in the preparation phase like
feasibility studies, design studies and environmental impact assessments. To some extent
it can also provide co-funding of infrastructure related facilities like Liquefied Natural Gas
(LNG)-bunkering facilities and port information systems. The remaining part of funding
usually is provided by the relevant lower level authorities and sometimes by private sector.
Co-funding of research and development studies. The studies are mainly of large scale and
with good representation of the relevant market players and other stakeholders. The study
topics closely follow the political agenda. Currently the for example address technological
innovations like for cleaner engines, cargo handling systems, improved portoperations,
optimizing information flows between operators and authorities, information and
communication systems for navigation, and supply chain optimization etcetera.
Co-funding of pilots or other implementation steps for transport quality and efficiency
improvements on similar topics as mentioned above, for example for pilots of
implementing port information systems or for developing a network of LNG-bunkering and
related training of port staff on security issues.
Co-funding of modal shift actions. The instrument Marco Polo II opened for IWT companies
in 2007. The instrument supports IWT-operators by taking a share of the risk in the start-
up phase of a new service. The EU-contribution is always below the operational losses in
the first 3 years of operation and required is a business plan that demonstrates viability of
the service at the latest after 3 years.
An instrument which is specific for IWT concerns the instrument of Scrapping Fund. This fund
is a heritage of national-level regulations of the IWT-sectors before their reform in the 1990s.
It is a mechanism for controlling the capacity of the fleet by arrangements of “scrapping
regulation” and “old for new regulation”. The former regulation is a levy to all active IWT-
operators for filling the fund, the latter requires that those adding capacity to the market (new
vessels) must either scrap vessel capacity or pay a levy for each added ton of capacity, which
then will be revenue to the Scrapping Fund. The levies for the scrapping regulation and the
factors that determine the scrapping requirement (and levies) in the old-for-new regulation
reflect the market situation and may differ between market segments. The fund can only be
used for barges which are part of the “active fleet”, meaning that the owner must provide
evidence of good technical condition and of a minimum number of voyages done in recent
years.
IWT Sector Development Strategy and Business Development Study for Capacity Augmentation of National Waterway 1 from Haldia to Allahabad 43
The role of the government in this regulation is to approve the levies and factors applied in the
instrument and proclaim the instrument active. That is to provide a legal basis to the
compulsory levying to all IWT-operators and the attribution of the Fund to scrapping. The
Government also will manage the fund and enforce implementation.
The instruments applied at EU-level are presented in more detail in the following subchapters.
In this respect, also references to recent cases of application are provided and first remarks
concerning the transferability to the Indian case are being given.
B. Instruments on national and sub-national levels
National levels and sub-national levels have prime responsibility of infrastructure development
and have instruments for a better use of infrastructure.
Improving of infrastructure is a national (or lower) level responsibility because European Union
has no authority over territories. The approach of infrastructure planning is similar between
European countries and typically comprises long-term (10-20-years) master planning of
regional and infrastructure development, more specified and prioritized in medium term (3-5)
plans and in annual infrastructure plans. Development of large-scale infrastructure follows
similar project cycles, set by regulation, in order to have consideration of all interests, social
and private, in the decision making process. Steps include:
• Pre-feasibility studies, comparing alternative solutions and usually including a preliminary
assessment of their economic and financial returns.Feasibility studies, detailing the design,
possibly with variants, and with more profound assessment of economic and financial
feasibility.
Environmental impact assessments if projects exceed a certain size. (Environmental
Authorities will be leading for decisions on the need for EIA environmental impact
assessment).
Stakeholder consultation for an inventory of all interests, for example for aligning private
and public interests or else for compensation and/or resettlement.
Project consent commonly requires the previous steps. Large-scale inland waterway
projects are likely to require approval certificates from relevant authorities, if there are
potential impacts on e.g. (ground) water levels, special areas of conservation or protection
areas.
Project realization, comprising ground preparation, construction and delivery. This will
follow an approved project implementation plan with well-defined project control and risk
management and with clear definitions of deliveries and approval criteria.
Project evaluation an understanding of the realized impacts and may lead towards
additional measures for improving the use of the infrastructure.
The project cycle must ensure that public spending is in accordance with efficiency principles
and that sustainable planning standards are met.
The responsibility of infrastructure maintenance and infrastructure operation (traffic
management and for example locks and moveable bridges) also lies on these political levels.
The distinction between National, Provincial or Municipal ownership and responsibility reflects
the level of significance of infrastructure to the different levels and is demarcated by Public
Law.
IWT Sector Development Strategy and Business Development Study for Capacity Augmentation of National Waterway 1 from Haldia to Allahabad 44
Either level may have specific instruments for enhancing infrastructure development. An
example is instruments for co-funding of quay or terminal improvements between public and
private sector entities.
National and sub-national instruments also comprise measures for improving the use of IWT-
infrastructure. Those which have recently applied in EU-member states are for example:
co-funding for piloting or developing innovations, similar to those co-funded on EU-level
however with smaller scales and mainly national relevance;
subsidies to reduce terminal handling costs for containers or intermodal loading units;
co-funding of investments in transshipment terminals. Such investments are subject to the
requirement that terminals will have public access;
co-funding of waterway access and construction to dedicated quays, provided that the
beneficiary commits to a minimum amount of annual shipment to barges;
subsidies of modal shift scans, which comprise feasibility studies and business plans for the
implementation to shippers for shifting their cargo from road to railways or inland
waterway transport;
modal shift subsidies, for example a fixed subsidy per TEU-kilometer (this instrument
nowadays is out of grace).
Sometimes national, lower level governments or port authorities support market driven
initiatives, like for example the establishing of IWT Promotion Bureau by co-funding or by
assigning of manpower to their projects.
Recent examples of national funding programs in favor of IWT in Europe include aid schemes
for green and low-emission waterway vessels in the Netherlands (Energy Investment
Allowance), Germany (aid program for low-emission diesel engines for inland navigation
vessels) or Austria (aid scheme for green inland waterway vessels) as well as support schemes
for intermodal transport of containers on waterways in France and Belgium.36
Sometimes national, lower level governments or port authorities support market driven
initiatives, like for example the establishing of an IWT Promotion Bureau by co-funding or by
assigning of manpower to their projects. The Short-Sea Shipping Inland Waterway Promotion
Center (SPC) in Germany represents an application case for this kind of public support for the
IWT sector.37
2.3.1 The European Union Marco Polo Program
About the program
Marco Polo aimed to ease road congestion and its attendant pollution by promoting a switch
to greener transport modes for European freight traffic. Railways, sea-routes and inland
waterways have spare capacity. Companies with viable projects to shift freight from roads to
36 For more information on various national funding programs for inland waterway transport, see
http://www.naiades.info/funding/news.php?id=247&f_lang=EN (accessed 26 Jan 16) 37 See http://www.shortseashipping.de/ (accessed 01 Feb 2016)
IWT Sector Development Strategy and Business Development Study for Capacity Augmentation of National Waterway 1 from Haldia to Allahabad 45
greener modes turned to Marco Polo for financial support. More than 500 companies have
done so successfully since the program was launched in 2003.
Responsibility
Marco Polo is run by the European Commission's Directorate-General for Mobility & Transport
and the EU's Innovation and Networks Executive Agency (INEA). INEA is responsible for the
operational side of the program - putting it into action on the ground and liaising with
participants.
Objectives and funding areas
Marco Polo co-funded direct modal-shift or traffic avoidance projects and projects providing
supporting services which enable freight to switch from road to other modes efficiently and
profitably. Funding is in the form of an outright grant. It is not a loan to be repaid later.
Applicants must meet a series of conditions to obtain a grant. Grants covered a share of costs
associated with the launch and operation of a new modal-shift project, but must be supported
by results.
A grant gave financial support in the crucial start-up phase of a project before it pays its way
to viability. Grants last from two to five years. Projects should be commercially viable by the
time the funding stops. Successful participation in a Marco Polo project enhances a company's
green credentials. Marco Polo is user-driven. If a company has a project to transfer traffic from
road to other modes or to avoid road transport, it may qualify for a grant. The project has to
involve a cross-border route. It has to make economic as well as ecological sense. The selection
criteria are set out in the grant application documents. Commercial undertakings, whether
privately or publicly owned, can apply for funding.
IWT Sector Development Strategy and Business Development Study for Capacity Augmentation of National Waterway 1 from Haldia to Allahabad 46
In total there are five funding areas:
1. Modal shifts from road to rail and waterborne systems:
Most applications are for direct modal-shift projects. You do not have to shift all your traffic
off the road to obtain a grant. Inter-modal projects, combining the different transport
modes - road, rail and waterborne transport - are eligible.
2. Catalyst actions which promote modal shift:
These must be breakthrough, technology-driven projects, providing supporting services for
modal shift like management systems, integrated cargo control via GPS, or common IT
platforms for inter-operability between modes.
3. Motorways of the sea between major ports:
Motorways of the sea actions offer an effective way of getting big volumes of freight off
the roads and onto ships. They must be innovative and inter-modal, and operate between
Category ‘A’ European ports fully equipped to handle this traffic. Category ‘A’ ports are
defined in an official EU decision.
4. Traffic avoidance:
The cleanest journey is the one that does not take place. Marco Polo therefore promotes
traffic avoidance by funding projects which introduce new ways of avoiding or reducing
road traffic, such as avoiding empty runs or improving supply chain logistics.
5. Common learning actions:
Projects related to enhanced knowledge and cooperation in inter-modal transport and
logistics are a regular feature among funded projects. Different award conditions apply for
this category.
Budget
The overall Marco Polo budget for the period 2007-2013 was €450 million. Applications for
grants hit a record level in 2009 and 2010. Competition for funds is therefore keen. To put all
applicants on an equal footing, requirements are kept simple and procedures are as
transparent as possible.
The Marco Polo program publishes a call for proposals from potential grant applicants at the
beginning of each year on its website. To meet the funding requirements are a criterium for
success.
The decision to give funding to a project is based on the following basic principles, with
variations for each funding area:
Amount of freight shifted from road to greener modes (or the amount of road transport
avoided),
Fixed rate of subsidy,
Maximum duration,
IWT Sector Development Strategy and Business Development Study for Capacity Augmentation of National Waterway 1 from Haldia to Allahabad 47
Ceiling on the costs covered.
Applications must show the need for the subsidy by being loss-making during the subsidy
period. But equally, they must show how their project will return to a sustainable profit from
the time the subsidy ends.
The amount shifted is expressed in tons-kilometers per year. The minimum threshold is 60
MMT/km for modal shifts (13 MMT/km in the case of pure inland waterway projects), 30
MMT/km for catalyst actions, 200 MMT/km for motorways of the sea and 80 MMT/km for
traffic avoidance. In certain cases, it is possible to measure in m3/km (a fixed conversion factor
of 4m3/km = 1 ton/km applies). For traffic avoidance actions, vehicle/ kilometers (v/km) can
be used. This criterion does not cover common learning actions, where a minimum subsidy
threshold of €250,000 applies. The subsidy rate for all types of projects is €2 per 500 tons/km.
Traffic avoidance projects can also use a rate of €2 per 25 vehicles/km.
The duration of grant is two years in the case of common learning actions, a maximum of three
years for modal shifts and three-to-five years for catalyst actions, motorways of the sea and
traffic avoidance.
The upper limit of eligible costs is 35% for all categories except for common learning actions
where it is 50%. Eligible costs are those necessary to implement the project. They do not
include return on capital, debt and debt service charges, or value-added tax (VAT), or costs
incurred in non-participating countries.
Implementation and results so far
The contract document for each successful project is the Marco Polo grant agreement. It is
negotiated and signed by the beneficiary or beneficiaries on the one side and the INEA on
behalf of the European Commission on the other. The agreement is based on the applicant's
proposal and takes account of comments made by the evaluation committee.
Over the period 2003-2009, 125 projects involving more than 500 companies have received
funding from the Marco Polo program. Most projects benefiting from the program are modal
shift actions. They accounted for 79% of the funding. These are projects which can viably shift
freight from the road to other forms of transport in current market conditions, and where
operational losses incurred during the start-up period can be covered by a Marco Polo grant.
Common learning actions accounted for 9% of the funding and catalyst actions accounted for
8%. Traffic avoidance projects and motorways of the sea projects accounted for 2% of the
funding each, but these categories have only existed since 2007.
70 projects were selected for grants in the period 2007-2009, i.e. the first three years of the
Marco Polo II program. The maximum subsidy amount per project ranged from €0.37 million
to €7.5 million. These projects aim to take a total of 54 billion ton-kilometers of freight off the
roads each year. The total benefit to society as a result of avoiding the environmental and
social costs of road freight traffic is estimated to be worth €1.4 billion.
Under the 2010 call for proposals, 32 projects were successful - from 101 bidders for the
budget of €63.54 million. Of the 32 projects, 26 were modal shift actions, i.e. robust, but not
necessarily innovative projects which take freight off the roads. Four were common learning
IWT Sector Development Strategy and Business Development Study for Capacity Augmentation of National Waterway 1 from Haldia to Allahabad 48
actions i.e. they innovate in ways of dealing efficiently and sustainable with increasingly
complex transport and logistics solutions. There was one traffic avoidance action, trans-port
and product-ion, and one motor-way of the sea action i.e. an action offering a door-to-door
service by combining short-sea ship-ping services with other modes of transport. No catalyst
actions were selected in 2010.
Of the 27 projects that have been selected for funding during the 2013 call of the Marco Polo
II program, 4 projects concern IWT. As they address the transport of different types of freight
within specific geographical boundaries, they might provide general examples for commodities
and markets (i.e. in terms of distance) that could potentially be addressed by respective
programs in India. In detail, the elected proposals during the 2013 call include projects on the
strengthening of barge logistics between Duisburg and the Belgian ports of Antwerp and
Zeebrugge (Logport-Project), the transport of newly produced vans between Düsseldorf and
the port of Antwerp (B2S), the shifting of containerized freight onto the waterways between
the seaports of Antwerp and Rotterdam and their hinterland in northern France (FFCL) as well
as the establishment of a regular waterway transport service for biomass and
renewableresources between Romania/Bulgaria and Austria (Biolinks).38
Figure 7: Marco Polo- facts and figures
Source: http://inea.ec.europa.eu/
38 For a full list of the projects selected under the 2013 Marco Polo II call, see http://ec.europa.eu/inea/sites/inea/files/download/marco_polo/marco_polo_award_decision_2013_smaller.pdf (accessed 26 Jan 16)
IWT Sector Development Strategy and Business Development Study for Capacity Augmentation of National Waterway 1 from Haldia to Allahabad 49
2.3.2 The EU funding program TEN-T (Connecting European Facilities CEF)
The Trans-European Network – Transport (TEN-T) Program was established by the European
Commission to support the construction and upgrade of transport infrastructure across the
European Union.
The TEN-T Program dedicated financial support towards the realization of important transport
infrastructure projects - in line with the overreaching goal of European competitiveness, job
creation and cohesion.
The TEN-T Executive Agency (EA), created by the European Commission in 2006, managed the
Program on behalf of the European Commission for all projects established under the 2000-
2006 and 2007-2013 funding schemes. The projects represent all transport modes – air, rail,
road, and maritime/inland waterway – plus logistics and intelligent transport systems, and
involve all EU Member States. On 01 January 2013 the TEN-T EA became the INEA, but
management of all open TEN-T projects continues unaffected.
€8 billion were attributed by the EU to the TEN-T program for 2007-2013, in order to support
studies or works which contribute to the TEN-T program objectives. To allow this funding to
ultimately improve the European transport network and increase mobility, there is a specific
sequence of activities which need to take place in order to award it. These are summarized
below.
TEN-T funding opportunities are open to all EU Member States or, with the agreement of the
Member States concerned, international organizations, joint undertakings, or public/private
undertakings or bodies. Funding in TEN-T grants can support studies or works which contribute
to TEN-T program objectives.
This €8 billion budget over the 2007-2013 funding period was primarily allocated to projects
selected via calls for proposals launched each year by DG MOVE and, as of 2009, by the former
TEN-T EA on its behalf. The norm was that, each year, a Multi-Annual Call and an Annual Call
were launched. The funding quotes differ from 10% to 20% for infrastructure projects up to
50% for pre-feasibility studies.
Overall, the Multi-Annual Calls aimed to give an important impetus to the implementation of
the TEN-T priority projects - as defined in the TEN Guidelines - and to address some horizontal
priorities.
The Commission (DG MOVE), with the assistance of the Agency, carries out the evaluation and
selection of submitted proposals. The process is supported by independent external experts,
whose role is to ensure that only the most high-quality proposals which best meet the award
criteria as described in the relevant work program and call text are selected for funding.
Proposals, which meet the eligibility criteria specified for a call, are evaluated on the basis of
the criteria defined in the relevant work program and call texts. Essentially, these relate to:
relevance to the TEN-T priorities and policy objectives,
maturity,
impact - particularly on the environment, and
quality (completeness, clarity, soundness and coherence).
IWT Sector Development Strategy and Business Development Study for Capacity Augmentation of National Waterway 1 from Haldia to Allahabad 50
A list of proposals recommended for funding is then prepared by DG MOVE with the support
of the Agency, taking into account the opinion of the external experts.
Successful applicants are then invited by the Agency to enter into negotiations on the basis of
which, if agreement is reached, individual Commission Decisions are established to support
individual projects.
TEN-T projects involving waterways can be grouped into:
Inland waterways are made up of rivers, canals and the various branches and links which
connect them. The TEN-T inland waterway projects aim to help connect industrial regions
and urban areas and link them to ports. Inland ports form part of the network, in particular
as points of interconnection between the waterways and other modes of transport.
River Information Services (RIS) and its related projects involve traffic management
infrastructure on the inland waterway network. Specifically, this includes the
establishment of an interoperable, intelligent traffic and transport system to optimize the
existing capacity and safety and improve interoperability with other transport modes.
TEN-T projects dealing with seaports aim to permit the development of sea transport. They
include support for shipping links for islands and the points of interconnection between
sea transport and other modes of transport. Their infrastructure aims to provide a range
of services for passenger and goods transport, including ferry services and short and long-
distance shipping services, coastal shipping, linking EU Member States together and with
third countries.
In the past, various IWT projects have been funded under the TEN-T/CEF-program. Recent
examples from the 2014 program include a study/pilot-action on the removal of bottlenecks
on the Danube River in the cross-border region between Bulgaria and Romania, as well as
actions on the improvement of the inland waterway network in northern Italy, the
development of a multimodal terminal on the Rhine River at Lauterbourg and the
implementation of a river information system on Belgian inland waterways, contributing to a
better traffic management and a more efficient and safer navigation.39
The trans-European network of Motorways of the Sea (MoS) intends to re-create the road and
rail network on the water, by concentrating flows of freight in viable, regular sea routes. These
projects strive to improve port facilities and infrastructure, as well as electronic logistics
management systems, safety and security and administrative and customs procedures, as well
as access routes for year-round navigability. Projects usually are proposed by at least two
member states.
2.3.3 The EU funding program INTERREG IV A Upper Rhine
The INTERREG community initiative was launched in the 1980s by the European Commission,
under the responsibility of the Regional Policy Directorate General. Regional Policy enjoys the
second biggest budget in the European Union, after the Common Agricultural Policy.
39 For an overview of recent waterway-related TEN-T/CEF projects and project-specific information, see https://ec.europa.eu/inea/en/connecting-europe-facility/cef-transport/projects-by-transport-mode/water (accessed 29 Jan 16)
IWT Sector Development Strategy and Business Development Study for Capacity Augmentation of National Waterway 1 from Haldia to Allahabad 51
Following a pilot phase (1989-90), the program was extended to cover the whole of the
European Union, with INTERREG I (1990-93), followed by INTERREG II (1994-99) and INTERREG
III (2000-06). Allocated funds have increased regularly and the latest programming phase has
been given € 4.9 billion by the European Regional Development Fund (ERDF). The visible
success of the initiative is the main reason why it has been so willingly pursued.
The Upper Rhine area, where France, Germany and Switzerland share common borders, is of
central importance for Europe, in terms of history, culture and economy. Cross-border
cooperation, which involves over five million inhabitants, began in the 1960s and has
accelerated under the INTERREG initiative.
Over the last fifteen years, the rising number of projects and players involved in cross-border
cooperation has demonstrated the immediate and very real impact of the INTERREG initiative
in the Upper Rhine. Within the two programming areas, PAMINA and Upper Rhine Center-
South, INTERREG has provided the backing for some 300 projects to develop within a genuine
spirit of partnership.
The Program "INTERREG IV A Upper Rhine" intends to sustain the cross-border cooperation in
the Upper Rhine Valley. It is realized in a specific context, explained here.
The Program implemented in the Upper Rhine region is a part of the Objective "European
territorial cooperation". This objective itself is a part of the Regional Policy of the EU. The
Program is also, for the Swiss part (Switzerland is not member of the EU) part of the Swiss New
Regional Policy. The Program is concerning a period of nine years between 2007 and 2015. The
implementation is founded on a base document, the Operational Program.
The OP has been drawn up by the actors of the cross-border cooperation in the Upper Rhine
region and adopted by the European Commission on 24 October 2007.
These are the objectives of the program:
Support the development of the Upper Rhine into an internationally competitive cross-
border knowledge and innovation Region
- to extend through the promotion of projects with the aim of cross-border research
capacity to strengthen cross-border participation of companies and to increase the
development of applications and innovation through cross-border consortia
Promote cross-border dimensions of a sustainable development of the area, the economy
and the mobility of the Upper Rhine
- through projects with the aim of improving the protection of species, the quality of the
ecosystem services that reduce environmental burdens and resource use in the context
of urban development and the economy of the Upper Rhine and the increase in the
share of transport with lower load carrier
Promote employment in the Upper Rhine cross-border
- through projects with the objective of cross-border development of small or medium
enterprises (SMEs), increasing the supply of jobs and the increase in cross-border
employment
IWT Sector Development Strategy and Business Development Study for Capacity Augmentation of National Waterway 1 from Haldia to Allahabad 52
Promote cross-border cooperation between administrations and citizens in the Upper
Rhine
- through projects with the aim of improving cross-border service offering of
administrations and increasing the identification of citizens with the Upper Rhine as a
cross-border region.
INTERREG programs contain projects on various subjects, including the promotion of transport
services for goods and passengers in the respective cross-border regions. Transferred to the
case of IWT on the NW-1, an INTERREG related program could thus present a platform for
cooperation and exchange in the border regions between different Indian states or in the
cross-border regions between India and Bangladesh. Among the different waterway-related
projects funded by INTERREG in the Upper Rhine area are works such as the redevelopment
of a ferry link between France and Germany as well as multi-modal transportation studies that
aim to identify the strengths and weaknesses of the regional infrastructure and to find a cross-
border basis for the analysis and assessment of transport related problems.40
2.3.4 The EU funding program NAIADES
In 2006, the European Commission adopted a Communication on the promotion of inland
waterway transport. The NAIADES Action Program was intended for the period 2006-2013 and
focused on five strategic areas for a comprehensive IWT policy: market, fleet, jobs and skills,
image and infrastructure. These measures are rounded off by reflections on an appropriate
organizational structure.
Issues being addressed under NAIADES include working time arrangements, professional
qualification requirements, the examination of administrative and regulatory barriers, the
adoption of innovative technologies, such as the RIS, and infrastructure improvements.
By creating favorable conditions for the further development of the sector, the Commission
hopes to encourage more companies to use this mode of transport. The policy to promote
inland waterway transport in Europe is encapsulated in the NAIADES Action Program.
A first action program covered the period 2006-2013. A second action program, NAIADES II
covers the period 2014-2020.
Carriage of goods by inland waterways is a climate-friendly and energy efficient mode of
transport, which can make a significant contribution to sustainable mobility in Europe. The
European Commission believes that its great potential must be better used in order to relieve
heavy congested transport corridors.
The NAIADES action program comprises numerous actions and measures to boost transports
on inland waterways. The program runs until 2020 and is to be implemented by the European
Commission, the Member States and the industry itself.
40 For more information on the INTERREG projects in the Upper Rhine area, see http://www.interreg-
oberrhein.eu/projekte/liste-der-projekte/ (accessed 29 Jan 16)
IWT Sector Development Strategy and Business Development Study for Capacity Augmentation of National Waterway 1 from Haldia to Allahabad 53
The revision of the NAIADES action program (2014-2020) is expected to lead to the adoption
of the NAIADES II Communication foreseen in 2013. In its Staff Working Paper, the Commission
Services presented concrete actions under preparation:
1. Infrastructure - planned actions for inland navigation under the existing programs and
under the forthcoming instruments of the next multi-annual financial framework for the
period 2014-2020 (financial and technical assistance);
2. Market - assistance for integrating inland waterways into the multimodal logistic chains;
financial incentives for inland navigation;
3. Fleet - measures to reduce emissions (for example standards);
4. Jobs and skills - actions aimed at increasing harmonization of standards for professional
training and certification; and
5. Information exchange and sharing - review of the River Information Services policy.
The NAIADES II Communication aims at creating the conditions for inland navigation transport
to become a quality mode of transport. It sets out the program for policy action in the field of
inland waterway transport for the period 2014-2020. Actions are taken in the following key
areas of intervention:
Quality infrastructure,
Quality through innovation,
Smooth functioning of the market,
Environmental quality through low emissions,
Skilled workforce and quality jobs, and
Integration of inland navigation into the multimodal logistics chain.
The other elements of the package represent the first steps towards the implementation of
the NAIADES II program. The Staff working document is a contribution to the impact
assessment of future initiatives in relation to the greening of the inland waterway fleet, the
Proposal for a Directive laying down technical requirements for inland waterway vessels
prepares for the implementation of a new approach to governance in inland navigation and
the Proposal for a Regulation amending Council Regulation (EC) No 718/1999 intends to allow
for a broader range of actions of the Reserve Funds available to support inland navigation.
Moreover in the context of the RIS, the European Commission has adopted an implementing
regulation which introduces a harmonized electronic chart display information system.
IWT Sector Development Strategy and Business Development Study for Capacity Augmentation of National Waterway 1 from Haldia to Allahabad 54
2.3.5 The EU funding projects PLATINA and PLATINA 2
The PLATINA project is a major trans-European project for the promotion of inland waterway
transport. Launched by the European Commission in 2008, PLATINA was designed as a
platform to provide support for the implementation of the NAIADES European inland
navigation program. It brings together 22 partners from 9 European countries and has received
Commission funding of €8.5 million.
The PLATINA project, adopted under the 7th Framework Program for Research and
Technological Development, covers a broad set of actions in five strategic fields of NAIADES:
Improve market conditions,
Modernize the fleet,
Develop human capital,
Strengthen the image of inland navigation, and
Improve infrastructure.
PLATINA provides technical and organizational assistance by ensuring active participation of
key industrial stakeholders, associations and Member States administrations. Furthermore,
PLATINA organizes expert meetings and working groups, and carries out studies on how to
better implement selected actions. Other actions include the setting up a single portal for
online inland navigation information services and an inland navigation education network, as
well as the provision of technical support for the further development of River Information
Services (RIS).
The project PLATINA 2 implements the European Action Program for the promotion of inland
waterway transport (NAIADES 2). PLATINA 2 is effectuated by a consortium of 12 organizations
from seven different countries. The consortium includes relevant stakeholder groups from the
inland waterway transport sector.
In order to accomplish the objectives and intentions of the NAIADES 2 Action Program, the
PLATINA 2 consortium includes the active participation of
waterway operators and administrations,
representatives of the inland waterway transport industry and fleet operators,
promotion and development organizations,
inland navigation educational and training institutions, and
experienced consultants and research institutes.
PLATINA 2 comprises several bodies related to project management as well as internal and
external communication and content-related steering.
Advisory Committee (AdCOM): responsible for the strategic guidance of the project’s technical
actions and recommendations. It consists of high-level representatives of Member States, third
countries, river commissions, the IWT sector as well as the European Commission. Their
acceptance of PLATINA 2’s results is vital to the success of the NAIADES action program. The
Advisory Committee usually meets in combination with the EC NAIADES implementation
IWT Sector Development Strategy and Business Development Study for Capacity Augmentation of National Waterway 1 from Haldia to Allahabad 55
group. Furthermore, it reviews the roadmap reports proposed by the Management Committee
or discusses topical issues in course of the NAIADES dialogue.
Management Committee (MCOM): consists of senior representatives of the WP leader
organizations which are responsible for the tactical planning and the internal agreement on
roadmap reports for the platform and its work packages.
Executive Board (ExBoard): made up of representatives of the European Commission and the
MCOM. It is in charge of strategic planning, resolving contractual and financial issues and
monitoring support activities. The Executive Board meets at appropriate milestones.
Occasionally, selected Member State Representatives are invited.
Technical Secretariat (TS): responsible for the day-to-day administrative and technical
management of PLATINA 2 and consists of the WP leaders. It carries out the actions delegated
to it by the Management Committee and the Executive Board. The Technical Secretariat is also
the focal point for the organization of project-related networks and dissemination and
exploitation of project results. This includes technical coordination and responsibility,
coordination and liaison with the European Commission, financial administration, a
communication desk, as well as a project back office.
Project partners: experts who provide technical expertise and inputs to the various work
packages and activities. These experts are chosen from IWT industry representatives,
Consultants, promotion agencies and administrations. Project partners will meet only as
necessary to complete their specified tasks. A full consortium meeting together with the EC-
Project Officer normally takes place once a year.
Involvement of external experts, stakeholders and subcontractors: in addition to the targeted
one-directional information transmission under the PLATINA 2 umbrella, interactive
involvement of stakeholders from within and beyond the sector takes place. This is carried out
by various means, the most important being NAIADES dialogue and Thematic Expert Groups,
which are adapted to the particular issue. The gathered viewpoints and expert knowledge are
integrated in the project work. Synergies with existing initiatives and structures are exploited.
Project structure and objectives
PLATINA II provides technical and organizational support to the European Commission,
Member States, third countries, River Commissions and industry in the development and
deployment of targeted policy actions implementing the NAIADES II Action Program.
Consequently, PLATINA II aims at fostering the development of inland waterway transport into
a quality mode of transport. The project builds on close cooperation with administrative
stakeholders on all levels, River Commissions, branch organizations as well as (potential) end
users, freight forwarders, fleet and terminal operators, shippers and further relevant
stakeholders, initiatives and projects. Their involvement is ensured by dedicated working
groups, the Advisory Committee or NAIADES dialogue.
Organized along the priority topics of NAIADES II, PLATINA II comprises four work packages
(“action fields”) dealing with specific policy areas:
IWT Sector Development Strategy and Business Development Study for Capacity Augmentation of National Waterway 1 from Haldia to Allahabad 56
• Markets and awareness,
• Innovation and fleet,
• Jobs and skills, and
• Infrastructure.
2.3.6 Conclusions on the Marco Polo and other EU incentive programs in respect of inland
waterway transport in India
The overview of EU incentive and development programs to initiate Inland Waterway
transport indicated the wide range of instruments, which deemed to be necessary for a mature
EU transport industry, infrastructure and market driven forces deciding on which transport
mode will be chosen to serve the market.
Summarizing the above overviews the most important instruments on European Union-level
in the last decade up to today can be characterized as follows:
Co-funding of infrastructure projects through a Fund for the Development of the Trans –
European Network for Transport (TEN-T). This fund is to encourage Member States to
invest in infrastructure (including port infrastructure) which is of international importance
to Europe. The fund, recently renamed into Connecting-Europe-Facility, cofinances up to
20% of the infrastructure works and up to 50% of studies in the preparation phase like
feasibility studies, design studies and environmental impact assessments. To some extend
it can also provide co-funding of infrastructure related facilities like LNG-bunkering
facilities and port information systems. The remaining part of funding usually is provided
by the relevant lower level authorities and sometimes by private sector;
Co-funding of research and development studies, such as the INTERREG program. The
studies are mainly of large scale and with good representation of the relevant market
players and other stakeholders. The study topics closely follow the political agenda.
Currently the for example address technological innovations like for cleaner engines, cargo
handling systems, improved port operations, optimizing information flows between
operators and authorities, information and communication systems for navigation, and
supply chain optimization etc.;
Co-funding of pilots or other implementation steps for transport quality and efficiency
improvements on similar topics as mentioned above, such as NAIADES/ PLATINA, for
example for pilots of implementing port information systems or for developing a network
of LNG-bunkering and related training of port staff on security issues; and
Co-funding of modal shift actions, such as Marco Polo. The instrument supports IWT-
operators by taking a share of the risk in the start-up phase of a new service. The EU-
contribution is always below the operational losses in the first three years of operation
and required is a business plan that demonstrates viability of the service at the latest after
three years.
The following Table 5 provides a good summary of the previously described different IWT
related and pure IWT incentive programs and their specific focus. While the TEN-T program
has a very brought European Union scale covering mainly investments on general transport
IWT Sector Development Strategy and Business Development Study for Capacity Augmentation of National Waterway 1 from Haldia to Allahabad 57
infrastructure (among IWT), the Marco Polo Program rather focus on shifting cargo from road
transport to railway or inland waterway transport.
Table 5: Focus of funding of different EU incentive and promotion programs
Source: Consultants
Concerning the transferability of the envisaged programs, one has to consider the specific
conditions and needs of today’s inland-waterway transport in India. In order to provide a
competitive basis for the future development of the transport mode, further investments in
adequate infra- and suprastructures such as navigable waterways, ports and terminals are likely to
be necessary. In order to support such cost-intensive investments, the CEF/TEN-Tprogram might
act as a suitable role model for a joint funding program that unites the financial means of
national and state authorities as well as private investors. At a later stage, Marco
Polo/PLATINA-like programs could then help to facilitate the market entrance of private
businesses by encouraging a modal-shift of existing traffic and by providing technical and
organizational support to market participants.
2.4 Policies and subsidies to the favor of IWT in China
The following examples refer to the policies and subsidies on IWT on the Xiang River in the
Hunan Province. A variety of administrative funding methods could be seen from specific
funding programs. The description on existing incentive programs and promotion packages for
inland waterway transport - however extensive - should provide a look into the policy thinking
which has already brought a major development and benefits to the Chinese IWT system. As
the project’s scope of work implies a visit of the IWT administration in the Hunan Province it
was deemed to be helpful to provide a full set of background information.
Promotion of IWT in the People’s Republic of China (PRC) has become objective because of
IWT‘s contribution to an efficient and sustainable transport system. The Central Government‘s
transport policy and regulations are powerful guidance to the implementation of policies on
lower government levels, i.e. Hunan and its municipal levels. These local level authorities will
pursue Central Government’s objectives and policies, possibly only with amendments that
would make policies more fit to specific conditions.
IWT Sector Development Strategy and Business Development Study for Capacity Augmentation of National Waterway 1 from Haldia to Allahabad 58
The Central Government has argued that the use of water transport on rivers has helped to
optimize location and layouts of industries along rivers, for which economic development
along the Yangtze River is taken as an obvious example. There, inland-waterway transport has
demonstrated its unique advantages in transportation of energy, raw materials and other bulk
materials as well as containers and major equipment.
The public sector entities are encouraged to accelerate measures to facilitate IWT-growth. The
Chinese Government does recognize that the demand for and thus use of IWT in the end will
mainly be a market factor and therefore market needs and potential should be well
considered.
It is worth noting two points here: firstly, although certain government plans have not been
given the effect of compulsory enforcement, but after government documents of the aforesaid
feature are promulgated, the Central and Local Governments at various levels will proceed to
enact detailed supporting laws and regulations to ensure the contemplated objectives of
government documents can be effectively realized. Relevant government documents would
generally clearly indicates the government-expected orientation of Xiang River shipping
business development; in the analysis of government incentive measures on encouraging
Xiang river inland waterway transport development, relevant government documents are not
only of reference value but also of indispensable practical significance.
Secondly, after the Central Government promulgated laws and regulations, in some cases, the
local government will, for certain reasons and in consideration of actual local circumstances,
enact related laws and regulations. Since local governments have no power to substantially
alter the principles or provisions of laws and regulations promulgated by governments at a
higher level, local laws and regulations are formulated on the basis of superior laws and
regulations and in light of actual local circumstances to deal with more specific matters, so as
to be more applicable.
The following sub-chapters refer to the six fields of action, which represent the focus of the
incentives and promotion activities of the Hunan Province.
2.4.1 Modal shift from land transport to waterway transport
Through investigation and searching, the following policies or legislation contain relevant
provisions on incentive measures on encouraging the shift from land transport to inland-
waterway transport:
The National Plan for the Distribution of Inland Waterways and Ports (20 July 2007) sets out,
to better guide inland waterway transport business toward the path of healthy development,
to give full play to the advantages of inland waterway transport such as less land occupation,
large shipping capacity, low energy consumption, and low pollution, to optimize the
comprehensive transportation system, and to promote the comprehensive development and
utilization of water resources.
It was suggested that measures shall be taken to give full play to the advantages of inland
waterway transport, to provide uninterrupted transport services in a highly-efficient, safe and
environmentally-friendly manner, adapt to the requirements of valley economic & social
development of and national security. In the long run, according to the requirements of river
IWT Sector Development Strategy and Business Development Study for Capacity Augmentation of National Waterway 1 from Haldia to Allahabad 59
valley economic and social development, measure shall be taken to further expand the
coverage of, enhance the accessibility, and extend the range of, inland-waterway services.
According to this plan, governments at all levels shall be committed to give full play to the
advantages of inland-waterway transport, to strengthen its effective connection with other
modes of transportation, and to optimize the comprehensive transportation system; to attach
importance to coordination development between waterways and ports/ships, and between
trunk waterways and tributary waterways.
Besides, relevant government offices shall have effectively connected major places of resource
supply with places of resource consumption and realize direct river-sea transport involving
major rivers. Further efforts may be made to further strengthen regional economic and
material exchanges, to promote the formation of industrial concentration areas along rivers,
and to give full play to the leading role of major cities for economic development in the region.
Additionally, governments at all levels shall be committed to develop a national system of
inland waterways and ports, backed by high-grade fairways allowing navigation of ships over
1,000 metric tons, and operated by major ports nationwide, to promote standardization of
transport vessels featured large size, to effectively develop and utilize inland water transport
resources, to give full play of the advantages of inland water transport, and to create a
comprehensive transport system integrating other modes of transportation. 41
As is pointed out by this plan, its implementation can save a lot of land of the State; especially,
building a network of high-grade waterways in regions in short of land resource such as the
Yangtze River Delta, and Pearl River Delta is an effective measure to help relieve the pressure
on land resources and expand the transportation capacity.
On 21 January 2011, Opinions of the State Council on Accelerating the Development of Water
Transport on the Yangtze River were issued by the State Council. In relation to model shift, it
was requested that governments at all levels shall devote the attention to realize an organic
link between water transport with other modes of transportation involving highways, railways,
aviation and pipelines, to develop multimodal transport, and to exert the comparative
advantages and combination efficiency of various transportation means thus helping optimize
the transportation structure, reduce comprehensive logistics costs of society, and transform
the mode of transport development.
Moreover, it also emphasized that the development of water transport on rivers such as the
Yangtze River helps adjust and optimize the layout of industries in areas along rivers; inland
water transport has unique advantages in transportation of energy, raw materials and other
bulk materials as well as containers and major equipment; Speeding up the development of
inland water transport is conducive to development of the electric power, steel, automobile
and other sectors in regions along rivers. Further, to accelerate the development of inland
water transportation on Yangtze River and other rivers is beneficial to energy conservation
and emissions reduction. With the fast economic and social development, resource and
environment constraints are getting increasingly stringent; the contradiction between
transport development and energy conservation/environment protection has become
increasingly acute. It is emphasized that a vigorous development of inland-waterway
41 For more information, see http://siteresources.worldbank.org/EXTPRAL/Resources/china.pdf (accessed 27 Jan 16)
IWT Sector Development Strategy and Business Development Study for Capacity Augmentation of National Waterway 1 from Haldia to Allahabad 60
transport helps cut down the energy consumption, build a low-carbon economy and reduce
emissions, which is in line with the overall requirements of building a resource-saving and
environmentally-friendly society, and is of great practical significance to speed up the
transformation of the pattern of economic development. 42
It required that governments at all levels shall also be applied to fully implement the scientific
outlook on development, further emancipate the mind, and take the development of inland
waterway transport as a key task in the construction of a comprehensive transport system, to
upheld the notion of scientific development, rationally utilize and effectively preserve water
resources, as guided by the market and under the principles of highlighting priorities and
orderly promotion, so as to give full play to the comprehensive functions of water resources,
to fully stimulate the initiative of local People's Governments at various levels and social forces
in contributing efforts to inland water transport development, to persist in making scientific
and technological innovation, to strengthen the R&D work on advanced suitable technology
and equipment, and to upgrade and sustain the development of inland waterway transport.
Governments at all levels shall be committed to strengthen the construction of railway and
highway collecting and dispatching passageways for major ports, to realize connection of high-
grade highways or express highways with major container ports of inland rivers; to promote
development of major ports into cargo transit bases and commodities trading center, and
gradually build them into a comprehensive freight hub; to strengthen the supervision on plan
enforcement, strictly implement the examination and approval procedures for the use of
coastlines, encourage the development of public piers, and to improve the utilization efficiency
of coastline, land and other resources.
Furthermore, governments shall make efforts to speed up the development of large-scale port
areas for special purpose at major ports and part of the key ports along inland rivers, and focus
on building a series of terminals specially for handling containers, automobile rollon /roll-off
(ro-ro) handling, and bulk commodities; to improve the collecting and dispatching system of
inland river ports; in light of the national and local road and rail network planning, to
strengthen the planning specially for the collecting and dispatching system of main ports and
key ports, and incorporate the planning into the local overall planning for implementation; to
enhance technological standards of dispatching passageways of key port areas, to connect
high-grade highways with express highways in large container terminals, to realize direct
transport “between port and railway station” in port areas having a strong railway-port
transport function for bulk and container cargoes, and to ensure a proper quantity and
standard of railway lines and marshaling stations in port areas.
Besides, governments at all levels shall be addressed to develop multimodal transport and
port logistics, actively encourage large inland ports having a railway-port transport function
for bulk and container cargoes, a beneficial geographical location, a large throughput capacity
and professional outstanding features to better their warehousing facilities and port
environment, to expand their logistics functions and play their pivotal role as transport hubs;
to accelerate the development of inland water container transportation, promote specialized
inland transportation for automobile ro-ro handling, liquid bulk cargo, bulk cement and over-
42 For general information on low-carbon economy policy in China, see
http://www.cciced.net/encciced/policyresearch/report/201205/P020120529358137604609.pdf (accessed 27 Jan 16)
IWT Sector Development Strategy and Business Development Study for Capacity Augmentation of National Waterway 1 from Haldia to Allahabad 61
sized and heavy-weight cargoes, to expand the transport range of sea-river and trunk-feeder
lines.; to speed up the process of standards cohesion, information sharing, transport
deployment and service integration of inland waterway transport and other means of
transportation. Relying on demonstration projects carried out by low-carbon and bulk-cargo
transport pilots, to investigate the waterway transport market and provide guidance on
formation of market mechanisms and policies.
Although there are national level plans and they are well known by local officials, local policy
and legislation seemingly is not in pace with central ones. The above legislation and regulation
are promulgated by central government organs, being programmatic documents applicable to
broad geographical areas across the nation; however, it requires specific policies based on local
actual circumstances to guide the transport sector toward the shift in modes of transportation.
Government documents at central level could not and should not set out unified detailed
implementation programs and need further promulgation of supporting measures by local
governments according to local actual circumstances.
In addition, even though the government showed their ambition and destination to exploit
potentialities of IWT which is considered as another economic growth engine, a clear delivery
plan accomplished by quantitative indicators that is proved effective by the Marco Polo
Program is still necessary. What is more, it has to be accepted that the modal shift will lead to
sacrifice of interests in other transport modes and change of past pattern of economic growth.
2.4.2 Encouraging establishment of inland waterway transport service companies
In 2009, Regulations of Hunan Province for Administration of Waterway Transportation was
issued by the Standing Committee of National People's Congress of Hunan Province, where the
Hunan Province Government is required to encourage domestic and foreign units and
individuals to establish waterway transport undertakings and on investing in establishment of
waterway transport enterprises, implement the principle of "those who invest shall get
benefits".
The Ministry of Transport made the Opinions on Implementation of Opinions of the State
Council on Accelerating the Development of Water Transport on the Yangtze River and Other
Inland Waters in 2011. In accordance with Article 2.6, transportation departments at all levels
shall be applied to vigorously develop modern shipping sector involving shipping trade,
consultancy, information, finance, insurance and other services; to continue promoting
corporate operation of inland waterway transport, guide the small and medium-sized shipping
companies toward the path of intensive development in large-scale operation mode, to
promote intensive management of dangerous goods transport in large-scale operation mode;
to encourage transport and port service enterprises to extend the industry chain, to expand
the service functions such as warehousing, distribution and logistics, so as to turning
themselves into logistics operators.
2.4.3 Encouraging recycling of ship wastes
Governmental transportation departments at various levels shall be committed to strengthen
the control of mobile source of ship-induced pollution, equip newly-built inland transport
IWT Sector Development Strategy and Business Development Study for Capacity Augmentation of National Waterway 1 from Haldia to Allahabad 62
vessels with bilge disposal (or storage) and sewage/garbage collection facilities, renovate
existing passenger ships (including truck ro-ro vessels) in key water areas by equipping them
with related facilities, and build a monitoring and testing system for ship-induced pollution;
to establish an emergency response mechanism for pollution accidents in inland waterway
transport, and to equip vessels with pollution treatment facilities; to build onshore facilities
at waterway service areas and ports for receiving and treating domestic garbage, bilge and
sewage of vessels.
Specifically in the Implementation Plan for Pollution Prevention and Control in Zhuzhou Section
of Xiangjiang Changsha Comprehensive Junction Reservoir Area, issued on 19 October 2012 by
the People's Government of Hunan Province, it required measures on pollution prevention and
control on transport vessel and port terminals shall be carried out. Strict restraints shall be
placed on transport of dangerous chemicals, and it is forbidden to flush vessels clean or directly
discharge domestic garbage/bilge of vessels into the reservoir area. Temporary piers in the
reservoir area shall be removed, the berths at retained piers shall be rationally allocated, and
the reservoir shall be delimited into various areas. To clear out unnecessary floating oil jetties,
floating filling stations (points) and refueling stations, clamp down on illegal floating gas
stations (points), and prohibit vessels from dumping wastes or oily water into the reservoir
area.
The Water Resource Department of Hunan Province issued the Regulations of Hunan Province
on Protection of Xiangjiang on 01 May 2013. According to this regulation, ship navigating in
navigable waters of the Xiang River shall have legal and valid certificates of water pollution
prevention, and shall be equipped with facilities for collection of pollutants such as sewage,
waste oil and garbage. It is forbidden to discharge or dump pollutants and ship wastes. In
addition, the people's government at the county level shall organize relevant units to get
floaters and harmful algae out from the trunk streams and major tributary streams of the Xiang
River under its governance, and dispose of them in a bio-safe manner.
In the following month, the Administration of Water Transportation of Hunan Province issued
the Notice on Strengthening Prevention and Control of Ship-induced Pollution in Xiangjiang
Changsha Junction Reservoir Area. It required ships navigating in the Xiang River Changsha
junction reservoir area shall be equipped with bilge tanks and sewage tanks, and are prohibited
from discharging sewage and bilge into the reservoir area; garbage containers or bags shall be
prepared for storing ship garbage in the process of transport; ships entering the reservoir area
shall timely notify garbage collecting units for removing ship garbage and sewage. For each
single voyage passing the Xiang River, ships shall make delivery of garbage to the collecting
units at a time; ships navigating within Hunan Province shall deliver garbage not less than twice
per month; ships navigating within the reservoir area shall deliver bilge and sewage not less
than once per month. Since 01 January 2014, ships not equipped with bilge tanks or sewage
tank or garbage cans have been prohibited from entering the Xiang River comprehensive
junction reservoir area.
Some relatively specific measures are found in Management Measures on Subsidy on ShipClass
Standardization on Inland Waters, which was promulgated by the Ministry of Finance and the
Ministry of Transport on 09 April 2014. Article 13 provides that the subsidy standard for
conversion of existing vessels to prevent pollution by vessel sewage is calculated by the
following methods:
IWT Sector Development Strategy and Business Development Study for Capacity Augmentation of National Waterway 1 from Haldia to Allahabad 63
Install facility to treat sewage:
1. Passenger vessel: unit vessel subsidy = subsidy base + unit passenger seat subsidy ×
passenger holding capacity of the vessel.
For the calculation, the subsidy base is Chinese Yuan (CNY) 90,000; unit passenger seat
subsidy is CNY 1,100 per passenger seat; passenger holding capacity of the vessel is subject
to Ship Inspection Certificate.
2. Cargo vessel: vessel with a gross tonnage under 1,000 tons can get a subsidy of CNY
30,000; vessels above 1,000 tons but under 2,000 tons can get subsidy of CNY 40,000;
vessels of or over 2,000 tons can get subsidy of CNY 50,000.
Install storage cabin (hold) to collect sewage:
For each vessel, vessels under 1,000 tons can get subsidy of CNY 15,000; vessel above 1,000
tons but under 2,000 tons can get subsidy of CNY 20,000; vessel of or above 2,000 tons can get
subsidy of CNY 25,000.
In the Notice on Promoting the Implementation of Ship-Class Standardization on Inland Water
in Hunan Province, it is provided that as of 01 January 2016, inland water vessels of which
sewage collection fails to meet the current standards, chemical cargo vessels, and single-deck
tankers (>600 ton) are forbidden to sail on certain waters of Xiang River, Yuan River, and
Dongting Lake. From 01 October 2013 to 31 December 2015, the installation of sewage
treatment or collection facilities on vessels which meet the conversion requirements can get
subsidy from the government.
2.4.4 Technological innovation of inland water vessels
The Consultants note in the Implementation Opinion of Hunan Provincial People’s Government
on Encouraging, Supporting and Guiding the Development of the Non-Public Sector of Economy
including Individual Sector and Private Sector, issued by the Hunan Provincial People’s
Government on 22 July 2005, that Hunan Province Government will be committed to improve
services for technological innovation; to give full support to the technological innovation and
to the application, approval, finance arrangements and project management of all kinds of
technical program. Non-public enterprises enjoy equal treatment to that of public enterprises;
the verified non-public hi-tech enterprises enjoy equal favorable treatment to that of public
hi-tech enterprises.
Besides, the local governmental organizations at all levels should turn to provide funds to
establish platforms of generic technology and public service such as R&D center, test center
and information center in key industrial clusters and industrial parks, so as to encourage non-
public capitals to establish incubators for all kinds of technology enterprises.; to encourage
non-public technology enterprise which possess feasible conditions to cooperate with
universities and colleges, and scientific research institutes to set up technology development
institutions of all kinds which can pool in resources and wisdom of industry, education
institutes and research institutes to solve problems; to encourage and support non-public
enterprises to form hi-tech research & development (R&D) centers and engineering
technology centers, and to set up postdoctoral work stations and experimental bases.
IWT Sector Development Strategy and Business Development Study for Capacity Augmentation of National Waterway 1 from Haldia to Allahabad 64
It is required that the local governmental organizations at all levels should be applied to
vigorously foster the technology market, support key cities which possess feasible conditions
to set up technology exchanges, with a view to promote the transformation of technological
achievements and transfer of technology. Encourage intermediary technology service
agencies to provide technology information, technology consultation, and technology
promotion and other professional services. Encourage state-owned research institutions
open laboratories to non-public enterprises. The costs incurred by the research and
development of new products, new technique and new technology by profit-oriented
industrial enterprises have increased by more than 10% (including 10%) compared with that
of last year. The actual cost of the year, after disbursed from the cost and expenses based on
actual situation as per the provisions, can directly deduct the due income tax of the year by
50% of the actual cost of the year. Encourage retired personnel to provide management
expertise and technical expertise for enterprises. To effectively protect the intellectual
property rights of entities and individuals, to provide funds for the application and protection
of invention patent of non-public enterprises.
The National Outline for the Development of Ship-Class Standardization on Inland Water, which
was published by the Ministry of Transport on 14 February 2006, suggested that governmental
transportation departments at all levels shall make efforts to develop navigation industry by
relying on technology, positively introduce advanced technology, and promote the close
combination of technology progress and market economy development by taking into account
of economic development and market bearing capacity.
The Ministry of Transport’s Guiding Opinions on Promoting the Development of Green,
Recycling-oriented, and Low-carbon Transportation, issued on 22 May 2013, emphasizes
governmental transportation departments at all levels shall be committed to strengthen
technological research and development on green, recycling-oriented and low-carbon
transportation; to promote the breakthrough of major science and technology programs
including the R&D and application of key technology for intelligent transportation based on
the internet of things, and the research and demonstration of the key technology for
emergency response to transportation pollution and pollution control; to proactively promote
key technology, advanced applicable technology and product R&D in the fields of energy
saving, ecological environment protection and utilization of new energy for transportation
energy sector. In addition, governmental transportation departments at all levels shall be
committed to strengthen the promotion of the technology and products of green, recycling-
oriented and low-carbon transportation; to step up the research and formulation of policies
for the technology of green, recycling-oriented and low-carbon transportation; to make public
of the achievements directory of the technology, product, and technique of the green,
recycling-oriented and low-carbon transportation in a timely manner, and actively promote
the market-integration and industrialization of technological achievements.; to vigorously
promote the construction the system of criteria, measurement and inspection, and verification
for the technology, products, and techniques of the green, recycling-oriented and low-carbon
transportation.
In the National Implementing Plan of Promoting Ship-Class Standardization on Inland Water
during the 12th Five-Year Plan promulgated jointly by the Ministry of Transport and the
Ministry of Finance and in conjunction with the people’s government of more than ten
IWT Sector Development Strategy and Business Development Study for Capacity Augmentation of National Waterway 1 from Haldia to Allahabad 65
provinces, it is demanded that governments at all levels shall strengthen and support the
fundamental and forward-looking research on new type of vessels and energy-saving
transportation modes.
In the Notice of the Ministry of Transport on Issuing the Action Scheme of Promoting Inland
Water Transport on Rivers including Yangtze River (2013-2020), it is required that
governmental transportation departments at all levels shall improve the technical standard of
carrying vessels. Furthermore, the use of LNG fuel on barges and the planning and construction
of refueling stations and other supporting facilities shall be promoted.43
Also, governmental transportation departments at all levels shall be committed to strengthen
the promotion of scientific and technological achievements and cultivation of talents; based
on the consideration of construction of inland water transport and management demands, to
promote the promotion and application of technological achievements of inland water
transport and improve the overall technology level of the industry, by means of starting up
science and technology demonstration projects, compiling technical guidelines and revising
relevant standards; by relying on the major construction projects on inland waterways, key
scientific research projects, national engineering research centers and industry R&D centers,
to strengthen the cultivation of technological leaders and outstanding young talents so as to
build a high- level group of science and technology.
2.4.5 Vessel standardization on inland water
Compared with the previous incentive measures, which has only limited detailed statutory
support, the incentive measures on vessel standardization are supported by special policies
and legislations.
National Implementing Plan of Promoting Ship-Class Standardization on Inland Water during
the 12th Five-Year Plan was formulated by the Ministry of Transport and the Ministry of
Finance in conjunction with the people’s government of more than ten provinces, and was
published on 11 August 2013.
The very detailed Measures on Subsidy on Ship-Class Standardization on Inland Water
(hereafter the Measures) were promulgated by the Ministry of Finance and the Ministry of
Transport on 9 April 2014. Soon after on 13 August 2014, the Hunan Provincial Department of
Transport and the Department of Finance issued the Notice on Promoting the Implementation
of Ship-Class Standardization on Inland Water in Hunan Province, for the purpose of advancing
the Measures in Hunan Province.
The application of the Measures consists of two horizontal lines, one vertical line, two
waterway networks and 18 rivers including the Xiang River. According to the Measures, the
subsidy funds are granted during the period from 01 October 2013 to 31 December 2015. For
ships which are under construction until 13 December 2015, their date to be paid can be
extended to 31 December 2017 if the project examined and verified by the authorized
department of transportation and ship inspection institutions and then summarized and
reported to financial department by department of transportation.
43 For more information on the motives and the use of LNG-powered vessels in IWT in China, see
http://www.davidpublisher.org/Public/uploads/Contribute/5656bb454a18c.pdf (accessed 27 Jan 16)
IWT Sector Development Strategy and Business Development Study for Capacity Augmentation of National Waterway 1 from Haldia to Allahabad 66
All ship owners who dismantle and rebuild their ships and all the water transport operators
who build new model ships can apply for such subsidiary funds, exclusive of the dismantling
and rebuilding of passenger ferryboat used in villages and towns.
There are five steps for the ship owners to obtain the subsidiary funds. First of all, applicants
shall submit materials to the competent authorities. Generally, the owners of ship and water
transport operators who apply for subsidiary funds should fill in an Application for the Subsidy
Funded by Government for Ship Dismantling and Rebuilding or an Application for Inland Model
Ship Building and apply to the authorized department of transportation and financial
department at municipal (district, the same below) level together with Business Certificate for
Water Transport Operation, Business License (ID, if the owner of ship is natural person), Ship
Dismantling and Rebuilding Certificate or Technical Proposal for Building New Ships, and other
related materials. Authorized department of transportation and financial department at
municipal level are obliged to respond within ten (10) working days. However, for water
transport operator who apply for the subsidy funds for building new LNG driven model ship
and high energy efficient model ship, ship owners should apply for such subsidy funds after
undergoing a technical evaluation in accordance with Measures for the Technical Evaluation
and Recognition of Model Ships on Inland Rivers and being recognized as qualified, and at the
same time, they should submit corresponding evaluation conclusion.
Secondly, applicants shall conclude a Subsidy Agreement specifying the dismantling, rebuilding
and building method, time and place, subsidy standard, payment method, time limit, liability
for breach of contract and so on with related authorities after the application being approved
by authorized department of transportation and financial department at provincial level. It is
related authorities’ duty to notify information such as ship list, owners of ship (i.e. the
applicant), time and place the ships are planned to be dismantled, rebuilt or built to the
maritime bureau of the place where the ships are registered. If no clauses concerning payment
method and time limit can be found in the model contract, the applicant may, in accordance
with Article 24 Section 1 of the Measures, make relevant agreement with competent organs in
a formal contract.
Thirdly, the whole process of construction shall be inspected, supervised and examined by the
related authorities. Specifically, before construction, relevant department of transportation at
municipal level should designate 1-2 staff with the local maritime administration department
to supervise the dismantling and rebuilding on site, measuring the vessel and making records.
In the process of building a new vessel, the current operation procedures prepared by ship
inspection department should be followed and photos should be taken. Relevant
administrative departments should file all the materials, certificates, photos and other
materials concerning dismantling, rebuilding and building of such ships. After construction,
relevant authorized department at municipal level should designate 1-2 staff with the local
maritime administrate department to conduct acceptance on site and compile a Ship
Dismantling and Rebuilding Completion Report (or Ship Building Completion Report).
Fourthly, applicants shall submit all relevant materials to competent authorities. In the
Measures, no express definition is given on the mentioned “relevant materials”. Hence, the
applicants are suggested to inquire about the content of such materials from competent
department before Step 3 and collect such materials in time during Step 3. In cases concerning
the construction of new ships, further documentation is required. This includes the Application
IWT Sector Development Strategy and Business Development Study for Capacity Augmentation of National Waterway 1 from Haldia to Allahabad 67
for Building Inland Model Ship, the Ship Inspection Certificate, the Ship Ownership Certificate,
the Ship Operation Certificate and the Application for the Subsidy Funded by Government for
Building Inland Model Ship. Where LNG driven model ships andhigh energy efficient model
ships are built, evaluation conclusion as required by Technical Evaluation and Recognition for
Model Ships on Inland Rivers should also be submitted.
The last issue is about payment. The financial departments at municipal level should pay
subsidy funds in time, the payment of which shall be enforced in accordance with relevant
provisions of national treasury management system. Since the Subsidy Agreement is
concluded before the promulgation of the Measures, the payment method and time limit can
be defined by referring to relevant provisions of national treasury management system in
advance. Hence, competent authorities should not easily use relevant provisions of national
treasury management system to exempt themselves from relevant liabilities for breach of
contract.
2.4.6 Traffic control of inland water transport
In the Implementation Measures on Regulation of the People’s Republic of China on the
Administration of Navigable Waterways in Hunan Province it is required that the
administrative body of water gate and ship lock shall strengthen the management of water
gates and ship locks to ensure their good function. Vessels that pass the water gate or ship lock
shall obey the command by the administrative body.
The Implementation Measures on Water Law of the People’s Republic of China in Hunan
Province required that the construction of projects shall not affect the steady flow of river, or
block the discharge of flood, and threaten the safety of project facilities such as structures that
protect the slope, shore and dykes, and that pilot and assist navigation, and carry out
hydrology monitoring, and shall not silt up any rivers, lakes, reservoirs and man-made
channels. To those inevitable situations, the construction entity shall take remedial measures.
In case losses are incurred, the construction entities shall make compensations in according to
laws.
Additionally, before the settlement of disputes on waters, without agreement between the
parties concerned or approval of the same higher level of people's government, no party may
unilaterally change the current water situation by building structures that drain, block, collect
or detain (store) the water within 5 km of the location of water dispute which happens at the
borderline of administrative regions at or above county level, or within 3 km of the location of
water dispute which happens at the borderline of administrative regions at or above township
level.
According to the Regulations on Xiang River Protection of Hunan Province issued by the
provincial Department of Water Resource of Hunan Province in 2013, the competent transport
administrative department under the People’s Government at or above county level shall
strengthen the maintenance of Xiang River waterways so as to guarantee clear channels. No
entity or individual may occupy or damage the navigable channel or navigation facilities. When
Xiang River waterways are blocked, the waterway administration body shall take measures to
repair the waterway in a timely manner. The entity which constructs or operates within the
navigable waters of Xiang River, upon the completion of construction or operation, shall clear
IWT Sector Development Strategy and Business Development Study for Capacity Augmentation of National Waterway 1 from Haldia to Allahabad 68
the residues in a timely manner, and shall be subject to the waterway administration body for
check and acceptance.
The owners of ship locks on the high-class section of Xiang River waterways shall, in according
to the state standard or the industry standard of transportation, maintain the normal function
of ship locks to guarantee safety and efficiency of passage through ship locks. A joint
scheduling mechanism for ship locks in complexes shall be established on Xiang River. Such
mechanism shall comply with the unified scheduling of flood prevention and drought relief
on Xiang River.
As for the incentive measures on administrative control over inland water transport, a
relatively complete supporting system of policies and legislation has been introduced.
However, as to whether it is possible to solve the problems which occur during the
implementation of these policies and legislation by means of making reversion to relative
legislation, further investigation into the situation is needed.
2.4.7 Summary on incentives and first conclusions from the Chinese example
Summarizing the description of the existing regulations on the six incentive areas it can be
stated that a full set of incentives are in place and are defined by relevant regulations for four
incentive areas.
IWT Sector Development Strategy and Business Development Study for Capacity Augmentation of National Waterway 1 from Haldia to Allahabad 69
Table 6: Summary of incentive measures for IWT in Hunan Province
Incentive Name
Kinds of Incentive
Max Co-financing Applicant Relevant authority
Require-ments
Fund Source
Barge Standard-ization
Co-financing of modern demonstration vessels
(1) CNY 630,000 – CNY 1,400,000 For LNG depending on the total power of engine and date of completion;
(2) CNY 300 per gross ton multiplied by ship-type coefficient for HEE (Higher Energy Efficiency ) vessels
Ship owner HWTAB
Specifications of newly-built vessels required by certain regu-lations
The Ministry
Inland vessel technology innovation
Co-financing of recon-structing or dismantling unqualified vessels
(1) CNY 1,000 per ton multiplied by the vessel-age coefficient and the vessel-type coefficient for vessel dismantling
(2) CNY 600 per gross ton for the reconstruction of unqualified single-hull vessels
Ship owner HWTAB
Un-qualified vessels banned to sail by certain regulations
60% from Ministry, 40% from Provincial government
Waste Collection
Co-financing of reconstruct-ion
Up to 100% subject to a cap (CNY 75,000 for cargo vessel)
Ship owner HWTAB
Installation of sewage tank and sewage treatment unit
60% from Ministry, 40% from Provincial government
Set-up of IWT-related enterprises
corporate income tax relief
Fixed 15%
Logistic company operated in ports
Tax Bureau Qualified as Hi-tech-related company
Modal shift from road transport to waterway transport
No specific incentive measures for individual players identified
Traffic control and navigation management
Note: Traffic control and navigation management system: AIS and RIS system are all under construction. There is a draft
regulation on this area. Deployment of base stations of AIS system has been completed in Hunan Province.
Exchange rate Chinese Yuan/Renminbi (CNY): Indian Rupee (Rs) 1 CNY : 10,2 Rs
Source: Consultants
The overview of the Chinese incentive and development programs to initiate and support IWT
indicates the wide range of instruments, which are deemed to be necessary for a mature
transport industry and infrastructure. It also indicates the engagement of the national
ministries when it comes to rules and regulations. All in all, the programs presented above can
constitute a viable tool box for the development of IWT and its promotion as an
environmentally friendly mode of cargo transport. However, concerning the adaptability of
these actions, disparities in the level of development of the respective IWT markets should be
taken into account. Furthermore, differences in the political and institutional frameworks
might have an effect on the direct transferability and feasibility of certain policies.
As the Indian IWT transport market is currently in a less mature stage, the question on the
quality of infrastructure needs to be solved primarily prior discussing similar instruments
which are applied in more developed IWT markets and infrastructures. However, based on the
policy examples presented above, it should be noticed that comparatively easy application
and verification processes are favorable when it comes to public co-financing of
infrastructures and vessels. The precise development of a viable Indian IWT incentive program
shall be executed in the framework of the Strategy Report.
IWT Sector Development Strategy and Business Development Study for Capacity Augmentation of National Waterway 1 from Haldia to Allahabad 70
3 Regional Demand
3.1 The NW-1 hinterland
Each national waterway has its own well defined area of influence. Although, all the declared
waterway systems cannot be joined to form a national waterway grid, only some of the
waterways can be connected i.e. NW-1 can be connected to NW-2 and NW-6 using protocol
route through Bangladesh. Similarly, NW-5 that extends up to Paradip Port can also be joined
in the National Waterway grid through backwaters of Hooghly and Hilly tidal canal. In the
current exercise, areas on either side of the waterway systems which are likely to be affected
(primary hinterland) by the proposed IWT services are considered. Because of the limited
scope, secondary and tertiary catchment areas of the waterways are kept beyond the purview
of the current study. In view of this, civil districts located on either banks of the river are
considered as the relevant traffic regions. National Waterway 1, Ganges-Bhagirthi– Hooghly
river system passes through the states of Uttar Pradesh, Bihar, Jharkhand and West Bengal, a
distance of about 1,620 km, serving nearly 42 traffic regions, between Allahabad and Haldia
(Sagar). Major ports such as Haldia and Kolkata and important cities like Kolkata, Patna,
Varanasi and Allahabad fall under its primary hinterland. The river system serves richly
endowed natural reserve areas as well as a large number of industrial units comprising thermal
power plants, iron & steel plant, sugar mills, cement industry, small scale industries etc. The
Consultants defined the following four sectors according to the market surveys which were
centered around four future multi-modal terminals (for a list of the market survey producer
interviews see Annex 1 and of road-side interviews see Annex 2).
3.1.1 Haldia-Farakka sector
Particularities of the survey area (see below maps/figures) are as follows:
3.1.1.1 Zone 1: Kolkata-Howrah
Zone 1 contains the head offices of most of the companies (producer and users), is well
connected through multi-modal transportation, and has the high density of population. The
Hooghly River makes up the NW-1 within this zone. Zone 1 also is the area where the future
Kolkata Garden Reach Terminal (GRT) is planned.
Kolkata has four long-distance railway stations, located at Howrah (the largest railway complex
in India), Sealdah, Chitpur and Shalimar, which connect Kolkata by rail to most cities in West
Bengal and to other major cities in India. Srijan Industrial Logistic Park in Howrah is located on
NH6 (via this highway it offers fast access to Mumbai and Central India) in close proximity (13.3
km) to NH2 – the Golden Quadrilateral [GQ] connecting to Delhi and North India. The Park’s
location is also at the first leg of the GO to Chennai and South India. It connects to Kolkata
(10.2 km) by the Kona Expressway NH117 and Vidyasagar Setu (11.7 km) Kolkata serves as the
headquarters of three out of seventeen railway zones of the Indian Railways (IR) regional
divisions - Kolkata Metro Railways, Eastern Railway and South-Eastern Railway. The city also
has rail and road connectivity with Dhaka, capital of Bangladesh. The site for the future Kolkata
GRT is located in this zone.
IWT Sector Development Strategy and Business Development Study for Capacity Augmentation of National Waterway 1 from Haldia to Allahabad 71
Figure 8: Demarcation of Zone 1 (Kolkata-Howrah and vicinity) and Zone 2 (Haldia and
vicinity)
Source: Consultants’ Market Survey preparation, July 2015
Dankuni is a fast-growing industrial township north of Howrah. The town is well-reachable by
road or trains from both Howrah Station and Sealdah Station. Dankuni Junction rail station is
15 km from Howrah Station. The "Heart of Dankuni" is Dankuni Railway Station. The nearest
airport is the Netaji Subhas Chandra Bose International Airport located at Dum Dum, 20 km
from Dankuni. Major industries like "Mother Dairy"," Coca Cola", "Dankuni Coal Complex Ltd",
"Food Corporation of India", biscuit company "Anmol Biscuits Ltd." and many other have been
established. The town has witnessed great changes and developments in the recent years. It
is progressing very fast due to the growing industries and manufacturing units. Both NH2 and
NH6 terminate at Dankuni. Other major arteries meeting at Dankuni are Belghoria Expressway
connecting to NH 4 and the Dankuni-Memari Delhi Road. Dankuni railway station is located on
the Howrah-Bardhaman chord which is part of the Kolkata Suburban Railway system. Already,
there is a growing presence of freight and wagon movements around Dankuni Railway Station,
which is important as it connects Eastern Railway with South Eastern Railway with a link line.
Dankuni has a fast-growing freight yard, where goods traffic is moved, sorted, and packed to
deliver at other destinations. In the future, Dankuni will play a significant role because it will
be the endpoint of the LudhianaDankuni leg of the EDFC that is being built by Indian Railways.
Traffic, especially that of freight, will continue to grow and will positively impact the railways.
3.1.1.2 Zone 2: Haldia
Zone 2 contains many edible-oil, crude-oil and chemical industries. Due to the existence of the
Haldia Dock Complex, the area is rich with shipping activities, terminals and warehousing.
Within Zone 2 lies the mouth of the Hooghly River and thus the final downstream part of the
NW-1 down to Sagar Island. Haldia MMT constitutes the future major inland-shipping center
of this zone. Haldia is connected to Kolkata by both bus and train. Haldia is a terminal railway
station on the Panskura-Haldia branch line and is located in Purba Medinipur district. It
serves the Haldia industrial area. The Howrah-Kharagpur line was opened in 1900. The
Panskura-Durgachak line was opened in 1968, at a time when Haldia Port was being
constructed. It was subsequently extended to Haldia. The Howrah-Kharagpur line was
electrified in 1967-69. The Panskura-Haldia line was electrified in 1974-76. Indian Railways
IWT Sector Development Strategy and Business Development Study for Capacity Augmentation of National Waterway 1 from Haldia to Allahabad 72
propose to lay a new line connecting Sealdah and Haldia, with the distance being shorter by
70 km than the Howrah-Haldia track.
The site for the future Haldia Multi-modal Terminal (MMT) is located in this zone.
Figure 9: : Haldia Multi-Modal Terminal at present
Source: Consultants’ site visit, June 2015
3.1.1.3 Zone 3: Durgapur-Raniganj-Burdwan
Zone 3 comprises a multitude of steel, cement/concrete and agro industries. These industries
hold a huge potential in the production and supply of commodities.
Figure 10 Demarcation of Zone 3 (Durgapur-Raniganj-Burdwan and vicinity)
Source: Consultants’ Market Survey preparation, July 2015
The NW-1 flows through the very east of Zone 3 with the Hooghly River in a rather peripheral
situation, as it is the Damodar River which crosses the center of this zone. Along this river
lies Durgapur, being an important city in terms of both commercial and industrial
establishments is connected to almost all major places of Bengal. The important high-speed
railway track connects Kolkata with Durgapur (distance 158 km) and passes on to Delhi. The
main railway station is Durgapur railway station. Andal Junction is the main junction of the
city. It is located at Andal, a western suburb of Durgapur, 15 km from Durgapur City Centre.
The Andal-Sainthia branch line of the Eastern Railway Zone originates from this station and
terminates at Sainthia on the Sahibganj loop line. Durgapur is well connected via roads. It is
the preferred gateway to the districts of Bankura, Birbhum and Purulia of the Rarh Region,
which has underdeveloped transportation infrastructure. NH2 and SH9 pass through the city.
IWT Sector Development Strategy and Business Development Study for Capacity Augmentation of National Waterway 1 from Haldia to Allahabad 73
The Grand Trunk Road (NH2) virtually bifurcates the area. This historically important arterial
connector has now been widened into 2+2-lane highway as part of the Golden Quadrilateral
project. Another wide road takes off from Darjeeling Morh near Panagarh for North Bengal.
It also links Santiniketan to the Grand Trunk Road. The Durgapur Expressway, linking Dankuni
with Memari on the Grand Trunk Road, allows fast communication between Kolkata and
Durgapur (distance 170 km), where one can maintain cruising speeds of 80–120 km/h.
Panagarh-Morgram Highway originates from Panagarh, a suburb of Durgapur, and joins NH
60 near Dubrajpur; this makes Durgapur a major road junction and an important destination
for transportation toward North Bengal and North East India. NH 60 passes through Raniganj
and heads away towards Orissa. It happens to be one of the very few cities that have an Asian
Highway (AH1 linking Japan with Turkey) passing directly through the city jurisdiction. SH 9
joins with NH 60 and connects Durgapur with Orissa and South India.
3.1.1.4 Zone 4: Rampurhat-Nalhati-Pakur-Berhampore
Zone 4 is the area of the Hooghly River immediately downstream of the Farakka Barrage. In
this zone, the Farakka lock and channel set the northern upstream limit of a presently rather
easily navigable NW-1. To the west of the NW-1, this zone is home to many aggregates, sand,
coal and agro industries. These industries have a very big potential for the supply of the
booming construction business.
Figure 11: Demarcation of Zone 4 (Rampurhat-Nalhati-Pakur-Berhampore and vicinity)
Source: Consultants’ Market Survey preparation, July 2015
3.1.1.5 Zone 5: Indo-Bangladesh Protocol Route
Zone 5 constitutes the area covered by that part of the Indo-Bangladesh Protocol Route (IBPR)
which is covered by commodities being transported on that waterway. The Consultants’ market
survey identified commodities being shipped to Narayangunj (south of Dhaka) and further
upstream to Ashuganj which constitutes a bridgehead into India’s northeastern state of Tripura.
IWT Sector Development Strategy and Business Development Study for Capacity Augmentation of National Waterway 1 from Haldia to Allahabad 74
Figure 12: Demarcation of Zone 5 (Indo-Bangladesh Protocol Route)
Source: Consultants’ Market Survey preparation, October 2015
3.1.2 Farakka-Munger sector
The influence area applicable to the proposed Sahibganj MMT has been defined by keeping in
view the major origins and destinations of commodities identified during the reconnaissance
survey. Sahibganj and Sakrigali being an abode to many stone chip industries, this area formed
the core of the market research survey for the proposed Sahibganj MMT. Furthermore, major
loading points of railway stations are surveyed to ascertain the amount of loading happened in
the immediate preceding year 2014-15. The influence region along with the core area which
lies in close vicinity to the NW-1 is shown in overleaf Figure 14.
Zone 5
IWT Sector Development Strategy and Business Development Study for Capacity Augmentation of National Waterway 1 from Haldia to Allahabad 75
Figure 13: Influence and core region-Sahibganj
Source: Consultants’ Market Survey preparation, August 2015
Major loading points of railways along with the major towns in the influence region are shown
in Figure 15. Stone crushing industries and mines are located within a 5 km radius of the railway
stations thus making it easier transporting the material by rail. Heavy work force is deployed
along all the loading points to load the stone chips onto trucks at the mine and also at the
railway siding. In general as a norm 8 hours of time is given by railways to load a full rake (one
train load) at the railway siding.
Figure 14: Loading points in the influence region
IWT Sector Development Strategy and Business Development Study for Capacity Augmentation of National Waterway 1 from Haldia to Allahabad 76
Source: Consultants’ Market Survey preparation, August 2015
Opposite Farakka, on the eastern side of the NW-1, is Malda (called the “Gateway of North
Bengal”) which constitutes an important stepping stone into Bangladesh via N512 (Hili) and
N508 (Bitur). North of Malda District, the N31, after crossing the Ganges River at Begusarai and
leading through the important road knot of Purnea, runs through the “Chicken’s Neck into the
North-Eastern states of India. From Purnea, the N57 and N57A constitute an important road
link with the border town of Biratnagar in the eastern region of Nepal.
3.1.3 Munger-Ballia sector
The survey commenced during the last week of July and covered a total area within a 200 km
radius around Patna.
Figure15: Survey area covered around Patna
Source: Consultants’ Market Survey preparation, July 2015
Ghagra River
Gandhak River
Kosi River
Sone River
IWT Sector Development Strategy and Business Development Study for Capacity Augmentation of National Waterway 1 from Haldia to Allahabad 77
Major roads covered by this survey are the NH77 connecting to the Katmandu Valley / Nepal
in the north and the NH2 (AH1) in the south.
3.1.3 Ballia-Allahabad sector
The market survey in this sector (limited by Ballia to the east and Allahabad to the west) was
the last one to be commenced; however, it covered the widest area.
Figure16: Survey area covered within the Ballia-Allahabad sector
Source: Consultants’ Market Survey preparation, July 2015
The survey area of this last sector is limited by two roads:
To the north, NH28 connects to Lucknow, Barabanki, Faizabad, Basti and Gorakhpur;
To the south, NH75 connects Jhansi (from Jaipur via NH11) with Ranchi (and onwards to
Kolkata via NH33 and NH6).
IWT Sector Development Strategy and Business Development Study for Capacity Augmentation of National Waterway 1 from Haldia to Allahabad 78
The survey area is crossed by the Grand Trunk Road or National Highway Nr. 2 (NH 2) which forms the main transport spine which connects to Kolkata, Kanpur, Agra and Delhi. The market survey orientated itself along these major roads, from which the market interviewers swarmed out into the feeder roads.
3.2 Existing transport infrastructure The NW-1 from Haldia (Sagar) to Allahabad (1,620 km) covers the states of Uttar Pradesh,
Bihar, Jharkhand and West Bengal.
Potential traffic locations/regions, important commodities of interest for the NW-1, proposed
nearest location on the river bank, and approximate distance between actual place of origin of
the commodity and proposed IWT terminal identified in the study are given in below table.
Table 7: Traffic-generating regions and the nearest location
SN Origin and Nature of Cargo Nearest Terminal Location Distance (Km)
1 Haldia ( Coal) Kolaghat 60
2 Sagarnidhi ( Coal) River front 18
3 Pakur ( stone) Pakur Terminal 12
4 Barauni ( Fertilizer, POL) Semaria 15
5 Semaria ( Coal) Barauni 15
6 Patna ( coal) Muzzafarpur 60
7 Patna ( coal) Nabinagar 150
8 Phulpur ( Fertilizer) Allahabad 50
9 Chunar ( coal) Rihand 135
10 Chunar ( coal) Vindyachal/Singrauli 135
11 Chunar ( coal) Renusagar/Anpara 112
12 Chunar ( coal) Obra 67
13 Robertsganj/churk/Dala ( Cement) Chunar 67
14 Phulpur ( Fertilizer) Allahabad 50
15 Rewa ( Cement) Allahabad 119
16 Satna ( Cement) Allahabad 166
17 Sidhi ( Cement) Allahabad 211
18 Jagdishpur ( Fertilizer) Allahabad/Varanasi 138/187
19 Shahjahanpur ( Fertilizer) Allahabad/Varanasi 380/429
20 Raniganj Coalfield Shantipur 205
Source: Planning Commission; Total Transport System Study
IWT Sector Development Strategy and Business Development Study for Capacity Augmentation of National Waterway 1 from Haldia to Allahabad 79
Figure 17: Location of IWAI facilities in relation to potential cargo locations
Source: IWAI
3.2.1 Terminals
Current capacities of existing terminals, such as: land area, berth size, type of terminal/jetty
and broadly areas of command are given below in Table 9. As indicated by IWAI, on the entire
route (between Allahabad and Haldia) of the 24 listed locations there are 18 IWT Terminals
with floating jetties and 2 with fixed RCC Jetty.
3.2.1.1 Terminal capacities
Apart from the existing terminals listed below, IWAI has acquired large areas in Haldia,
Sahibganj and Ramnagar (the Consultants’ Jal Marg Vikas - Waterway Infrastructure Analysis
Report discusses these future terminals in detail).
Table 8: Size of existing terminals
SN Name of Terminal Land area Berth Size Type of terminal District Served
1 Haldia 10,319 m3 200 m Floating Haldia
2 Botanical Garden Jetty 996 m3 50 m Floating Haora
3 BISN Jetty 11,607 m3 100 m Floating Haldia Port
4 G.Rietty – 2 (Kolkata) 14,606 m 216 m Fixed RCC Jetty Kolkata
5 Shantipur 8,000 m3 100 m Floating Shantipur
6 Katoya/Katwa Pontoon on water front 30 m Floating Katwa/Pakur
7 Hazardwari Pontoon on water front 30 m Floating Murshidabad,
8 Pakur (Putimari) Owned by Farakka Barrage
Project (FBP). Fixed RCC Jetty
9 Farakka 4,800 m3 80 m Floating + Fixed RCC
Jetty Farakka Side
10 Rajmahal Pontoon on water front 35 m Floating Sahib Ganj, Jharkhand
11 Sahebganj Pontoon on water front 35 m Floating Sahib Ganj, Jharkhand
12 Bateshwarsthan Pontoon on water front 35 m Floating Bhagal Pur , Bihar
IWT Sector Development Strategy and Business Development Study for Capacity Augmentation of National Waterway 1 from Haldia to Allahabad 80
13 Bhagalpur 10,000 m3 35 m Floating Bhagal Pur , Bihar
14 Munger 13,766 m3 35 m Floating Munger, Bihar
15 Semaria Pontoon on water front 35 m Floating Semaria, Bihar, Arrah
Berhampur
16 Barh - 27 m Floating Barh, Bihar, Bihar
Sharif
17 Fatuah Triveni Ghat - - Fatuha, Ranipur /
Bihar
18 Patna (Gaighat) 13,118 m3 46.6 m Fixed RCC Jetty Patna, Bihar
19 Pahleza - - Pahleza Ghat
Junction Katmandu Valley /
Nepal
20 Digha - - FCI godowns Patna, Bihar
21 Buxar Pontoon on water front 35 m Floating Buxar, Bihar, Bhojpur,Bihar
22 Ghazipur Pontoon on water front 35 m Floating Ghazipur , U.P., Ballia
23 Rajgat (Varanasi) Pontoon on water front 35 m Floating Varanasi, U.P.
24 Allahabad 87,590 m3 35 m Floating Allahabad, Mirzapur,
Chaundali
Source: Planning Commission; Total Transport System Study
Based on traffic studies conducted by the Dutch Mission in 1983, the Total Transport System
Study formed cargo groups with common handling & storage requirements. For example;
coal, stone and fly ash are products that require same type of handling in terms of
transshipment and storage and can therefore be handled at the same terminal. The same is
applied for kerosene and POL. Raw jute, jute textile, food grains and sugars are cargoes that
also have certain features in common. These types of cargoes are transported in sacks or bales
and can be offloaded with same type of machinery. These cargoes are valuable and
arrangements must be made for their storage in locked warehouses. Important commodities
identified were: coal, fertilizers, stone, fly ash, POL+ kerosene, raw jute, jute textile, food
grains, sugar, iron & steel products and salt.
3.2.1.2 Hinterland connectivity of existing terminals
Some of the existing IWT terminals have the distinct disadvantage that they are not directly
linked with the Indian railway network.
Table 9: Nearest road and rail locations to NW-1
S.No Name of NW-1 Terminal Nearest NH/SH
Nearest Railhead
Gauge
1 Haldia NH - 41 Haldia BG 2 Katwa/Katoya NH - 6 Katwa BG 3 Hazardwari SH Murshidabad BG 4 Behrampur NH -34 Behrampur BG 5 Farakka NH -34 Farakka BG 6 Sahebganj (Samdaghat) NH - 80 Sahebganj BG 7 Bhagalpur NH-80 Bhagalpur BG 8 Barh NH - 30A Barh BG 9 Rajghat (Varanasi) NH - 7 Mugalsarai BG
10 G.R.Jetty-2 (Kolkata) SH Kidderpore BG 11 Patna (Gaighat) NH - 19 Gulzarbagh BG
Source: Planning Commission; Total Transport System Study
IWT Sector Development Strategy and Business Development Study for Capacity Augmentation of National Waterway 1 from Haldia to Allahabad 81
The future multi-modal terminals in Haldia, Sahibganj and Ramnagar will remedy this
disadvantage, as all three will be linked to all three modes: rail, road and inland waterway (see
Annex 6 for the example of Sahibganj).
3.2.2 Facilities other than terminals
3.2.2.1 Storage infrastructure
The necessity for storage arises primarily because of lack of adjustment between the time and
place of production of goods and time and place of their consumption. Warehouses play a vital
role in the flow of goods from producers to consumers. It helps in combating annual and
seasonal fluctuation in production and prices. Provision of facilities for food grains comes
under the purview of the Department of Food and Public Distribution. In addition to storage
of food grains, storage also includes industrial warehousing, custom-bounded warehouses,
container freight stations, inland clearance depots and air cargo complexes.
Table 10: Number of food-grain storages, warehouses and container depots (as of 31 March 2012)
State Food-grain storages
(mt) Warehouses
(no.) Container depots
(no.)
Bihar 87,675 16 -
Jharkhand 19,300 3 -
Uttar Pradesh 680,503 48 7
West Bengal 164,160 37 2
Total India 5,264,854 467 37
Source: All India Electricity Statistics published by Central Electricity Authority, M/o Power
Setting the absolute numbers of the above table in relation to the area and population of the
four riparian states, a picture of relative misdistribution becomes evident.
Table 11: Coverage of food-grain storages, warehouses and container depots (by area and population)
State Food-grain storages Warehouses Container
(tons/‘000km2)
(tons /head)
(no./‘000km2
) (no./head) (no./‘000km2) (no./head)
Bihar 930.7 844.6 0.17 0.15 - -
Jharkhand 241.3 585.5 0.04 0.09 - -
Uttar Pradesh
2823.7 3409.7 0.20 0.24 0.03 0.04
West Bengal 1844.5 1797.1 0.42 0.41 0.02 0.02
India 1601.6 4350.4 0.14 0.39 0.01 0.03
Source: All India Electricity Statistics, Consultants’ calculations
The state of Bihar, although a major agricultural producer area, is not well endowed with food-
grain storages. Jharkhand, being a predominant mining state, would not require a dense
network of food-grain storages and warehouses. In contrast, the two states of Uttar Pradesh
and West Bengal are equipped similar to India as a whole.
3.2.2.2 Haldia-Farakka sector
Apart from terminals, following infrastructure exists along the surveyed NW-1 sector:
Table 12: Facilities (terminals, cold storages) identified in the Haldia-Farakka sector
IWT Sector Development Strategy and Business Development Study for Capacity Augmentation of National Waterway 1 from Haldia to Allahabad 82
Name of Facility Type of
Commodities handled
Quantity handled per annum
Origin/Supply chain Destination / Supply
Chain / Cost
T. T. Shed (Kolkata)
Fly Ash 80,69,262 tons per year (2014-15 )
Durgapur, Kolaghat, Titagarh, Bandel (W.B.) / by road / Rs 1.30 per ton-km
Bangladesh / Barge / US$ 15 / ton
Falta SEZ (S-24 Parganas)
Logs 60,000 tons per year
Burma, Indonesia, Papua New Guinea / by sea to Kolkata or trans-loading at Sagar Island / US$ 110-120 per hopper-ton/ by barge from Falta Jetty to KPD/ Rs 400 per metric ton
West Bengal / Road
Hooghly District (total 9 nos cold
storages) Baidyabati to Tarakeswar
Potatoes
12 MMT (capacity of each cold storage: 2,50,000 - 4,00,000 bags of 50 kg)
West Bengal - Hooghly District
All W.B. 60%, neighboring states (Bihar-Patna-Gaya, Allahabad, Orissa, Jharkhand, Assam, Andhra Pradesh) 40 % / by road / Rs 25 to 35 per bag
Source: Consultants’ Market Survey July-October 2015
3.2.2.3 Farakka-Munger sector
Following infrastructure has been identified along this surveyed NW-1 sector:
Table 13: Facilities (terminals, cold storages) identified in the Farakka-Munger sector
Name of Facility Type of
Commodities handled
Quantity handled per annum
Origin/Supply chain
Destination / Supply Chain / Cost
LCT Facility Ro-ro (stone chips)
and public transportation
~0.1 MMT/year Sakrigali/ Sahibganj
Manihari (Rs 1,300 for loaded truck and Rs 750
for empty truck)
Rajagopalachari Ro-ro (stone chips
only) ~600 tons a day
Sakrigali/ Sahibganj
Manihari (lump sum amount about Rs 6,000
for 40-ton truck)
Source: Consultants’ Market Survey July-October 2015
The two facilities depicted above serve the stone-chips trade.
3.2.2.4 Munger-Ballia sector
Present terminal at Patna: Handling facilities plus IWAI office and NINI are located directly
below the Gandhi Bridge. The handling facilities consist of
1. quay for normal water levels,
2. quay for flood-water levels, and
3. flood-proof transit shed.
Quay for normal water levels: The lower quay is about 60m long and 20m wide. It is connected
through a wide and well-paved road-ramp to the street at the top banks.
Quay for flood-water levels: The upper ground quay is situated about 10 meters higher and is
well secured.
IWT Sector Development Strategy and Business Development Study for Capacity Augmentation of National Waterway 1 from Haldia to Allahabad 83
Transit shed: The transit shed is at the level of the upper quay. It is used for short-term storage
of cement and fertilizers. Dimensions are approximately 40m x 10m with a clear height of
about 5m. Access is by two large roller doors (approximately 3m x 4m) on each side.
Figure 18: Existing Patna terminal
Source: Consultants’ Market Survey July-October 2015
For cargo operation IWAI has available three mobile cranes of 75 tons (1) and 20 tons (2)
capacity, which are also served by IWAI employees. Horizontal transport is the responsibility
of the cargo owner.
Doriganj or Pahleza
IWAI is planning to establish a multi-modal terminal on the northern side of the Ganges River
either at Doriganj 15 km upstream of the city of Patna or at Pahleza opposite of Patna. This
terminal would mainly serve as traffic node for Nepal-bound cargo; the location has been
chosen due to proximity to Birgunj in Nepal and onwards to the Katmandu Valley.
3.2.2.5 Ballia-Allahabad sector
Some of the existing private facilities in this last sector have been defunct for a longer period:
Table 14: Facilities (terminals, cold storages) identified in the Ballia-Allahabad sector
Function Location Capacity Name Designation Remarks
Cold Storage Sai Cold Storage
Container Bhadohi 60 trucks / day Pradeep Kumar Singh
Teminal Incharge ICD Concor
(Container Depot) Train for Bombay
stopped 6 months ago
CWC CWC closed for last 3
years
Cold Storage Pratap 25,000 tons Shahi Cold Storage Potato 40 Km radius
Cold Storage Pratap 4,000 tons Pratap Cold Storage Chilbila Potato
Cold Storage Sultanpur 6,000 tons Mansa Cold Storage Potato
Source: Consultants’ Market Survey July-October 2015
IWT Sector Development Strategy and Business Development Study for Capacity Augmentation of National Waterway 1 from Haldia to Allahabad 84
3.3 Special economic & industrial zones
With the Special Economic Zone Policy having being announced in 2000, the implementation
of Special Economic Zones (SEZ) has become a focus of Indian national economic policy. SEZs
are geographically bound areas that aim to attract foreign and domestic investments, promote
new business settlements and foster economic growth by offering competitive infrastructural
premises, simplified regulations and attractive financial incentives. Among the benefits offered
to SEZs are duty-free procurement of goods for development, operation and maintenance,
significant exemptions on income, central sales and service taxes as well as simplified
procedures on external commercial borrowing.
A corresponding SEZ Act was passed by Parliament in 2005 with the objectives to generate
additional economic activity, promote exports of goods and services, promote investments
from domestic and foreign sources, create employment activities and develop infrastructure
facilities. As of March 2015, a total number of about 200 exporting SEZ facilities were active
nationwide.44 Whereas India’s early policy resulted in the approval of a relatively large number
of small SEZs, more recent strategy adjustments indicate a change of thinking in favor of larger
industrial zones. A corresponding policy on the development of National Investment and
Manufacturing Zones (NIMZ) and industrial parks was unveiled in 2011.45
As India’s current economic policy supports the clustering of businesses and the generation
of additional economic activity at designated zones, added demand for transport services
on relations to and from such SEZ locations and industrial parks can be expected. When large
volumes of cargo have to be transported, IWT could potentially offer economies-of-scale
and operational advantages over other transport modes. The degree to which IWT will be
able to commercialize these advantages and benefit from SEZ related cargo will however
depend on geographical and infrastructural premises as well as the types of commodities
manufactured.
44 See http://www.sezindia.nic.in/writereaddata/pdf/ListofoperationalSEZs.pdf (accessed 12 Feb 16) 45 See http://www.ibef.org/download/SEZs-Role-in-Indian-Manufacturing-Growth.pdf (accessed 12 Feb 16)
IWT Sector Development Strategy and Business Development Study for Capacity Augmentation of National Waterway 1 from Haldia to Allahabad 85
Figure 19: Location of special economic zones
Source: Maps of India
Concerning the economic geography, more and larger SEZs have been approved and notified
in the southern parts of India than in the north. As the SEZs cover various industrial sectors,
specific cargo needs vary. High-tech industries such as IT, hardware or pharmaceutical
businesses currently account for a large proportion of the operational SEZs. Other priority
areas for SEZ also include the textile and engineering sector. Within the greater catchment
area of NW-1, SEZs can currently be found in the Kolkata region, in the Kanpur district and in
the New Delhi/Noida area. Goods produced in these SEZs include IT equipment, textiles,
handicrafts, leather and jewelry.
Table 16 gives information on most visible exporting SEZs in the NW-1 states of W.B. and
U.P. As one can see, the existing SEZs differ strongly in size with a tendency towards small
units. In means of the manufactured goods, one can detect that many high valued goods
(especially in the sector of IT-goods) are produced in mentioned SEZs. Referring to the IWT
IWT Sector Development Strategy and Business Development Study for Capacity Augmentation of National Waterway 1 from Haldia to Allahabad 86
this is not a commodity, which is normally transported by this mode of transport.
Furthermore, none of the SEZs mentioned above has direct access to navigable waterways.
Table 15: Exporting special economic zones in West Bengal and Uttar Pradesh (examples)
SEZ Location State Goods Size (ha)
Falta Special Economic Zone Falta W.B. Multi-Product 280
M.L. Dalmiya& Co Ltd. Kolkata W.B. IT 49
Bengal Gem and Jewelry Park Salt LakeManikanchan
Kolkata W.B. Gem, Jewellery 16
WIPRO SEZ Salt Lake Kolkata W.B. IT 5
Unitech Hi-tech Structures Ltd Kolkata W.B. IT 10
Tata Consultancy Services Ltd Kolkata W.B. IT 16
DLF Limited Kolkata W.B. IT 10
Moradabad SEZ Moradabad U.P. Handicrafts 421
HCL Techn. Noida U.P. IT 17
Seaview Developers Ltd. Noida U.P. IT 12
AachvisSoftech Pvt. Ltd. Noida U.P. IT 10
Moser Baer Greater Noida U.P. Non-conv. energy 12
WIPRO Ltd. Greater Noida U.P. IT 20
NIIT Techn. Ltd. SEZ Greater Noida U.P. IT 10
Ansal IT City and Parks Ltd. Greater Noida U.P. IT 30
ArthaInfratech Pvt. Ltd. Greater Noida U.P. IT 10
Arshiya Northern FTWZ Ltd. Khurja U.P. IT 51
Source: Government of India, Chamber of Commerce (http://www.sezindia.nic.in/about-osi.asp Data as of 31 Mar 15)
With regard to the ongoing economic and industrial development in the NW-1 corridor, the
implementation of further SEZs, new industrial areas and NIMZs could help bundling economic
activities and promote local goods and businesses. Potential focus industries situated along
the waterway include the textile, handicraft and wood processing sectors as well as agricultural
and building-material businesses. Given the necessary infrastructural premises, IWT could
provide an effective mode to transport-corresponding goods.
Compared to IWT, however, transportation by rail or road usually not only constitutes the
faster mode of transport but also offers better area coverage, thus enabling direct door-todoor
transport and minimizing handling costs that occur when pre- and onward carriage by other
transport modes is necessary. In order to fully exploit the costs benefits offered by IWT it would
therefore be desirable to locate new SEZ units or industrial zones at sites with direct access to
navigable waterways as well as dedicated IWT terminals or jetties. Given the export focus of
many SEZs, the use of IWT could then also help facilitating operational processing, simplifying
customs clearances and speeding up transshipment handling at the often congested sea ports.
Possible application cases for IWT promotion through industrial areas and SEZs will be
discussed in the Consultants’ Part C Report.
3.4 Facilities and infrastructurerequired to enhance modal shift
The aim of this section is to identify facilities and infrastructure required in general or at
identified special economic zones (SEZs), depots, warehouses, container freight stations
(CFSs) etc. in particular to contribute or enhance modal shift. The term “modal shift”
describes the change of transport mode for cargo units. As this study focuses on the
IWT Sector Development Strategy and Business Development Study for Capacity Augmentation of National Waterway 1 from Haldia to Allahabad 87
augmentation of the NW-1 the shift of cargo transport from rail to IWT and from road to
IWT is the shift of interest.
Among others, the following facilities and activities do support modal shift from road/rail
to IWT:
Adequate amount of storage space, both covered and open with modern mechanical
handling facilities (particularly for container and bulk handling);
Multi modal terminals with adequate facilities for handling all different commodities
without disturbing each other;
Ro-ro facilities for heavy lift / Over-Dimensional Cargo (ODC) and automobile cargo;
Haldia: A Vessel Traffic Management System (VTMS) at Dadan Patra Bar near
Mandarmoni;
Haldia: Lease for 141 acres to various private and government organizations entailing
an investment of around Rs 53.5 billion;
Existence of industrial production units within the close proximity of the future Haldia
MMT;
Motivating users to set up their units on the water front;
Financial incentives or subsidies to cover risk during set-up phase of certain supply
chains involving the IWT sector;
Haldia: Opportunity will open up only when the service is available at Haldia MMT. For
some companies a MMT at Haldia would provide immense advantages for their
commodities on the NW-1 as their O/D pairs lay exactly on NW-1 routes. A Haldia MMT
will definitely give a boost to inland-water transportation which was largely untapped
and underutilized despite its high growth potential. A ro-ro facility for automobiles
(such as Maruti-Suzuki from Gurgaon), heavy lift and ODC cargo must be provided at
the proposed Haldia MMT which will surely offer a lot of opportunities to meet the
requirement for heavy lift / ODC transportation along the NW-1 and NW-2;
Kolkata has four long-distance railway stations, located at Howrah (the largest railway
complex in India), Sealdah, Chitpur and Shalimar, which connect Kolkata by rail to most
cities in West Bengal and to other major cities in India. The city serves as the
headquarters of three out of seventeen railway zones of the Indian Railways (IR)
regional divisions: Kolkata Metro Railways, Eastern Railway and South-Eastern
Railway. Kolkata also has rail and road connectivity with Dhaka, capital of Bangladesh;
Good connectivity to hinterland infrastructure like Kolkata is close to Durgapur, a city
which is the base for significant steel industries. The important high-speed railway
track connects Kolkata with Durgapur (distance 158 km) and passes on to Delhi;
Availability of infrastructure: Indian Farmers Fertilizer Corporation (IFFCO) has a plant
project at Paradip, but the project (including a 120m jetty) has stopped due to legal
issues. The Paradip factory is the largest of five more plants in Gujarat, U.P. and Orissa;
IWT Sector Development Strategy and Business Development Study for Capacity Augmentation of National Waterway 1 from Haldia to Allahabad 88
Availability of barges and vessels: IFFCO is planning on using river-sea vessels (RSV)
between Paradip and Haldia sea ports, from thereon using NW-1 to Bihar and U.P.;
Identification of matching O-D-pairs coming up with a transport route providing
suitable for the same barge/vessel in both directions: India's North is producing wheat
which is needed in the South. Uttar Pradesh and Bihar are the largest agricultural
regions. There are large cargo volumes generated to be transported south. In reverse,
rice is available in India's South which is needed in the North. Kolkata region is well
known for rice farming.
Figure20: Aspects enhancing modal shift from road/rail to IWT
Source: Consultant’s illustration
As rail is a direct competitor to IWT, almost each further investment in railway facilities
potentially weakens the development of IWT.
India’s Prime Minister (PM) and Bangladesh’s PM agreed in June 2015 to strengthen their
trading relationship by improvement of customs procedures as well as access to existing and
new infrastructure (road, rail and water). This includes, among others, development of roads
connecting Bangladesh to India’s north eastern states and ports to facilitate more efficient and
faster movement of cargo. Besides this, also the Coastal Shipping Agreement that has been
signed by both nations is expected to boost the bilateral trade mainly by cutting down the
transit times of cargo from Indian ports to Bangladesh. As there is currently no direct
connection between Indian ports and the Bangladeshi Port of Chittagong for example the new
agreement establishes a lower but pragmatic standard for a vessel known as the River Sea
Vessel (RSV). The design of this vessel standard is already available. The RSV category has
significantly lower construction and operation costs compared to the common ocean going
vessels. The Prime Minister’s Office (PMO) stated in August 2015 that the ports of Chittagong
IWT Sector Development Strategy and Business Development Study for Capacity Augmentation of National Waterway 1 from Haldia to Allahabad 89
and Mongla in Bangladesh as well as the ports of Haldia and Kolkata will represent the main
periphery. Further locations are currently under examination to probably enhance the Indo-
Bangla port network by additional appropriate and suitable cargo handling points. This
development is also an advantage for the IWT on the NW-1 as Kolkata and Haldia represent
the south eastern “gate” of the NW-1. If opportunities for onward-traffic (beyond NW-1) are
pushed, supported and/or established on a political level the NW-1 itself can only derive
benefits from this development
3.5 Eastern Dedicated Freight Corridor
The Eastern Dedicated Freight Corridor (EDFC) is a broad-gauge corridor under construction for
an electrified railway covering a total distance of 1,839 km. Within the influence region of the
NW-1, this corridor will have double line.
Figure 21 : Course and construction progress of EDFC
Source: http://dfccil.gov.in/dfccil app/Eastern Corridor.jsp (accessed on 18 Feb. 2016)
The EDFC is projected to cater to a number of traffic streams: coal for the power plants in
the northern region of U.P., Delhi, Haryana, Punjab and parts of Rajasthan from the Eastern
coal fields, finished steel, food grains, cement, fertilizers, lime stone from Rajasthan to steel
plants in the east and general goods. A significant part of this increase would get diverted
to the EDFC. As per the RITES project report, the traffic that would move on EDFC, excluding
the base year traffic (2005-06), is projected in overleaf Table 16.
The total traffic in up-direction is projected to go up to 116 MMT in 2021-22. Similarly, in
the down-direction, the traffic level has been projected to increase to 28 MMT in 2021-22.
As a result, the incremental traffic since 2005-2006, works out to a staggering 91 MMT.
The EDFC will connect with the NW-1 at the later’s final upstream stretch at Allahbad and
Ramnagar MMT (through a dedicated rail link from Mughal Saraj) and its downstream stretch
at Dankuni Rail Junction (on the western site of the Hooghly River opposite Dum Dum).
IWT Sector Development Strategy and Business Development Study for Capacity Augmentation of National Waterway 1 from Haldia to Allahabad 90
Consequently, it will depend on mutually beneficial traffic-sharing agreements whether the
EDFC will provide, from its western end, additional cargo volumes to the NW-1 influence region
of Bihar and northern W.B. or draw traffic from potential through-going waterway voyages
between Kolkata and Varanasi.
Table 16: Traffic projection on EDFC (MMT/year)
Source: http://dfccil.gov.in/dfccil app/Eastern Corridor.jsp (accessed on 18 Feb. 2016)
A Memorandum of Understanding (MoU) was signed between IWAI and the Dedicated
Freight Corridor Corporation of India (DFCCIL) on 19 March 2015 for creation of logistic hubs
with rail connectivity at Varanasi and other places on national waterways. The joint
development of state-of-the-art logistics hubs at Varanasi and other places would lead to
convergence of inland waterways with rail and road connectivity. This would provide a
seamless, efficient and cost effective cargo transportation solution.
3.6 Existing transport demand Cargo that has a potential to pass through the region and to be handled at the future multi-
modal terminals can be broken down into the following seven commodity groups (containing
the major commodities):
1. Thermal coal (imported high-calorie coal, domestic low-calorie coal), coking coal and pet
coke;
2. Building materials (stone chips, cement, sand, gypsum, steel coils/wires/girders);
3. Agricultural inputs (fertilizer (urea), poultry feed, agro equipment);
4. Food grains and flour (wheat, corn, rice, flour);
5. Industrial inputs (steel/iron, manganese ore, spirits, fly ash, limestone, plastics, paper);
6. Consumer goods (motor bikes, cars, container loads); and
7. Over-dimensional cargo.
IWT Sector Development Strategy and Business Development Study for Capacity Augmentation of National Waterway 1 from Haldia to Allahabad 91
Following section gives a description of individual commodity producers and users, and of
specific industries which could potentially use such commodities. Transport demand is
expressed, wherever possible, in terms of concrete cargo volumes.
3.6.1 Haldia – Farakka sector
3.6.1.1 Thermal coal
A 1,000 megawatt (MW) thermal power plant needs 5 MMT per annum of coal and 100 cubic
seconds (cusecs) water. Due to its high water requirement, the plant ought to be located along
large water bodies. India's coal mines are located mainly in seven states: Jharkhand and West
Bengal in the east, Odisha to the south, Madhya Pradesh and Chhattisgarh in the central
region, Maharashtra in the west and the newly-created state of Telengana in the south (see
below Figure 23). However, coal users are located in almost all states except in the north-east
and India's three most northerly states where hydropower prevails. As a result, power plants
to the north and west are served by long-distance rail routes from mines in the eastern and
central regions. Imported coal is also carried to power producers over long distances from
ports in western India to the north. Power plants in coal mining states have to import coal,
owing to an administrative system of long-term contracts between mines and coal consumers
in other states, including those along the coast. Imported coal is being shipped to, among
others, ports at Visakhapatnam, Paradip and Haldia, as closest ones to the NW-1.
IWT Sector Development Strategy and Business Development Study for Capacity Augmentation of National Waterway 1 from Haldia to Allahabad 92
Figure 22: Coal fields and coal-fired thermal power plants
Source: EIA
Eleven existing thermal power plants on either side of the river between Haldia and
Allahabad and 10 more upcoming power projects have boosted the prospect of the NW-1
like never before for transporting imported coal to power stations. In the next five to eight
years total installed capacity will reach well over 15,000 MW. The total requirement of coal
is estimated to be around 70 MMT per annum. Around 14 MMT of imported coal would need
to be carried to these power stations from Haldia. National Thermal Power Corporation Ltd
(NTPC)’s power plants at Farakka and Kahalgaon require imported coal amounting to more
than 5 MMT per annum which are brought through Paradip and Haldia ports. But due to
capacity constraints of railways, these power plants regularly face shortage of coal.
Further,due to low depth available at Haldia port, bigger ocean going vessels cannot co me
there, due to which 70% of imported coal is received at Paradip Port and from there it is
transported by railways. Both these power plants are located along the NW-1 quite close to
the river bank. All the existing and proposed thermal power plants along the NW-1 are
potential shippers for IWT if IWAI can provide assured channels of 2.5 m depth or more. Up
to 25 MMT of coal could be transported by IWT mode on NW-1 every year. The resource
areas for domestic low-calorie coal are in larger distance to the two multi-modal terminals in
the Haldia-Farakka sector. As the nearest MMT is far away, they could be shipped only
through terminals in other survey areas.
3.6.1.2 Fly ash
With average ash content of 25% in coal, total production is estimated to be around 17.5
MMT per annum. With the use of fly ash in the manufacturing of cement and in the
construction of roads, the NW-1 could be utilized for evacuation of fly ash from power plants
on its banks. Thereafter, the fly ash moved to respective destinations through multi-modal
transport systems. One prominent example is presented as OD-pair in the following:
IWT Sector Development Strategy and Business Development Study for Capacity Augmentation of National Waterway 1 from Haldia to Allahabad 93
The Consultants have identified almost 270,000 tons of fly ash transported by barge from
Kolaghat (W.B.) to Narayanganj (Bangladesh) over an 820 km distance, a voyage which takes
almost five days. This OD-pair is analyzed further in Chapter 5.3.
Table 17: Feasible cargo OD-pair via Kolaghat – Fly ash
Origin Destination Transport
Mode Distance
[km] Travel Time Est. [days]
Volume 2014 [tons]
Kolaghat (W.B.)
Narayanganj (Bangla) Barge 820 4.9 266,461
Source: Consultants’ Market Survey, August-October 2015; calculations by Transport Model
3.6.1.3 Stone chips
The principal centers of production are Pakur (W.B.), Munger in Monghyr District (Bihar) and
Chunnar in Mirzapur District (U.P.).
3.6.1.4 Cement
Cement factories are to be found in most states except the north-east. In the Haldia-Farakka
region, ACC Ltd operates two cement factories in 50 km distance from each other:
1. Damodar Cement Works in Madhukunda of Purulia District (W.B.), and 2. Sindri Cement in
Dhanbad District (Jharkhand). As the largest cement and concrete producer in India, ACC Ltd
constitutes one of the biggest customers of the domestic coal industry, and is a considerable
user of the country’s transport network services for inward and outward movement of
materials and products.
3.6.1.5 Sand
While silica sand is used mainly for glass factories, normal sand is predominantly used for
construction.
3.6.1.6 Iron & steel
Steel plants are mostly located close to the iron ore deposits in the eastern, central and
southern regions. BABA Ispat Pvt. Ltd in Raniganj (W.B.) smelts iron & steel mainly for local
supply from Raniganj to Burdwan (W.B.). Bhushan Steel Limited is the largest manufacturer
of auto-grade steel in India. At its Sahibabad plant in Ghaziabad, Uttar Pradesh, it has a mill
which produces the widest sheets in India for the automotive industry. Among others, the
company has in West Bengal a 2-MMT steel plant at Salanpur in Bardhaman district,
northwest of Durgapur, and another plant at Bangihatti, near Dankuni.
3.6.1.7 Fertilizer
Until the year 2005, India was almost self-reliant in manufacturing capacity of urea. Since
then, the consumption-production gap has widened.
IWT Sector Development Strategy and Business Development Study for Capacity Augmentation of National Waterway 1 from Haldia to Allahabad 94
Table 18: Year-wise consumption, production and imports of fertilizers (billion tons)
Year Consumption Production Import 2000-01 1.67 1.47 0.21 2001-02 1.74 1.46 0.24 2002-03 1.61 1.45 0.17 2003-04 1.68 1.43 0.20 2004-05 1.84 1.54 0.28 2005-06 2.03 0.56 0.53 2006-07 2.17 1.61 0.61 2007-08 2.26 0.47 0.76 2008-09 2.49 1.43 1.02 2009-10 2.65 1.62 0.91
Source: Department of Fertilizer, Govt of India
The three states of U.P., W.B. and Bihar contribute almost one fifth to the national
production. In U.P., the hinterland districts contribute less than that proportion to the state
production, whereas in Bihar and in W.B. the hinterland contribution amounts to almost
100%. TATA Chemicals Ltd is located in Haldia in about 6 km distance from the future Haldia
MMT. The company constitutes the largest producer of urea fertilizer in Eastern India which
it distributes mainly by railways into all of W.B., Bihar, Jharkhand, Orissa and Assam / Tripura.
Plants are located in U.P. near Allahabad (IFFCO at Phulpur and Indo Gulf at Jagdishpur), in
Bihar at Barauni, and in W.B. at Durgapur and Haldia (Tata Chemicals). Overleaf Figure 24
depicts the location of fertilizer plants:
Figure 23: Location of fertilizer companies
Source: www.mapsofindia.com
The total consumption of fertilizer in India is estimated to be around 25 MMT per annum, of
which around 10 MMT per annum are consumed in U.P., Bihar and W.B. There is substantial
potential to transport fertilizers from plants to various locations in these three states. A part
of this could be moved by inland waterways. Hubs on the NW-1 are required for distribution
purposes, ideal locations would be the IWAI facilities at Allahabad, Simariya (Bihar), and
Kolkata and/or Haldia.
3.6.1.8 Agro-equipment
Agro Suppliers Syndicate and Debson Pumps Pvt Ltd are both located in Kolkata and deal with
agro-equipment and spares. Other suppliers in Kolkata are Rescon (India) Pvt Ltd, Saimaa
IWT Sector Development Strategy and Business Development Study for Capacity Augmentation of National Waterway 1 from Haldia to Allahabad 95
Agrotech, and Durga Bhawani Enterprises in Howrah. In states other than W.B., prominent
examples are MS Shahdeo Agro Equipment Plant in Ranchi (Jharkhand) and Kapila Krishi
Udyog Ltd in Kanpur (U.P.).
3.6.1.9 Food grains and flour
India's north is producing wheat which is needed in the south; the food-grain surplus is
mainly confined to the northern states; transportation involves long distances. U.P. and Bihar
are the largest agricultural regions where large volumes are generated for transportation to
the south. There is a huge requirement of food grains in W.B. and the North Eastern states,
which are transported by road/rail as of now. Wheat yields in irrigated areas of northern
India (Punjab, Haryana, and Western U.P.) are above 4.5 tons per hectare, while yields in
central and western states (Gujarat, Madhya Pradesh, Rajasthan, rest U.P., and Bihar) are
relatively lower (2.4-2.8 tons per hectare). India’s 2015/16 wheat exports are forecast to
decline to 2.0 MMT, with exports restricted to neighboring countries like Bangladesh and
Nepal. Despite a zero import duty policy, imported wheat is relatively more expensive than
local wheat due to shipping, clearance, and inland transport costs. Shri Shyam Agro Bloatach
Pvt Ltd in Raniganj (W.B.) produces wheat flour (‘atta’), flour (‘maida’) and cattle feed mainly
for local supply at Durgapur, Asansol and Kolkata. In reverse, rice is available in India's south
which is needed in the north; the Kolkata region is well known for rice farming. Surplus rice
growing states like Punjab, Haryana, U.P., Andhra Pradesh and W.B., Orissa and other eastern
states follow intensive rice-wheat or rice-rice cropping systems. Most of the hybrid rice is
cultivated in eastern India (e.g., eastern U.P., Bihar, Jharkhand, and Chhattisgarh).
3.6.1.10 Crude vegetable oil
There exist three plants of JVL, of which one each is located in Haldia, Bihar and Varanasi.
Minor producers are Adani, Rivert Oil and Reliable.
3.6.1.11 Other raw materials
United Phosphorus Ltd is located in Durgachawk Town near Haldia. This company produces
raw materials for insecticides.
3.6.1.12 Consumer goods
Motor bikes, cars, container loads with various contents are classified as consumer goods.
JMB Group is one of India’s largest groups with about 3,000 employees at all major and
several non-major ports - apart from inland locations - and handles over 6,000 vessels
annually. The group is focused on international, coastal and inland transport.
3.6.1.13 Over-dimensional cargo (ODC)
With 11 more power plants scheduled to be commissioned within the next five to eight years,
the requirement for ODC is expected to be around 2 MMT. At present, ABC India Ltd in
Kolkata for instance owns 162 hydraulic axles plus 12 prime movers and a coastal deck loader
barge of 1,948 dead-weight tons (dwt) for carriage of heavy cargoes.
IWT Sector Development Strategy and Business Development Study for Capacity Augmentation of National Waterway 1 from Haldia to Allahabad 96
3.6.2 Farakka-Munger sector
3.6.2.1 Around Sahibganj
Stone chips and aggregates are the only commodity that is mined at Sahibganj and
surrounding regions and transported to several regions mainly on the north of Bihar.
Sahibganj, Sakrigali, Mirzachowk, Bakudi, Barharwa and Pakur are the regions where stone
chips are mined and loaded for further shipping across regions on the north of Bihar. Stone
chips crushers are located at an average distance of 3-4 km from the loading point at
Sahibganj railway station.
3.6.2.2 Sakrigali
Sakrigali is a small hamlet which is located 10 km away from Sahibganj and is located on the
banks of the Ganges River. The proposed MMT at Sahibganj is located at Sakrigali. There are
numerous stone chips crushers located in Sakrigali and generate huge amount of stone chips
which are transported to regions on the north of Bihar by road, rail and water.
3.6.2.3 Mirzachowk
Mirzachowk is a town with similar demographic characteristics as Sahibganj and is located
about 15 km west of Sahibganj. Stone chips and aggregates are the only commodity that is
loaded onto rakes at Mirzachowk railway station. Stone crushers and mines are located
within a radius of 5 km from the railway station.
Stone crushers and mines located in Sahibganj, Sakrigali and Mirzachowk also serve the
demand in northern Bihar by road transportation.
3.6.2.4 Rajmahal
Rajmahal is a city and a notified area in Sahibganj district in the Indian state of Jharkhand.
Rajmahal is the only sub-divisional town in Sahibganj district, located along the banks of the
Ganges River. As of 2001 India census, Rajmahal had a population of 17,974. Males constitute
52% of the population and females 48%, giving an indication of the hard physical work in the
region. Silica sand mining is carried out along the banks of the Ganges River in areas
surrounding Rajmahal. Mangalhat is the area which is home to silica sand mining industries
located at a distance of 7-8 km from Rajmahal railway station.
3.6.2.5 Pirpainti
Pirpainti is a sub township located in Baghalpur district of the Indian state of Bihar. It is the
biggest panchayat in Bhagalpur, Pirpainti population counts 9,020 people. Average sex ratio
of Pirpainti village is 885, which is lower than Bihar state average of 918.
The Cabinet Committee on Economic Affairs has approved the elaboration of a study on three
new rail lines: A new broad gauge line between Ajmer and Sawai Madhopur via Tonk in
Rajasthan, construction of a new rail line between Gadag and Wadi in Karnataka and a new
broad gauge line between Pirpainti-Jasidih (Mohanpur) in Jharkhand.
IWT Sector Development Strategy and Business Development Study for Capacity Augmentation of National Waterway 1 from Haldia to Allahabad 97
3.6.2.6 Bakudi
Bakudi is a small town in Jharkhand where in significant amount of stone crushers are
located. There is a continuous activity of loading stone chips onto rakes at Bakudi railway
station.
3.6.2.7 Barharwa
Barharwa is a small town in Sahibganj district in the Indian state of Jharkhand. Barharwa is
surrounded by the Rajmahal hills all around except towards east. As of 2011 India census,
Barharwa had a population of 12,617. The population growth rate of Barharwa is 1.14%.
3.6.2.8 Pakur
Pakur is a district of Jharkhand and is famous for its stone and bead industries. At Pakur, the
Ganges River, flowing south-southeast, begins its attrition with the branching away of its first
distributary, the Bhāgirathi-Hooghly, which later joins with other tributaries to become the
Hooghly River. Pakur district has an area of about 696 km² and a population of 899,200 (2011
Census). Males constitute 53% of the population and females 47%. Pakur has an average
literacy rate of 50.2%, lower than the national average of 74.4. The economy of the district
is predominantly agricultural; still, the district is also endowed with mineral wealth like black
stone, fire clay and coal. However, infrastructural constraints have inhibited the growth of
mining and allied industries. One of the main businesses of the city is mining and crushing. It
is also known for the manufacturing of crushing and screening equipment. Pakur is also the
place where the first indigenous jaw crusher was manufactured by Bhagwati Prasad
Agarwalla. Since last decade there has been an enormous activity of coal excavation in the
area as well. It has one of the biggest reserves of coal in the world. Currently only one block
of coal is active in the region. It has been allotted to the Punjab State Government for their
captive thermal power plants. The excavation work on behalf of the Punjab State
Government is being done by PANAM. It is a private - public joint venture between Punjab
Government and AMTA. Approximately, 500 mines and 800 crushers are in operation with
the support of huge labor force. Black stones of Pakur are of superior quality. Pakur railway
station is one of the busiest railway stations in terms of loading of stone chips and coal from
the nearby mines. Stone chip mines are located within a radius of about 5 km from the
railway station and the coal mines are located at Amrapara village. Amrapara is located at a
distance of 50-60 km from Pakur railway station.
3.6.2.9 Baghalpur
Baghalpur is a town situated on the southern bank of the Ganges River in the state of Bihar.
As of the 2011 India census, Bhagalpur town has a population of 410,210 with a metro
population of around 0.41 million, while the district as a whole has a population of 3 million.
Bhagalpur registered average annual population growth of 3.72%, between 2006 and 2010.
It is the second largest town in Bihar in terms of urban population next only to Patna. Males
constitute 54% of the population and females 46%. Bhagalpur has a high average literacy rate
of 81.16.
IWT Sector Development Strategy and Business Development Study for Capacity Augmentation of National Waterway 1 from Haldia to Allahabad 98
Figure 24: Transport and NW-1 loading stations at Bhagalpur
Source: Consultants from Google Maps
The thermal power plant at NTPC Kahalgaon (see next section) falls under Bhagalpur district.
The largest industrial belt of the district is Barari industrial Area, with Kahalgaon industrial
area being equally important. The Government of India has established a hand-loom park,
while a food park has been established by private entrepreneurs.
Roads: NH80 and NH31 pass through Bhagalpur district. The Vikramshila Setu connects NH80
to NH31. The city has a good road network. Bhagalpur city has approximately 200 km road
length. The transport system is good, with cars, taxis and cycle rickshaws easily available. In
the city area around 10,000 autos, 500 private taxis and 200 buses are on the road. Bhagalpur
is well connected to the major cities of Patna, Kolkata, Ranchi, Jamshedpur, Munger, Gaya,
etc. by various national and state highways.
Railways: Bhagalpur Junction railway station is situated on the Khana- Quil loop line which
serves Bhagalpur with numerous trains. It is the 3rd busiest railway line in Bihar. About 40
pairs of express trains and 10 pairs of passenger trains operate on this line. Bhagalpur
Junction is an A1 grade railway station. It constitutes the highest revenue earner in the Malda
Rail Division and third major railway station of Eastern Railway after Howrah and Sealdah.
Bhagalpur is well connected with Delhi, Mumbai, Kolkata, Bangalore, Ajmer, Kanpur, Patna,
Guwahati, Surat, Munger and other cities. In the 2008 Rail Budget, Bhagalpur was upgraded
to a Railway Division. The new rail lines which are under construction are Sultanganj to
Deoghar, Bhagalpur to Dumka, Bhagalpur- Godda via Hanshdiya, and Banka to Deoghar. It is
also the originating station for many superfast and express trains.
3.6.2.10 Kahalgaon
Kahalgaon is a town in Bhagalpur district in the State of Bihar. Kahalgaon Super Thermal
Power Station (KhSTPP) is located in Kahalgaon (see overleaf Figure 26). The power plant is
one of the coal-based power plants of NTPC. The coal for the power plant is sourced from
Rajmahal Coal Fields of Eastern Coalfields Ltd (ECL). Source of water for the power plant is
the Ganges River. The total installed capacity of the plant is 2,340 MW. The NTPC thermal
power plant at Kahalgaon needs 45,000 metric tons of coal every day for optimal generation
IWT Sector Development Strategy and Business Development Study for Capacity Augmentation of National Waterway 1 from Haldia to Allahabad 99
of power at 2,340 MW; but, due to non-supply of coal by ECL, in the past the generation had
steadily decreased to make the power situation grim in Bihar.
Figure25: Transport and NW-1 loading stations at Kahalgaon
Source: Consultants from Google Maps
Coal supply problems: Two projects that were perennially short on coal through the whole of
last year were NTPC’s 2,340 MW Kahalgaon station in Bihar and the 2,100 MW Farakka
station in W.B. The irony is that while Kahalgaon is located right on the pithead (at the coal
mine itself, so that there is no need to transfer the coal to the plant), Farakka is not too far.
And both are among stations that form the backbone of the eastern region’s generation
sector. While the Farakka station has infrastructure in place to operate at over 90% plant
load factor, the utility in 2014 was mostly operating at only 70% because of the short supply
of coal. The shortfall in domestic supplies is being made up by imports, which, in turn, jacks
up tariffs. The problem here is that most coal reserves in the east are located in restive areas.
NTPC’s power plants at Farakka and Kahalgaon require imported coal amounting to more
than 5 MMT per annum which is brought through Paradip and Haldia ports. But due to
capacity constraints of railways, these power plants regularly face shortage of coal. Further,
due to low depth available at Haldia port, bigger ocean-going vessels cannot come there, due
to which 70% of imported coal is received at Paradip port and from there transported by
railways. Both these power plants are located along the Ganges River (NW-1) quite close to
the river bank. IWAI had been working with NTPC on the project of transportation of
imported coal by IWT mode from Haldia to Farakka and Kahalgaon. In July 2010, NTPC gave
written commitment of transportation of 3 MMT of imported coal from Haldia to Farakka by
IWT mode for a period of seven years. Thereafter IWAI and NTPC developed a project
envisaging total investment from the private sector. After open competitive bidding M/s
Jindal ITF Ltd were selected as operator, and the project has been commissioned recently.
NTPC has a dedicated railway line between Farakka and Kahalgaon power plants. Hence it is
likely that they may transport further 3 MMT of imported coal for Kahalgaon power plant to
Farakka by IWT mode. Since there are several existing thermal power plants along the NW-1
and many more are going to come up, success of this pioneering project may pave way for
many more projects for transportation of coal on the NW-1.
IWT Sector Development Strategy and Business Development Study for Capacity Augmentation of National Waterway 1 from Haldia to Allahabad 100
3.6.3 Munger-Ballia sector
The state of Bihar constitutes an important center of agricultural production:
Maize accounts for 1.5 MMT (or 10% of country production);
Sugar cane produces 13.00 MMT;
Litchi production is 0.28 MMT (Bihar contributes 71% of national production);
Makhana levels are 0.003 MMT (Bihar contributes 85% of national production);
Mango is 1.4 MMT (13% of national production);
Vegetable production is 8.6 MMT (9% of national production);
Honey Production is 1300 tons (13% of national production);
Aromatic Rice 0.015 MMT;
Milk Production: 4.1 MMT;
Fishery production levels are 0.03 MMT.
Of these volumes, Annex 4 lists the larger quantities of major commodities per district which
had been identified through the market survey.
Figure 26: Munger-Ballia sector with major industrial centers
Source: Google maps; Consultants’ information
3.6.3.1 Patna
Bihar’s capital Patna has long been a major agricultural hub and center of trade. Its most
active exports are grain, sugarcane, sesame, and medium-grained Patna rice. There are
twelve sugar mills in and around Patna. Bihar State Sugar Development Corporation (BSSDC)
sold xix of these mills on lease basis to different parties through tenders issued by SBI Caps
earlier. Lauria and Sugauli sugar mills have been taken over by oil major Hindustan
Petroleum's subsidiary, HPCL Biofuels Ltd, which has invested in generating power and
manufacturing ethanol too. Raiyam and Sakari sugar mills are being revived by new investors
and are likely to become operational in a year. The remaining two sugar mills at Motipur and
Bihta have been sold on lease to Indian Potash Corporation and Pristine Logistic and Infra
Project Private Ltd respectively.
IWT Sector Development Strategy and Business Development Study for Capacity Augmentation of National Waterway 1 from Haldia to Allahabad 101
3.6.3.2 Gaya
Gaya is the second biggest economy contributor after Patna for Bihar. It has a large number
of household industries like production of agarbattis, production of tilkut and lai, stone
crafting, power looms, small scale manufacturing industries, packing industries, plastic
products industries, scrap industries and hand looms. Gaya functions as a service center for
the surrounding towns and villages. There are no large scale industries / public sector
undertakings in the city.
3.6.3.3 Munger
Munger city has many industries in and around the city. Indian Railway has one of Asia's
largest and oldest railway workshops at Jamalpur. Munger has India's oldest tobacco
manufacturing unit, started in 1905. In mid-2014, ITC Limited set up its first dairy plant in
India in Munger city. Finally, Munger city has many small scale industries in and around the
city.
3.6.3.4 Barauni
Barauni in Begusarai district is another important industrial town in Bihar. The town is
connected with North Bihar via a railway-cum-road bridge across the Ganges River. The major
industries here were/ are:
Indian Oil refinery,
Barauni Thermal Power Station BSEB,
Hindustan Fertilizers Corporation (page is in Hindi),
Barauni Dairy,
Bihar carbon Pvt.Ltd,
Neo Carbon Pvt.Ltd,
Premier Industries,
Graphite India,
Sortedbyte Business Solutions.
3.6.3.5 Barh
Barh Super Thermal Power Station or NTPC Barh is located in Barh in the Indian state of Bihar.
NTPC Barh is located barely 4 km east of the Barh sub-division on NH31 in Patna district. The
project has been named a mega power project, and is owned by Indian energy company
National Thermal Power Corporation (NTPC). This TPP has a 1,980MW (3x660 MW) block
(Stage-1) and a 1,320MW (2x660 MW) extension (Stage-2).
3.6.3.6 Ballia
Ballia City is district headquarters and commercial Market of this district. Ballia holds one
government sugar mill and one cotton weaving industry. Although Ballia's core occupation is
agriculture, there exist some small industries.
IWT Sector Development Strategy and Business Development Study for Capacity Augmentation of National Waterway 1 from Haldia to Allahabad 102
3.6.4 Ballia-Allahabad sector
3.6.4.1 Coal
Imported high-calorie coal: There are several industries around Allahabad, of which two are
power plants (NTPC): IFFCO and the Jaypee Group.
Domestic low-calorie coal: There is a coal mandi in Varanasi (Chandasi Coal Mandi) where coal
is purchased mainly for brick burning.
3.6.4.2 Building materials
Two cement plants are located in the Varanasi region: one of the Jaypee Group, the other
one of ECO Cements Limited:
1. Jaypee Plant produces 2.5 MMT cement per year with destination U.P. and Bihar. The plant
is in 9 km distance from the Ganges River, 30 km downstream of Varanasi.
2. ECO Plant produces 0.9 MMT cement per year for Bihar (70%), W.B. (15%) and U.P. (15%).
3.6.4.3 Agricultural inputs
Fertilizer: Client for urea fertilizer is the IFFCO. IFFCO has a plant project at Paradip, but the
project (including a 120m jetty) has stopped due to legal issues. The Paradip factory is the
largest of five more plants in Gujarat, U.P. and Orissa. IFFCO also owns five plants in the
Allahabad area. IFFCO is planning on using RSVs between Paradip and Haldia sea ports, from
thereon using the NW-1 to Bihar and U.P.
3.6.4.4 Food grains and flour
Wheat: India's north is producing wheat which is needed in the south; U.P. and Bihar are the
largest agricultural regions; there large cargo volumes are generated to be transported south.
Rice: In reverse, rice is available in India's south which is needed in the north; Kolkata region
is well known for rice farming.
Flour: There are many flour mills around Varanasi, most of which are in the Ramnagar
industrial area.
3.6.4.5 Edible oil
Crude vegetable oil: There exists a plant of JVL in Varanasi.
IWT Sector Development Strategy and Business Development Study for Capacity Augmentation of National Waterway 1 from Haldia to Allahabad 103
4 Freight Costs and Tariffs
4.1 Capital-cost recovery mechanism of railway system
Finding resources to finance rail infrastructure is one of the key challenges faced by Indian
Railways (IR). Even the core rail network has to be upgraded steadily to keep pace with
technological development in order to ensure performance improvement and to adjust the
infrastructure to provide sufficient capacity. Thus, covering the operational expenses is not the
only aim IR has to reach but also generating adequate resources for replacement and planned
investments.
The main clusters of rail investments could be defined as follows:
• Infrastructure (capacity augmentation by new lines),
• Rolling stock (additional or replaced ones),
• Stations and terminals (as the major traffic knots) and
• Technological upgrade and modernization of existing assets.
The expenditure on railway rolling stock and infrastructure as a percentage of total transport
expenditure has declined considerably. Measured as a percentage of total transport sector
expenditures the rail-related expenditures used to be about 56% in the 7th Plan (1985-90) and
have been reduced to 30% in the 11th Plan (2007-12). In the same period the road sector has
experienced an increase in investments. The share of rail expenditures in overall GDP has been
static at 1% over the years and has gone down to 0.9% in the year 2012/13.
Capital cost in general can be recovered by the implementation of user charge. By this for
example the investment for provision of electricity, water and handling facilities could be
recovered by the calculation of appropriate fees. The same is valid for wagons and other rolling
stock as their utilization has to be “labeled with a price tag”. A system should be developed
the enables IR to consider for example depreciation and internalized costs by structuring and
establishing a pricing system through user charges. An actually on international level common
measure for infrastructure cost recovery is the publishing and invoicing of infrastructure usage
fees. Their definition could be influenced by the type of traffic (e.g. passenger or cargo traffic),
by the gross weight of the train (mainly heavy cargo or light cargo) and length of train, chosen
track route (e.g. busy route, special equipped route, fast track route). In Europe for example
the establishment of noise-depended usage-fees is on its way. The trains operating rails cars
with special noise-reduced wheels sets and/or with special noise-reduced breaks get a lower
fee per route-km than those not providing noise reduction measures. During the elaboration
of this report no kind of established infrastructure usage fees have been identified.
In 2007 a report about the difficulties of capital recovery due to missing agreements and/or
contracts with users of rail sidings has been published. This report recommended among
others:
• Indian Railways draws up an action plan for execution of agreements where they are
wanting, and carry it out in a time bound manner.
• The dues to be recovered from the siding owners should be assessed on priority and action
taken for recovery thereon.
IWT Sector Development Strategy and Business Development Study for Capacity Augmentation of National Waterway 1 from Haldia to Allahabad 104
• All disputes regarding payments between siding owners and railway problems should
be resolved on priority, within a specific time period.
Besides over-proportional direct and cross-subsidies, external financing of projects has to
be considered. Examples are the Eastern DFC Project which mainly financed through
multilateral/bilateral debt covered by the World Bank and Japan International Cooperation
Agency (JICA). The Dankuni–Sonnagar section of the Eastern DFC is to be implemented
through public private partnerships (PPP), and the balance requirement would need to be
met through budgetary support. IR has set an ambitious target for PPP that the share of
internal resource generation is expected to fall from 35% in 2016 to 20% in 2017 – the last
two years of the in the 12th Five-Year Plan. Investments in Railways can also be supported
by setting up PPP-structure (public-private-partnership). A procedure globally as well as in
India proved in sectors like ports, telecommunications, energy generation and supply,
constructing and operating airports and of course during road (mainly highways)
construction and operations. PPP projects related for example to rolling stock
manufacturing, modernization of railway stations, multimodal terminals and logistics parks
and probably even freight train operations, offer suitable opportunities for private
participation.
Capital cost recovery could also be achieved by enhancing the existing service portfolio and
establishing new source of income. An important aspect of JR East (one of the largest rail
companies in Japan) business is for example that it earns almost 30% of its revenues from
non-transportation business. Non-transportation business at JR East includes station space
utilization (e.g. shops, restaurants, advertising), shopping centers and office buildings. Like
JR East, DB Deutsche Bahn AG (German State-owned Rail Company) generates revenues by
nonrail business. At DB these are almost 50% annually. It runs almost 25,000 passenger
trains per day and produces 1 billion train-km only for freight operations annually. Total
revenue of DB was 39.7 billion Euros in 2014. DB is increasingly becoming active in markets
outside Germany with 41% of the revenues coming from international operations. It is one
of the leading logistics providers globally and handles more than 1 MMT of air freight as well
as almost 2 million over sea standard containers TEU. The generation of additional revenues
in order to strength the core business could also be of strategic importance for IR.
4.2 Current freight costs and rates
This section deals with the current freight transport costs and rates (prices) of the three
different transport modes that are rail, road and IWT.
4.2.1 Railway
IR is the dominating rail agency in India. Its freight portfolio mainly consists out of nine major
commodity groups, namely coal, raw materials, iron and steel, iron ore (export as well as
domestic), cement, food grain, fertilizer, mineral oil and container services (ex-/import as
well as domestic).
Apart from the existing segments where railway already has a dominant presence, several
other opportunities are expected to become more and more suitable. These are in respect
IWT Sector Development Strategy and Business Development Study for Capacity Augmentation of National Waterway 1 from Haldia to Allahabad 105
of commodities for example fast moving consumer goods, fly-ash and automobiles. This
development would be supported and triggered by establishing partnerships with logistics
providers and investing in special-purpose rolling stock and transportation services.
In this particular case, costs are the amount of money a railway company has to spend in order
to provide a suitable service. These are expenditures for staff (administrative and operational),
rolling stock (rail cars and locomotives), infrastructure (utilization fee or even construction and
maintenance), energy (diesel or electricity) and further services (e.g. insurance and financing).
There are fixed costs for e.g. staff and rolling stock which occur independently from
transported cargo volumes. On the other side there are variable costs that occur if transport
services are executed. The variable costs include among other energy/fuel and infrastructure
abrasion or fees as they in general only occur during operations.
Looking on rail as an integrated system covering transport services and infrastructure
provision, the shares of the relevant categories are as shown in the following table. Shares are
listed in descending order.
Table 19: Variable costs of rail services
Cost Items7.5
Source: Based on Planning Commission “Total Transport System Study”
The freight rate is the price charged by a railway company for moving a commodity from origin
to destination (for freight details see Table 20 “Choice of Freight Rates (valid since April 2015)
in Rs per km”). The actual amount charged varies based on the commodity, the weight to be
handled and the distance to be travelled. A rate lower than offered by the competitors or
competing transport modes respectively is a competitive rate. If the absolute freight is equal
or even higher in comparison to the competing transport modes and companies, the service
has to be made more attractive by added incentives or added supplementary services like
handling of cargo documents, coordination of pre- and on-carriage or longer payment terms.
IWT Sector Development Strategy and Business Development Study for Capacity Augmentation of National Waterway 1 from Haldia to Allahabad 106
In general the freight rate is determined by what a client is willing to pay, the railway company
is willing to accept, and the competition with other transport modes is allowing to be charged.
The freight rate is together with the product itself, the extent of promotion for the product,
and placement of product one of the business variables over which the rail companies can
exercise some degree of control.
The purchase of rail transport should be fixed by a contract, left to be determined by an agreed-
upon formula at a future date, or discovered or negotiated during the course of dealings
between railway company and client (forwarder, manufacturer etc.). The manipulation of
prices is not allowed as well as a misleading indication of price such as charging for items that
are reasonably expected to be included in the offered freight rate.
IR owns the infrastructure, most of the handling facilities and provides transport services at
the market. At the end of the fiscal year 2012/13 the company provided a rail network of about
65,436 route-km. The network consists out of three different track gauges. The main share is
broad gauge infrastructure covering 57,140 route-km. The remainder route-km are 5,999 km
of metric gauge and 2,297 km of narrow gauge infrastructure. Out of the total route-km 20,884
km are electrified which equals almost 32%. A route-km measures the length of a rail route
while the fact if it is a single- or double-track route stays unconsidered. If all tracks and sidings
are measured separately it totaled up to a track-km length in 115,833 km in 2013.
On 31st March 2013 IR operated 5,345 diesel-powered, 4,568 electric-powered and 43 steam-
powered locomotives (total of all gauges). Concerning the rail cars or wagons the Indian
Railways operated at the end of the fiscal year 2012/13 around 48,037 passenger carriages,
9,841 electric-multiple units (also for passenger transportation), 39 rail cars and 6,614 “other
coaching vehicles” (total of all gauges). At the same date 244,731 wagons have been operated
for cargo transport.
Figure 27: Development of total traffic earnings and cargo traffic earnings (in Rs million)
Source: Indian Railways Key Statistics 1970/71 to 20 12/13; Consultant´s illustration
The figure above shows the development of earnings generated by transport services (traffic)
provided by IR from the fiscal year of 2008/09 to 2012/13. Over this period the share of
IWT Sector Development Strategy and Business Development Study for Capacity Augmentation of National Waterway 1 from Haldia to Allahabad 107
earnings generated by cargo traffic is 67.3% in average (within a range of 66.5% to 68.9%).
The gross traffic receipts increased by 11.6% annually in average during the illustrated period
while the growth in 2012/13 have been 18.8% which is distinctly above the previous years
and totals Rs 1,237.3 billion. Earnings generated by cargo traffic increased by 12.5% in
average with again stronger growth in 2012/13 by 22.6% which totals Rs 852.6 billion. Based
on the available statistic a distribution of earnings to the NW-1 hinterland is not possible
sofar. But the prior considered earnings show the importance of cargo rail traffic for the
whole rail industry.
Construction costs of a single lane route are about Rs 60 million per km and of a double track
route about Rs 100 million per km. Construction costs of tracks (steel tracks, wooden sleepers,
and ballast bed) cover about 40% of the total cost and have to be replaced in general every 40
years. Construction costs of bridges are about 20% of the total cost and they have a life of 100
years. Costs for necessary buildings (e.g. stations, signal tower, basic handling facilities) are
about 5% of the total cost and have a life of 80 years. The remainder share is used for further
construction works like embankment. Maintenance costs have been reported as Rs 1.0 million
per track-route km per month.
Figure 28: Distribution of construction costs
Source: Market surveyor / stakeholder interview with Indian Railways
The consideration of expenses for infrastructure and rolling stock for repair and maintenance
as well as for operations could not be distributed separately for passenger and cargo traffic.
The following figure shows the development of the ordinary working expenses (without
appropriation to rail funds). The average development of the ordinary working expenses is
about 14.7% annually - coming from Rs 547.32 billion in 2008/09 ending up in 2012/13 by Rs
841.84 billion. The average share of maintenance and repair (M&R) expenses over the shown
period are about 38.9%. The average share of operating expenses is a little bit higher lying by
slightly more than half of the costs reaching 50.9%. The remainder %-share to 100% is
expressed as “other expenses” which have not been identified more detailed.
IWT Sector Development Strategy and Business Development Study for Capacity Augmentation of National Waterway 1 from Haldia to Allahabad 108
Figure 29: Development of ordinary working expenses (in Rs million)
Source: Indian Railways Key Statistics 1970/71 to20 12/13; Consultant´s illustration
The total M&R expenses in 2012/13 have been by Rs 309.72 billion while the total operating
expenses reached Rs 446.13 billion.
The overall development of these two types of expenses is that the share of M&R expenses in
slightly decreasing over the years while the share of operating expenses is slightly
The following figure shows the development of net ton-kilometers (ton-km). These express
how many kilometers the complete cargo volume measured in tons has been transported.
Weights of rolling stocks are not included. Again the nine mayor commodities are shown. Over
the complete period coal has been the dominant commodity. It reaches more than 303,000
million ton-km in 2012/13. Second largest commodity group has changed during the years. It
has been iron ore in 2008/09 and 2009/10 with 50,798 and 53,947 million ton-km, to be
superseded by cement for the next two years with 56,952 million ton-km in 2010/11 and
63,036 million ton-km in 2011/12. In 2012/13 food grains have been ranked second with
71,335 million ton-km. Except for iron ore all commodities show an increase in ton-km. Iron
ore is declining to 38,091 million (coming from 50,798 million on 2008/09).
Figure 30: Development of ton-km by commodities (in million ton-km)
Source: Indian Railways Key Statistics 1970/71 to20 12/13; Consultant´s illustration
IWT Sector Development Strategy and Business Development Study for Capacity Augmentation of National Waterway 1 from Haldia to Allahabad 109
The figure below shows the distribution of commodities with the individual percentage share in
regards of total ton-km of the nine dominant commodities groups in the year 2012/13.
Figure 31: Distribution of %-share of ton-km by commodities in 2012/13
Source: Indian Railways Key Statistics 1970/71 to20 12/13; Consultant´s illustration
The statistics do also mention the earnings per ton-km in average. The average covers all com-
modities and is only valid for cargo traffic. The trend of the development is consequently
positive. There is a slight annual increase from 2008/09 until 2010/11. In detail the average
earnings have been 93.84 Paise in 2008/09 increasing by 0.99% until 2009/10 reaching 94.77
Paise. Until 2010/11 the average rose with 2.34% up to 96.99 Paise per ton-km. The in-crease
for the following year became a bit more dynamic reaching 4.62% or 101.47 Paise per ton-km
to make a comparatively huge step in 2012/13 with 18.94% or 120.69 Paise per ton-km.
Figure 32: Development of annual earnings per ton-km
Source: Indian Railways Key Statistics 1970/71 to20 12/13; Consultant´s illustration
The IR published in April 2015 at the beginning of the fiscal year 2015/16 updated freight rates
for rail transport. Already in February 2015 India’s Railway Minister Suresh Prabhu proposed a
hike in freight rates that could directly impact consumers of essential commodities as well as
the steel industries. The Minister of Railways has then proposed a freight hike of 0.8% on iron
ore and steel, a 6.3% increase on coal transport and an increase in freight rates for grains and
pulses by 10% during the fiscal year 2015/16. The base rates are depending on the commodity
which has to be transported as well as on the distances that has to be travelled. In total there
IWT Sector Development Strategy and Business Development Study for Capacity Augmentation of National Waterway 1 from Haldia to Allahabad 110
are 16 categories or better commodity groups defined. The IR calls them tariff lines. Three of
the 16 tariff lines are defined as “Low Rate Tariff Line” (LR 1 – LR3) and the remainder 13 rates
as “General Tariff Lines” (Tariff 100 – 200). Besides the definition of Tariff Lines the IR has also
defined distance categories. First distance category is “1-125” (km). For a good that has to be
transported up to 125 km a certain freight rate has been defined. The regulations of IR states
that each transport volume has been invoiced by a transport distance of 125 km minimum
even it has been transported less. The following distance categories are covering additional 25
km until the category “476 -500”. Up to the category “951-1000” there are 50-km-steps. The
distances covered by the following categories are getting longer stepwise. The final category
is “3251-3375”. In total there are 46 distance categories. Per combination of commodity group
and distance category a rate has been defined. This leads to 736 different rates in total. The
range of rates starts with Rs 99.2 per ton of cotton, fruits, groceries or motor vehicles (LR 3)
over a distance up to 125 km and ends with Rs 4,701.6 per ton of acids, alcohols and industrial
gases (General Tariff 200) to be transported up 3,375 km. A choice of tariff lines is displayed in
the following table.
IWT Sector Development Strategy and Business Development Study for Capacity Augmentation of National Waterway 1 from Haldia to Allahabad 111
Table 20: Choice of freight rates (valid since April 2015) in Rs per km
Source: www.indianrailways.gov.in/railwayboard/uploads/directorate/traffic_comm/Freight_Rate_2k15/RC_08_15.pdf;
Consultant´s illustration; excerpt of complete rates list
The costs of rail cargo traffic have been derivated by figures mentioned in the Total Transport
System Study elaborated on behalf of the Planning Commission in 2008. The figures have
been adjusted to reach current level by including an inflation factor. The mentioned costs are
financial costs which represent the expected costs for an operator. The following table shows
the ton-km costs for IR movement of cargo distinguished
IWT Sector Development Strategy and Business Development Study for Capacity Augmentation of National Waterway 1 from Haldia to Allahabad 112
by location between plain (incline < 1 in 100) and ghat (incline > 1 in 100; hilly) sections,
by traffic infrastructure between single and double lines, and
between diesel and electric powered trains.
Total fully-distributed costs vary between Rs 0.72 ton-km on a plain electric double-line
section and Rs 1.29 per ton-km on a ghat diesel single-line section.
Table 21: Railway costs for movement of cargo by cost elements (in Rs per ton-km)
Source: Based on Planning Commission “Total Transport System Study”; Consultant’s calculation and depiction
The operational costs do include energy costs for fuel or electricity, staff as well as
maintenance and repair. Fuel costs are responsible for 25-30% of total costs. The terminal
costs cover the occurring costs by handling or storing cargo at rail terminals. The train has be
to unloaded and/or loaded and the cargo is mainly stored before loaded to or discharged
from a train. The overheads do cover the administration cost and other mainly staff costs
that are necessary for rail traffic but cannot distributed to a certain route of transport.
Capital costs do include among others expenditures for pension funds as well as depreciation
costs. In comparison to other transport modes no infrastructure charges could be identified.
Table 22: Railway costs in average per commodity for movement of cargo (in Rs Per ton-km)
Source: Based on Planning Commission “Total Transport System Study”; Consultant’s calculation and depiction
The definition of costs in Rs per ton-km in relation to certain commodities has been executed
within the “Total Transport System Study” published in 2008. The figures mentioned in the
table above have been adjusted to current cost level based on the figures published in 2008.
SL D L SL D L SL D L SL D L
Operational 0.45 0.40 0.31 0.28 0.82 0.72 0.49 0.43
Terminal 0.04 0.04 0.04 0.04 0.04 0.04 0.04 0.04
Overheads 0.06 0.06 0.06 0.06 0.05 0.05 0.05 0.05
Capital 0.35 0.36 0.37 0.39 0.39 0.40 0.41 0.43
User Charge - - - - - - - -
Total Financial Costs 0.88 0.84 0.76 0.72 1.29 1.21 1.00 0.94
ELEM EN T S OF C OST S
(R s. per ntkm)
P LA IN SEC T ION ( incline < 1 in 100) GH A T SEC T ION ( incline > 1 in 100)
D IESEL ELEC T R IC . D IESEL ELEC T R IC
Rs. per ntkm
SL DL SL DL SL DL SL DL
Wheat 1.02 0.97 0.86 0.84 1.56 1.44 1.18 1.09
Fruits & vegetables 1.05 1.00 0.89 0.86 1.60 1.48 1.21 1.13
Coal 1.09 1.02 0.92 0.89 1.65 1.52 1.25 1.14
Fertilizer 1.05 1.00 0.89 0.88 1.58 1.46 1.21 1.12
Sugar 1.01 0.96 0.85 0.84 1.56 1.44 1.17 1.08
POL 1.20 1.13 1.00 0.97 1.84 1.69 1.37 1.26
Cement 1.08 1.02 0.92 0.90 1.61 1.49 1.24 1.14
Livestock 2.55 2.40 2.14 2.08 3.91 3.61 2.94 2.71
Iron & Steel Products 1.12 1.05 0.93 0.90 1.73 1.58 1.29 1.18
Container heavy wt. 1.30 1.22 1.10 1.06 1.97 1.82 1.49 1.38
PLAIN SECTION (incline < 1 in 100) GHAT SECTION (incline > 1 in 100)
CommoditiesDiesel Electric Diesel Electric
IWT Sector Development Strategy and Business Development Study for Capacity Augmentation of National Waterway 1 from Haldia to Allahabad 113
This is possible as the meaning of the basic assumptions has not changed during the years.
Commodity wise costs are mainly influenced by three mayor cost drivers. These are the
• share of the distance a train has to travel empty after unloading or before loading (empty
return ratio),
• average cargo volume/quantity to be loaded per wagon (train utilization), and
• average lead of cargo (the distance the cargo has to be transported).
The empty return ratio expresses if the commodity is available for both directions making it a
paired or matched transport or not. If coal for example is transported to a power plant it is
very unlikely that the same rail set is transporting coal from the power plant on its way back.
In order to keep the idle time of wagons as low as possible and the overall utilization of rail
cars as high as possible, cargo has to be found to be transported by the train on its way back
(to the coal terminal). To achieve this aim it has to be checked in this example, if waste material
like fly ash (generated during power generating process at the power plant) could be
transported on the way back or if there is a origin of suitable cargo within an appropriate
distance to travel to, pick up the cargo and return to the coal terminal to pick the next load of
coal to be brought to the power plant.
The utilization per train is also important as the costs per ton increase the less nominal tons
the train can load. Especially cargo that needs comparatively much space while being quite
light and by this not generating high wagon loads leads to a reduced train utilization as this is
measured in tons per train and or tons per wagon. Thus, the costs per ton for lighter,
voluminous cargo are higher than for cargo with a higher density.
The third criterion is the average distance a commodity has to be transported as the costs per
ton-km decrease the longer the distance to be travelled becomes. Thus, actually the earnings per
ton and/or ton-km do increase in general if the distance gets longer. This is mainly influenced by
the fact that the preparation of a train transport needs every time the same effort despite the
duration or distance of the transport. If for example these “set-up costs” could be distributed over
more travel-km the costs per km decrease.
4.2.2 Road
The following table overleaf shows the elaborated freight rates of road transport within the
hinterland of NW-1 mainly focused on the transport from/to Haldia, Kolkata and Sahibganj.
The cargo has been clustered by groups. Besides existing studies on this issue the Consultant
executed comprehensive market surveys which included numerous interviews with truck
drivers in the specific regions. For general cargo as well as for Ro-Ro cargo no current freight
rates could be identified. The rates for dry bulk vary between Rs 1.95 per ton-km to Rs 2.41 per
ton-km considering a truck with a work load of 16 tons completely utilized. Also bagged goods have
been identified at all three locations providing a rate range about Rs 162 per ton-km to Rs 2.39 per
ton-km. Liquid bulk for road transport has only been reported for Kolkata GRT with a rate of Rs 4.0
per ton-km. The highest freight rate has been elaborated for road transport of containers. The rates
differ from Rs 6.33 per ton-km in the Kolkata region to Rs 7.95 per ton-km from/to Haldia.
IWT Sector Development Strategy and Business Development Study for Capacity Augmentation of National Waterway 1 from Haldia to Allahabad 114
Table 23: Road freight rates per region and cargo group (in Rs per ton-km)
14
Note: Rates were also quoted to market surveyors during interviews
Source: Planning Commission; Manual on Economic Evaluation of Highway Projects in India, Indian Road Congress, Consultant’s calculation
Freight tariff-rate levels for cargo trucking are totally adverse to any experience in, for instance,
Germany (as described in the previous section) and indicate that road transport in India is
performed with depreciated trucks under heavy overweighed cargo loads without taking
responsibility (and cost coverage) for destroyed roads and other external disadvantages.
Table 24: Road costs for movement of cargo (Rs per ton-km)
Note: For estimating VOC, MAV with average speed of 45 km/h on a 4-lane (2
lanes in each direction) road configuration; Overhead costs at 15% of VOC
(source: World Bank: Measuring Road Transport Performance, 2005
Source: Manual on Economic Evaluation of Highway Projects in India, Indian Road
Congress, IRC:SP:30-2009
Rs. per ntkm Haldia MMT Kolkata GRT Sahibganj MMT Average
Dry bulk 1.95 2.00 2.41 2.12
Liquid bulk n/a 4.00 n/a 4.00
Bagged 2.39 2.28 1.62 2.10
General n/a n/a n/a n/a
Neo-bulk n/a 3.11 n/a 3.11
Ro-ro n/a n/a n/a n/a
Container 7.95 6.33 n/a 7.14
Tariffs
Road (16 t cargo per truck)
Rs. per ntkm Rs per ton-km Share
Fuel & oil 1.87 56.1%
Labor 0.15 4.4%
Repair & maintenance 0.09 2.7%
Tolls 0.34 10.3%
Depreciation 0.06 1.8%
Capital 0.21 6.2%
Overhead 0.32 9.5%
Congestion cost (15% of VOC) 0.30 9.1%
Total 3.33
16 tonnes loaded truck
IWT Sector Development Strategy and Business Development Study for Capacity Augmentation of National Waterway 1 from Haldia to Allahabad 115
4.2.3 Inland-waterway transport
Similar to road and railway transport, in inland shipping the costs per ton-km also decrease
with increasing vessel size. The costs of inland shipping also depend on the direction of
steaming: As diesel constitutes the highest proportion of operating costs, the difference
between upstream and downstream steaming is most significant. The following table
indicates the total cost for inland-waterway shipping as between Rs 0.74 per ton-km for a
3,000-ton vessel downstream and Rs 2.00 per ton-km for a 1,000-ton vessel upstream. Due
to the quite intense current of the river, the upstream direction requests much more
performance by the vessel’s engine than downstream.
Table 25: IWT costs for movement of cargo (Rs per net ton-km)
Upstream Capacity (tons) Downstream Capacity (tons)
Cost Component 1000 2000 3000 Cost Component 1000 2000 3000
Operational (variable) 1.29 1.05 0.93 Operational (variable) 0.62 0.48 0.42
Operational (fixed) 0.23 0.12 0.09 Operational (fixed) 0.23 0.12 0.09
Capital 0.48 0.29 0.23 Capital 0.48 0.29 0.23
Total 2.00 1.47 1.25 ## Total 1.33 0.90 0.74
Source: Spring Costing IWT, New Delhi, 02 March 2016
The Consultants verified the above costs through costing information from two other
sources46. Below Table 26 depicts the costs as stated by Eastern Navigation Pvt Ltd. As this line
operates its own ship yard, these verification figures in the below table are based on true costs
arising on the Indian market.
Table 26: IWT costs for movement of cargo – cost verification (Rs per net ton-km)
Upstream Capacity (tons) Downstream Capacity (tons)
Cost Component 1000 2000 3000 Cost Component 1000 2000 3000
Operational 0.77 0.48 0.36 Operational 0.32 0.19 0.13
Total R&M 0.03 0.02 0.01 Total R&M 0.03 0.02 0.01
Overhead 0.08 0.05 0.04 Overhead 0.03 0.02 0.01
Capital 0.32 0.20 0.16 Capital 0.32 0.20 0.16
User Charge (to IWAI) 0.02 0.02 0.02 User Charge (to IWAI) 0.02 0.02 0.02
Total 1.20 0.75 0.58 ##
Total 0.72 0.44 0.35
Source: Eastern Navigation Pvt Ltd, Kolkata, January 2016
The verification provided cost figures below the figures provided by Spring Costing. However,
the cost differentials are very similar with both sources in that the difference in operational
costs between a 1,000-ton and a 2,000-ton barge is double that of the difference between a
2,000-ton and a 3,000-ton barge.
From the above cost figures, the Consultants calculated future freight prices on the NW-1 as
basis for their transport forecasting model. They first added a 10% profit margin on the total
freight costs. Secondly, they compared the future cargo volumes downstream of Barh (where
2,000-ton barges can ply) with the future cargo traffic upstream of Barh (which will be carried
by 1,000-ton barges). Finally, the Consultants applied individual stowage factors in their model
46 Azzura Marine Liners Pvt Ltd, Kolkata, October 2015; Eastern Navigation Pvt Ltd, Kolkata, January 2016
IWT Sector Development Strategy and Business Development Study for Capacity Augmentation of National Waterway 1 from Haldia to Allahabad 116
to come to specific future freight prices on the NW-1 for each cargo type. They had to consider
that a vessel operator needs to calculate his costs for the entire round trip in order to come to
the specific freight price of a voyage, as he will usually return with an empty vessel hold from
his voyage. These freight prices are elaborated further in Chapter 10.1.
IWT Sector Development Strategy and Business Development Study for Capacity Augmentation of National Waterway 1 from Haldia to Allahabad 117
5 Regional Traffic Flows
5.1 Freight transport patterns
5.1.1 Haldia – Farakka sector
5.1.1.1 Commodity movements and freight tariff rates
The market survey identified a total of more than 16.2 MMT in the Haldia area, out of which
about 15.0 MMT move between origins and destinations through the survey area. About 1.2
MMT arrive from other states (mainly Orissa, Maharashtra, Karnataka) outside the survey area
to Haldia Dock Complex, thus without any opportunity to transfer any of this cargo onto the
NW-1. Following figure depicts the volumes moved in the Haldia area by commodity groups
which had been identified during the Consultants’ market survey (for the individual cargo
movements by origin-destination legs see Annex 3).
Figure 33: Commodities moved through Haldia and Sagar Island
Source: Consultants’ Market Survey, August-October 2015
It becomes obvious that Haldia Dock Complex is a bulk port. More than 95% of the surveyed
commodities within the port are moved in and out by Indian Railways. It is mainly containers
which are transported on the road.
The overleaf table depicts commodities identified by the Consultants’ market survey.
2,947,521
72,000
250,789
1,422,201
221,187
228,378
26,147
641,813
63,286
Coal
Container
Fertilizer
Minerals & Chemicals
Construction Materials
Gas & Petroleum
Project Cargo
Foodstuff
Consumer Goods
IWT Sector Development Strategy and Business Development Study for Capacity Augmentation of National Waterway 1 from Haldia to Allahabad 118
Table 27: Commodities by origin and destination in Haldia and Sagar Island (tons)
Commodity Cargo Type Origin Cargo Destination Cargo
Coal Fly Ash
Dry bulk
354,892 2,592,629
7,300 1,333,461
Natural Aggregates Iron Ore Limestone Fertilizer Food Grains
97,500
0 76,840
4,600
Bagged 163,918 86,871
65,813
Logs & Wood Steel Neo-bulk
60,000
50,000 13,687
Project Cargo Petroleum Textiles Food Other Cargo Containerized Cargo
2,335 23,812
Liquid bulk 11,352 217,026
General Cargo
41,000
576,000
22,286
Container 72,000
Total 789,683 5,083,639
Source: Consultants’ Market Survey, August-October 2015
The overleaf figure gives an impression of the distribution of cargo origin-destination traffic
through Haldia.
A comparison of the average freight tariffs presently applied by the land transporters with the
freight tariffs applied by the Consultants (based on the very few IWT-tariffs offered on the NW-
1) implies a theoretical price advantage of NW-1 shipments. This advantage is, however,
leveled out by additional costs, as IWT cannot offer door-to-door services where producers
and/or users are not located directly on the waterway. Instead, pre- and onward carriage is
usually required to cover for the ‘last mile’ with cost implications arising from additional cargo
handling (see Chapter 4 for a detailed discussion).
IWT Sector Development Strategy and Business Development Study for Capacity Augmentation of National Waterway 1 from Haldia to Allahabad 119
5
77
7
5
7
6
6
58
6
CommodityVolume
(tons/year )
Paper 5,000
Agro Equipment 7,500
LPG Gas 10,000
Automobiles (4 wheeler) 15,000
Poultry Feed 20,000
Plastic Granules 30,000
Steel Wire 40,000
Automobiles (2 wheeler) 50,000
Food Grains 75,000
Fertilizers 125,000
Sand 250,000
Fly Ash 500,000
Cement 750,000
Containers 1,250,000
Lime Stone 2,500,000
Steel / Iron 5,000,000
Stone Chips 10,000,000
Coal 15,000,000
8
8
99Cargo moved from/to Haldia
and Sagar 9
99
6
6
6
7
7
10
6
7
9
55
2
3
88
6
210
10
9
12
12
8
88
11
12
6
5
6
9
12
Figure 34: Commodities moved through Haldia and Sagar
Source: Consultants’ Market Survey, August-October 2015
IWT Sector Development Strategy and Business Development Study for Capacity Augmentation of National Waterway 1 from Haldia to Allahabad 120
The market survey in the Kolkata area (Zone 1) was much more extensive, as most producers and
consumers are located in this area (see Annex 1 for their exact location). Following figure depicts
the volumes moved in the Kolkata area by commodity groups which had been identified during the
Consultants’ market survey (for the individual cargo movements by origin-destination legs see
Annex 3).
Figure 35: Commodities moved through Kolkata-Farakka region
Source: Consultants’ Market Survey, August-October 2015
The following table depicts commodities identified by the Consultants’ market survey:
Table 28: Commodities by origin and destination in the Kolkata-Farakka region (tons)
Commodity Cargo Type Origin Cargo Destination Cargo
Coal
Dry bulk
13,091,961 57,792,767
Fly Ash 454,914 1,067,000
Sand 94,300 3,429
Natural Aggregates 14,066,676 7,274,516
Iron Ore 44,001 26,656
Limestone 3,998,344 2,571
Fertilizer
Bagged
137,000 171
Cement 568500 21,723
Food Grains 177,540 10,085
Logs & Wood
Neo-bulk
63,120 -
Steel 275,586 7,600,959
Project Cargo 130,500 222,519
Gas & Petroleum Liquid bulk 250,550 7,200
Textiles
General cargo
4,500 52,050
Food 148,238 18,400
Other Cargo 77,074 23,700
Containerized Container - 1,452,000
Vehicles Ro-ro 117,514 -
Total 33,700,318 75,575,746 Source: Consultants’ Market Survey, August-October 2015
70,884,728
5,593,486137,171
29,968,809
257,750
353,019
354,263
157,324
1,452,000
117,514
Coal
Minerals & Chemicals
Fertilizer
Construction Materials
Gas & Petroleum
Project Cargo
Foodstuff
Consumer Goods
Container
Vehicles
IWT Sector Development Strategy and Business Development Study for Capacity Augmentation of National Waterway 1 from Haldia to Allahabad 121
Costs to the potential users of the NW-1 constitute the most important, but by no means
exclusive, criteria for their eventual decision to switch traffic from land onto water. The
following section discusses these pros and cons as formulated by the interviewees of the
market survey.
5.1.1.2 Thermal coal
Everett India Pvt Ltd in Kolkata-is a big shipping agent distributing iron & steel, general cargo,
limestone and coal on the international market. India's coal mines are located mainly in seven
states: India's railways are a federal government-run monopoly, in the fiscal year 2014/15 they
transported 508 MMT of domestically-produced and imported coal, according to coal ministry
data. Road transport is more expensive and many of the country's roads are unsuitable for
heavy bulk transport. About 25% of domestically-produced coal was moved by road in the
fiscal year 2014/15, with a further 16% transported via 'merry-go-round' systems serving
power plants located close to mines.
Coal freight accounted for nearly half of the total 1.05 billion tons transported by railways in
2014. Railway capacity utilization ranges between 115% and 150% on the two major trunk
routes from Delhi-Howrah (Kolkata) on the eastern corridor. The 1,839 km DEFC between
Dankuni in W.B. and Ludhiana in Punjab would ease the movement of coal from the eastern
region mines to power stations in the north. Some of the coal being imported at Kolkata may
also use this track. Coal alone is expected to account for about two-thirds of the estimated 90
MMT per year plus annual freight traffic in this direction by 2022.
IWAI had been working with NTPC on the project of transporting imported coal by IWT mode
from Haldia to Farakka and Kahalgaon. In July 2010, NTPC gave written commitment of
transportation of 3 MMT per annum of imported coal from Haldia to the Farakka TPP by IWT
mode for a period of seven years. Thereafter IWAI and NTPC developed a project envisaging
total investment from private sector. After open competitive bidding M/s Jindal ITF Ltd were
selected as operator and the project has been commissioned recently. NTPC has a dedicated
railway line between Farakka and Kahalgaon power plants. Hence it is likely that a further 3
MMT per annum of imported coal for Kahalgaon power plant may be transported to Farakka
by IWT mode under the same project. Since there are several existing thermal power plants
along the NW-1 and many more are going to come up, success of this pioneering project may
pave way for many more projects for transportation of coal on NW-1. IWAI has also identified
a few more cargo specific projects with private sector investment for transportation of 3 MMT
per annum coal for NTPC’s power plant at Barh in Bihar.
5.1.1.3 Stone chips
Chandak & Associates in Kolkata-are order supplier for such aggregates which they distribute
domestically and on the international market.
5.1.1.4 Cement
Bagged cement is transported from Allahabad and Varanasi to Kolkata by rail (Shalimar Railway
Junction and Howrah Goods Yard) and from Patna by road.
5.1.1.5 Iron & steel
BABA Ispat Pvt Ltd in Raniganj (W.B.) is keen to trade through waterways if service is available.
IWT Sector Development Strategy and Business Development Study for Capacity Augmentation of National Waterway 1 from Haldia to Allahabad 122
5.1.1.6 Fertilizer (urea)
Fertilizer can be imported at Kakinada port, then transported to Haldia MMT and finally
onward on the NW-1. Trains can carry fertilizer and manually discharge at IWT terminals by
means of a conveyor belt to load / discharge. TATA Chemicals Ltd in Haldia would be prepared
to ship approximately 70,000 tons annually on the NW-1 subject to notification on transit
subsidy in comparison to rail freight rates. Client for urea fertilizer is IFFCO. IFFCO is planning
on using river-sea vessels (RSV) between Paradip and Haldia sea ports, from thereon using the
NW-1 to Bihar and U.P. Additionally, Pioneer Agro Industries and Bicco Agro Products Pvt Ltd,
both located in Kolkata, cater mainly for the domestic market.
5.1.1.7 Food grains
FCI ships food grains of by IWT mode between Andhra Pradesh, Kolkata and Tripura (through
Ashuganj); and within NW-2 on its northern banks.
5.1.1.8 Agro-equipment
Agro Suppliers Syndicate and Debson Pumps Pvt Ltd in Kolkata distribute their agroequipment
and spares even beyond the region’s borders.
Crude vegetable oil: Crude vegetable oil can be bound for Nepal, if containerized and handled
either at Baghalpur, Patna or Ghazipur.
5.1.1.9 Limestone
Karnani Minerals Pvt Ltd, located in North Kolkata, trades limestone and sand in the region.
5.1.1.10 Other raw materials
United Phosphorus Ltd near Haldia produces raw materials for insecticides for the regional
market.
5.1.1.11 Consumer goods
JM Baxi & Co (JMB) is a shipping agent, forwarder, port & terminal operator specialized in the
transport of containers, bulk and project cargo.
5.1.1.12 Over-dimensional cargo (ODC)
In 2014, Prism Logistics carried 325 metric tons of heavy equipment on barge from Haldia to
Allahabad. This company handles only ODC. ABC India Ltd in Kolkata owns 162 hydraulic axles
plus 12 prime movers and a coastal deck loader barge of 1,948 dwt for carriage of heavy
cargoes. The enterprise is specialized in multi-modal transportation in coastal and inland
waterways for heavy ODCs and also heavy project transportation by road in all conditions
(especially in the hilly terrain of Northeast India). Eastern Navigation Pvt Ltd is a shipping line
(river transport only) located in Kolkata. This line is specialized in the transport of heavy lifts
and ODCs in the region and in all other inland waters of the country.
The overleaf figure gives an impression of the wide range of commodities being transported
through Kolkata, albeit the very largest part of this transport is so far being done by truck or
train.
IWT Sector Development Strategy and Business Development Study for Capacity Augmentation of National Waterway 1 from Haldia to Allahabad 123
2
4 7
1
1
9
3
6
8
1
1
1
2
21
2
5
12
3
3
33
3
3
13
44
4
5
4
44
4
1
1
1
22
2
CommodityVolume
(tons/year )
Paper 5,000
Agro Equipment 7,500
LPG Gas 10,000
Automobiles (4 wheeler) 15,000
Poultry Feed 20,000
Plastic Granules 30,000
Steel Wire 40,000
Automobiles (2 wheeler) 50,000
Food Grains 75,000
Fertilizers 125,000
Sand 250,000
Fly Ash 500,000
Cement 750,000
Containers 1,250,000
Lime Stone 2,500,000
Steel / Iron 5,000,000
Stone Chips 10,000,000
Coal 15,000,000
Cargo moved from/to Kolkata and Pakur
Figure 36: Commodities moved through Kolkata and Pakur
Source: Consultants’ Market Survey, August-October 2015
IWT Sector Development Strategy and Business Development Study for Capacity Augmentation of National Waterway 1 from Haldia to Allahabad 124
5.1.2 Farakka-Munger sector
In this sector, railway is the preferred mode of transportation with trucks being the next
preferred mode. Bad road conditions and ban on movement of heavy truck loads across
Kahalgaon and Baghalpur bridges are the prime reasons for the lower amount of road trucking.
In the Consultants’ market survey, stakeholders were interviewed to arrive at an average
amount of stone chips and aggregates transported by road to estimate the potential amount
that can be considered for the proposed Sahibganj MMT. The following sections detail the
amount of commodities shipped by rail, road and waterways from several regions across the
influence area considered for the market survey.
5.1.2.1 Around Sahibganj
Loading of commodities: The volume of stone chips loaded onto rakes at Sahibganj railway
station during the year 2014-15 amounted to 0.42 MMT (monthly breakdown see Table 1 of
Annex 5). Only stone chips and aggregates are loaded at Sahibganj railway station.
Loading of Stone Chips (2014-15) Amount
Total (MMT) 0.429
Average per day by Rail (tons) 1,138
It can be seen that, during the year 2014-15, an average of 1138 tons of stone chips were
loaded at Sahibganj railway station. The destinations and the distances by rail along with the
unit cost are given in Table 29.
Table 29: Destinations served from Sahibganj railway station - Stone chips and aggregate
Sr. No Destinations Distance by
Rail from Sahibganj
Travel Time (hrs)
Cargo Distribution
(%)
Cargo Volume
(tons/day)
Rate in ton–km by Rail
(Rs)
1 Karpurigram, Bihar 269 10.5 7.6% 87 1.58
2 Darbhanga, Bihar 300 11.8
84.8%
161 1.53
3 Siwan, Bihar 420 16.5 161 1.49
4 Chakia, Bihar 362 14.2 161 1.54
5 Narkatiaganj, Bihar 473 18.6 161 1.46
6 Sitamarhi, Bihar 368 14.4 161 1.52
7 Janakpur road, Bihar 342 13.4 161 1.53
8 Barauni, Bihar 211 8.3 7.6% 87 1.69
Source: Consultants’ Market Survey, August-October 2015
Travel time is calculated by taking into account the average speed observed for freight trains
across India. Research studies have opined that 25 km/h is the average speed of a goods train
and this had been considered in estimating the travel time. However, several times goods
trains are stopped for hours at various locations giving priority to passenger trains. Several
station managers have expressed the fact that there is no assurance on the travel time of the
goods train as they are never run on a scheduled time table.
Stone chips are categorized under Class 150 of freight rates and the corresponding rates
prescribed under the observed distance bracket are considered for estimating the fare per ton-
km of travel. Trucks are utilized for transporting stone chips from the mines to the loading
IWT Sector Development Strategy and Business Development Study for Capacity Augmentation of National Waterway 1 from Haldia to Allahabad 125
point where in manual loading is done onto the rakes at the railway siding. Loading charges
per ton vary from Rs 40 to Rs 50.
Unloading of commodities: Along with the loading of stone chips and related materials, cement
and rice grains are unloaded at Sahibganj railway siding. The volume of unloaded stone chips
observed at Sahibganj railway station during the year 2014-15 amounted to 0.15 MMT
(monthly breakdown see Table 1 of Annex 5).
Unloading of Stone Chips (2014-15) Amount Rakes (no)
Total (MMT) 0.149 58
Average per day by Rail (tons) 409
On a monthly average, 3 rakes of food grains and 2 rakes of cement are unloaded at Sahibganj
railway station. The origins of cement and food grains along with the distances and cost of
transportation are given in Table 30.
Table 30: Origin of commodities unloaded at Sahibganj railway station
Commodity Origin Distance by
Rail (km) Distance by Road (km)
Cargo Distribution
(%)
Cargo Volume
(tons/day)
Rate per ton-km by Rail
(Rs)
Cement
AKT, Akaltara 835 786 33.3% 58 1.34
DGR, Durgapur 251 295 33.3% 58 1.45
JBCT, Jojobera 430 420 33.3% 58 1.43
Food Grain
Hirakud, Odisha 712 777 33.3% 87 1.20
Raipur, Chhattisgarh 972 931 33.3% 87 1.15
BRGA, Bargarh Road 747 787 33.3% 87 1.14
Source: Consultants’ Market Survey, August-October 2015
After unloading at Sahibganj railway station, food grains are transported to Food Corporation
of India (FCI) warehouses which have a railway siding hence incurring no additional costs of
transportation after unloading. However, cement after unloading is disbursed to local use in
trucks.
As an example, an OD-pair is presented in the following:
The Consultants have identified almost 180,000 tons of stone chips trucked from Sahibganj to
Narayanpur Ananth (Bihar) in 2014 over a distance of more than 300 km. This OD-pair is
analyzed further in Chapter 5.3.
Table 31: Feasible cargo OD-pair via Sahibganj - Stone chips and aggregates
Origin Destination Transport
Mode Distance
[km] Travel Time Est. [days]
Volume 2014 [tons]
Sahibganj Narayanpur Ananth (Bihar) Truck 305 0.6 179,200
Source: Consultants’ Market Survey, August-October 2015; calculations by Transport Model
5.1.2.2 Sakrigali
The amount of loading stone chips recorded during the year 2014-15 at Sakrigali railway
station is given overleaf (monthly breakdown see Table 1 of Annex 5):
IWT Sector Development Strategy and Business Development Study for Capacity Augmentation of National Waterway 1 from Haldia to Allahabad 126
Loading of Stone Chips (2014-15) Stone Chips Stone Ballast
Total (MMT) 0.546 0.398
Average per day by Rail (tons) 1,496 1,090
It can be seen that during the year 2014-15, Sakrigali railway station recorded almost 2,600
tons of loaded stone chips plus ballast per day. The destinations served from Sakrigali railway
station along with the distances and the cost involved are given in Table 32.
Table 32: Destinations served from Sakrigali railway station - Stone chips and aggregates
Destination Distance by
Rail from Sakrigali (Km)
Rate per Ton
Rate per ton-km by
Rail (Rs)
Cargo Distribution
(%)
Cargo Volume
(tons/day)
Distance by Road (Km)
Kiul 180.09 325.1 1.81 3.4% 87 196
Begusarai 232.17 391.1 1.68
13.4%
87 210
Mokama 214.10 356.9 1.67 87 229
Durgapur 243.21 391.1 1.61 87 297
Bakhthiyarpur 257.88 425.3 1.65 87 275
Darbhanga 307.70 491 1.60 3.4% 87 300
Fatuha 281.43 459 1.63
59.8%
119 299
Gaya 309.32 491 1.59 119 332
Danapur 312.99 491 1.57 119 335
Mansi 281.28 459 1.63 119 162
Janakpur road 350.28 557.3 1.59 119 353
Chakia 369.91 557.3 1.51 119 374
Khajauli 363.24 557.3 1.53 119 377
Sonpur Junction 312.72 491 1.57 119 324
Buxar 421.02 625.1 1.48 119 463
Gauthamsthan 375.22 557.3 1.49 119 389
Hathua 445.63 658.8 1.48 119 478
Kanti 334.91 524.1 1.56 119 338
Chandauli 497.13 726.6 1.46 119 278
Mughal sarai 512.33 795.2 1.55
13.4%
87 541
Bhabua Road 459.82 692 1.50 87 495
Japla 434.54 658.8 1.52 87 479
Siwan 427.12 658.8 1.54 87 459
Mairwa 448.44 658.8 1.47 6.7%
87 481
Sitamarhi 375.54 557.3 1.48 87 377
Source: Consultants’ Market Survey, August-October 2015
Freight charges given in Table 32 are taken into account while calculating the tariff per ton-km
of travel by railways. Furthermore, several transport agencies operating in the region were
consulted for ascertaining the cost of travel by truck. It has been found that trucking agencies
charge an amount ranging at Rs 3.01-3.89 per ton-km of travel by road in the Sahibganj region.
The cost charged in the Pakur region is in between Rs 3.00-3.50 per ton-km of travel. It can be
seen that the trucking cost is about 2 to 2.2 times higher than that incurred by rail.
IWT Sector Development Strategy and Business Development Study for Capacity Augmentation of National Waterway 1 from Haldia to Allahabad 127
Apart from transporting stone chips by rail and truck, this commodity is also transported in
small dinghies to the other side of the Ganges River where it is picked up again and transported
further by trucks to places on the north of the NW-1 and to Bihar. Stone chips mined at Sakrigali
are transported to the other side particularly at Manihari by small boats (‘naukas’). The
distance from Sakrigali to Manihari on the NW-1 is about 15 Km. Route course and the location
on the map is shown in Figure 38. Along with these naukas, there is a barge service provided
by local authorities to ferry people which also offers roll on roll off (ro-ro) service to trucks
carrying stone chips from Sahibganj. It is observed that this service makes 4 trips in a day
ferrying 7 trucks (loaded with 9 tons of stone chips) on each trip. Hence, this local service
ferries about 28 trucks of 9 tons each from Sahibganj to Manihari during one day. Fare
collected at Sahibganj for ro-ro services amounts to Rs 1,300 for a loaded truck (9 tons) and Rs
750 for an empty truck. Additionally to the local authorities, the GoI runs a ship named
‘Rajagopalachari’ which offers ro-ro services for trucks from Sakrigali to Manihari. On an
average, about 40 tons of stone chips are loaded onto a truck and about 16 trucks are shipped
in one go from Sahibganj to Manihari. This ferry service offers only two trips per day. The fare
collected is a lump sum amount which comes down to about Rs 6,000 for 40 tons per truck
load.
Figure 37: Route map-Sakrigali to Manihari by naukas
Source: Consultants’ Market Survey, August-October 2015
Naukas crossing the NW-1 from Sahibganj to Manihari are unauthorized services run by local
groups. The quantity of material ferried is not recorded and is regarded as unofficial mining
and transportation. Discussion with local people revealed that about 200-250 naukas are used
per day to ferry stone chips from the Sahibganj side of the Ganges River to Manihari. Each
nauka has a holding capacity of 50-60 tons. They charge about Rs 200 per ton for one crossing.
This fee also includes the loading and unloading charges at Sahibganj and Manihari
respectively. Loading of stone chips observed at railway stations and onto naukas is shown in
Figure 39 overleaf.
IWT Sector Development Strategy and Business Development Study for Capacity Augmentation of National Waterway 1 from Haldia to Allahabad 128
Figure 38: Means of commodity transport
Source: Consultants’ Market Survey,
Stone chips dumped at Manihari from naukas are further loaded onto trucks for transport to
regions in the north, namely Katihar, Purnea, Janakpur, Chakia, Saharsa, Dharbanga, etc. The
waterway from Sakrigali to Manihari forms a very vital transportation link, as a bridge to cross the
river is located only near Baghalpur where restrictions on heavy truck loads are in place. This lack
of transport infrastructure has given rise to unofficial transportation means like naukas in this
region. Hence, there is a huge potential of transporting stone chips across the river at Manihari
because of the reduction in trucking costs and travel time. The distance from Sakrigali to Manihari
by road is about 197 km, whereas on the waterway this distance is shortened to only 15 km.
Naukas take about 2-2.5 hours to reach Manihari from Sakrigali.
Furthermore, demand at all the locations along the NW-1 can be met by IWT with lower cost
and less time. Movement of heavy truck loads on the roads has inflicted heavy damage to the
pavement making it worse for further movement of trucks during the monsoon season.
Damages in the form of potholes and rutting for several kilometers are noticed on the main
road network connecting regions to the east and west of Sahibganj. Worse road conditions
have further become a deterrent to road trucking. The condition of the roads leading to the
loading points is shown in overleaf Figure 40.
IWT Sector Development Strategy and Business Development Study for Capacity Augmentation of National Waterway 1 from Haldia to Allahabad 129
Figure 39: Severe damage inflicted due to heavy truck loads
Source: Consultants’ Market Survey, August-October 2015
5.1.2.3 Mirzachowk
Trucks are used to transport stone chips from the nearby mines to the loading point at the
railway station. The amount of stone chips loaded at Mirzachowk railway station (monthly
breakdown see Table 1 of Annex 5) during the year 2014-15 is as follows:
Stone Chips Loading (2014-15) Amount
Total (MMT) 0.437
Average per day by Rail (tons) 1,197
It can be seen that, during the year 2014-15, Mirzachowk railway station recorded about 1,200
tons per day of loading. The destinations served from Mirzachowk railway station along with
the distances and the cost involved are given below in Table 33.
Table 33: Destinations served from Mirzachowk railway station - Stone chips and aggregates
Sr. No Destinations Distance from
Mirzachowk (km) Cargo
Distribution (%) Cargo Volume
(tons/day) Rate per ton-km
by Rail (Rs)
1 Jamalpur Junction 112 7.2% 87 1.90
2 Karpurigram 253
92.8%
185 1.68
3 Narayanpur Ananth 294 185 1.56
4 Janakpur Road 327 185 1.60
5 Khajauli 340 185 1.54
6 Kati 311 185 1.57
7 Tarsarai 297 185 1.54
Source: Consultants’ Market Survey, August-October 2015
Stone chips and aggregates moved by rail from Sahibganj, Sakrigali and Mirzachowk to the
destinations mentioned above total almost 5,000 tons per day. Also, the amount of stone chips
moved by naukas from Sakrigali to Manihari by waterways is about 12,600 (225 naukas of 55
tons each plus 28 trucks of 9 tons each). The cargo volume trucked to northern Bihar is pegged
at 25,600 tons per day (1,600 trucks with an average load of 16 tons each).
5.1.2.4 Rajmahal
Silica sand mined at Mangalhat is transported in trucks until Rajmahal railway station for
loading onto railway rakes. The amount of silica sand loaded at Rajmahal railway station during
the year 2014-15 is given overleaf (monthly breakdown see Table 1 of Annex 5):
IWT Sector Development Strategy and Business Development Study for Capacity Augmentation of National Waterway 1 from Haldia to Allahabad 130
Silica Sand Loading (2014-15) Amount
Total (MMT) 0.62
Average per day by Rail (tons) 171
It can be seen that during the year 2014-15, on an average about 170 tons of silica sand was
transported from Rajmahal railway station. Furthermore, about 10-15 truckloads (average
weight of 16 tons) of silica sand are trucked to areas in and around Kolkata. Destinations by
rail include several processing industries which use silica sand as raw material. Destinations
and costs involved by railways and roads are given in Table 34.
Table 34: Destinations served from Rajmahal railway station - Silica sand
Sr. No Destination Distance from Raj-mahal by Rail (km)
Cargo Distribution (%)
Cargo Volume (tons/day)
Rate per ton-km by Rail (Rs)
1 Bokaro Steel 390 33.3% 57 1.52
Plant, Jharkhand
2 Hatia, Ranchi 420 33.3% 57 1.49
3 Kolkata, Sodpur 250 33.3% 57 1.56
Source: Consultants’ Market Survey, August-October 2015
5.1.2.5 Pirpainti
Coal from Rajmahal coal mines is loaded at Pirpainti railway station. Rajmahal coal mines are
located in Lalmaitya which is 36 km away from Pirpainti railway station. Rajmahal coal mines
have a railway siding where coal is loaded and from where it is transported to Kahalgaon
Thermal Power Station. The volume of coal loaded at Pirainti railway station during the year
2014-15 amounted to 0.64 MMT (monthly breakdown see Table 3 of Annex 5).
Coal Loading (2014-15) Amount
Total (MMT) 0.644
Average per day by Rail (tons) 1,764
Coal loadings are closed during the monsoon season because of less production activity. Also,
it was learnt that there has been a problem with the loading agencies which often go on strike
resulting in zero loadings at Pirpainti railway station. A similar problem was seen also at
Rajmahal railway station. Demand from thermal power stations at Varanasi is met by coal
mined at Lalmitiya making trucking of coal less reliable. Logistics companies have expressed
their willingness to move onto waterways, as delivering coal at Varanasi would be a cheaper
option by waterways and would also provide an alternative to the problems created by the
loading agencies. The thermal power stations/regions served by the coal mined at Lalmatiya
are given in below Table 35.
IWT Sector Development Strategy and Business Development Study for Capacity Augmentation of National Waterway 1 from Haldia to Allahabad 131
Table 35: Destinations served from Pirpainti railway station – Coal
Sr. No Destinations
Distance from
Pirpainti by
Rail (km)
Cargo
Distribution
(%)
Cargo
Volume
(tons/day)
Rate per
ton-km by
Rail (Rs)
1 Banaras Thermal Power Station, Varanasi 501 24.0% 423 1.53
2 Farakka Thermal Power Station, Murshidabad, West Bengal
96 6.9% 122 2.14
3 Kahalgaon Thermal Power Station 55 6.9% 122 3.74
(NTPC Kahalgaon), Bhagalpur, Bihar
4
5
6
7
8
9
10
11
12
Titagarh Thermal Power Station, Titagarh,
Kolkata
Bakreshwar Thermal Power Station, Chinpai,
West Bengal
Mejia Thermal Power Station,
Bankura, West Bengal
Sagar Dighi Thermal Power Station,
Manigram, West Bengal
Rosa Thermal Power Station,
Shahjahanpur, Uttar Pradesh
Hindalco Thermal Power Station,
Sonbhadra, Uttar Pradesh
Kolaghat Thermal Power Station, West
Bengal
Budge Budge Thermal Power Station, 24
Paraganas, West Bengal
Bandel Thermal Power Station, Bandel,
West Bengal
507
204
591
153
971
672
507
376
367
6.9%
6.9%
6.9%
6.9%
6.9%
6.9%
6.9%
6.9%
6.9%
122
122
122
122
122
122
122
122
122
1.52
1.69
1.41
1.84
1.39
1.43
1.52
1.52
1.47
Source: Consultants’ Market Survey, August-October 2015
5.1.2.6 Bakudi
The volume of stone chips and aggregates loaded during the year 2014-15 at Bakudi railway
station amounted to 0.43 MMT (monthly breakdown see Table 1 of Annex 5). The stone
crushers are located within a radius of 1-2 km from the loading point at Bakudi railway station.
Stone Chips & Aggregates Loading (2014-15) Amount
Total (MMT) 0.429
Average per day by Rail (tons) 1,138
It can be seen that more than 1,100 tons of stone chips and aggregates were loaded on a daily
average at Bakudi railway station during the year 2014-15. The destinations served from
Bakudi railway station and the costs involved are given in Table 36.
IWT Sector Development Strategy and Business Development Study for Capacity Augmentation of National Waterway 1 from Haldia to Allahabad 132
Table 36: Destinations served from Bakudi railway station - Stone chips and aggregate
Sr. No Destinations
Distance from
Bakudi by Rail
(km)
Cargo
Distribution
(%)
Cargo Volume
(tons/day)
Rate per ton-
km by Rail (Rs)
1 2
Dharbhanga, DBG
Chhakia, CAA
346 409
4.9% 4.9%
173 173
1.51 1.53
3
4
5
6
7
8
Siwan, SV
Narayanpur Ananth, NRPA
Karpurigram, KPGM
Harinagar, HIR
Samasthipur, SPJ Hathua,
HTW
466
356
315
535
309
484
90.2%
535
535
535
535
535
535
1.49
1.57
1.56
1.49
1.59
1.50
Source: Consultants’ Market Survey, August-October 2015
5.1.2.7 Barharwa
The railway station at Barharwa is a loading point for stone chips and aggregates. The amount
of stone chips and aggregates loaded at Barharwa railway station during the year 2014-15
amounted to about 1.0 MMT (monthly breakdown see Table 1 of Annex 5).
Stone Chips & Aggregates Loading (2014-15) Amount
Total (MMT) 1.019
Average per day by Rail (tons) 2,912
It can be seen that during the year 2014-15, on an average about 2,900 tons of stone chips and
aggregates were loaded in a day at Barharwa railway station. The destinations served from
Barharwa railway station and the costs involved are given in Table 37.
Table 37: Destinations served from Barharwa railway station - Stone chips and aggregate
Sr. No Destination Distance from Bar- harwa by Rail (km)
Cargo Distribution
(%)
Cargo Volume (tons/day)
Rate per ton-km by Rail (Rs)
1 Dharbhanga 354
87.6%
245 1.57
2 Kapurigram 323 245 1.52
3 Narayanpur Ananth 364 245 1.53
4 Tarsarai 367 245 1.52
5 Khajauli 410 245 1.53
6 Janakpur Road 397 245 1.49
7 Sitamarhi 422 245 1.48
8 Kanti 381 245 1.55
9 Chakia 416 245 1.50
10 Harinagar 543 245 1.47
11 Gautamsthan 422
12.4%
87 1.48
12 Siwan 473 87 1.46
13 Mairwa 495 87 1.47
14 Hathua 492 87 1.48
Source: Consultants’ Market Survey, August-October 2015
IWT Sector Development Strategy and Business Development Study for Capacity Augmentation of National Waterway 1 from Haldia to Allahabad 133
5.1.2.8 Pakur
Trucks are used to transport coal and stone chips from the mines until the loading points
around Pakur railway station. The amount of stone chips and coal loaded at Pakur railway
station during 2014-15 (monthly breakdown see Tables 1 and 2 of Annex 5) is as follows:
Stone Chips and Coal Loading (2014-15) Coal Stone Chips
Total (MMT) 7.316 5.023
Average per day by Rail (tons) 13,762 20,044
In the above table it can be seen that about 13,800 tons of stone chips more than 20,000 tons
of coal are loaded at Pakur railway station, thus making it the busiest loading station in the
influence area of Sahibganj MMT. The destinations served from Pakur railway station and the
costs involved are given in overleaf Table 38.
Table 38: Destinations served from Pakur railway station - Stone chips and aggregate
Sr. No Destination Distance from
Pakur by Rail (km) Cargo
Distribution (%) Cargo Volume
(tons/day) Rate per ton-km
by Rail (Rs)
1 Patna 376 22.4% 3,077 1.57
2 Ara 425 12.4% 1,710 1.47
3 Chhapra 439 18.6% 2,564 1.50
4 Samsi 103 3.1% 427 2.08
5 Sithamarhi 448 12.4% 1,710 1.47
6 Begusarai 304 12.4% 1,710 1.61
7 Kolkata 262 12.4% 1,710 1.62
8 Kidderpore Dock 279 6.2% 855 1.64
Source: Consultants’ Market Survey, August-October 2015
Coal loaded at Pakur railway station is for operation of the thermal power stations given in
Table 39.
Table 39: Destinations served from Pakur railway station – Coal
Sr. No Destination Distance
from Pakur by Rail (km)
Cargo Distribution
(%)
Cargo Volume
(tons/day)
Rate per ton-km by Rail (Rs)
1 Ropar Thermal Power Plant, Rupnagar (RTPP)
1,570 27.4% 5,492 1.35
2 Guru Hargobind Thermal Power Plant, Lehra, Mohabbat (GHTL)
1,637 36.1% 7,226 1.39
3 Guru Nanak Thermal Power Plant, Bathinda (GNTB)
1,662 11.5% 2,315 1.37
4 Bakreshwar Thermal Power Station, Udaipur, West Bengal (BTPS)
116
25.0%
1,002 1.78
5 Sagardighi Thermal Power Plant Siding, Manigram,West Bengal (PSPM)
95 1,002 2.17
6 Kolaghat Thermal Power Station, Mecheda (KPPS)
310 1,002 1.53
7 Durgapur Coke Oven Plant Exchange Yard, Waria, Durgapur, West Bengal (DCOP)
171 1,002 1.65
8 Santaldih Thermal Power Station, West Bengal. (STPS)
243 1,002 1.56
IWT Sector Development Strategy and Business Development Study for Capacity Augmentation of National Waterway 1 from Haldia to Allahabad 134
Source: Consultants’ Market Survey, August-October 2015
The amount of coal delivered at the three major thermal power plants during the year 2014-
15 is as given below (monthly breakdown see Table 2 of Annex 5):
Loading of Coal (2014-15) RTPP GHTL GNTB
Total (MMT) 0.200 0.264 0.845
Average per day by Rail (tons) 5,492 7,226 2,315
During the year 2014-15, almost 5,500 tons of coal per day were delivered at Ropar Thermal
Power Plant, Rupnagar, 7,226 tons of coal per day at Guru Hargobind Thermal Power Plant,
Lehra, Mohabbat and 2,315 tons of coal per day were delivered at Guru Nanak Thermal Power
Plant, Bathinda.
5.1.2.9 Baghalpur
Cement, Food grains and Fertilizers are the commodities which are unloaded at Baghalpur
railway station. The volumes of individual commodities unloaded at Baghalpur railway station
during the year 2014-15 is given below (monthly breakdown see Table 4 of Annex 5).
Commodity Unloading (2014-15) Cement Rice Wheat Fertilizer
Total (MMT) 0.24 0.12 0.09 0.04
Average per day by Rail (tons) 662 321 242 114
It can be seen that during the year 2014-15, 662 tons of cement, 321 tons of rice, 242 tons of
wheat and 114 tons of fertilizer per day were unloaded at Baghalpur railway station. Rice and
wheat are further transported to Food Corporation of India (FCI) warehouses which are located
at a distance of 5-6 km away from the railway station. Likewise, cement is also transported to
warehouses which are located at 2-3 km away from the railway station.
The origin of these commodities unloaded at Bhagalpur railway station and the costs involved
are given in following Table 40, Table 41, Table 42 and Table 43.
Table 40: Origin of cement unloaded at Bhagalpur Railway Station
Sr.No
Origin
Distance from
Bhagalpur-by Rail (km)
Cargo Distribution
(%)
Cargo Volume
(tons/day)
Rate per ton-km-by
Rail (Rs)
1 Akaltara, Chhattisgarh 882 4.5% 30 1.34
2 Ambuja Cement Eastern Ltd, Abada, W.B. 427 1.1% 8 1.44
3 Andal, West Bengal 309 1.1% 8 1.48
4 Bachhrawan, Uttar Pradesh 701 2.3% 15 1.42
5 Baikunth, Chhatisgarh 986 2.3% 15 1.32
6 Baragarh, Odisha 794 1.1% 8 1.33
7 Chunar, Uttar Pradesh 462 1.1% 8 1.40
8 Dalmia cements east limited, Jharkhand 389 1.1% 8 1.42
9 Dhutra, Odisha 694 9.1% 60 1.34
10 Dilwa, Bihar 276 4.5% 30 1.55
11 Durgapur, West Bengal 325 6.8% 45 1.41
12 Jabalpur, Madhya Pradesh 939 1.1% 8 1.32
IWT Sector Development Strategy and Business Development Study for Capacity Augmentation of National Waterway 1 from Haldia to Allahabad 135
Sr.No
Origin
Distance from
Bhagalpur-by Rail (km)
Cargo Distribution
(%)
Cargo Volume
(tons/day)
Rate per ton-km-by
Rail (Rs)
13 Jahangirabad, Uttar Pradesh/J P Bela Siding
779 8.0% 53 1.36
14 Jalalpur Mandwa 2,081 1.1% 8 1.17
15 Jamshedpur, Jharkhand 472 4.5% 30 1.37
16 Jaypee,Rewa, Madhya Pradesh 698 9.1% 60 1.33
17 Jinkhpani, Jharkhand 518 3.4% 23 1.43
18 JP Rewa cement siding, TZR 776 5.7% 38 1.36
19 M/s Bhilai Jaypee cement limited, Chhattisgarh
1,042 2.3% 15 1.37
20 M/s Lafarge India Pvt Ltd, West Bengal 336 3.4% 23 1.46
21 M/S. Jaiprakash Associates, Chunar 467 1.1% 8 1.38
22 Marauda, Chhattisgarh 1,052 1.1% 8 1.36
23 Muktsar, Punjab 1,560 1.1% 8 1.31
24 New Guwahati, Assam 822 3.4% 23 1.36
25 New Jalpaiguri, West Bengal 192 1.1% 8 1.58
26 Rajgangpur, odisha 632 9.1% 60 1.37
27 Raniganj, West Bengal 316 1.1% 8 1.45
28 Sahibganj 74 2.3% 15 2.68
29 Sindri Town 351 2.3% 15 1.48
30 Sitapur City, Mordabad 781 1.1% 8 1.35
31 Tildanga, West Bengal 138 1.1% 8 1.75
32 Ultratech Cement Ltd, Chhattisgarh 986 1.1% 8 1.32
Source: Consultants’ Market Survey, August-October 2015
Table 41: Origin of rice unloaded at Bhagalpur Railway Station
Sr.No
Origin Distance from Bhagalpur-by
Rail (km)
Cargo Distribution (%)
Cargo Volume (tons/day)
Rate per ton-km-by Rail (Rs)
1 Ambala, Punjab 1,303 2.3% 7 1.28
2 Baghbara, Chhatisgarh 1,051 2.3% 7 1.26
3 Bariwala, Punjab 1,545 2.3% 7 1.23
4 Barnala, Punjab 1,439 4.7% 15 1.24
5 Bhabua, Bihar 378 2.3% 7 1.28
6 Bhatapara, Chhattisgarh 955 2.3% 7 1.27
7 Bhatinda, Punjab 1,487 7.0% 22 1.20
8 Dhuri, Punjab 1,409 2.3% 7 1.27
9 Faridkot, Punjab 1,540 2.3% 7 1.23
10 Firozpur, Punjab 1,543 2.3% 7 1.23
11 Gaya, Bihar 227 2.3% 7 1.49
12 Giddarbaha, Punjab 1,513 2.3% 7 1.25
13 Goniana, Punjab 1,497 2.3% 7 1.19
14 Hodal, Faridabad, Haryana 1,122 2.3% 7 1.28
15 Jakhal, Haryana 1,389 4.7% 15 1.20
16 Jalalabad, Punjab 1,596 2.3% 7 1.19
17 Jivanti, West Bengal 241 2.3% 7 1.41
18 Karnal, Haryana 1,312 2.3% 7 1.27
19 Khanna, Punjab 1,374 4.7% 15 1.22
IWT Sector Development Strategy and Business Development Study for Capacity Augmentation of National Waterway 1 from Haldia to Allahabad 136
Sr.No
Origin Distance from Bhagalpur-by
Rail (km)
Cargo Distribution (%)
Cargo Volume (tons/day)
Rate per ton-km-by Rail (Rs)
20 Kotkapura, Punjab 1,527 2.3% 7 1.24
21 Lehra Gaga, Sangrur, Punjab 1,405 2.3% 7 1.27
22 Moga, Punjab 1,485 7.0% 22 1.20
23 Mughal Sarai, Uttar Pradesh 430 2.3% 7 1.33
24 Muktsar, Punjab 1,560 9.3% 30 1.22
25 Nabha, Punjab 1,382 2.3% 7 1.21
26 Patiala, Punjab 1,336 2.3% 7 1.25
27 Pinjrapol BH 315 2.3% 7 1.35
28 Raipur, Chhattisgarh 1,031 2.3% 7 1.29
29 Rure Asal, Punjab 1,564 2.3% 7 1.21
30 Sainthia, West Bengal 236 2.3% 7 1.44
31 Sarna, Punjab 1,588 2.3% 7 1.19
32 Sunam, Punjab 1,427 2.3% 7 1.25
33 Yamunanagar, Haryana 1,252 2.3% 7 1.24
Source: Consultants’ Market Survey, August-October 2015
Table 42: Origin of wheat unloaded at Bhagalpur Railway Station
Sr. No
Origin
Distance from Bhagalpur-by
Rail (km)
Cargo Distribution (%)
Cargo Volume (tons/day)
Rate per ton- km-by Rail (Rs)
1 Abohar, Punjab 1,558 6.5% 16 1.22
2 Ahmedgarh, Punjab 1,442 6.5% 16 1.24
3 Ambala, Punjab 1,303 3.2% 8 1.28
4 Bareta, Punjab 1,403 3.2% 8 1.27
5 Bhattu Kalan, Haryana 1,415 3.2% 8 1.26
6 Bhuchchu, Punjab 1,487 3.2% 8 1.20
7 Bolinna Doaba, Punjab 1,474 3.2% 8 1.21
8 Chheharta, Punjab 1,559 6.5% 16 1.22
9 Chongajan, Assam 1,088 3.2% 8 1.22
10 Fazilka, Punjab 1,608 3.2% 8 1.18
11 Firozpur, Punjab 1,543 3.2% 8 1.23
12 Jagraon, Punjab 1,456 3.2% 8 1.23
13 Jakhal, Haryana 1,389 3.2% 8 1.20
14 Jind, Haryana 1,321 3.2% 8 1.27
15 Mandi Gogindgarh, Punjab 1,366 3.2% 8 1.22
16 Muktsar, Punjab 1,560 3.2% 8 1.22
17 Narwana, Haryana 1,351 3.2% 8 1.24
18 Panipat, Haryana 1,278 3.2% 8 1.22
19 Patiala, Punjab 1,356 3.2% 8 1.23
20 Patti, Punjab 1,596 6.5% 16 1.19
21 Pehowa Road, Haryana 1,369 3.2% 8 1.22
22 Rampura Phul, Punjab 1,472 3.2% 8 1.21
23 Sangrur, Punjab 1,425 3.2% 8 1.25
24 Sulthanpur Lodhi, Punjab 1,500 3.2% 8 1.19
25 Talwandi Bhai, Punjab 1,509 3.2% 8 1.26
26 Tarn Taran, Punjab 1,575 3.2% 8 1.20
27 Uchana, Haryana 1,336 3.2% 8 1.25
Source: Consultants’ Market Survey, August-October 2015
IWT Sector Development Strategy and Business Development Study for Capacity Augmentation of National Waterway 1 from Haldia to Allahabad 137
Table 43: Origin of fertilizer unloaded at Bhagalpur Railway Station
Sr.No
Origin Distance from Bhagalpur-by
Rail (km)
Cargo Distribution
(%)
Cargo Volume (tons/day)
Rate per ton-km-by Rail
(Rs)
1 Baneshwar, West Bengal 544 7.7% 9 1.27
2 Bareily, Uttar Pradesh 958 7.7% 9 1.26
3 Kakinada Sea ports limited 1,417 7.7% 9 1.26
4 Meerut, Uttar Pradesh, TCL Siding 1,055 7.7% 9 1.26
5 Paradip 892 23.1% 26 1.23
6 Phulpur, Uttar Pradesh 551 23.1% 26 1.36
7 Tata Chemicals Ltd, West Bengal 535 15.4% 18 1.29
8 Vijaipur, Madhya Pradesh 1,246 7.7% 9 1.25
Source: Consultants’ Market Survey, August-October 2015
As an example, an OD-pair is presented in the following: The Consultants have identified 5,000
tons of fertilizer brought by railways from Kakinada Sea Port (Andhra Pradesh) over a distance
of more than 1,400 km, a voyage which takes three days. This OD-pair is analyzed further in
Chapter 5.3.
Table 44: Feasible cargo OD-pair via Bhagalpur - Fertilizer
Origin Destination Transport
Mode Distance
[km] Travel Time Est. [days]
Volume 2014 [tons]
Kakinada Port Bhagalpur Railway Station Railway 1,417 3.0 4,988
Source: Consultants’ Market Survey, August-October 2015; calculations by Transport Model
5.1.2.10 Kahalgaon
Kahalgaon Thermal Power Station is operated by National Thermal Power Corporation (NTPC)
and coal for the thermal power plant is sourced from coal fields at Lalmatiya in Jharkhand, coal
fields at Andal in W.B. and imported coal from Thailand dumped at Haldia port. Imported coal
from Haldia port is transported by rail to Kahalgaon Thermal Power Station railway siding. The
amount of coal unloaded at Kahalgaon Thermal Power Station railway siding during the year
2014-15 is given below:
Coal Unloading (2014-15) Amount
Total (MMT) 5.963
Average per day by Rail (tons) 16,336
It can be seen that during the year 2014-15 on an average about 16,300 tons of coal was
unloaded at Kahalgaon Thermal Power Station.
Furthermore, flyash generated from Kahalgaon Thermal Power Station is loaded at the railway
siding and is served to several destinations in the north east, viz Guwahati, Champasari, Digaru
and Barpeta Road. It is also transported to Rohanpur in Bangladesh. About 1,733 tons of flyash
per day is loaded at Kahalgaon thermal power station railway siding and is served to the
destinations given in Table 45.
IWT Sector Development Strategy and Business Development Study for Capacity Augmentation of National Waterway 1 from Haldia to Allahabad 138
Table 45: Destinations served from Kahalgaon Thermal Power Station railway siding
Sr. No
Destination Distance from Kahalgaon-by
Rail (km)
Cargo Distribution (%)
Cargo Volume (tons/day)
Rate per ton-km-by Rail (Rs)
1 Guwahati (GHY) 788.27 25.0% 433 1.15
2 Champasari, Siliguri (SGUJ) 387.14 25.0% 433 1.22
3 Digaru (DGU) 821.86 25.0% 433 1.17
4 Barpeta Road (BPRD) 675.85 25.0% 433 1.18
Source: Consultants’ Market Survey, August-October 2015
Table 46: Coal provided to Kahalgaon Thermal Power Station railway siding
Sr. No
Destination Distance from Kahalgaon-by
Rail (km)
Cargo Distribution (%)
Cargo Volume (tons/day)
Rate per ton-km-by Rail (Rs)
1 Andal 279 10.0% 1,634 0.00
2 Imported coal at Haldia 511 10.0% 1,634 0.00
3 Lalmatiya 55 80.0% 13,069 4.64
Source: Consultants’ Market Survey, August-October 2015
Table 47: Fertilizer provided to Katihar Railway Station
Sr. No
Destination Distance from Kahalgaon-by
Rail (km)
Cargo Distribution (%)
Cargo Volume (tons/day)
Rate per ton-km-by Rail (Rs)
1 Kanpur 839 50.0% 1,300 1.54
2 Vishakapatnam 1,290 50.0% 1,300 1.50
3 Kanpur 839 50.0% 2,600 1.54
4 Vishakapatnam 1,290 50.0% 2,600 1.50
5 Kanpur 839 50.0% 3,900 1.54
6 Vishakapatnam 1,290 50.0% 3,900 1.50
Source: Consultants’ Market Survey, August-October 2015
The below figure summarizes the volume significance of the above-discussed commodities in
the Farakka-Munger sector.
Figure 40: Commodities moved in Farakka-Munger Sector
Source: Consultants’ Market Survey, August-October 2015
6,361,421
574,157 9,898,749
1,714
288,0162,626
Coal
Fertilizer
Construction Materials
Project Cargo
Foodstuff
Consumer Goods
IWT Sector Development Strategy and Business Development Study for Capacity Augmentation of National Waterway 1 from Haldia to Allahabad 139
The following table depicts commodities identified by the Consultants’ market survey.
Table 48: Commodities by origin and destination in Farakka-Munger sector (tons)
Commodity Cargo Type Origin Cargo Destination Cargo
Coal
Dry bulk
360,150 6,001,271
Sand 94,300
Natural Aggregates 9,139,200 571,116
Fertilizer
Bagged
99,641 474,516
Cement 94,133
Food Grains 30,800 248,080
Project Cargo Neo-bulk 1,714
Textiles General Cargo
2,626
Food 1,616 7,520
Total 9,728,333 7,398,350
Source: Consultants’ Market Survey, August-October 2015
Natural aggregates loaded in the sector constitute the most important commodity, while the
area also serves as distribution point for coal. Table 3 of Annex 5 depicts the origindestination
pairs which had been identified during the Consultants’ market survey.
IWT Sector Development Strategy and Business Development Study for Capacity Augmentation of National Waterway 1 from Haldia to Allahabad 140
Figure 41: Cargo moved in the Farakka-Munger sector (tons 2015)
IWT Sector Development Strategy and Business Development Study for Capacity Augmentation of National Waterway 1 from Haldia to Allahabad 141
5.1.3 Munger-Ballia sector
The following table depicts commodities identified by the Consultants’ market survey.
Table 49: Commodities by origin and destination in Munger-Ballia sector (tons)
Commodity Cargo Type Origin Cargo Destination Cargo
Coal
Dry bulk
314,908 16,196,596
Natural Aggregates 13,918,093
Iron Ore 10,205
Limestone 1,370,000
Cement
Bagged
70,000 1,273,500
Fertilizer 25,000 692,225
Food Grains 345,773 1,641,317
Bricks & Tiles
Neo-bulk
10,300,000
Petroleum 136,296
Steel 280,300 2,403,174
Agro Equipment 5,143
Project Cargo 130,500 360
Food General Cargo
646,510 163,448
Other Cargo 500 40,360
Containerized Container - 480,000
Total 13,629,992 36,814,216
Source: Consultants’ Market Survey, August-October 2015
The area around Patna and eastward is well known for brick burning due to excellent clay
deposits. Limestone production is therefore also very significant in this sector.
Figure 42: Commodities moved in Munger-Ballia Sector
Source: Consultants’ Market Survey, August-October 2015
Construction materials constitute the largest proportion of cargo moving through the sector.
These cover all forms of cargo types: Natural aggregates and limestone as dry bulk, cement as
bagged cargo, and bricks & tiles as neo-bulk cargo.
16,511,504
1,380,205 136,296
717,225
28,245,067
136,003
2,797,048
40860
480000
Coal
Minerals & Chemicals
Petroleum
Fertilizer
Construction Materials
Project Cargo
Foodstuff
Consumer Goods
Container
IWT Sector Development Strategy and Business Development Study for Capacity Augmentation of National Waterway 1 from Haldia to Allahabad 142
5.1.4 Ballia-Allahabad sector
5.1.4.1 Coal
Imported high-calorie coal: Bothra Group has a shipping and logistics business, and runs a coal
terminal at Kakinada where an average of 2.0 MMT of coal is handled per year.
Domestic low-calorie coal: Every day around 2,000 tons per day (= minimum 100-120 trucks,
maximum 200-250 trucks of 10-15 tons each) are trucked to the coal mandi in Varanasi from
coal mines of Jharkhand and Madhya Pradesh (MP). This operation is carried out for nine
months (not during the three months of the rainy season). Several small coal buyers in Patna
area ask for coal transport (about 500 – 1,000 tons per month by barge).
5.1.4.2 Building materials
Cement
Two cement plants are located in the Varanasi region: one of the Jaypee Group, the other
one of ECO Cements Limited:
1. Jaypee Plant produces 2.5 MMT cement per year with destination U.P. and Bihar. The
plant is in 9 km distance from the Ganges, 30 km downstream of Varanasi.
2. ECO Plant produces 0.9 MMT cement per year for Bihar (70%), W.B. (15%) and U.P.
(15%).
Stone chips
Stone chips and sand are presently transported by truck from Sonbhadra in the southwest
of Varanasi, but would most possibly be procured from Bihar and Jharkhand (Sahibganj) due
to lower rates, if IWT was available on NW-1.
5.1.4.3 Agricultural inputs
Fertilizer (urea)
Fertilizer can be imported at Kakinada port and then transported to Haldia and IW. Trains can
carry fertilizer and manually discharge at IWT terminals by means of a conveyor belt to load /
discharge.
5.1.4.4 Food grains and flour
Wheat
Grain is transported from U.P. (about 20% of all U.P. wheat) to Bihar and W.B. by Food
Corporation of India (FCI).
Rice
About 20% of U.P. rice is transported to Bihar and W.B. by FCI.
IWT Sector Development Strategy and Business Development Study for Capacity Augmentation of National Waterway 1 from Haldia to Allahabad 143
5.1.4.5 Edible oil
Crude vegetable oil: Crude vegetable oil can be bound for Nepal if containerized and handled
at Varanasi.
5.1.4.6 Local hand-loom silk products
Sarees
Many sarees are high-value home products which could be transported in containers. Volumes
generated are 1.2 – 1.5 million Sarees per year => 2,000 tons per year (1 center), corresponding
to 150 TEU per day (all centers) of which 30% are transported to U.P., Bihar and W.B. Additional
incoming containers could carry inputs, such as silk from China (importers in Kolkata need to
be questioned). However, transport chains still need to be established (particularly shipping
to/from Kolkata/Haldia) => projected for the year 2028.
Carpets
Presently, 90% (of minimum 130,000 tons per year) of local carpets are transported on road
to Mumbai. Carpets represent a major containerizable product. Estimated at 20 tons per TEU,
6,500 TEU would be moved annually. In fact, initially an ICD 30 km down the river was geared
for carpets, but the trade did not work (due to missing transport chain?). In case, carpets went
via the NW-1 then for onward transport through Haldia or Kolkata port on feeders, this
business could be shared by local shipping agents. Bothra tried for containers earlier, but it
did not work out.
5.1.4.7 Over-dimensional cargo (ODC)
In 2014, Prism Logistics carried 325 tons of heavy equipment on barge from Haldia to
Allahabad. This company handles only ODC. Eastern Navigation is a shipping company focusing
on ODC cargo and technical support vessel/facilities like pontoons, bridge construction
facilities, etc. The company aims at earnings of around Rs 25 million per vessel trip (ODC cargo).
The below Figure 44 summarizes the volume significance of the above-discussed commodities
in the Ballia-Allahabad sector.
IWT Sector Development Strategy and Business Development Study for Capacity Augmentation of National Waterway 1 from Haldia to Allahabad 144
Figure 43: Commodities moved through Ballia-Allahabad sector (tons)
Source: Consultants’ Market Survey, August-October 2015
The following table depicts commodities identified by the Consultants’ market survey.
Table 50: Commodities by origin and destination in Ballia-Allahabad sector (tons)
Commodity Cargo Type Origin Cargo Destination Cargo Coal
Dry bulk
18,810 28,007,319 Limestone 2,400,000 2,571 Natural Aggregates - 89,166
Gas & Petroleum Liquid bulk - 7,200
Fertilizer
Bagged
372,752 144,000
Cement 1,981,169 236,400
Food
Grains
777,615 -
Bricks & Tiles
Steel
Project Cargo Neo-bulk
- 10,400,000
13,124 5,233,220
360 196,455
Textiles
Food Other Cargo
General Cargo
5,475 94,363
320,080 63,600
98,480 47,700
Containerized Container 17,280 1,061,280
Vehicles Ro-ro 117,514 -
Total 6,122,659 45,583,274
Source: Consultants’ Market Survey, August-October 2015
Significant amounts of coal are brought to Allahabad and Varanasi for onward distribution to
TPPs. Much of the limestone being mined in this area is transported eastwards for brick-
burning. In exchange, bricks are being brought for the significant construction activities in this
sector.
28,026,129
2,402,571516,752
17,953,079
7,200
196,815
1,161,295
246,018
1,078,560
117,514
Coal
Minerals & Chemicals
Fertilizer
Construction Materials
Gas & Petroleum
Project Cargo
Foodstuff
Consumer Goods
Container
Vehicles
IWT Sector Development Strategy and Business Development Study for Capacity Augmentation of National Waterway 1 from Haldia to Allahabad 145
5.2 Bottlenecks by transport mode and route
5.2.1 Railways
There are some sections where IR has been working above their capacity, especially on the
eastern corridor line Delhi–Howrah. Currently, these routes face 140-150% of capacity
utilization. Generally, a rail route is considered congested when the capacity utilization
increases above 80%.
Over-saturation has implications for the quality of service of freight trains and severely restricts
IR’s ability to meet customer expectations. Speed of freight trains has largely remained
stagnant and improved only marginally from 25 to 29 km per hour over the last three decades
– as against a design average speed of 60 km/hour. These capacity constraints need to be
further viewed in the context that IR does not operate heavy-haul freight trains which imply
higher cost-efficiency in freight operations. Furthermore, the infrastructure is used by both,
passenger and freight trains. The maximum gross load carried on trains of IR is 5,400 tons,
compared to 20,000-37,000 tons in China, South Africa, Brazil and Australia. This may change
only when the EDFC gets operational, as trains with maximum gross load of 12,000 tons are
expected to run on this DFC. Also, the parcel size of cargo is presently restricted between the
range of 2,400 metric tons and 3,800 metric tons and, therefore, cuts out many customers
even in the bulk-cargo segment. Given the above constraints, IR has focused on carrying bulk
cargo in train-loads dominated by a limited number of nine commodities such as coal (46%),
iron ore (13%), cement (11%), fertilizers (5%) steel (5%), raw materials for steel plants (5%)
except iron ore, food grains (5%), petroleum products (4%) and container traffic (4%), plus
others (2%).
Ideally, coal and iron ore are supposed to be trucked by road only on short distances, mainly
from the mines to the rail sidings. Feeder rail routes would then carry the coal or iron ore from
the rail sidings to the trunk routes. The trunk routes would carry the minerals long distances,
usually between distant states. Close to the destination, feeder routes would finally move the
materials from the trunk route to the rail siding at the power or steel plant. However, the
Consultants’ market survey established that large volumes are being trucked over large
distances, for instance coal and steel from Howrah Goods Yard at Kolkata to Patna or even
Allahabad, coal from Shalimar Junction to Varanasi Junction, with limestone being trucked in
the opposite direction, and again coal from Pakur to Kolaghat or Sagardighi (both in West
Bengal), and stone chips from Nalhati and Pakur to Kolkata.
Although mining activities are concentrated in a number of locations, this comparatively low
density may also be a reason why several mining products, like stone chips and coal, are in
their majority trucked via Jharkhand’s roads instead of being loaded onto trains.
5.2.2 Roads
Traffic on Indian roads is highly concentrated along certain corridors that link the largest
metropolitan cities. The infrastructure and availability of services along these corridors is
comparatively superior to that connecting with the more minor urban centers. A common
complaint from the users is the absence of last-mile links. Ports connect insufficiently with the
rail and road networks. The rail and road networks do not offer efficient points of interchange
IWT Sector Development Strategy and Business Development Study for Capacity Augmentation of National Waterway 1 from Haldia to Allahabad 146
for each to be harnessed to its best advantages, resulting in suboptimal energy usages and
higher costs as rail’s last-mile disadvantages prove debilitating.
Of the four riparian states, Jharkhand is in a special position: Road density in terms of both
surface area as well as population is very low compared to the other three states and to India
as a whole (see Chapter 2.1.6). Despite this low density, almost one in ten inhabitants owns a
vehicle – perhaps due to the long distance to central places.
Of the few roads in Jharkhand, most are surfaced (asphalt or concrete). This is also reflected
in the two tables below indicating that density of roads other than national (NH) and state (SH)
highways is extremely low in terms of both surface area and population. At the other end of
the scale ranks West Bengal which is comparably well endowed with roads, although mostly
non-surfaced.
Table 51: Total road length of NW-1 riparian states versus national (km/’000 km2)
State/U.T. NH SH Others Total
Bihar 38.7 40.0 1196.6 1275.2
Jharkhand 22.6 23.6 173.0 219.1
Uttar Pradesh 24.4 34.8 1122.0 1181.2
West Bengal 28.4 18.9 2332.2 2379.4
India 20.3 47.0 847.6 914.9
Source: Statistical Abstract, Census of India 2011
In terms of national and state highways, Bihar has the densest network of the four riparian
states, comparable to India as a whole.
Table 52: Total road length of NW-1 riparian states versus national (% km/’000 heads)
State/U.T. NH SH Others Total
Bihar 0.04 0.04 1.09 1.16
Jharkhand 0.05 0.06 0.42 0.53
Uttar Pradesh 0.03 0.04 1.35 1.43
West Bengal 0.03 0.02 2.27 2.32
India 0.06 0.13 2.30 2.49
Source: Statistical Abstract, Census of India 2011
However, density of the road network does not give any indication of its condition. The road
network suffers from deficiencies in terms of pavement thickness, distressed bridges, etc. Total
transport costs - road user costs plus road agency costs of construction, maintenance and
rehabilitation - are minimized at an axle load of 11 tons. However, approximately 80-90% of
the national and state highways are not suitable for the permissible axle loads of 10.2 tons.
Massive investments are needed to strengthen the network for the currently prescribed axle
loads. In summary, not only the quantity but also the quality of roads and bridges needs
considerable improvement.
Light trucks and double-axle trucks dominate the Indian trucking industry, as narrow and badly
maintained roads have traditionally permitted only the use of smaller and more flexible
vehicles, and as regulations prohibiting the overloading of vehicles have been poorly enforced.
The small vehicle sizes and widespread overloading mean that Indian trucking costs are
IWT Sector Development Strategy and Business Development Study for Capacity Augmentation of National Waterway 1 from Haldia to Allahabad 147
amongst the lowest for bulk and heavy goods, but the cost for relatively lighter products —
electronics, pharmaceuticals, chemicals, etc. — is substantially higher.
5.2.3 National Waterway No. 1
Major constraints against connecting potential NW-1 users were expressed during the
Consultants’ market survey. The following constitutes a summary of interviewees’ comments:
Present mode of water transport is by coastal vessel, as neither river-sea vessels nor inland-
waterway barge services are available on the NW-1;
Insufficient road and rail connectivity to the plant and availability of service;
High cost of transportation besides availability of service and reliability on the NW-1;
Logistical bottlenecks, connectivity and infrastructure;
Non availability of infrastructure and services;
Inland waterways are more circuitous then roadways and railways;
Insufficient draft in the river;
Absence of mechanized loading and unloading in the terminals;
Involvement of multi-modal transportation, thus broken traffic;
Absence of both-way cargo;
Absence of easy bank-loan facilities for new ship-building in comparison to availability of
“house loan”, “car loan” etc.
Absence of tonnage tax on barges registered under I.V. Act 1917. There was a tax benefit
available under Section 33 AC of Income Tax Act 1961 for all the ships, which include barges
and even pontoons. This section had been scrapped with effect from year 2005- 06, denying
benefit to barges registered under I.V. Act 1917. From year 2005 -06, tonnage tax was
introduced under u/s 115V to 115VZC in I.T. Act 1961, whereby ships registered under the
M.S. Act were given the benefit of lower tax.47
Presence of waterway charges: Using free-flowing water should not attract any charges.
Maintaining navigability of the river is like maintaining a road which users do not pay any
direct charges for. This is a hindrance for waterways to develop and to compete with other
modes. In case the authority created any infrastructure, then it could charge users for using
the same.
The following list indicates the prioritized needs of the interviewed market actors as
prerequisite for using the NW-1:
This was stated by Mr S. Rakshit of the inland-barge operator Vivada Corporation Pvt Ltd in Kolkata (contact: cell
09903000269, [email protected])
IWT Sector Development Strategy and Business Development Study for Capacity Augmentation of National Waterway 1 from Haldia to Allahabad 148
Adequate water depth with a guaranteed LAD maintained throughout the year;
Stable and preferably buoyed channels with a width of at least 60 meters;
Dredging, modern river information system (RIS), digital global positioning system (DGPS),
night navigation facilities and modern methods of channel marking;
Freight tariff rates cheaper than alternative transport modes;
Adequate night navigation facilities;
Adequate amount of storage space - both covered and open with modern mechanical
handling facilities (particularly for container and bulk handling);
Multi modal terminals with adequate facilities for handling all different commodities without
disturbing each other;
Channel marking and other clearance issues associated with the investing process;
Absence of local (especially while crossing the state of Bihar) and political disturbances;
Ro-ro facilities for heavy lift / ODC and automobiles;
River bank (both sides) risen onto an embankment by compacted soil;
Integration of coastal and inland waterways;
Documentation for EXIM cargo at inland terminals.
5.3 Examination of origin-destination pairs
Origin-destination pairs, which the Consultants during their market survey identified as
commodity transport feasible for being diverted onto the NW-1 (for a description of the
individual commodities see previous Chapter 3.5), were further analyzed by their Transport
Model. Table 53 overleaf depicts the 20 important commodities transported within the NW-
1 catchment area, which could be most profitably shipped on the NW-1, their origins and
destinations, and their most significant parameters and associated costs.
IWT Sector Development Strategy and Business Development Study for Capacity Augmentation of National Waterway 1 from Haldia to Allahabad 149
Table 53: Important commodities divertible onto NW-1 as identified through the Consultants’ market survey
Commodity Type
Cargo Type Current
Transport Mode
Origin Destination Distance
[km]
Estimated Travel Time
[days]
Volume 2014 [tons]
Growth expected by Pro-
ducer (%)
Freight Costs per
ton per km [Rs/ton/km]
Freight Rate
[Rs/ton]
Value of Time
[Rs/ton]
Generalised Cost
[Rs/ton]
Coal
Dry Bulk
Road Haldia HDC Partapgarh 941 2.0 30,000 8 6.50 6,116.5 3.4 6,119.9
Fly Ash IWT Durgapur (W.B.) Narayanganj/Bangladesh 925 5.5 807,000 1.12 1,036.0 11.8 1,047.8
Iron Ore Rail Barauni (Bihar) Haldia 574 1.2 10,200 10 2.18 1,251.3 2.6 1,253.9
Lime Stone Road Kolkata Allahabad 800 1.7 2,571 5 3.00 2,400.0 6.6 2,406.6
Sand Road Mangalhat Kolkata 352 0.7 73,500 3.45 1,214.4 2.9 1,217.3
Stone Chips Road Sakrigali Gauthamsthan, Bihar 389 0.8 179,200 3.45 1,342.1 3.2 1,345.3
Plastic Granules
Bagged
Road Kanpur (U.P.) Kolkata 1,160 2.4 6,300 5 3.65 4,234.0 5.2 4,239.2
Grain Road Fatuwa Haldia 628 0.9 50,000 0 4.00 2,512.0 104.7 2,616.7
Cement Road Varanasi Patna 269 0.6 1,000 10 4.20 1,129.8 2.2 1,132.0
Fertilizer Rail Vishakapatnam Katihar Railway Station 1,290 2.7 23,400 1.50 1,935.0 20.1 1,955.1
Steel
Neo-bulk
Road Fatuwa Kolkata 536 0.7 150,000 4.00 2,144.0 44.7 2,188.7
Petroleum Rail Numaligarh/Assam Haldia 1,442 3.0 24,138 10 2.57 3,705.9 6.4 3,712.4
Logs & Wood Road Faizabad Kolkata 878 1.8 3,120 10 3.30 2,897.4 7.3 2,904.7
Textiles Road Kolkata Sultanpur 830 1.7 7,200 3 5.00 4,150.0 74.7 4,224.7
Project Cargo Road Fatuwa Kolkata 536 0.7 80,000 4.00 2,144.0 357.3 2,501.3
Statues Road Chunar Kolkata 692 1.4 40,000 5 4.90 3,390.8 62.3 3,453.1
Paper Road Karnataka Kolkata 2,200 4.6 4,286 5 3.60 7,920.0 198.0 8,118.0
Food Gen. Cargo Road Kolkata Allahabad 790 1.6 8,400 5 7.00 5,530.0 10.6 5,540.6
Containers Container Road Kolkata Varanasi 582 1.2 972,000 10 10.52 6,120.5 104.8 6,225.2
Vehicles Ro-Ro Road Delhi Kolkata 1,500 3.1 27,000 5 46.67 70,005.0 333.9 70,338.9
Source: Consultants’ Market Survey, August-October 2015
IWT Sector Development Strategy and Business Development Study for Capacity Augmentation of National Waterway 1 from Haldia to Allahabad 150
The volume of selected commodities transported over the year varies between 1,000 tons and
almost 1 MMT, some of which are being moved in small parcel sizes on voyages spread over the
entire year.
At present, all commodities of the selected O/D pairs – with exception of fly ash – are being
transported on land. Vehicles and general cargo, both in break-bulk form or containerized, but also
most bagged and neo-bulk cargoes are being trucked on road. Except for three O/D pairs, the main
bulk of the selected commodities is trucked on road over distances which are only somewhat
shorter than those covered by rail transport. Specific commodities such as vehicles, but also rolled
paper and bagged plastic granules, are being trucked over distances exceeded 1,000 km. Even low-
value commodities (usually cargoes predestined for IWT) such as coal and lime stone are being
trucked over long distances. The average distance between origin and destination of the individual
commodities equals to approximately half the length of the NW-1.
Travel times are estimated to usually sum upto more than one day, they average two days, and for
one fourth of the selected O/D pairs they exceed this average up to a travel time almost at par with
the 5.5 days required by barging fly ash into Bangladesh.
Except for very specific commodities transported on an ad-hoc basis, such as project cargo, and
where cargo owners or transport operators were unsure about future demand, most interviewees
expected a demand growth between 5% and 10% per annum for the short to medium term.
Freight costs (on a ton-km basis) of land-based transport are approximately double those of IWT,
with a significant cost difference between road and rail transport only for higher-value
commodities which also require specific (un)loading procedures, such as vehicles and project
cargo, but also palletized textiles, breakable statues and bundled steel rods.
Value of time (defined as the interest on the investment into the commodity itself during the
duration of any voyage) generally remains below 2% of the freight price.
In a sum, aggregated (generalized) costs (on a per-ton basis) for a voyage remain below Rs 10,000,
with the significant exception of vehicles where generalized) costs amount to seven times that
level.
IWT Sector Development Strategy and Business Development Study for Capacity Augmentation of National Waterway 1 from Haldia to Allahabad 151
6 General Competitiveness of IWT
Within the framework of the Market Development Study and as a part of the Market Survey, this
chapter looks into the competitiveness of IWT in comparison to road and rail transport in general
and with a special focus on India’s NW-1.
6.1 Supply chain review
Supply Chain Management (SCM) can be divided into three main areas: purchasing, manufacturing,
and distribution. From end to end, this includes decisions about which input materials to use,
production quantities, inventory levels, distribution network configuration, and transportation for
the input materials as well as for the finished products. Logistics Management is the component
of SCM that focuses on how and when to get these from their respective origins to their
destinations. It also includes coordination and collaboration with channel partners, which can be
suppliers, intermediaries, third-party service providers, and customers. In essence, SCM integrates
supply and demand management within and across companies, and can be a real point of
competitive differentiation.
For an effective, cost efficient Logistics Management, a company must lay the foundation for a
responsive, economical transportation network. By that, the company is able to implement major
strategic changes to reduce costs and increase customer service levels with very little disruption to
the overall supply chain flow.
Figure 44: Supply chain
Source: http://ashasmaritimenews.blogspot.de/2012/04/supply-chain-in-container.html
IWT Sector Development Strategy and Business Development Study for Capacity Augmentation of National Waterway 1 from Haldia to Allahabad 152
Transportation and logistics related costs as a percentage of sales range from 9% to 14%
depending on the industry sector. This range includes all logistics related expenses such as
warehousing, dedicated personnel, and transportation expense. Transportation costs alone
comprise the vast majority of this expense for most companies, amounting up to 30-60% of
the logistics operations costs.
During the 1990s and early 2000s, the high availability and low cost of transportation
services relative to the cost of keeping inventory encouraged companies to emphasize fast,
frequent delivery to customers through means such as just-in-time delivery. However,
things have changed in the last decade, especially due to volatile (and for a long time rising)
oil prices as well as an imbalance of supply and demand for freight transport services. This
has led to increasing transportation costs, high enough to cause companies to make
transport-driven shifts in their supply chain strategies.
The first shift considers the sourcing strategies away from long distance shipments. The
second is a shift from designing products and packaging for marketability and more efficient
production toward designs that also incorporate "shipability" considerations, i.e. focuses
e.g. on dimensions for space efficiency and easy handling, providing protection of goods in
transit, like through the use of intermodal units. The third is a shift from lean inventory
strategies to hybrid lean inventory/transportation strategies, i.e. instead of using just-in-
time deliveries by road transport, now IWT is considered an alternative where the –albeit
slower – vessel is part of the inventory and transportation strategy. Even though oil prices
have come down again, which again makes road transport more feasible, the changes that
were made may be a good long term precaution against price changes and other risks in the
supply chain and may support the use of IWT transport.
There are two key players in any transportation process within a supply chain. The shipper
is the one who requires the movement of the product between two points in the supply
chain and uses transportation to minimize the total cost (transportation, inventory,
information, and facility) while providing an appropriate level of responsiveness to the
customer. The carrier is the one that actually transports the product and makes investment
decisions regarding the transportation means (rails, locomotives, trucks, ships, airplanes)
and then makes operating decisions to try to maximize the return from these assets.
Mode selection is based on the relative strengths of each modal/intermodal option in terms
of accessibility, transit time, reliability, safety and security, transportation cost, and the
nature of the product being transported. The carrier’s choice focuses on the type of service
required (direct or indirect), geographic coverage, service levels, and the carrier’s ability and
willingness to negotiate reasonable rates.
From a supply chain perspective, the main reason for using inland waterways as a mode of
transport is the fact that it decreases the total cost, when used as part of the end to end
logistical requirement of cargo movement. The closer the origin and/or destination of the
shipment to the waterway, the higher the advantage for IWT compared to other modes of
transport. Along the NW-1 corridor several users have been identified that have potential
to use IWT for their commodity transports; however, while many industries are located near
waterways for convenience of water use, the actual use of waterways for transport is still
IWT Sector Development Strategy and Business Development Study for Capacity Augmentation of National Waterway 1 from Haldia to Allahabad 153
Customers with regular demand, like power plants requiring coal or regular shipments of
construction materials;
Customers with seasonal demand, like food grains and fertilizers;
Project-based demand, like construction material and equipment related to particular
projects as e.g. new thermal plants along NW-1, which often includes over-dimensional
cargo;
Import/export traffic through the main ports offer a potential for onward transports, like
intermodal transport of containers.
During the stakeholder interviews it became clear that the majority of companies has
organized their transport chains based on truck transportation with some shares for rail
transport. However, all expected rising transport volumes in the next years and would be
interested in integrating IWT via NW-1 in their transport chains, provided a reliable and cost
effective service is offered. For example, the edible oil industry has already prepared supply
chain schemes considering the use of IWT as they see potential advantages with regard to
shifting customs clearance from the seaports to the inland ports of destination.
In general, changes in the supply chain organizations will only happen if certain prerequisites
are fulfilled, namely navigability and infrastructure availability, service reliability, and not at
least cost competitiveness.
6.2 Cost competitiveness of IWT compared to road and rail
As mentioned in the previous sub-chapter, there are two key players in the transportation
process that deal with different cost components. A carrier, like an inland shipping company,
a rail or trucking company, has to take into consideration the following costs:
Vehicle related costs, i.e. the investment in the transport vehicle (barge, wagon, truck)
as well as interests, leasing and depreciation. These costs are fixed as they incur
independent of the actual operation, at least in the short term. With regard to medium
to long-term planning decisions these costs are variable depending on the number of
vehicles acquired.
Fixed operating costs, i.e. any expenses in relation to terminals and labor independent of
the actual vehicle operation. For operational decisions these costs are fixed, while for
planning decisions concerning the location and size of facilities these costs are variable.
In general, these costs are proportionately to the size of the operating facilities.
Trip related costs, i.e. basically for labor and fuel as well as maintenance and repairs
incurring for each trip independent of the quantity transported. These costs depend on
the length and duration of the trip.
Quantity related costs, i.e. the loading/unloading costs and the part of the fuel costs that
varies with the transport volume.
IWT Sector Development Strategy and Business Development Study for Capacity Augmentation of National Waterway 1 from Haldia to Allahabad 154
Overhead costs, i.e. the costs of planning and scheduling a transportation network as
well as investments in information technology, like e.g. routing software.
A carrier’s decisions are also affected by the responsiveness he seeks to provide his target
segment and the prices the market will bear. For example, a carrier may use a hub-and-spoke
system for providing fast and reliable delivery times while another may use the direct transport
to provide cheaper transportation with longer delivery times. The difference between the two
systems is reflected in the pricing schedule. From a supply chain perspective, a hub-and-spoke
network is more appropriate when prices are independent of destination and fast delivery is
important, whereas a direct delivery is more appropriate when prices vary with destination and a
somewhat slower delivery is acceptable.
For the other key player in the transportation chain, shippers’ decisions include the design of the
transportation network, the choice of means of transport, and the assignment of each customer’s
shipment to a particular means of transport. A shipper’s aim is to minimize the total cost of
fulfilling a customer’s order, while achieving the assured responsiveness. A shipper has to take
account of the following costs when making transportation decisions:
Transportation costs, i.e. the total amount paid to the various carriers for transporting
products to customers. These depend on the prices offered by the different carriers and the
extent to which the shipper uses cheaper but slower or expensive but fast means of
transportation. Transportation costs are considered variable for planning and operational
decisions as long as the shipper does not own the carrier.
Inventory costs, i.e. the costs of holding inventory incurred by the shipper’s supply chain
network.
Facility costs, i.e. the costs of various facilities in the shipper’s supply chain network; this
includes the direct warehousing costs for rent or investment in real estate, personnel,
storage equipment (e.g. for forklifts, shelves, conveyor belts, etc.), energy, and other
(e.g. for facility management or building insurances)
Processing costs, i.e. the costs of organizing loading/unloading orders as well as other
processing costs associated with transportation.
Service level costs, i.e. the costs of not being able to meet delivery commitments. These
may sometimes be clearly specified as part of a contract while in other cases it may be
reflected in customer satisfaction.
A shipper needs to make a trade-off between all these costs when making transportation
decisions. Furthermore, his decisions are also impacted by the responsiveness he seeks to
provide his customers and the margins generated from different products and customers. For
example, a shipper promising delivery within a certain time window specified by the customer
will require different or more means of transport than a shipper whose customer is willing to
accept delivery at any time.
IWT Sector Development Strategy and Business Development Study for Capacity Augmentation of National Waterway 1 from Haldia to Allahabad 155
An analysis in the EU48, which can also be generalized to other countries, has shown that the
cost structure for road, rail and inland waterway transport is similar. The labor costs have the
highest share, followed by fuel, capital costs, taxes and insurances, and administration costs.
In road transport the labor costs stand for the overwhelming majority, while in rail transport
fuel, capital, and maintenance costs play an almost equal role. In IWT the cost structure focuses
again on labor and fuel costs. Details with regard to the NW1 cost structure are included in the
assumptions made for the transport model (see Chapter 10.1).
In India, the prevailing mode of transport is the truck and the share of rail in freight and
passenger traffic has been declining over the years. The reasons are pricing policies and non-
pricing attributes of the two modes. Rail transport is a state-owned monopoly subject to price
regulation. The pricing system for rail transport covers all costs, including that of the fixed
infrastructure. Furthermore, there is no distinction between the freight and passenger
segments, which leads to considerable cross-subsidization.
Road transport on the other hand is a privatized market competing for freight traffic and the
prices of freight transport by trucks are determined by the free market. However, passenger
road transport is carried out under a regime of price regulation for both, private and public
operators. Road pricing does not reflect the total costs for fixed infrastructure and its
maintenance. Besides, the road and fuel taxes have hardly any relation to the resource costs
of various inputs. In road transport, the freight and passenger segments operate as
independent entities so that there is no element of cross subsidization.
Indian trucks are usually all-purpose, used for transporting everything from agricultural
produce to steel products to higher-value electrical items. Poor maintenance and low-quality
spare parts rapidly reduce operational efficiency of trucks. Light trucks and double-axle trucks
dominate the Indian trucking industry as narrow and badly maintained roads are better only
used with smaller and agiler vehicles, and as regulations prohibiting the overloading of vehicles
have been poorly enforced. The small vehicle sizes and rampant overloading mean that Indian
trucking costs are amongst the lowest for bulk and heavy goods, but the cost for relatively
lighter products, electronics, pharmaceuticals, chemicals, etc., is substantially higher. 49
In the absence of more flexible practices, customers usually engage point-to-point trucking
services on a full-load basis. Further inefficiencies sometimes result, when for short to
medium-haul distances trucks are forced to return to their base without a load. In total, the
industry is strongly competitive with low barriers to entry for either operator or driver, a high
degree of substitutability, and significant bargaining power vested with the purchasers of
trucking services. The capital required to enter the market is small, the licensing regime is not
exceedingly strict, and only basic skills and qualifications are necessary.
The high degree of competition within the trucking industry puts pressure on the prices
charged. Margins are recovered by cutting costs, such as by hiring drivers with suspect licenses,
by overloading, and compromises on maintenance, each of which contributes to a high
occurrence of accidents and mechanical failure. Service quality in terms of keeping to schedule
and ensuring safety are not made priorities. Once on the road, the often unsafe trucks face
48 European Commission, Fact-finding studies in support of the development of an EU strategy for freight transport
logistics, Lot 1: Analysis of the EU logistics sector, Final Report, Brussels, January 2015 49 See National Transport Development Policy Committee, Vol. 2, Part 1, Chapter 4. Integrated Transport: Strategy and
Logistics, 2013
IWT Sector Development Strategy and Business Development Study for Capacity Augmentation of National Waterway 1 from Haldia to Allahabad 156
several problems, like potholed roads or clogged highways which reduce their speeds to about
a third of that achieved by developed-world counterparts. Further, on a transnational journey,
they are stopped at multiple checkpoints for inspections, payments of tolls and taxes, “tea
money”, etc. It is well-acknowledged that many of these payments have no legal basis, and
unjustly add to the transportation costs.
Lower operational priority and operation above capacity have implications for quality of
service of freight trains and severely restrict Indian Railway’s ability to meet customer
expectations. The speed of freight trains has largely remained at only 25 to 29 km per hour
during the past three decades (about half of the speed of trains in the USA). Furthermore, IR
does not operate real heavy-haul freight trains that increase the cost-efficiency of freight
operations as the infrastructure is common to both, passenger and freight trains. The
maximum payload carried on trains in India is 5,400 tons, compared to 20,000-37,000 tons in
China, South Africa, Brazil and Australia. This is expected to change only when the Dedicated
Freight Corridors (DFC) become operational, when the maximum payload will rise to 12,000
tons per train. Moreover, the parcel size of cargo is presently restricted to 2,400-3,800 tons
and, therefore, leaves out many customers even in the bulk-cargo segment.
Despite growing freight transport volumes, IWT represents less than 1% of the modal share.
Regardless of the efforts to improve the inland waterway sector in India, it still lacks interest
from market partners, such as shippers. The mandate of IWAI is to develop and maintain the
fairway and navigation infrastructure, as well as terminals to enable the commercial use of the
National Waterways. Nowadays, NW-1 is used by various private cargo vessels, such as bulk
cargo and general cargo vessels, tourist vessels, and IWAI vessels. States are allowed to raise
levies and duties on the river, partly collected physically by state officials from the carriers
directly at the state boundaries. Such kind of delays hinders timely transport flow, especially
influencing the private sector and at the end the final consumer.
There is a transport subsidy for movement of raw materials and finished goods for the new
industries of the North East Region, but this is applicable only for rail and road modes and not
to IWT. Similarly, the transport subsidy available for movement of fertilizers is also meant for
rail and road modes only.
The following table compares the investment costs related to the three modes of transport. It
can be seen that the investment into waterways is by far the lowest as these are in general
naturally available, while railways and roadways need considerably higher investments. With
regard to the transport equipment, the acquisition costs of a barge are considerably higher
than a truck, but lower than a rail wagon plus locomotive (which is necessary for the haulage
and therefore has to be taken into consideration). When put into relation to the payload it
shows that the required rail investments are clearly the highest for the transport of a given
volume of cargo.
IWT Sector Development Strategy and Business Development Study for Capacity Augmentation of National Waterway 1 from Haldia to Allahabad 157
Table 54: Comparison of investment cost by mode in India (Rs)
Variable / Mode IWT Rail Road
Cost for developing 1 km of fixed infrastructure
5,000,000 40,-60,000,000 40,-60,000,000
Transport equipment investment cost 60,-80,000,000 for a 2,000 dwt
barge
150,000,000 for a locomotive
1,200,000 for a wagon
1,050,000 for a truck
Payload 1,500 tons per barge
65 tons per wagon
25 tons per truck
Investment cost for equipment required to transport 3,000 tons cargo
140,000,000 205,200,000 126,000,000
Source: HPC 2015, based on Internet research
In respect to operating costs per ton-km, IWT shows the lowest costs compared to rail and
especially road. However, this cost argument has to be put into perspective, as it is generally
true for single mode carriages but not for door-to-door transports including cargo transfer and
pre/end haul. The total cost advantage of IWT depends much on the length of transport on
waterways and the distance of the consignee to or from the transfer point. Finally, there are
different types of transfer needs, closely related to the commodity as well as to port facilities
and these result in different costs. In unfavorable situations the costs of transfer are double
the waterway transport costs. On the other hand, many examples show that intermodal
transport with inland navigation is efficient. Thus, even with additional costs in intermodal
transport, as compared to direct road transport, the low costs of IWT more than compensate
the additional costs of transfer and road haulage if the main leg is long enough.
Table 55: Modal comparative operating costs in India
Mode Vehicle Operating Costs
(Rs/ton-km) Effective Taxes
Total (Rs/ton-km)
IWT 1.61 - 1.61
Rail 1.36 3.71% 1.41
Road 2.50 3.09% 2.58
Source: RITES, Preparation of Integrated National Waterways Transportation Grid, June 2013
Stakeholder interviews with regard to freight transports in the NW-1 catchment area also show
that freight rates for road transports are usually clearly higher than for rail transports,
depending on the origin/destination of transport. So far only limited IWT traffic takes place,
but here the freight rates are even lower as the following table shows.
The IWT vehicle-operating costs derivated by, and used for, the RITES study of 2013 are in the
same cost range as the elaborated costs by the Consultants of this report. By comparing the
figures of Table 25 “IWT Costs for Movement of Cargo” in Chapter 4.2.3 “IWT”, the RITES result
does only differ slightly from the costs per ton-km of a 1,000 barge in upstream operations. Thus,
the 1.06 Rs per ton-km by RITES definitely represent the upper level of costs as by increase of
barge/vessel capacity and/or downstream operations the costs per ton-km decrease distinctly.
It is the more conservative assumption and does not really represent an average but a
maximum cost basis.
In Chapter 4.2.1 “Railway” costs for rail operations have been listed in Table 21 “Railway Cost
for Movement of Cargo by Cost Elements”. The situation is quite similar as the costs mentioned
IWT Sector Development Strategy and Business Development Study for Capacity Augmentation of National Waterway 1 from Haldia to Allahabad 158
by RITES are more of the higher cost. For this report, costs have been derivated based on the
“Total Transport System Study” which result in 1.29 Rs. per ton-km assumed a diesel powered
train is travelling on a ghat section with an incline larger than 1%. This is still below the 1.36
Rs. per ton-km without or 1.41 Rs. per ton-km including taxes. Thus, the more conservative
costs have been used by RITES in 2013.
In order to compare this truck costs to the already mentioned, Rs. per ton-km in Chapter 4.2.3
“Road” (refer to Table 24 “Road Costs for Movement of Cargo) the operating costs of trucks do
contain fuel & oil consumption, labor expenses, repair and maintenance as well as depreciation
and capital costs. Tolls and congestions fees are not really part of the vehicle operating costs.
Table 56: Comparison of freight costs by mode and commodity in NW-1 area (Rs)
Commodity Road Rail IWT
Cement 3.40 – 4.24 /ton-km 1.61 – 3.40 /ton-km …
Fertilizer 2.35 /ton-km 3.55 /ton-km …
Natural aggregates 2.30 /ton-km 1.80 /ton-km 1.60 /ton-km
Petroleum products … … 6.72 /ton-km
Source: Consultants’market survey, based on stakeholder interviews (point 8 of questionnaire)
From the economic point of view IWT is a low cost mode as well. The maintenance and
operating costs of infrastructure are comparatively low (about 20% of that of roads). In
addition, IWT is a highly fuel efficient mode of transport; it is estimated that one liter of fuel
can move 24 ton-km freight by road, 85 by rail, and 105 by IWT. In summary, IWT has the
lowest costs and usually pays no infrastructure charges. Prices in IWT tend to cover costs
adequately, which is not the case in for road transport where market prices tend to be below
cost levels, while rail transport remains highly subsidized.
6.3 Service attributes of IWT compared with road and rail
Modal shift towards IWT has not reached the desired levels yet. It is therefore important to
understand first how the decision-making process of shippers and freight logistics providers
works in order to know the variables that would need to be adapted from the practical side to
stimulate modal shift towards IWT in promising market segments.
From the demand level, customers can have specific requests for a particular transport mode
and quality of transport based on the type of goods to be transported and the dimension of
the shipments. From the supply level, the modal choice is based upon two key drivers:
Costs (i.e. door-to-door transport costs and inventory costs);
Quality of the transport service (i.e. reliability, door-to-door transit time, flexibility,
safety/security, frequency, network coverage, mass/bundling capability, availability of
loading units, information exchange, organization of the supply chain, and
complementary logistics services).
IWT Sector Development Strategy and Business Development Study for Capacity Augmentation of National Waterway 1 from Haldia to Allahabad 159
These two key drivers are mainly influenced by
Location: Transport costs vary depending on the distance between the shipper and the
recipient and the distance between those and the ports/terminals. If the shipper and/or
the recipient are not located directly along a waterway, transfer of cargo onto other
transport modes is needed which increases the costs. The location will also have impacts
on the indicators of the quality of transport, such as the reliability (e.g. locations in
structural congested areas), door-to-door transit time, the frequency of the available
services, the network coverage and the bundling capabilities (e.g. based on the type and
size of the economic activity in the area).
Transport Network Infrastructure: This is not only related to the availability and quality
of the infrastructure of waterways, railways and roads, but also to infrastructure at the
terminals, ports, distribution centers and production/processing sites. These aspects
affect the quality of the transport (e.g. transit time) and the level of costs (e.g. transfer
costs).
Legal and Political Framework (in a country or corridor): Restrictions, taxes and charges
increase the level of the transport costs. Restrictions also affect the quality of transport
(e.g. network coverage and accessibility).
External Factors: There are other external factors such as congestion, water levels,
strikes, hindrances due to accidents or infrastructure works that influence the quality of
transport (e.g. reliability, transit time, network coverage and flexibility). Costs are also
affected by these external factors, for example through low water charges or additional
labor and fuel costs in case a truck needs to adjust its route). This results in increases in
the external costs like environmental and social costs.
Economic Factors: Costs are also influenced by economic factors such as the level and
development of the different cost components (e.g. fuel costs, labor costs,
maintenance, capital costs, insurance and other type of costs).
The quality of transport also influences the costs. For example, just-in-time deliveries are
made possible by reliable transport services with a high frequency. This reduces the
inventory costs. Also, the possibility of bundling cargo leads to higher frequencies of services
and through higher load factors the transport costs per unit decrease.
IWT Sector Development Strategy and Business Development Study for Capacity Augmentation of National Waterway 1 from Haldia to Allahabad 160
Figure 45: Determining factors in modal shift for freight transportation
Source: EU DG Move, Platform for Implementation of NAIADES II, WP1 Market and Awareness, Page 31, Brussels 2013
Against this background, the following tables present illustrations of IWT, rail and road
strengths, weaknesses, opportunities and threats (SWOT) in freight transport in general, and
in India and the NW-1 in particular. The SWOT-analysis constitutes a strategic planning
instrument which is used for a precise consideration of different possible strategies. The tables
help comparing the three transport modes and identifying corresponding future aspects,
chances and risks.
IWT Sector Development Strategy and Business Development Study for Capacity Augmentation of National Waterway 1 from Haldia to Allahabad 161
Table 57: SWOT-analysis IWT
Source: HPC 2015, based on RC Agarwal Transportation, http://www.yourarticlelibrary.com/geography/transportation/;
UNESCAP, Promotion of IWT in the Multimodal Transport World; Stakeholder Interviews
As shown in above Table 57, among the particular strengths of IWT is the ability of an
environmentally friendly transport of large capacities of bulk cargo. In this, one can also see
future opportunities as the corresponding equipment of other modes is likely to be either
limited or restricted by law and size. Furthermore, whereas rail and road infrastructure is often
subject to congestion, this is usually not the case for IWT. Among the most visible weaknesses
of IWT are the low transport speed and its limited area of operation, depending on the
infrastructural premises and depth of the waterways. Moreover, there are only very few cases
in which IWT can offer door-to-door transport of cargo. Possible related threats for IWT include
operational disruptions due to weather.
IWT Sector Development Strategy and Business Development Study for Capacity Augmentation of National Waterway 1 from Haldia to Allahabad 162
Table 58: SWOT-analysis Rail
Inte
rnal
vie
w
Strengths Weaknesses
Fixed routes and schedules, therefore service is in general more certain, uniform and regular than other modes
High speed over long distances
Limited operating costs, esp. with regard to labor
Limited accidents and breakdowns; cargo can be protected from exposure to sun, rain, wind
Large transport capacity per shipment
Large investments in construction, maintenance and overhead; investments are immobile, i.e. in case of insufficient traffic the investments cannot be shifted and resources are wasted
Inflexibility of routes and timings, which cannot be adjusted to individual requirements
Hardly any door-to-door transport possible (unless sender/receiver is located at the rail track); usually service is tied to particular track and intermediate handling involves high cost and more time
Transport is not economical for short distances and small transport loads
No service in rural areas because of high capital requirements
Exte
rnal
vie
w Opportunities Threats
Dependable mode of transport as being least affected by adverse weather conditions and time of day
Limited number of carriers so that the lack of competition may lead to inefficiencies and higher costs
Rail in the NW-1 region is working at or beyond capacity limits
Source: HPC 2015, based on RC Agarwal Transportation, http://www.yourarticlelibrary.com/geography/transportation/;
UNESCAP, Promotion of IWT in the Multimodal Transport World; Stakeholder Interviews
Table 58 shows that rail transport plays its strength when it comes to the transport of
comparatively large shipments at a relatively high speed. As rail operation is based on fixed
routes and schedules, it also offers a generally more certain and regular service than other
modes of transport. In this regard, one can also see future opportunities for rail transport, as
it tends to be less affected by adverse weather conditions and can offer 24/7 operations.
Among the weaknesses of rail transport are the large investments necessary for construction
and maintenance as well as its higher inflexibility compared to IWT and road transport.
Potential threats for rail transport may result from inefficiencies and higher costs caused by a
lack of intra-modal competition as well as capacity restrictions of the rail infrastructure.
IWT Sector Development Strategy and Business Development Study for Capacity Augmentation of National Waterway 1 from Haldia to Allahabad 163
Table 59: SWOT-analysis Road
Inte
rnal
vie
w
Strengths Weaknesses
Road offers door-to-door service, which reduces transfer cost and also reduces the risk of damages of cargo
Good service in rural areas as exchange of goods between large towns and small villages is possible only by road
Flexible service as routes and timings can be adjusted and changed to individual requirements without much trouble
Higher risk of accidents and breakdowns
Limited transport volume per shipment
Unsuitable and costly for transporting bulk cargo and ODC
Restrictions for ODC/heavy load transports
Lack of organization, can be irregular and undependable
Carbon footprint
Exte
rnal
vie
w
Opportunities Threats
Cost of constructing, operating and maintaining roads is lower than that of railways
Very suitable for short distances
Transport is more independent of schedules
Road is mostly required for the first and last mile transport of rail and IWT cargo
Less reliable during rainy season, when roads may be unfit and unsafe to use
Road congestion often leads to delays
Road dimensions in India often inadequate
Roads in India often in bad condition and poorly maintained (<0.1% of national income spent on road maintenance, while 3% in Japan)
Heavy tax burden on motor transport in India (tax per vehicle in India Rs 3,500 while Rs 860 in USA)
Source: HPC 2015, based on RC Agarwal Transportation, http://www.yourarticlelibrary.com/geography/transportation/;
UNESCAP, Promotion of IWT in the Multimodal Transport World; Stakeholder Interviews
The SWOT-analysis for road transport is shown in above Table 59. Strengths of this mode of
transport include its ability to offer door-to-door services and its flexibility concerning routes
and timings. As it typically covers for the first and last mile of rail transport and IWT, road
transportation can possibly even benefit from future growth of rail and inland-waterway cargo.
Other opportunities for road transport may result from its comparatively low infrastructure
investment costs. Among the weaknesses of road transport is its limited transport volume per
shipment as well as restrictions for heavy-load transports. Potential threats include poorly
maintained and congested roads as well as a high tax burden on motor transport in India.
6.4 Required improvements to attract more traffic
The choice of mode is mostly determined by the shipper and his particular interests. In many
cases the shipper is connected with a carrier from a certain mode. Customer-carrier
relationships therefore play an important role in the decision process, particularly where they
are based on long term contracts. If customers are content with the carrier’s organization they
do not require a check of possible transport alternatives. From this point of view, fostering the
use of IWT is best done by making efforts to become involved in the decision making process,
i.e. to have strong representatives of IWT in these circles.
Another important point is that shippers will not find an optimum solution for their specific
transport problem without full knowledge of the conditions of available modes. As they would
normally not spend much time in collecting this information themselves, they should receive
offers from the representatives or operators of the modes involved. Thus, one way of
promoting inland navigation is by cultivating relationships to those actors who place transport
orders. That means it is important to invest in awareness and provision of information on the
advantages in costs, but also quality of transport (especially reliability) of IWT for the short,
IWT Sector Development Strategy and Business Development Study for Capacity Augmentation of National Waterway 1 from Haldia to Allahabad 164
medium and long term. In order to make IWT a success the strategic and direct advantages to
the shipper have to be promoted.
At the same time the existing limitations of IWT have to be addressed. The IWT sector in India
is rather under-developed, mostly due to natural reasons, like limited water depth, to policy
shortages, like lack of public investments and preference for other modes, and to lack of modal
integration of IWT terminals with road and rail networks. The following table gives an overview
of the identified limitations and reasons for not using IWT on the one hand and the proposed
improvement measures on the other hand. The overleaf table is based on both, the responses
of the stakeholders and potential users of NW-1 and generally available information.
Table 60: Identified IWT limitations and remedial measures for NW-1
Identified Limitations Improvement Measures
Inadequate depth for commercial movement of cargo, and in addition severe problems of siltation so that the river bed rises, hampering movement of cargo during non-monsoon months
Provision of 3m LAD along the NW-1 all year around or alternatively, design of low draft vessels
Development of river basins for the storage of flood waters in the upper catchment area, to be released during dry season while generating hydro-power; this will control floods during the monsoon and save land areas from erosion and prevent siltation at downstream end of river
Increasing stability of river banks and canals and providing a width of at least 60m*
Meandering river leads to further increasing travel distances compared to road and rail
Analysis of technical feasibility of straightening the waterway to avoid bends in order to reduce the IWT route length
Inadequate air draft as several bridges with low vertical clearance hinder the passage of larger IWT vessels e.g. on canals in the states of U.P., Bihar and W.B.
Raising the bridges to at least 5m above high flood level
Lack of night navigation infrastructure Provision of differential global positioning systems, light
buoys, river information services etc. along the whole NW-1 to allow 24 hours navigation
Shortage of IWT vessels as new buildings are capital intensive and face financing problems; the private sector is reluctant to invest as long as no long term cargo commitments, also for return trips, are made by users
Establishing a leasing company that acquires inland vessels and leases them out to operators to encourage IWT use with lower risks for operators
Setting up a dedicated IWT broker office in order to help organizing cargo movements in both directions, potentially combining shipments when feasible to also guarantee access for shippers with less than full barge load transports
Shortage of MRO facilities Involving private sector in setting up additional IWT ship
repair yard facilities on state government owned land
Insufficient terminal facilities for IWT cargo handling, leading to delays
Development of modern handling facilities for the different commodities, eliminating interferences, i.e. necessary equipment for bulk, containers, ro-ro /ODC/heavy cargo as well as adequate storage space (open and covered)
Lack of multimodal connections, which hinders door-to-door transport, leading to
IWT terminals need connections with other modes (at least road) for the first/last mile transport, i.e. at least all
IWT Sector Development Strategy and Business Development Study for Capacity Augmentation of National Waterway 1 from Haldia to Allahabad 165
longer transportation times than necessary
new terminals have to be planned at locations where a sufficient road connection exists or can be established, based on the analysis of origin/ destination cargo
Setting up of industrial corridors and logistics parks to enhance trade and related services, which drive key elements of supply chain to promote IWT as gateway to industries, coastal and seaports
Creation of feeder routes to connect national waterways, especially NW-1 and NW-2 and integration of IWT and coastal shipping
Motivation of shippers to establish new businesses near NW-1 waterfront with own jetty to avoid use of other modes at least at one end of the transport chain
Missing level playing field for the three modes as rail and road receive preferential treatment by policy measures **
Fiscal incentives and subsidies for freight transport should be available also for IWT, not just road and rail
Inclusion of IWT vessels in the tonnage tax regime
Equal treatment regarding transport infrastructure charges: review of waterway dues as operators do not pay for the use of roads directly
Lack of investment from public sources
Review prioritization of mode support in favor of IWT or at least in a more balanced way
Increase the possibilities for private sector participation by giving incentives, e.g. by providing compensation, like tax holidays, in the beginning if cargo commitments are not sufficient in both ways to allow an economically feasible service
Missing awareness of IWT as transport alternative
Setting up an IWT promotion centre integrating representatives of different stakeholders (shippers, operators, road, rail, state etc.) and developing a road-show for potential users
Low quality of IWT statistics
Permanent observation of relevant economic, financial and social parameters is crucial for stakeholders to anticipate market trends; therefore, a system of systematic, complete, and periodical data collection with scheduled reviews is required
Timely publication of statistics and online availability
Notes: * See HOWE-PMC-HRW, Intervention Measures Report, page 38: “In discussion with the Transport Consultant (HPC) two navigation channel widths have been considered in the analysis. These navigation channel widths fit within the range identified in the project ToR of 60 to 120m“
** See National Transport Development Policy Committee, Vol. 3, Part 2, Chapter 4. Ports and Shipping, page 336: “The government needs to establish a level playing field between the various transport modes. While IWT is cost competitive in general with other transport modes such as rail and road, the situation is sometimes distorted by preferential treatment offered to other modes. An example is freight subsidy for transportation of fertilizer being extended to rail and road but not to IWT. This makes rail and road artificially more competitive on the cost curve and drives traffic away from IWT. Road and rail also enjoy preferential tax treatment.“; see also pp. 340, 363, 369
Source: HPC 2015, based on stakeholder interviews (points 9-12 of questionnaire); NTDPC, Ports and Shipping, 2013
The identified limitations and suggested improvement measures, which to a large extent are
based on the stakeholder interviews, will be addressed in more detail in the “Development
Strategy for IWT in India” under Part C of this project.
6.5 Business development plan
At the present stage of the project only rather general information about the plans for business
development can be provided. To prepare a business plan for each commodity for NW-1, it
IWT Sector Development Strategy and Business Development Study for Capacity Augmentation of National Waterway 1 from Haldia to Allahabad 166
would have to be differentiated from which point of view these plans are developed, the
shipper of cargo, the IWT vessel operator, or IWAI. IWAI, as the authority for providing
navigability, is not actively involved in the decision process about shipments, but can only
provide favorable framework conditions to attract IWT transports (see section above) and can
facilitate the coordination between the different stakeholders.
Furthermore, a complete business plan requires considerable effort and time and has to be
prepared in cooperation with the respective stakeholder. The following figure gives an
overview of the strategic business development process in general. This project at present is
in the process of defining the critical success factors.
Figure 46: Strategic business development
Source: http://www.solutionstream.ca/
The first phase of the business development process covers the outline of the descriptive
information about the current business, like service features and benefits, technology
descriptions and classifications, infrastructure and organization, staffing, third party service
providers and suppliers, legal information, and ownership structure. In the next step the
market competition is analyzed with regard to market size, segmentation and growth,
customer profiles and future development potential. Based on this, a market strategy and
business model is developed, defining goals and milestones, marketing and sales programs,
potential alliances and value chains, operations planning, pricing approach, and risk mitigation
and contingency plans. Finally, the planned financial performance is addressed, resulting in a
cash flow analysis and projected use of funds.
6.5.1 Cargo services
With regard to the development of the freight transport business on NW-1 seven commodity
groups have been identified that are showing further potential for IWT, namely thermal coal
(imported high-calorie coal, domestic low-calorie coal), coking coal and pet coke; building
materials (stone chips, cement, sand, steel coils/wires/girders); agricultural inputs (fertilizer
(urea), poultry feed, agro equipment); food grains and flour (wheat, corn, rice, flour); industrial
inputs (steel/iron, manganese ore, spirits, fly ash, limestone, plastics, paper); ro-ro and
IWT Sector Development Strategy and Business Development Study for Capacity Augmentation of National Waterway 1 from Haldia to Allahabad 167
containerized cargo; and over-dimensional cargo. The highest transport volumes are expected
for coal, stone chips, and fertilizer (urea).
Growing domestic production and rapidly increasing import volumes of dry bulk cargoes are
stretching the capacities of India's transport infrastructure, especially railways and ports. A
shortage of railcars and line congestion mean that e.g. several MMT of coal pile up at the end
of each year at the pit-heads of coal miners. Yet hardly a day passes without power plants
suffering a critical shortage of coal. Therefore, IWT business development is essential. So far,
this is hindered by several bottlenecks:
• Restriction of planning to development of trunk routes while not considering the total
supply chain;
• Lack of coordinated efforts between local administration and shippers of cargo with regard
to planning transport connections;
• Existing loading/unloading systems rather equipped to be used for railway and not IWT
handling;
• No time schedule available for arrivals of cargo loads which requires sufficient storage
space for uninterrupted production;
• Difficult warehousing conditions, stocks are exposed to pilferage and weather.
• In order to overcome these bottlenecks as well as to increase efficiency of operations and
to improve logistics costs the following measures should be addressed.
In order to overcome these bottlenecks as well as to increase efficiency of operations and to
improve logistics costs the following measures should be addressed:
• Coordination between the different actors of the supply chain and the infrastructure
developers;
• Use of state-of-art equipment technology;
• Introduction of GPS tracking system for prediction of timing of arrivals of empties at
loading points and loaded at unloading points for optimum utilization of related plants and
machineries;
• Upgrade of handling terminals and improvement of distribution network;
• Cost sharing in capital investments.
In summary, and rather independent from the type of commodity, the business development
of the freight transport sector on the NW-1 is largely dependent on the improvement of the
technical and organizational framework conditions. Shippers have expressed their interest to
use the waterway when the transport reliability can be assured.
The section overleaf discusses the costs as major determinant for feasibility of multi-modal
transport of individual O/D pairs. The Consultants continue the example of the 20 important
commodities, as exemplified in Chapter 5.3, which they selected from theirTransport Model as
most profitable for diversion onto the NW-1.
IWT Sector Development Strategy and Business Development Study for Capacity Augmentation of National Waterway 1 from Haldia to Allahabad 168
Table 61: Important commodities via NW-1 - multi-modal transport parametersand associated costs
Commodity Type
Entry Point NW1
Exit Point NW1
"First Mile"
Distance
Distance IWT [km]
"Last Mile"
Distance
Estimated Travel Time
[days]
Freight Rate "First Mile"
[Rs/ton]
Terminal Handling
Rate (Entry)
[Rs/ton]
Freight Rate IWT
2020 [Rs/ton]
Freight Rate IWT
2025 [Rs/ton]
Freight Rate IWT
2035 [Rs/ton]
Freight Rate "Last
Mile" [Rs/ton]
Value of Time IWT
Route [Rs/ton]
Generalised Cost IWT
Route 2015 [Rs/ton]
Coal Haldia MMT Ramnagar 0 1,281 146 7.9 0.00 62.46 2,355.89 1,886.76 1,574.01 1,423.50 13.56 3,917.87
Fly Ash Kolkata GRT Other River 0 925 0 5.5 0.00 62.46 911.07 911.07 911.07 0.00 11.77 1,047.77
Iron Ore Semaria Haldia MMT 12 818 5 4.9 39.24 62.46 1,504.38 1,204.82 1,005.10 16.35 10.48 1,695.38
Lime Stone Kolkata GRT Allahabad 5 1,480 5 8.8 22.50 62.46 2,721.87 2,179.86 1,818.52 22.50 35.22 2,927.02
Sand Raj Mahal Kolkata GRT 8 443 10 2.7 41.40 62.46 814.72 652.49 544.33 51.75 10.67 1,043.46
Stone Chips Sahibganj Doriganj 5 382 25 2.3 25.88 62.46 702.54 562.64 469.38 129.38 9.32 992.03
Plastic Granules Ramnagar Kolkata GRT 337 1,249 5 8.1 1,845.08 54.49 2,289.33 1,838.96 1,538.71 27.38 17.41 4,288.16
Grain Patna Haldia MMT 21 920 0 3.2 126.00 54.49 1,686.29 1,354.55 1,133.40 0.00 20.52 1,941.78
Cement Ramnagar Patna 0 361 0 2.1 0.00 54.49 661.69 531.52 444.73 0.00 8.57 779.23
Fertilizer Haldia MMT Manihari 5 598 25 3.6 11.25 54.49 1,096.09 880.46 736.71 56.25 27.09 1,299.66
Steel Patna Kolkata GRT 21 815 0 2.9 126.00 141.97 1,263.07 1,015.35 850.20 0.00 11.57 1,684.58
Petroleum Semaria Haldia MMT 19 818 5 4.9 73.25 141.97 1,267.72 1,019.09 853.33 19.28 10.51 1,654.69
Logs & Wood Ramnagar Kolkata GRT 200 1,176 0 7.4 990.00 141.97 1,822.55 1,465.09 1,226.79 0.00 29.59 3,126.07
Textiles Kolkata GRT Ramnagar 0 1,176 152 7.3 0.00 141.97 1,822.55 1,465.09 1,226.79 1,140.00 316.08 3,562.56
Project Cargo Patna Kolkata GRT 21 815 0 2.9 126.00 141.97 1,263.07 1,015.35 850.20 0.00 309.86 1,982.87
Statues Ramnagar Kolkata GRT 31 1,176 0 7.1 227.85 141.97 1,822.55 1,465.09 1,226.79 0.00 305.19 2,639.52
Paper Other River Kolkata GRT 1,000 1,200 5 9.2 5,400.00 141.97 1,859.74 1,494.99 1,251.83 27.00 399.02 7,969.70
Food Kolkata GRT Ramnagar 0 1,176 121 7.3 0.00 96.00 4,127.87 3,386.97 2,893.04 1,270.50 46.49 5,636.86
Container Kolkata GRT Ramnagar 5 1,176 5 7.0 78.87 167.74 5,477.36 4,551.23 3,933.82 78.87 606.60 6,577.19
Vehicles Allahabad Kolkata GRT 730 1,480 5 10.3 51,103.65 36.99 10,678.50 8,720.40 7,415.00 350.03 1,104.90 63,311.07
Source: Consultants’ Market Survey, August-October 2015
IWT Sector Development Strategy and Business Development Study for Capacity Augmentation of National Waterway 1 from Haldia to Allahabad 169
As the selected commodities would be transported both upstream and downstream via the
NW-1, “first-mile” and “last-mile” distances would vary widely depending on the distance
between origin to entry point, and destination to exit point, of the NW-1. Multi-modal
transport would become most profitable with shorter distance of origin and destination from
the multi-modal terminal located on the NW-1. However, only for a few cases would both
origin and destination be identical with the multi-modal terminal itself, still usually one point
of the voyage is located at or close to the NW-1. Freight prices for “first-mile” and “last-mile”
transport would be higher than for long-distance voyages, in their Transport Model the
Consultants assumed a 50% marginal increase per ton-km.
Shipping distance on the NW-1 generally amounts to at last two third of the entire voyage
distance. Compared with travel time on land, multi-modal voyages of the selected
commodities take an average of about 5 days, with no individual voyage lasting less than 2
days. Vehicles shipped from Delhi to Kolkata would require about 10 days, with a consequent
value of time more than 3 times that of ‘mono-modal’ trucking. On average, value of time on
multi-modal voyages would be about 3 times higher than pure land-based transport and reach
more than 10% of the entire freight cost. Terminal-handling costs would need to be added to
the pure transport costs and would be doubled where either origin or destination of the
commodity is located away from the multi-modal terminal.
Shipping prices (on a per-ton basis) on the NW-1 would average about Rs 1,000 per voyage, as
the operator needs to calculate his costs for the entire round trip. The Consultants expect these
freight prices to decline over a certain period of years (in their Transport Model between the
years 2020 and 2035), as the market and logistical information network develops thus
providing the operator with opportunities of full-hold return voyages.
In a sum, aggregated (generalized) costs (on a per-ton basis) for a voyage remain below Rs
5,000, again with the significant exception of vehicles and some special commodities such as
general cargo as break-bulk or containerized.
6.5.2 Passenger services
The economic benefits of the river cruise shipping industry to the State are felt beyond the
tourism sector, with operational expenses accounting for the majority of the direct
expenditure, followed by corporate, passenger, and crew expenses. Operational expenses
include expenditure such as fees for navigation and berthing, supplies such as fuel, food and
beverage provision, and potable water, services such as wastewater and garbage removal, and
passenger related services such as security, baggage handling and passenger levies. Corporate
expenses comprise other expenditure by cruise operators, like corporate head office activity,
advertising, sales activities, commissions, and general administration costs, depending on the
office location.
Passenger expenses consist of expenditure by the passengers in their ports of call, including
shore excursions, meals, transportation, admission to attractions, shopping, and
accommodation. Crew expenses include expenditure of crew members in their ports of call,
including meals, transportation, telecommunications, shopping, accommodation, and other
recreational spending. That means that local commercial opportunities may evolve e.g. for
IWT Sector Development Strategy and Business Development Study for Capacity Augmentation of National Waterway 1 from Haldia to Allahabad 170
suitable hotel accommodation developments, for excursion guiding services, and high volume
transport providers.
In order to develop the river cruise tourism business on NW-1 and to maximize the economic
benefit of cruise shipping to India, the following goals need to be addressed:
• Provide sustainable infrastructure, efficient and safe operations, and ship services;
• Develop relationships with cruise lines in order to deliver goods and services that meet the
needs of the river cruise market;
• Marketing of NW-1 as desirable cruise destination and work with neighboring areas to
promote the whole region;
• Product development of onshore experiences (excursions);
• Simplify administrative, immigration, and customs procedures;
• Carry out regular passenger surveys to gather feedback in order to address potential
concerns.
Cruise lines’ deployment decisions are motivated by economic objectives; they will position
their assets where they can achieve the greatest profit. Factors such as the potential local or
regional source market, aviation access, port infrastructure and support services, tourism
infrastructure, climate and the overall appeal of a region are considered carefully when
deciding where to deploy vessels.
Shore excursions are a major revenue centre for every cruise line. Cruise lines rely heavily on
their locally based agents to provide solid advice on the experiences that best represent a
particular port/region, and that have the best potential to generate maximum profit. To make
shore excursions more attractive, cruise lines (through their local agents) will be more likely to
offer tours or experiences that
• can only be experienced in a particular area of call,
• have good marketing appeal,
• involve some level of interaction with local people, and
• leave enough time on the schedule to explore the area independently.
In summary, for developing the cruise tourism business a close contact between the different
market players is essential. Besides provision of the necessary infrastructure and services, the
region should develop a unique selling proposition that is communicated to the market.
6.5.3 Ferry services
Ferry services provide an alternative to land transport connections and are on the other hand
sometimes the only way to cross a river in the absence of bridges in the vicinity. Ferry
customers, who rely on ferry services to go to and from work or education, want fast, reliable
services. They rely on good interchange opportunities with other modes such as bus and train.
These customers generally travel in the morning and afternoon peaks. Tourist and leisure
customers want comfortable, reliable services in the off peak periods and on weekends to key
destinations.
Interviews with international ferry operators within the framework of a different project have
resulted in the following success factors for developing a ferry service business:
Travel time (and hence travel speed) and competitive fare
IWT Sector Development Strategy and Business Development Study for Capacity Augmentation of National Waterway 1 from Haldia to Allahabad 171
Frequency and reliability of services
Integration with other transport modes
Quality of infrastructure
Market development (i.e. associated land uses to attract support)
Convenience and accessibility of service
Passenger comfort and pleasantness of journey
No alternative mode available, e.g. because bridges are not existing
The continuous population growth and an increase in vehicle numbers have exceeded the
carrying capacity of the transport system along the NW-1 corridor. However, the location of
the river Ganges provides an opportunity for urban and rural passengers to use this waterway.
For example, in the transport system of Kolkata, where buses, automobiles, and metro rail
dominate the urban traffic, an integrated inland water transport system should be developed
with a suitable coordination with bus stops as well as sub-urban and metro railway stations. In
2011, ferry services accounted for only 1.7% of the total passenger movements, while buses
carried 55.7% of the passengers travelling in Kolkata on an average weekday.
The basic problems of the ferry services can be identified as follows:
• Navigational:
1. Siltation on lower part of Bengal delta creates problems for the movement of ferries
2. Shallow water during dry season results in difficulties for ferry movements
3. Some areas are prone to bank erosion leading to the siltation
4. Water pollution interfering with functioning of motors of vessels
• Infrastructural:
1. Non-availability of terminals, repair centers, river traffic management system
2. Inadequate navigational aids, insufficient ferry landing stages, unsatisfactory ticketing
system
3. Lack of integration between public and private sectors
• Connectivity:
1. Delays due to long transfer times between other modes and the ferry because of the
distance between main roads and ferry landing stages
2. Busy waterway hinders direct connection between different ferry landing stages when
priority has to be given to other transports
In order to develop the ferry business on NW-1, the following measures for extension and
strengthening should be addressed:
• Regular dredging of the river and provision of navigational aids;
• Ban of waste disposal into the river;
• Construction of permanent ferry jetties replacing the existing temporary landing stages;
• Introduction of new and frequent ferry crossing points with permanent jetties;
• Deployment of more motorized vessels and increasing the frequency of departures;
• Extension of ferry service times in the morning and in the evening;
IWT Sector Development Strategy and Business Development Study for Capacity Augmentation of National Waterway 1 from Haldia to Allahabad 172
• Linking the ferry connections with bus routes.
To reduce pressure on road and rail passenger transport services, appropriate planning,
coordination and management of the ferry business is necessary. Strategic investments in
water transport can positively impact overall costs and competitiveness of the other transport
modes and may lead to new job opportunities.
Considering the above-described advantages and bottlenecks, the Consultants identified the
following potential locations for ferry services crossing the Ganges River by:
1. Analyzing maps of market surveyors for cargo traffic crossing NW-1;
2. Urbanization patterns for larger settlements in proximity to NW-1; and
3. Transport infrastructure network for larger connecting roads close to NW-1.
These following potential sites still need to be checked by the engineering consultants Howe
(India) for their physical condition (ro-ro connections proposed by IWAI are emphasized in bold
letters).
6.5.3.1 Uttar Pradesh
1. Medhwa – Chochakpur
2. Madanpura – Pallia
3. Dullahpur – Ballia
4. Buxar – Doriganj – Ballia
6.5.3.2 Bihar
5. Maner – Doriganj
6. Fatuha – Patna – Digha Ghat – Sherpur
7. Barh – Baghrah
8. Semaria – Mokama
9. Sultanganj – Parbatta
10. Kahalgaon –Teen Danga – Munger
6.5.3.3 Jharkhand
11. Rajmahal –Sahibganj – Manihari
12. Rajmahal – Manikchak (container traffic Haldia – Biratnagar / Nepal)
6.5.3.4 West Bengal
13. Manigram – Lalgola
14. Hazarduari
15. Depara – Debagram
16. Sagar – Lot 8 – Haldia MMT – Kolkata GRT – Tribeni
IWT Sector Development Strategy and Business Development Study for Capacity Augmentation of National Waterway 1 from Haldia to Allahabad 173
Figure 47: Potential ro-ro ferry connections along NW-1
Source: PMU / IWAI; Consultants’ analysis based on market survey July-October 2015
Another important ferry link could be established at Sagar Island, to connect Kochuberia Ghat (see
below Figure 49) in the northeast of the island with LCD Ghat on Lot 8 in just 3 km distance across a
side branch of the Hooghly River.
Figure 48: Ferry at Kochuberia Ghat
Source: Google Earth
IWT Sector Development Strategy and Business Development Study for Capacity Augmentation of National Waterway 1 from Haldia to Allahabad 174
7 IWT Competitiveness
7.1 NW-1 potential and constraints
The following potential and constraints of IWT constitute major determinants of the worstcase
and best-case traffic projections as presented in Chapter 8 and 9.
7.1.1 General potential
During the Consultants’ market survey, general opportunities have been described as follows:
• Huge trade potential exists in the eastern and north eastern region as a result of increasing
investment from private companies as well as from the exposure to South Asian and
neighboring economies like Bangladesh and Myanmar.
• Domestic shipping provides significant fuel and cost savings over road and rail transport
and, thus, offers several opportunities to meet the demand for bulk shipping to nearby
areas and along the coast, which is highly relevant for India.
• Sufficient water depth would provide a tremendous boost on the NW-1 since already some
cargo is being shipped on this route. For instance, one company is getting many enquiries
for liquid and sand movement, and with availability of 3 meters water depth and stable
channels it could fulfil these requests.
• Opportunities will open up only when the service is available at Haldia MMT. For some
companies a MMT at Haldia would provide immense advantages for their commodities on
the NW-1, as origins and destinations of their cargoes lay exactly on the NW-1 route. A
Haldia MMT will definitely give a boost to IWT which was largely untapped and
underutilized despite its high growth potential. A ro-ro facility for heavy lift and ODC cargo
should be provided at the proposed Haldia MMT which will surely offer a lot of
opportunities to meet the requirement for shipping such commodities along the NW-1 and
NW-2. For instance, a company is interested in using the Indo–Bangladesh Protocol Route
for its commodity supply in larger volume from Kolkata to the NW-2 if this can be shipped
cost-effectively. Another company might supply commodities to northern destinations if
the IWT service was cost effective.
Following quotations give a valid impression of the prevailing sentiments of potential NW-1
users:
• We have a requirement of 10,000 tons per month of cement supply in 24 districts, which
we would like to transport on the NW-1 from Haldia MMT (source: ACC Ltd., Damodar
Cement Works).
• We have a requirement of 50,000 tons of aggregates per month to be supplied to
Chittagong/ Bangladesh, which we would like to ship by waterways from Pakur / Sahibganj
to Bangladesh (source: Chandak & Associates).
• We are not interested in owning barges but we can provide or build some infrastructure
on the bank of the NW-1 near Pakur and Sahibganj at our own cost if IWAI provides land.
IWT Sector Development Strategy and Business Development Study for Capacity Augmentation of National Waterway 1 from Haldia to Allahabad 175
• Our manufacturing plant is very near to the proposed Haldia MMT. We are very much
interested in using the NW-1 for our commodity, especially for transporting material from
U.P. to Haldia and also for in-bound supply if this can be done cost-effectively. Presently
we are not producing much of our commodity, but the scale will definitely grow in the near
future.
• Our manufacturing unit is 140 km from the proposed Haldia MMT. We are interested in
using the NW-1 for shipping our commodity from Kolkata to the Bihar region and also for
in-bound supply if cost effective. Presently production of our commodity is not much, but
we intend to play a bigger role in near future.
Ready to invest for both options as our expertise in port infrastructure and equipment
operations would give us an upper edge to participate in such PPP proposals(source: J M
Baxi & Co.).
Setting up of industrial corridors and logistics parks with enhance trade and related
services which will drive key elements of supply chain to promote IWT as gateway to
industries, coastal and other major ports(source: J M Baxi & Co.).
Require massive change of the pattern to develop the trade (source: Everett India Pvt Ltd).
Presently no incentive scheme is known however infusing capital investment would
definitely support the IWT mode of transport. However unless there is a clear roadmap for
providing stable channels this may not have the desired effect. We have been investing in
inland waterway Barges and Tugs for the past 40 years to meet our client requirements
(source: Eastern Navigation Pvt. Ltd).
We can invest in inland barges and RSV tankers (source: Vivada Corporation Pvt Ltd).
7.1.2 Cargo sector
7.1.2.1 Haldia-Farakka sector
Following table discusses potential and constraints of commodities which will most likely pass
through the Haldia MMT or Kolkata GRT.
IWT Sector Development Strategy and Business Development Study for Capacity Augmentation of National Waterway 1 from Haldia to Allahabad 176
Table 62: Potential and constraints of commodities transported on NW-1
Commodity Description of Potential Description of Constraints
Coal Commodity with potential presently transported through waterways from Sagar to Farakka and also large quantity of Coal transported from Pakur region for Kolaghat Power Station which may be handled at the MMT.
No availability of IWT service at NW-1
Cement Commodity is mainly for local supply but if demand is there for NW-1 and NW-2, Haldia MMT will be the right place for both NW-1 and NW-2 destination
Presently supplying only at Kolkata by roads. Nearest MMT is far away from the Plant
ODC Commodity with huge potential as per requirement by the upcoming Cement / Power Industries along the NW-1 and in NE region of India
Proper Ro-Ro facilities / service for handling ODC is not there along NW-1
Fertilizer Commodity with huge potential especially wheat from North India to SE-NE India and rice from West Bengal to North/NE India. Maize from Patna to Kolkata and further exported overseas
No availability of IWT service at NW-1
Crude vegetable oil
25,000 tons of crude edible oil monthly from Haldia to Varanasi Nepal-bounded cargo could be viably handled if containerized and handled at Patna Haldia to Northeast India: 300–400 tons daily for mill production/operations
No availability of IWT service at NW-1
Stone chips Commodity with potential and in demand at Kolkata and Bangladesh may be handled at Haldia MMT or Kolkata GRT
No availability of IWT service at NW-1
Automobiles Commodity with potential and in demand at Kolkata Large no. of units transported from North to Kolkata by road Commodity may be diverted from plant to Allahabad or Varanasi and thereafter by waterways to Kolkata
No availability of IWT service at NW-1
Containers Large no. of containers transported from Kolkata to Nepal (Biratnagar) by road Commodities may be transported by waterways from Kolkata to Patna and thereafter by road to Nepal
Availability of service at NW-1 although it may not be feasible as the Patna Terminal being on south bank of Ganges River, boxes need to be transported to north bank for Nepal
Note: This table shows a pure market response from market interactors based on real day-to-day experience, collected by the
Consultants’ interviewers
Source: Consultants’ Market Survey, August-October 2015
7.1.2.2 Farakka-Munger sector
The following potential and constraints of IWT are the determinants of the worst-case and
best-case scenarios in the traffic projection for Sahibganj MMT.
IWT Sector Development Strategy and Business Development Study for Capacity Augmentation of National Waterway 1 from Haldia to Allahabad 177
Table 63: Potential and constraints of commodities transported on NW-1
Commodity
Area -
Production/Cons umption
Loading Point/Station
Description of Potential
Destinations Nearest IWT Terminal for Unloading
Description of Constraints Distance of Source Point to Sahibganj
IWT (in Kms)
Current Mode
Potential (in tons per
day)
Stone Chips and aggregates
Sakrigali Sakrigali 3 Rail 2,586 North of Bihar-Average distance travelled is 350 Km
Patna MMT High scope for transfer onto IWT
Sahibganj Sahibganj 10 Rail 1,138
Mirzachowk Mirzachowk 32 Rail 1,197
Sakrigali Sakirgali 3
Road 25,600 North of Bihar-Average distance travelled is 350 Km
Sahibganj Sahibganj 10
Mirzachowk Mirzachowk 32
Sahibganj Sahibganj 10 By Naukas 12,627
Till Manihari and then to destinations on North of Bihar.
NA Significant share of the amount is unofficially mined and hence doesn’t represent the actual demand. Curtailment to be done while calculating the actual potential Sakrigali Sakrigali 3
Bakudi Bakudi 50 Rail 3,555 North of Bihar-Average distance travelled is 350 Km
Patna MMT Access distances are higher and hence the cost benefits might be much Barharwa Barharwa 57 Rail 2,792
Pakur Pakur 96 Rail 13,762
Coal
Lalmatiya Pirpainti 72 Rail 1,764 Several Thermal Power Station
Patna MMT
Access distance is higher and most of the thermal power plants have railway sidings which enable direct unloading at the thermal power station which is unlikely in case of waterways. Cost advantages need to be worked out. In case of imported coal at Haldia, cost advantages work in favor of IWT. Amrapara Pakur 112 Rail 20,044 Several Thermal Power Station
Andal Respective railway sidings and unloaded at Kahalgaon Thermal Power station railway siding.
Kahalgaon Thermal Power Station is 61
Kms away from Sahibganj MMT.
Rail
16,336
Origins include Andal in west Bengal, Lalmatiya in Jharkahand and imported coal dumped at Haldia
Sahibganj MMT
Kahalgaon Thermal Power Station has a railway siding and hence unloading happens within the power station. Kahalgaon is 60 km away from Sahibganj IWT and hence higher costs in transporting from MMT till Kahalgaon. Holds advantages at loading points as they are along the Ganges River e.g.: Haldia. Costs need to be worked out to ascertain the advantage of IWT over the existing mode of travel.
Lalmatiya Rail
Cement
Baghalpur Unloading at Bhagalpur Railway Station.
92 Rail 662
Origins include several cement production plants
Sahibganj MMT
Most of the cement plants have railway siding and hence the access distance to IWT becomes an additional cost over current mode of travel. Cost benefits need to be worked out
Sahibganj Unloading at Sahibganj Railway Station.
10 Rail 87
Rice
Baghalpur Unloading at Bhagalpur Railway Station.
92 Rail 563 Origins include the regions on North of India like Punjab, Haryana etc
Patna MMT Not a potential as the origins are way further North of India
Sahibganj Unloading at Sahibganj Railway Station.
10 Rail 130
Fertilizer Baghalpur Unloading at Bhagalpur Railway Station.
92 Rail 114 Baghalpur Sahibganj MMT
Could be a potential as origins include areas in West Bengal and Andhra Pradesh
Flyash Kahalgaon Thermal Power Station.
Kahalgaon Thermal Power Station.
61 Rail 1,733 Destinations include North east of India and Bangladesh
Sahibganj MMT
Could be a potential as most of the distance falls on waterways
Note: This table shows a pure market response from market interactors based on real day-to-day experience, collected by the Consultants’ interviewers
Source: Consultants’ Market Survey, August-October 2015
IWT Sector Development Strategy and Business Development Study for Capacity Augmentation of National Waterway 1 from Haldia to Allahabad 178
7.1.2.3 Muner-Ballia sector
This market-survey region between Munger to the east and Ballia to the west holds a great
potential in that the NW-1 follows a rather straight west-east course. When dredged to
sufficient depth and maintained in this condition, this section of the waterway is well located
to serve the multi-modal cargo traffic between the industrial region of Varanasi to Allahabad
(and beyond to Delhi) and the agricultural region of Bihar (and beyond into Northeast India).
Its future multi-modal terminals along the NW-1 will be well positioned to serve as lifeline
nodes for cargo traffic into Nepal, both from the seaports of Haldia and Kolkata as well as from
the industrial areas in western W.B., such as Durgapur.
7.1.2.4 Ballia-Allahabad sector
The following potential and constraints of IWT are the determinants of the worst-case and
best-case scenarios in the traffic projection for Ramnagar MMT.
Table 64: Potential and constraints of commodities transported on NW-1
Commodity Potential Constraints
All commodities
If overloading of trucks can be controlled, IWT will be more feasible;
If two-way cargo is available, then IWT will become feasible;
The provision of basic data (lock dimension, rates, fees, operating hours etc.) on the IWAI website is highly appreciated;
The cargo as well as the region where the vessel is supposed to go is influencing the vessel design.
Specification of vessels types which will be used on the NW-1 is required;
24-hour operation on the river is a must;
There are huge doubts about continuous provision of sufficient draft;
Buoys are needed for water transport;
Policy support from government for use of IW is needed, only cost advantage is not enough;
KoPT controls IW from Sagar to Nabadweep, not IWAI; jurisdictional issues cause problems;
River changes course rapidly;
For liquid bulk pipelines are available;
Vessels are needed on a regular basis, as per schedule, to build credibility of IWT;
Marketing and road show is important to create an image;
Promotion of water transport is needed to create an image;
Customs department inspection is required for imports, therefore a warehouse is needed;
Interaction with state governments and Customs is required;
Tide and current are issues;
Goods have to be delivered reliable / on time;
Farakka lock has to work reliably 24 hours every day;
A second lock seems necessary;
Sufficient draft is the most important criterion to generate a reliable IWT infrastructure;
Coal Upcoming power plant projects are generating construction cargo which could be transported by IWT;
Some plants are not 100% utilized due to insufficient supply of raw material; supply cannot be covered by rail as its capacity is at nearly 100%; additional racks/rail cars are available but no more track capacity; rail infrastructure is generating a bottleneck;
Full trip from Kolkata to Allahabad and back within 12 days is possible and would be a competitive product;
Coal can be taken in barges to Allahabad;
Vessel are under development having a capacity of 1,500 t and a draft of 1.6m as well as vessel with a capacity of 2.7 t and a draft of 2m;
Three barges are chartered for coal transport having a capacity of 2,000 t each;
A vessel with a capacity of 2,800 t and a draft of 3m has been designed (but not
IWT Sector Development Strategy and Business Development Study for Capacity Augmentation of National Waterway 1 from Haldia to Allahabad 179
built yet); with length about 80m which is probably quite long, especially for some turns in Farakka area.
Establishment of a river police will be necessary, if cargo/traffic will increase; currently there is no regulation;
How to handle pontoon bridges? The opening and closing of these bridge is not regulated and therefore not predictable; local authorities are responsible for opening and closing;
IWT with a depth below 3m is not viable on a regular basis; the operating costs for vessels with a 2.5m draft are higher (unit costs) as for 3m draft vessels.
Cement Upcoming cement plants are generating construction cargo which could be transported via IW.
ODC Upcoming power plant projects (and cement plants) are generating project cargo which could be transported via IW;
Forwarding companies focusing on ODC (heavy lift and projects) already exist;
Prism Logistics want navigable channel until Allahabad not only until Varanasi;
Eastern Navigation has an own shipyard to customize their vessels if needed; the company builds two vessels/facilities annually; currently a fleet of 65 vessels/facilities.
Fertilizer IFFCO is thinking about using the RSV 4 (which are allowed to go up to 12nm sea);
Floating pontoons seem to be the most flexible way of cargo handling facility: floating barges used as storage facilities for fertilizer, as the consumers can only handle “handy” volume, would also reduce storage costs.
A multi-modal terminal has to provide a covered warehouse; currently 10% of total fertilizer production gets lost annually due to weather effects (rain).
Crude vegetable oil
There is Nepal-bound cargo, if containerized and handled at Varanasi;
The transport of crude edible oil is very likely to be shifted to IWT, if opportunities are there;
Probably vessels can stop-over at Patna, discharge partly to proceed with lower draft to Varanasi; but currently there is no refinery at Patna;
Currently the supply of 6-7 oil refineries is all done by road;
8,000 – 10,000 tons daily of canned oil products;
1,500 tons by max. 3m draft should be targeted;
Pump and liquid storage facilities (3,000m³ - 4,000m³ per tank) have to be provided at the inland ports of discharge (e.g. Varanasi).
Especially palm oil has to be heated during transport.
Containers Pilferage on road and rail is a big issue;
At Patna liquid bulk and general cargo is needed;
Filling containers in Varanasi with sarees, carpets, cars (Maruti Suzuki) would reduce empty back-hauls of import containers.
Door to door service is needed by clients (Bothra tried for containers earlier, but it did not work).
Note: This table shows a pure market response from market interactors based on real day-to-day experience, collected by the Consultants’ interviewers
Source: Consultants’ Market Survey, August-October 2015
IWT Sector Development Strategy and Business Development Study for Capacity Augmentation of National Waterway 1 from Haldia to Allahabad 180
7.1.3 Passenger sector
High potential exists for cruises, both for religious and tourism purposes, in the Ballia-
Allahabad sector around the city of Varanasi. The Consultants had discussions with the Banaras
House Group; the following is a quote from the company’s chairman50:
• For the initial phase as requested earlier to IWAI, we chose the route Gajipur to Ramnagar
of approximately 100 km, which is presently - according to our knowledge - being covered
for passengers and cargo by traditional boats of various capacities;
• There are approximately 500 traditional boats which are plying over the route and catering
to both domestic and foreign visitors;
• We had already requested IWAI as well as your partners CNTechnologies, Mr. Anant
Verma, for collecting the necessary data and detailed information;
• IWAI is very hopeful that the Ganges River all along from Haldia to Allahabad could be
useful in the long run;
• We also believe that due to the influx of over one million visitors to Varanasi, being one of
the oldest living cities on earth and having great religious appeal, ever-growing traffic
would be eager to adopt modern transport facilities on the route in spite of various
constraints of water depth and environment;
• Looking at the above factors, our activities as envisaged include putting in operation
Hovercraft Services with a capacity of approximately 35-40 passengers to run point-to-
point depending on the traffic requirement, which only a qualified consultant like
CNTechnologies or the Consultants could provide;
• Our collaborators in Australia, manufacturers of Hovercraft, are eager to co-operate
provided the project is commercially viable without any restriction or hindrance;
• As already informed earlier, various issues are still pending for consideration with IWAI
and I am sure additional information could be available from their various offices in the
region;
• Unfortunately, we are not able to provide sufficient information as required due to non-
availability of this service as yet.
50 Mr. Binay Kumar, Chairman (cell 09891287666, mail [email protected]) Banaras House Group, New Delhi
IWT Sector Development Strategy and Business Development Study for Capacity Augmentation of National Waterway 1 from Haldia to Allahabad 181
8 Cost Competitiveness
8.1 Cost competitiveness comparison rail against IWT
Specifically applying to the three detailed observed sectors/terminal areas - Haldia MMT,
Kolkata GRT and Sahibganj MMT – and based on the findings of the market surveyors, the
Consultants established weighed rates per ton-km for cargo transports on land (road, railways)
in the following table. Due to the spare barge traffic on the NW-1 and consequent low
availability of freight rates, the Consultants proposed competitive freight rates for the various
cargo types on the NW-1.
Table 65: Comparison of freight tariff levels of road, rail and IWT along NW-1 (Rs/ton-km)
Note: Railway fare includes 5% additional development charge over the total freight rate, 15% busy season surcharge (not
applicable in July, August and September months), and 4.2% service tax
Source: Planning Commission; Manual on Economic Evaluation of Highway Projects in India, Indian Road Congress; IWT freight
tariffs according to market survey interviewees; calculations by Consultants
As proposed, the IWT-freight rates (in particularly, Rs 1.3/ton-km for dry bulk, Rs 1.1/ton-km
for bagged, Rs 1.4/ton-km for neo-bulk cargo) are below the established land freight rates at
such a level so that a shift of cargo onto the NW-1 becomes quite likely, while at the same
time providing sufficient income to the shipper. This kind of iterative process has to be
continued steadily in order to provide the ideal rate for both forwarders and ship owners.
Actually, transportation costs need to be worked out for the origin and destination pairs
presented for the commodities being carried to ascertain the amount of traffic that can
probably find a way to IWT as and when opened. Cost comparison between the three modes
available with respect to the origin and destination pairs need to be worked out to estimate
the probable amount of traffic that can be transferred on to the waterways.
The following tables show exemplary calculations for all three transport modes. The examples
focus on transport of the bulk commodities coal and cement. Bulk is transported from Kolkata
to Barh and cement is transported on the way back from Barh to Kolkata.
IWT
Road Railway Road Railway Road Railway NW-1
Dry bulk 1.95 2.14 2.00 2.26 3.62 2.41 1.30
Liquid bulk n.a. n.a. 4.00 n.a. n.a. n.a. 6.70
Bagged 2.39 n.a. 2.28 2.23 2.61 1.62 1.10
General n.a. n.a. n.a. n.a. 3.50 n.a. n.a.
Neo-bulk n.a. 2.50 3.11 2.17 n.a. n.a. 1.40
Ro-ro n.a. n.a. n.a. 2.47 n.a. n.a. 7.00
Container 7.95 n.a. 6.33 n.a. n.a. n.a. 4.50
Cargo TypeHaldia MMT Kolkata GRT Sahibganj MMT
IWT Sector Development Strategy and Business Development Study for Capacity Augmentation of National Waterway 1 from Haldia to Allahabad 182
Figure 49: Map of transport cases Kolkata-Barh
Source: Google Earth; Consultant’s illustration
For each transport mode two transport “vehicle” alternatives have been considered. The
freight rates for road and rail transport are the mean value of the Kolkata-rate and the
Sahibganj-rate.
Table 66: Costs and earnings per trip for road transport of coal/cement between Kolkata and Barh
Source: Planning Commission; Manual on Economic Evaluation of Highway Projects in India, Indian Road Congress; findings by
market surveyors; calculations by Consultants
The load capacity of one truck has been assumed as 16 tons as well as 24 tons. Thus, up 24
tons can be transported per one trip assuming a truck utilization of 100%. A fully loaded truck
is quite likely. The distance by road from Kolkata to Barh is about 580 km. The road toll has
already been included in the costs per ton-km. The cost per one trip (one way to Barh) has
been calculated by transport volume x distance km x Rs per ton-km. The existence of rail fees
has not been identified during the elaboration of this report. The average speed of a truck has
been assumed being 30 km/h which leads to transit time for a round trip of 39 hours net
(without breaks and waiting time). The table shows that the operations with only 16 tons of
load capacity do not lead to an economic result but generating a loss about Rs 4,000.
Road Dry Bulk / Coal Dry Bulk / Cement Whole Trip
Truck utilization Costs Truck utilization Costs
100% 580 km Road toll total 2.8 Rs. per ntkm 100% 580 km Road toll total 2.8 Rs. per ntkm 30 km/h
Transport volume
[t]
Cost / Rs.
per ntkm
Cost / Rs.
per trip
Rs. per
passageRs. per trip
Transport volume
[t]
Cost / Rs.
per ntkm
Cost / Rs.
per trip
Rs. per
passageRs. per tour Rs. per tour Rs. per tour Rs. per tour
average
travel time
[h] in days
16 t Truck 16 3.03 28,094 incl. 28,094 16 3.03 28,094 incl. 28,094 56,188 52,154 -4,034 39 1.6
24 t Truck * 24 2.02 28,094 incl. 28,094 24 2.02 28,094 incl. 28,094 56,188 78,230 22,043 39 1.6
* overloaded by 50%
26,077 26,077
39,115 39,115
Section: Kolkata to Barh Earnings Section: Barh to Koalkata EarningsCosts Earnings Margin
Average speed
Rs. per trip Rs. per tour
IWT Sector Development Strategy and Business Development Study for Capacity Augmentation of National Waterway 1 from Haldia to Allahabad 183
Table 67: Costs and earnings per trip for rail transport of coal/cement between Kolkata and Barh
Source: IR “Adjustments in Base Freight Rate effective form 01.04.2015”; findings market surveyors; calculations by Consultants
According to the statistical yearbook of IR, the average load per train has been around 1,823
tons in the fiscal year 2012/13. In order to get two possibilities, train capacity slightly above
and slightly below the average have been chosen. Due to sometimes unplanned changes in
provision of rolling stock, mainly wagons/rail cars, the train utilization has been assumed being
90%. The distance by rail between Kolkata and Barh is about 510 km. The costs per km have
been taken for electrified, double line ghat-landscape. The average speed of a train according
to the statistical yearbook 2011/13 of IR is around 25 km/h. This has been taken for further
calculation leading to a net travel time for a whole round trip of about 41 hours (without
breaks, waiting time etc.). Rail net travel time is almost comparable to truck net travel time.
The calculation shows the economies of scales as the train with the larger load capacity
generates a higher margin.
Table 68: Costs and earnings per trip for IWT transport of coal/cement between Kolkata and Barh
Source: Azzura Marine Liners Pvt Ltd; findings market surveyors; Eastern Navigation Pvt Ltd.; calculations by Consultants
Another rail connection is the transport of fertilizer from Kakinda Sea Port to Bhagalpur Rail
Station. This is an OD pair elaborated by the market surveyors. The distance between Kakinda
Sea Port and Bhagalpur is almost 5,000 km. It provides the same gauge over the complete
distance.
Table 69: Costs and earnings per trip for IWT transport of fertilizer between Kakinada and Bhagalpur
Source: IR “Adjustments in Base Freight Rate effective form 01.04.2015”; findings market surveyors; calculations by Consultants
The following figure shows the connection between Kakinda and Bhagalpur.
Rail Dry Bulk / Coal Dry Bulk / Cement Whole Trip
Train utilization Costs Train utilization Costs
90% 510 km Rail fee total 2.3 Rs. per ntkm 90% 510 km Rail fee total 2.3 Rs. per ntkm 25 km/h
Transport volume
[t]*
Cost / Rs.
per ntkm
Cost / Rs.
per trip
Rs. per
passageRs. per trip
Transport volume
[t]
Cost / Rs.
per ntkm
Cost / Rs.
per trip
Rs. per
passageRs. per tour Rs. per tour Rs. per tour Rs. per tour
travel time
[h] in days
1,800 t Train 1,620 0.94 780,520 n.a. 780,520 1,620 0.94 780,520 n.a. 780,520 1,561,040 3,858,354 2,297,314 41 1.7
2,200 t Train 1,980 0.94 953,969 n.a. 953,969 1,980 0.94 953,969 n.a. 953,969 1,907,938 4,715,766 2,807,828 41 1.7
* average load per IR train 1,823 t (2012/13)
Section: Kolkata to Barh Earnings Section: Barh to KoalkataCosts Earnings Margin
Average speed
Rs. per trip Rs. per tour
Earnings
1,929,177 1,929,177
2,357,883 2,357,883
IWT Dry Bulk / Coal Dry Bulk / Cement Whole Trip
Upstream Downstream
Vessel utilization Costs Vessel utilization Section: Farakka - Kolkata Costs
75% 400 km Farakka Lock 330 km total 1.3 Rs. per ntkm 75% 330 km Farakka Lock 400 km total 1.3 Rs. per ntkm 12 km/h
Transport volume
[t]
Cost / Rs.
per ntkm
Cost / Rs.
per tour
Rs. per
passage
Cost / Rs. per
ntkm
Cost / Rs. per
tourRs. per tour
Transport volume
[t]
Cost / Rs.
per ntkm
Cost / Rs.
per tour
Rs. per
passage
cost / Rs. per
ntkm
cost / Rs. per
tourRs. per tour Rs. per tour Rs. per tour Rs. per tour
travel time
[h] in days
2,000 t Barge 1,500 0.77 464,099 incl. 0.77 382,882 846,981 1,500 0.59 294,122 incl. 0.59 356,512 650,635 1,497,615 2,847,000 1,349,385 122 5.1
3,000 t Barge 2,250 0.66 591,715 incl. 0.66 488,165 1,079,880 2,250 0.52 389,543 incl. 0.52 472,174 861,717 1,941,597 4,270,500 2,328,903 122 5.1
Rs. per tour
1,423,500
2,135,250
Section: Kolkata to Farakka Section: Farakka to Barh Average speedCosts Earnings Margin
Earnings
Rs. per tour
1,423,500
2,135,250
Section: Barh to Farakka Earnings
Rail II Fertilizer
Volume in 2014 Costs Total Margin
4,988 1,417 km Rail fee total 2.3 Rs. per ntkm in Rs.
Transport volume
[t]*
Cost / Rs.
per ntkm
Cost / Rs.
per trip
Rs. per
passage
2,200 t train 1,823 0.94 2,440,368 n.a. 6,588,994 9,914,776
* average load per IR train 1,823 t (2012/13)
2.7 trips
Section: Kakinda Port - Bahgalpur no further section needed Earnings
16,503,771
IWT Sector Development Strategy and Business Development Study for Capacity Augmentation of National Waterway 1 from Haldia to Allahabad 184
Figure 50: Rail connection Kakinda to Bhagalpur
Source: Google Maps under http://rbs.indianrail.gov.in/ShortPath/Map.jsp; consultant´s illustration
Table 70: Costs and earnings per trip for IWT transport of coal/cement between Kolkata and Barh
Source: Azzura Marine Liners Pvt Ltd; findings market surveyors; Eastern Navigation Pvt Ltd.; calculations by Consultants
Although in the previous sections three types of barges have been described in this example
only the 2,000-tons and the 3,000-tons barges are mentioned. As natural draft restrictions are
expected during regular operations the utilization rate per barge has been assumed being 75%.
The distance between Kolkata and Barh has been divided into two sections which are Kolkata-
Farakka (with its lock) and Farakka- Barh vice-versa respectively. The charges for the usage of
the lock are already included in the cost per ton-kmntkm. The distance via waterway from
Kolkata to Barh is about 730 km. As described in the previous chapters the costs per ton-km
differ depending on the direction which could be upstream or downstream. The net travel time
IWT Dry Bulk / Coal Dry Bulk / Cement Whole Trip
Upstream Downstream
Vessel utilization Costs Vessel utilization Section: Farakka - Kolkata Costs
75% 400 km Farakka Lock 330 km total 1.3 Rs. per ntkm 75% 330 km Farakka Lock 400 km total 1.3 Rs. per ntkm 12 km/h
Transport volume
[t]
Cost / Rs.
per ntkm
Cost / Rs.
per tour
Rs. per
passage
Cost / Rs. per
ntkm
Cost / Rs. per
tourRs. per tour
Transport volume
[t]
Cost / Rs.
per ntkm
Cost / Rs.
per tour
Rs. per
passage
cost / Rs. per
ntkm
cost / Rs. per
tourRs. per tour Rs. per tour Rs. per tour Rs. per tour
travel time
[h] in days
2,000 t Barge 1,500 0.77 464,099 incl. 0.77 382,882 846,981 1,500 0.59 294,122 incl. 0.59 356,512 650,635 1,497,615 2,847,000 1,349,385 122 5.1
3,000 t Barge 2,250 0.66 591,715 incl. 0.66 488,165 1,079,880 2,250 0.52 389,543 incl. 0.52 472,174 861,717 1,941,597 4,270,500 2,328,903 122 5.1
Rs. per tour
1,423,500
2,135,250
Section: Kolkata to Farakka Section: Farakka to Barh Average speedCosts Earnings Margin
Earnings
Rs. per tour
1,423,500
2,135,250
Section: Barh to Farakka Earnings
Bhagalpur Rail Station
Kakinda Sea Port
IWT Sector Development Strategy and Business Development Study for Capacity Augmentation of National Waterway 1 from Haldia to Allahabad 185
needed for a whole round trip from Kolkata to Barh and back has been calculated being 122
hours which is obviously longer than by road or rail.
Table 71: Comparison of transport modes concerning transport of 3,000 tons of cargo
between Kolkata and Barh
Source IR “Adjustments in Base Freight Rate effective form 01.04.2015”; Planning Commission; Manual on Economic Evaluation
of Highway Projects in India, Indian Road Congress; Azzura Marine Liners Pvt Ltd; Eastern Navigation Pvt Ltd.;findings
market surveyors; calculations by Consultants
The table above shows a case of 1,500 tons of coal to be transported from Kolkata to Barh and
1,500 tons of cement from Barh to Kolkata. Due to uncertain draft condition on the Farakka-
Barh section, a 2,000-tons barge has been chosen for this comparison. As an overloaded truck
is the only economic way to execute road transport a 24-tons truck has been chosen. For rail
operations a 2,200-tons train with 90% utilization has been selected. Due to the different load
capacities per trip different numbers of trips are necessary to transport the whole volume of
coal and cement. For IWT one barge trip seems to be sufficient but for road transport 62.5
truck trips per direction would be necessary to transport the total amount. The train is not fully
utilized per each direction. Thus, one trip is sufficient. Based on the costs and earning per ton-
km mentioned in the road, rail and IWT table above the total costs for the complete transport
as well as the related earnings have been calculated. The mentioned earnings are equal to the
amount the customer has to pay for transport services. As freight rates for IWT has been
defined on purpose lower than the road and rail rates the actual margin for IWT is also the
lowest. Earnings generated by road operations are the highest of the three transport modes.
But the costs are also the highest. Finally the remainder profit for road transport equals almost
the profit of IWT. But the total costs for an IWT are less than half of the costs generated by
road transport. Due to the quite costly upstream operations of IWT the total transport costs
are higher than for rail transport. In the end from the customer’s point of view the IWT
provides the lowest rate. From the operator’s point of view rail generates the highest profit.
8.2 Unit cost of transportation for IWT as against rail and road
In general, comparing the three transport modes, transport by truck is most expensive,
transport by train is less expensive (in Germany approximately 4.1% of the unit cost compared
to those by truck regarding fuel consumption) and, finally, IWT is even more economical
(approximately 1.9% of the unit cost compared to those by truck regarding fuel consumption).
But this general comparison of unit costs constitutes a rather theoretical exercise as transport
unit costs mainly depend on the location as well as availability of traffic infrastructure of the
origin and the destination.
As a result of comparison, it is obvious that railway transport and IWT are both more
economical than road transport. But when it comes to making decision between rail transport
and IWT, it is necessary to consider other measures as well. The location of the origin and its
All modes Section: Kolkata - Barh Section: Barh - Kolkata Kolkata - Barh - Kolkata
1,500 t of coal 1,500 t of cement 3,000 t of cargoCapacity of
vehicle/unit [t]
Number of
tripsCost / Rs.
per trip Total cost
Total
earnings Profit
Number of
trips Total cost Earnings Profit Total cost Earnings Profit
IWT 1,500 1.0 846,981 846,981 1,423,500 576,519 1.0 650,635 1,423,500 772,865 1,497,615 2,847,000 1,349,385
Road 24 62.5 28,094 1,755,859 2,444,700 688,841 62.5 1,755,859 2,444,700 688,841 3,511,719 4,889,400 1,377,681
Rail 1,980 0.8 953,969 722,704 1,786,275 1,063,571 0.8 722,704 1,786,275 1,063,571 1,445,407 3,572,550 2,127,143
28,094
953,969
Cost / Rs. per trip
650,635
IWT Sector Development Strategy and Business Development Study for Capacity Augmentation of National Waterway 1 from Haldia to Allahabad 186
traffic infrastructure are important for the cost-efficiency and success of the IWT. Once an
industry moves closer to, or ideally onto the banks of, the NW-1, IWT becomes more attractive.
Similar to road and railway transport, unit cost per ton-km decreases in inland shipping on
longer transport distances. The unit costs of inland shipping also depend on the usage of the
potential vessel draft (construction draft). It has been assumed that a vessel with a higher load
capacity also request a lager draft. The trucking costs are quite high in comparison to the
elaborated road transport rates. If the calculations concern the regular depreciation as well as
the official maximum loading capacity economic truck operations do not seem possible for
certain commodities like dry bulk or bagged cargo. This indicates that road transport in India
is very likely to be performed with old and completely depreciated trucks in combination with
heavy overweighed cargo loads.
8.2.1 Case I and II: 16-tons and 24-tons capacity trucks
Due to this finding, two truck cost calculations are mentioned in the following table. One
calculation is based on the adherence of the maximum allowed loading capacity of 16 tons per
truck and the second one concern an overloading rate of 50% ending up with a utilized loading
capacity of 24 tons.
Table 72: Unit cost comparison of transport modes (Rs per ton-km)
Source: Azzura Marine Liners Pvt Ltd, Kolkata, October 2015; Eastern Navigation Pvt Ltd.;Manual on Economic Evaluation of
Highway Projects in India, Indian Road Congress, IRC:SP:30-2009
For the 1,000 tons barge a diesel engine of 2x 345 BHP has been assumed as a suitable
motorization. This engine stands for fuel consumption per hour of about 70 liters. The
calculation of the 2,000 tons barge is based on the assumption to consider a 2x 400 BHP diesel
engine. This kind of engine consumes around 90 liters of diesel per hour. The 3,000 tons barge
is equipped with a 2x 500 BHP aggregate and consumes 100 liters of diesel per working hour.
As the unit cost for a total round-trip also depends on the freight volume on the return trip,
the spread has been calculated for two cases: empty return voyage / full capacity use also on
the return trip. The figure below shows results for a big motor vessel (110 x 11.45 m). The costs
per ton-km do decrease by around 53% if the effective draft of a vessel could be increased
from 2.0m to 3.4m. The interesting range of drafts of the NW1 is between 2.5m and 3.0m. In
this range the reduction of unit costs by around 13% are very likely.
Rail Cost
Upstream Downstream Upstream Downstream Upstream Downstream
Fuel & Oil 0.23 1.87 1.25 0.51 0.25 0.30 0.15 0.22 0.11
Labor & Staff 0.15 0.15 0.10 0.03 0.01 0.02 0.01 0.01 0.01
Terminal 0.04 - - 0.31 0.31 0.31 0.31 0.31 0.31
Repair & Maintenance 0.04 0.09 0.06 0.04 0.04 0.02 0.02 0.01 0.01
Overhead 0.05 0.32 0.21 0.06 0.03 0.03 0.02 0.02 0.01
Capital 0.43 0.27 0.18 0.10 0.10 0.05 0.05 0.03 0.03
Tolls / User Charges n.a. 0.34 0.23 0.05 0.05 0.05 0.05 0.05 0.05
Total Costs per ntkm 0.94 3.03 2.02 1.08 0.79 0.77 0.59 0.66 0.52
16-tons capacity 24-tons capacity
(overloaded)
Electrified;
double line; ghat
terrain
Cost Component
Various Barge Sizes on Upstream versus Downstream Voyage
1000 tons 2000 tons 3000 tons
Truck Costs
IWT Sector Development Strategy and Business Development Study for Capacity Augmentation of National Waterway 1 from Haldia to Allahabad 187
Figure 51: Average degression of IWT unit costs per ton-km according to effective
draft (Europe)
Source: PLANCO Consulting GmbH Economical and Ecological Comparison of Transport Modes: Road, Railways, Inland
Waterways, Essen/Germany, November 2007, p. 32
The level of transport costs on inland waterways depends heavily on the size of vessels its draft
respectively and on the volume of cargo carried. Both parameters are influenced by the
physical characteristics of the used waterway. Comparative cost calculations per ton-km
reflect the cost degression according to typical vessels and effective vessel draft.
For all three transport modes, the cost of allocating the required vehicle for a given transport
task and the cost of loading and unloading are largely independent of the transport distance.
Hence, the cost per ton-km decreases with the distance. For a given transport distance, the
unit cost depends on the loading capacity and on the capacity utilization of vehicles employed.
Different commodities have different loadability, resulting in commodity-specific
transportation costs. The cost per ton-km of loaded vehicles will be lower for higher freight
volumes and the cost per ton-km for a roundtrip will be lower with a lower share of empty
voyages. Thus, transport modes which are able to transport high cargo volumes (in tons) are
actually more suitable to transport high volume heavy goods. Due to this bulk cargo like for
example coal, fertilizer, and cement are commodities being predestinated to be transported
by IWT or rail on the long-distance travel. Additional transport cost for the “last mile” do occur.
Operating costs are further divided into time-related and running costs. Time-related costs
include expenditure such as capital, crew salary, insurance, taxes (goods, roads), overheads,
etc. which are to be incurred by the operator irrespective of the vehicle movement. Similarly,
the costs borne by the operator relating to vehicle movement are considered as running costs,
i.e. fuel, mobile oil, repairs and maintenance (all types), tyre & tubes, toll charges, trip
allowances or ‘Bhatta’ to the crew and other wayside expenses.
IWT Sector Development Strategy and Business Development Study for Capacity Augmentation of National Waterway 1 from Haldia to Allahabad 188
According to comparative calculations for selected routes (O/D pairs) in Germany, inland
shipping has the lowest specific energy consumption of the three considered modes. On seven
of eight selected bulk freight routes, and on all chosen container routes, inland ship transport
has lower energy consumption than railway transport. The highest energy consumption occurs
generally with truck transport.
In order to show the range of costs concerning commodities as well as transport modes the
following two tables are presented. The tables also show a probable margin per transport
mode. The main difference between both tables is the assumption of utilized load capacity for
road transport. As described above the regular assumption for road transport lead to losses in
bulk and bagged cargo transport. Thus, the upper table considers a maximum load capacity of
16 tons per truck and the lower considers a maximum load capacity of 24 tons. 51
Table 73: Comparison freight tariffs and costs on Haldia-Farakka sector (Case I: 16 tons per truck)
Source: Based on Planning Commission “Total Transport System Study”; IWT freight tariffs according to market survey
interviewees; Consultant’s depiction
Table 74: Comparison freight tariffs and costs on Haldia-Farakka sector (Case II: 24 tons per truck)
Source: Based on Planning Commission “Total Transport System Study”; Market Survey Findings; Consultant’s depiction
These examples are based on IWT data related to the Haldia-Farakka section and by this do
not include any usage fees for the lock. The second table also shows that even with a higher
load capacity the truck operations for dry bulk within the Haldia-Farakka section could not be
executed economically.
8.2.2 Case III: Rajmahal Coal Mines
In general, comparing the three transport modes, transport by truck is most expensive,
transport by train is less expensive (approximately 4.1% of the unit cost compared to those
by truck regarding fuel consumption) and, finally, IWT is even more economical
(approximately 1.9% of the unit cost compared to those by truck regarding fuel
consumption). But this general comparison of unit costs constitutes a rather theoretical
51 For cost details per element and transport mode consider Table 21 for railway, Table 24 for road and Table 25 for IWT
Rs. per ntkm
Difference Difference Tariffs*
Haldia MMT Kolkata GRT Total Sector Tariffs- Costs Haldia MMT Kolkata GRT Total Sector Tariffs- Costs NW-1 Upstream Downstream Upstream Downstream
Dry bulk 2.14 1.99 2.07 0.94 1.12 1.95 2.00 1.98 3.03 -1.05 1.0 0.66 0.52 0.32 0.45
Liquid bulk n/a n/a n/a n/a n/a n/a 4.00 4.00 3.03 0.97 4.0 0.66 0.52 3.34 3.48
Bagged n/a 3.31 3.31 0.94 2.37 2.39 2.28 2.34 3.03 -0.69 1.1 0.66 0.52 0.44 0.58
General n/a n/a n/a n/a n/a n/a n/a n/a n/a n/a n/a n/a n/a n/a n/a
Neo-bulk 2.50 3.72 3.11 0.94 2.17 n/a 3.11 3.11 3.03 0.08 1.4 0.66 0.52 0.74 0.88
Ro-ro n/a 32.40 32.40 0.94 31.46 n/a n/a n/a n/a n/a 7.0 0.66 0.52 6.34 6.48
Container n/a n/a n/a n/a n/a 7.95 6.33 7.14 3.03 4.11 4.5 0.66 0.52 3.84 3.98
* proposed
Tariffs TariffsCosts Costs
Costs Difference: Tariffs - Costs
Railway Road (16 t cargo per truck) IWT (3,000 dwt vessel)
Rs. per ntkm
Difference Difference Tariffs*
Haldia MMT Kolkata GRT Total Sector Tariffs- Costs Haldia MMT Kolkata GRT Total Sector Tariffs- Costs NW-1 Upstream Downstream Upstream Downstream
Dry bulk 2.14 1.99 2.07 0.94 1.12 1.95 2.00 1.98 2.02 -0.04 1.0 0.66 0.52 0.32 0.45
Liquid bulk n/a n/a n/a n/a n/a n/a 4.00 4.00 2.02 1.98 4.0 0.66 0.52 3.34 3.48
Bagged n/a 3.31 3.31 0.94 2.37 2.39 2.28 2.34 2.02 0.32 1.1 0.66 0.52 0.44 0.58
General n/a n/a n/a n/a n/a n/a n/a n/a n/a n/a n/a n/a n/a n/a n/a
Neo-bulk 2.50 3.72 3.11 0.94 2.17 n/a 3.11 3.11 2.02 1.09 1.4 0.66 0.52 0.74 0.88
Ro-ro n/a 32.40 32.40 0.94 31.46 n/a n/a n/a n/a n/a 7.0 0.66 0.52 6.34 6.48
Container n/a n/a n/a n/a n/a 7.95 6.33 7.14 2.02 5.12 4.5 0.66 0.52 3.84 3.98
TariffsCosts
TariffsCosts
Costs Difference: Tariffs - Costs
Railway Road (24 t cargo per truck) IWT (3,000 dwt vessel)
IWT Sector Development Strategy and Business Development Study for Capacity Augmentation of National Waterway 1 from Haldia to Allahabad 189
exercise; practically, transport unit costs depend on the location and traffic infrastructure of
the origin and the destination.
As an example, one may have a closer look at the Rajmahal Coal Mines located in Lalmatia /
Jharkhand. The distance between these coal mines and Varanasi via road is approximately 583
km (via NH 133 and NH 2). A direct access for coal to be transported by rail is provided in
Lalmatia (via Farakka) with a total distance of approximately 764 km to Varanasi. The Ganges
River (access through Sahibganj / Jharkhand) is approximately 57 km away from the coal mines
via road (via NH 133 and NH 80) and approximately 190 km away via rail. The distance between
Sahibganj and Varanasi via NW 1 is 747 km.
Figure 52: Location of Rajmahal Coal Mines
Source: www.map.de; changes made by HPC Hamburg Port Consulting GmbH, UNICONSULT Universal Transport Consulting
GmbH, 2015
When assessing the overall unit costs for transporting coal from the Rajmahal Coal Mines in
Lalmatia to Varanasi, the relative unit-cost difference transported by train compared to truck
transport is differing from theory. Although the train ride from Rajmahal to Varanasi has to be
routed via Farakka it results in40.9% of the truck transport costs which are set as 100%..
Whereas for IWT coal must be transported to the river first before it can be transported to
Varanasi by vessel due to the location of the coal mines and by this an additional handling is
generated. Either this first transport link to Sahibganj would have to be covered by truck or by
train. The transport chain of truck and IWT results in 42.5% of the compared costs for
transporting the whole cargo volume by trucks from Rajmahal to Varanasi. The case of
combining rail and IWT ends up at 42.9% of costs in comparison to 100% truck transport. The
utilization of two transport modes makes an additional handling of cargo necessary. In this
particular situation, additional costs are implied by the handover from train/truck to a vessel.
IWT Sector Development Strategy and Business Development Study for Capacity Augmentation of National Waterway 1 from Haldia to Allahabad 190
Table 75: Comparison of transport cost of different supply chain between Rajmahal and Varanasi
Source: Consultants
As a result of comparison for this example, it is obvious that railway transport and IWT
(regarding both alternatives for the first stretch) are both more economical than road
transport. But when it comes to making decision between rail transport and IWT, it is necessary
to consider other measures as well.
The example shows that the location of the origin and its traffic infrastructure is important for
the cost-efficiency and success of the IWT. Once an industry moves closer to, or ideally onto
the banks of, the NW 1, IWT becomes more attractive.
8.2.3 External costs
External costs are defined as non-compensated impacts by transport agents on not involved
third parties. ‘External’ means: the negatively affected third party receives no (no full)
compensation. In the transport sector external effects occur in following fields:
• Transport safety/Accidents: Of all economic costs caused in Germany by freight transport
accidents in the period 2000 to 2005, 96.9% are due to trucks, 2.0% to railways and 1.1%
to inland shipping.
• Noise: The difference of noise emissions per unit of freight, between road and rail,
measured along road resp. railway lines is only small. Inland shipping causes only lower
emissions, with a difference representing 50% lower immission loads as perceived by
people.
• Climate gases: In Germany, calculations were prepared for selected O/D pairs. Clearly, the
highest specific CO2 emissions are caused by road trucks. This remains valid if the
additional collection and distribution transport by trucks is considered for containers
carried by railways or ships on their main route section. For five of eight analyzed bulk
freight transport cases, inland shipping causes lower CO2 emissions than railways.
• Air pollution: Electricity-powered railway transport causes clearly lower pollutive
emissions (nitrogen oxide, sulfur dioxide, non-methane carbon hydrides, carbon monoxide
and particles) than road and inland ship transport. Accordingly, on all selected transport
routes the external costs of air pollution caused by railway transport are significantly lower
Road / IWT
From To
Rajmahal Coal Mine Sahibganj 57 km 2,250 t 3.03 Rs 388,257 Rs
Sahibganj Varanasi 747 km 2,250 t 0.77 Rs 1,300,057 Rs
Total cost 1,688,314 Rs 750.4 Rs / 1 t coal 42.5%
Rail / IWT
From To
Rajmahal Coal Mine Sahibganj 190 km 2,250 t 0.94 Rs 403,864 Rs
Sahibganj Varanasi 747 km 2,250 t 0.77 Rs 1,300,057 Rs
Total cost 1,703,921 Rs 757.3 Rs / 1 t coal 42.9%
Road
From To
Rajmahal Coal Mine Varanasi 583 km 2,250 t 3.03 Rs 3,971,118 Rs
Total cost 3,971,118 RS 1,764.9 Rs / 1 t coal 100.0%
Rail
From To
Rajmahal Coal Mine Varanasi 764 km 2,250 t 0.94 Rs 1,623,958 Rs
Total cost 1,623,958 RS 721.8 Rs / 1 t coal 40.9%
Percentage of pure
road transport
Distance Cargo Cost
volume per ntkm per section per unitBy rail
Distance Cargo Cost
volume per ntkm per section per unitBy road
Distance Cargo Cost
By rail By IWT volume per ntkm per section per unit
Distance Cargo Cost
By road By IWT volume per ntkm per section per unit
IWT Sector Development Strategy and Business Development Study for Capacity Augmentation of National Waterway 1 from Haldia to Allahabad 191
than those of competing modes. However, exhaust emissions of electricity-powered
railways depends on the structure of primary energy used for electricity generation. When
comparing inland shipping with road transport, there is a clear advantage for ship
transport.
• Landscape dissection and area consumption: While roads and railways serve exclusively
transport purposes, almost fully sealing soils, waterways remain habitats for aquatic fauna
– though sometimes minor sealing of waterway beds and shoulders is required. These
habitats can have a highly positive ecological value. Waterways also serve other purposes
than transport (e.g. water sports, energy generation, fishery). These qualitative aspects
show a clear advantage of waterways against other modes.
The following figure is supposed to show the likely scale of external costs. Although published
in 2007 and based on German condition, the figure gives an impression of the proportionality
of the distribution of the external costs generated by cargo transport.
Figure 53: Average external costs by transport mode (in € per 1,000 tkm)
Source: based on Infras 2007; Consultant’s illustration; http://www.ioew.de/uploads/tx ukioewdb/IOEW SR 194 Stand und
Potenziale der Elbe-Binnenschifffahrt.pdf
Table 76: Average external costs by mode (in € per 1,000 tkm)
Source: Consultants
On Germany’s bulk freight routes, the external costs of inland shipping are even lower reaching
an average of 70% of those for railway transport, and a staggering 17% of those for road
transport.
€ per 1,000 tkm Rail IWT
accidents 4.3 0.1 0.0
noise 7.9 3.3 0.0
air pollution 6.8 1.9 3.7
climate costs 6.2 0.4 2.2
nature and landcape 1.6 0.1 0.6
pre- and post processes 2.7 3.0 0.5
additional costs in urban areas 0.3 0.7 0.0
Total 29.8 9.5 7.0
Road
IWT Sector Development Strategy and Business Development Study for Capacity Augmentation of National Waterway 1 from Haldia to Allahabad 192
9 Traffic Forecast – General
9.1 Background indicators
Provided that the IWT infrastructure develops sufficiently, the cargo potential on the existing
five national waterways is projected to increase to about 47 MMT by 2019-20 and to 92 MMT
by 2031-32. The composition of projected cargo is expected to be similar to the current
structure comprising of coal, construction material, agriculture & forest products, and others,
with coal forming the bulk of the volume.
Coal is the most important and abundant fossil fuel in India. Coal and lignite together account
for about 53.65% of the country’s energy need. Considering the limited reserve potentiality of
petroleum and natural gas, eco-conservation restriction on hydro-electric project and geo-
political perception of nuclear power, coal will continue to occupy centre-stage of India’s
energy scenario. Natural gas is fast emerging as an alternative source of energy. However, in
the foreseeable future coal-based thermal power plants will remain the mainstay of electricity
generation in the Project region. The nationwide reserve capacity for coal production
increased from tons 264 billion in 2007-08 to tons 293 billion in 2011-12 showing a growth rate
of 2.64% per annum. The reserve capacity for lignite production increased from tons 39 billion
in 2007-08 to tons 42 billion in 2011-12 showing a growth rate of 1.9% per annum.
Major freight-generating sectors such as power, steel and cement industries and consequently
coal - both domestically mined and imported - are poised for a massive expansion. Coal
constitutes close to 45% of India’s total railways’ freight movement. Although part of the coal
movement may shift to non-rail alternatives (e.g. pit-head or portbased power plants relying
on merry-go-round or conveyor belt systems), concerns on pollution overload and energy
security at state/regional level would lead to continued expansion of thermal generation
capacity across the country. Both the volume and lead of coal transport would increase as a
result. A large part of the movement would involve linkages to new mines or ports.
Almost all economic activity requires electricity, and steel is an important input for many
industries. In order to sustain a GDP growth rate of 8-10% over the next two decades, it is
estimated the production of electrical energy will need to increase 3.5 times from 1,105 BU
now to 3,860 BU by 2031-32. As coal is expected to remain the dominant fuel for the power
sector, the requirement for coal is expected to grow correspondingly. Utilization of domestic
coal is expected to grow by about 2.5 times; from about 440 MMT in 2011-12 to 1,110 MMT
in 2031-32. Its use in the power industry will be limited by the amount produced and imports
will bridge the deficit and grow much faster; by almost five times; from 73 MMT in 2011-12 to
355 MMT by 2031-32.
Overleaf Table 77 indicates the generating capacity of electricity in the four riparian states.
IWT Sector Development Strategy and Business Development Study for Capacity Augmentation of National Waterway 1 from Haldia to Allahabad 193
Table 77: State-wise installed generating capacity of electricity
State
Installed generating
capacity of thermal
electricity (GWh)
Per-capita electricity
consumption
(Kwh)
Bihar 430 133.61
Jharkhand 1,550 790.20
Uttar Pradesh 7,117 449.89
West Bengal 6,484 563.78
Total India 131,603 883.63
Source: All India Electricity Statistics published by Central Electricity Authority, M/o Power, 2012
Low per-capita electricity consumption, compared to India as a whole, in the state of Bihar
and, to a certain extent, even in U.P. indicates significant material requirements in general and
a high potential for coal transports in particular upstream of the Farakka Barrage. These needs
could be covered, at least in part, by shipping cargo on the NW-1.
9.2 Impact of background economic growth on future transport demand
In the decades before and after economic reforms, total freight traffic grew at a pace broadly
comparable to GDP growth. Below Table 78 shows the correlation between GDP and traffic
growth:
Table 78: Freight elasticities with respect to GDP
Years 1950-51
to 1970-71 1970-71
to 1990-91 1990-91
to 2004-05 1950-51
to 2004-05 2004-05
to 2011-12
Rail Freight Traffic Elasticity 1.4 0.8 0.6 0.9 0.9 A
Road Freight Traffic Elasticity
3.1 2.0 1.1 2.0 1.4 E
Total Fright Traffic Total Freight Traffic Elasticity
1.8 1.3 0.9 1.3 1.2 E
Note: A Actual Elasticity
E Estimated Elasticity
Source: NTDPC Research
Road freight traffic which grew at a slower rate than GDP prior to 1991, increased at a higher
rate subsequently. The trend for rail traffic was exactly the opposite. Total freight traffic grew
parallel with GDP.
The intensity of steel use in the economy is expected to increase. So requirements for steel
will grow faster than the growth of the economy from 73 MMT in 2011-12 to 495 MMT in
2031-32; almost an eightfold increase. Keeping in mind that a ton of finished steel requires
three to four tons of raw material, the transport requirements for the steel industry will be
huge; growing from 600 MMT in 2011-12 to about 2,230 MMT in 2031-32.
The transport requirements for the power and steel industry are expected to grow from about
900 MMT now to 3,700 MMT in 2031-32. While POL and natural gas will also grow, most of
the transport for these commodities will be carried out through pipelines. Some POL will be
transported by rail, but the volumes will be very small and are not expected to impact the rail
network much. However, it will have a huge impact on waterway cargo traffic. It already has
IWT Sector Development Strategy and Business Development Study for Capacity Augmentation of National Waterway 1 from Haldia to Allahabad 194
the largest share (38%) of sea port traffic that will increase by over 2.5 times from about 330
MMT in 2011-12 to 865 MMT in 2031-32.
9.3 Freight volume growth as expected by producers and operators
Producers interviewed in the Haldia-Farakka sector expressed their expectations as to short-
term volume growth of their commodities. Below Table 79 summarizes the weighted averages
of growth expectations:
Table 79: Growth expectations of commodity volumes
Commodity Group Expected annual change (%)
Thermal Coal 5
Coking Coal 8
Pet Coke 8
Manganese Ore 10
Fly Ash 5
Stone Chips 5
Steel / Iron 6
(Silica) Sand 5
Limestone 6
Fertilizer (Urea) 5
Raw Sugar 10
Food Grains 5
Plastic Granules 5
Steel Wire / Girder 9
Cement & Concrete 7
Straight Run Naptha 10
Motor Spirit, Diesel & Kerosine 10
Agro-Equipment 5
Automobiles 5
Containers 10
Source: Consultants’ Market Survey, August-October 2015
These growth expectations, although being subjective, serve as a reliable forecast indicator
until about the end of this decade, as producers should have a good outlook on their
commodity’s perspectives. The above-expressed growth expectations vary between 5% and
10%, with industrial inputs at the lower, and consumer goods at the higher, end.
Subjective growth expectations will be compared against objective indicators such as GDP
growth forecasts.
IWT Sector Development Strategy and Business Development Study for Capacity Augmentation of National Waterway 1 from Haldia to Allahabad 195
10 Traffic Forecast – on O/D Routes
The following traffic projections consider various development stages of the NW-1
10.1 Methodology and future trends
10.1.1 Overview of the forecast modelForecast Model
The Consultants have used their integrated forecast model determining the freight flows on
the basis of the collected origin-destination pairs (O/D-pairs) from base year 2015 until 2045.
The model combines:
a. modal shift decisions through a comparison of the current transport mode (road/rail) with
alternative IWT routes based on quantitative (generalized cost) as well as qualitative
parameters (advantages of IWT transport);
b. traffic forecasts based on trend analyses for the relation of GDP (in terms of real prices)
respectively population growth and traffic volumes (in terms of tonnage) on the NW-1.
Figure 54: Methodology of the forecast model
Source: Consultants, 2015
Three different scenarios applied for the O/D-pairs traffic forecast (as depicted in the following
table) differ mainly in terms of the infrastructural extension/augmentation of the NW-1:
Low Augmentation Case (LAC),
Medium Augmentation Case (MAC),
Full Augmentation Case (FAC).
Generalised Cost1
Characteristics O/D-Transport Case
Quantitative Parameters
IWT Road Rail
Freight Rates & Value of Time
IWT Road Rail
Advantages of IWT2
Advantages of IWT per NW-1-Sector with regard to Rail & Road Transport
Infrastructure (e.g. depth of fairway) and navigability,
transport quality (e.g. reliability, safety), potential future
efficiency gains
Qualitative Parameters
IWT Road Rail
Which volumes of road & rail transport per O/D-pairs & per NW-1-Sector can be shifted towards IWT based on:
Decision on Modal Shift3
Decision Matrix integrating quantitative & qualitative decision parameters
1. Comparison of generalised cost (freight rate + value of time)of road/rail/IWT
2. Assessment of IWT advantages per NW-1-Sector
Quantitative
Qualitative
Forecast of IWT Volumes 2015-20454
Forecast of IWT volumes 2015, 2020, 2025, 2035, 2045 per (1) NW-1-Sectors; (2) commodity; (3) upstream/downstream using reasonable multipliers
Extrapolation of 2014 volumes, i.e. of (1) shifted volumes; (2) already existing IWT volumes; (3) new IWT volumes
Dry BulkLiquid Bulk
Break-bulk
General Cargo
Other Cargo
Trends in production of commodities, capacities of transport modes, etc.
Drivers
GDP & Population Growth Rates India as basis for
multiplier calculation
Drivers
BASE CASE
As-is-Situation of NW-1: No changes or improvements on
infrastructure and IWT policy/promotion.
MEDIUM AUGMENTATION CASE
Medium augmentation: 3 m water depth until Farakka; 2.50 m until
Patna and 2.00 m LAD until Varanasi; Supporting IWT policy
from the national or state government
FULL AUGMENTATION CASE
Major changes and improvement on the NW 1 river infrastructure
(dredging, weirs, locks): LAD until Patna of 3.00 m; LAD until Varanasi
2.50 m.; Supporting IWT policy from the national or state
government
LOW AUGMENTATION CASE
IWT Sector Development Strategy and Business Development Study for Capacity Augmentation of National Waterway 1 from Haldia to Allahabad 196
Technical improvements would already be introduced under the LAC, in that the NW-1 will
gradually be covered through electronic night navigation (based on global positioning). Also,
present obstructions such as low-lying bridges and very sharp bends would be improved.
Table 80: Transport model scenariosModel Scenarios
Scenario Description
Low Augmentation Case No changes or improvements on infrastructure and IWT policy/promotion: Construction of Multi-modal Terminals at Haldia, Kolkata, Tribeni, Sahibganj, Doriganj and Ramnagar/Varanasi; Regular growth rates in the IWT based on macroeconomic growth rates and regional economic development
Medium Augmentation Case Medium changes and improvements on infrastructure: Augmentation of NW-1 water depth: 3.0 m least-available depth (LAD) until Barh; 2.5 m until Buxar and 2.2 m LAD until Varanasi; Supporting IWT policy from the national or state government; Implemented IWT promotion concept to market the quality and services of IWT; Construction of Multi-modal Terminals at Haldia, Kolkata, Tribeni, Sahibganj, Doriganj and Ramnagar/Varanasi; Regular growth rates in the IWT based on macroeconomic growth rates and regional economic development
Full Augmentation Case Major changes and improvement on the NW 1 river infrastructure
(dredging, weirs, locks): LAD until Buxar of 3.0 m; LAD until Varanasi 2.5 m; Supporting IWT policy from the national or state government; Implemented IWT promotion concept to market the quality and services of IWT; Construction of Multi-modal Terminals at Haldia, Kolkata, Tribeni, Sahibganj, Doriganj and Ramnagar/Varanasi; Regular growth rates in the IWT based on macroeconomic growth rates and regional economic development
Source: Consultants, 2015
According to the fact that decisions for shifting transport volumes from land transport towards
inland-waterway transport (IWT) are multifaceted, the forecast model has two main pillars
indicating the quantitative and qualitative decision criteria:
Generalized cost comparison for O/D-pairs: The potential future traffic on the NW-1 is
mainly driven by volumes divertible from existing road and rail transport to IWT in regions
along the NW-1 (approximately 200 km each side of the river). One important criteria for
that decision of shippers are the generalized cost (freight costs plus value of time) which
arise per transport. Therefore, the analysis matrix evaluates the freight rates and travel
times of existing land transport as compared to freight rates and travel times that would
occur if this actual transport case (O/D-pair) would be shifted towards IWT. The calculation
is based on collected market data and is differed in freight rates per cargo packaging form
(dry bulk, bagged cargo, neo-bulk/general cargo, ro-ro, container and liquid bulk).
Analysis of advantages of IWT: With regard to each O/D-pair, the Consultants include their
expert estimations whether IWT will have an advantage against rail and road in terms of,
IWT Sector Development Strategy and Business Development Study for Capacity Augmentation of National Waterway 1 from Haldia to Allahabad 197
inter alia, infrastructure (navigability, especially draft of fairway per NW-1-sector of the O/D-
Pair), transport quality (reliability, speed), as well as potential future efficiency gains
(expected improved transport on IWT). This qualitative advantage may compensate a small
cost advantage of competing transport modes.
The transport model integrates these two views on modal shift, namely the quantitative
(freight rate and time) and the qualitative (IWT advantages towards competing transport
modes) perspective. Combining both pillars, it calculates whether and when the corresponding
transport volume per O/D-pair could be diverted to NW-1.
The applied model results in a forecast of future demand of freight transport volumes on the
NW-1 based on a large number of transport cases (O/D-pairs). In total, the future traffic
numbers on the NW-1 result from the following sources:
Already existing IWT transport cases (O/D-pairs) for certain commodities;
Existing road and rail transport cases (O/D-pairs) for certain commodities that can be
diverted towards the NW-1 based on the cost-ratio calculation between IWT and land
transport and based on quality advantages of IWT compared to the competing land
transport modes;
Future coal import volumes for new thermal power plants that are expected to be
transported via IWT.
Collected base volumes that are divertible to IWT are then extrapolated to the forecast horizon
2045, based on growth rates collected from market actors as well as a forecast of the general
market dynamics elaborated by the Consultants.
10.1.2 Evaluation of modal shifts
The evaluation of modal shifts is conducted for each O/D-pair based on the following steps.
1. Transport Case Description and Calculation of Generalized Cost:
Based on the collected market data, O/D-pairs are listed in the model with the shipped
commodity type, cargo packaging form, current transport mode, location of producers and
users, transport distances and time, volumes of base year 2014, and with the freight rates.
Based thereon, the generalized cost per ton is given as total freight rate per ton plus value of
the travel time. This data has been collected through conducting on-site market research using
questionnaire and personal interview methodology with shippers, consignees and industry
companies in a corridor of 200 km each side of the NW-1.
For each O/D-pair, the model further describes the following parameters under the assumption
that it is routed via IWT (corresponding with the real case if already today transported via IWT,
or else a hypothetical route assumed by the Consultants):
Entry and exit point of transport on NW-1;
Entry and exit sectors/stretches of NW-1:
- - Stretch 1: Haldia/Kolkata-Farakka-Haldia/Kolkata,
- - Stretch 2: Farakka-Sahibganj-Farakka,
- - Stretch 3: Sahibganj-Patna-Sahibganj,
- - Stretch 4: Patna-Varanasi-Patna,
IWT Sector Development Strategy and Business Development Study for Capacity Augmentation of National Waterway 1 from Haldia to Allahabad 198
- - Stretch 5: Varanasi-Allahabad-Varanasi;
Distinction between upstream and downstream traffic on NW-1;
"First Mile” and “Last Mile" distances (i.e., distance origin to entry point NW-1 as well as
distance exit point NW-1 to destination);
Transport distance waterway (“river bank to river bank” – this may include waterways other
than NW-1, such as the sea or other inland waterways);
Generalized cost for the IWT route (combined freight rate plus terminal handling rates plus
value of time).
2. Qualitative IWT advantages per Transport Case:
Besides the above-mentioned quantitative parameters, the transport model includes a
qualitative matrix asking for each O/D-pair whether IWT will have an advantage towards
competing transport modes on the corresponding stretches of NW-1 depending on low
augmentation case, medium or full augmentation case. Qualitative advantages of IWT towards
rail and road include transport quality criteria such as mass transportation capacity, transport
safety and reliability, and opportunities for intermodal shift. Furthermore, the IWT advantage
evaluation includes a consideration of possible future efficiency gains and thus transport cost
reduction. In that framework, the impact of infrastructure on type of vessels and their
operating costs has to be assumed (economies-of-size per vessel types which depend on
fairway drafts).
Overall, the following advantages have been identified:
Low Augmentation Case: advantage for routes within NW-1 Sector 1 (up to Farakka).
Medium Augmentation Case: advantage for routes within NW-1 Sectors 1-3 (up to Patna).
Full Augmentation Case: advantage for all routes.
In addition, current navigability in NW-1 Sectors 4 and 5 is considered insufficient for efficient
waterway transport. As a consequence, no shift is assumed for corresponding O/D-pairs in the
Low Augmentation Case.
3. Decision on Modal Shift per Transport Case:
After quantitative and qualitative parameters of the transport case have been identified, the
model calculates the relative difference in generalized cost between the transport case if
shifted to IWT and the current generalized cost. Depending on this relative advantage or
disadvantage of the IWT route in generalized cost, as well as the qualitative advantage or
disadvantage, it is evaluated whether a modal shift of the O/D-pairs’ volumes takes place and,
if it does, in which year.
The overleaf table shows the evaluation matrix which determines the year of shift (if any)
subject to a cost advantage (-100% to 5%) of IWT, current mode (road/rail) and qualitative
advantage of IWT.
IWT Sector Development Strategy and Business Development Study for Capacity Augmentation of National Waterway 1 from Haldia to Allahabad 199
Table 81: Criteria for modal shift
Source: Consultants, 2015
The inclination to shift to IWT increases with the advantage in generalized costs. In addition,
the inclination is higher if a qualitative advantage is given for the IWT route (a qualitative
advantage may even outweigh a small disadvantage in generalized costs).
10.1.3 Parameter assumptions used in the model
The following table shows the underlying parameter assumptions used in the model:
Table 82: Parameter Assumptions
Source: Consultants, March 2016
Three financial input figures have the most significant impact on forecast cargo volumes:
1. Freight prices (see Chapter 4.2.3 for their calculation process) modified into individual types
of shipped cargo by different stowage factors, and by the shipper calculating roundtrip
costs (in case of empty return voyage) and charging its insurance premium;
2. Terminal-handling rates applicable within the Kolkata Port Trust tariff (cargo handling) and
IWAI terminals (wharfage); and
3. Inventory costs (depending on the voyage speed of the three transport modes, generally to
the detriment of shifting potential onto the NW-1) of shipped major commodities.
from to Yes No Yes No
-100% -10% TRUE TRUE TRUE TRUE
-10% 5% TRUE - TRUE -
5% - - - - -
IWT Advantage in Generalised CostRoad Rail
Qualitative
Advantage IWT
Qualitative
Advantage IWT
Parameter Assumptions
Freight Prices IWT
2015 2020 2025 2035 2045 2015 2020 2025 2035 2045
Dry Bulk 1.84 1.84 1.47 1.23 1.23 1.84 1.84 1.47 1.23 1.23 Rs/tkm
Bagged 1.83 1.83 1.47 1.23 1.23 1.83 1.83 1.47 1.23 1.23 Rs/tkm
Neo-bulk 1.55 1.55 1.25 1.04 1.04 1.55 1.55 1.25 1.04 1.04 Rs/tkm
General Cargo 3.51 3.51 2.88 2.46 2.46 3.51 3.51 2.88 2.46 2.46 Rs/tkm
Ro-Ro 7.22 7.22 5.89 5.01 5.01 7.22 7.22 5.89 5.01 5.01 Rs/tkm
Container 4.66 4.66 3.87 3.35 3.35 4.66 4.66 3.87 3.35 3.35 Rs/tkm
Liquid bulk 1.59 1.59 1.27 1.06 1.06 1.59 1.59 1.27 1.06 1.06 Rs/tkm
Share of Two-Way Traffic 2015 2020 2025 2035 2045 Speed by Mode
Dry Bulk 0.0% 0.0% 25.0% 50.0% 50.0% Road Rail IWT
Bagged 0.0% 0.0% 25.0% 50.0% 50.0% 20.0 20.0 7.0 km/h
Neo-bulk 0.0% 0.0% 25.0% 50.0% 50.0%
General Cargo 0.0% 0.0% 25.0% 50.0% 50.0%
Ro-Ro 0.0% 0.0% 25.0% 50.0% 50.0%
Container 0.0% 0.0% 25.0% 50.0% 50.0%
Liquid bulk 0.0% 0.0% 25.0% 50.0% 50.0%
Stowage Factor
Base Freight Price - One-Way Traffic IWT Freight Insurance Value of Time Type of cargo (2014 cargo vol. >1.0 MMT) (m 3 /MT)Dry Bulk 1.83 0.01 Rs/tkm Coal 0.07 Rs/ton/h australian Coal, fly ash (bulk) 1.25
Bagged 1.80 0.03 Rs/tkm Construction Materials 0.17 Rs/ton/h cement Natural aggregates (bulk) 0.9
Neo-bulk 1.52 0.03 Rs/tkm Consumer Goods 1.80 Rs/ton/h Lime stone (bulk) 0.8
General Cargo 3.15 0.36 Rs/tkm Project Cargo 4.45 Rs/ton/h Fertilizer (bagged) 1.25
Ro-Ro 6.62 0.60 Rs/tkm Fertilizer 0.31 Rs/ton/h DAP Grain (bagged) 1.3
Container 3.94 0.72 Rs/tkm Food and Foodstuff 0.27 Rs/ton/h wheat Cement (bagged) 0.85
Liquid bulk 1.58 0.01 Rs/tkm Gas and Petroleum 0.09 Rs/ton/h diesel Bricks & tiles (palleted) 1.0
Minerals & Chemicals 0.09 Rs/ton/h iron ore Steel (neo-bulk) 0.6
Container 3.60 Rs/ton/h General cargo (piece) 2.0
Source: Below Tables on Freight-Prices Breakup for Movement of Cargo on NW-1 Vehicles 4.45 Rs/ton/h US$ 5ooo/ton Vehicles (piece) 4.2
Notes to calculation: Convertion from commodity (as above) Containers (boxes) 2.5
Terminal Handling Rate (per Handling) per-ton prices into hourly interest Crude oil, petroleum (bulk) 1.0
Dry Bulk 62.5 Rs/t
Bagged 54.5 Rs/t Source: Specific commodity prices in internet
Neo-bulk 142.0 Rs/t 13% annual interest rate
General Cargo 96.0 Rs/t
Ro-Ro 37.0 Rs/t 300 working days per year
Container 167.7 Rs/t
Liquid bulk 48.7 Rs/t 1.5 ratio first/last mile vs. main freight rate
Notes to calculation: Average 2 days of 1,000-ton barge assumed for berthing charges; Stevedoring and shore-handling (by terminal) of bagged, neo-bulk, ro-ro and general cargo receive 40% rebate; Only 1/3 of 2014 dry-bulk cargo volume with 40% rebate
Sources: (1) The Gazette of India, July 16, 2011 (Part III - Sec. 4); 13.5 tons per TEU
(2) S5-S6/Part–I and S11.3/Part-II of No. TAMP/8/2013-KOPT, 24 February 2014
Down
Notes to calculation: Proportional to 1.000-ton barge (Barh upstream) : 2,000-ton barge (Barh downstream),
multiplied by stowage factors, plus 0.01% of commodity value as insurance cover for voyage charge
Up
Sources: (1) http://www.jctrans.net/Register/SF.html#C;
(2) https://en.wikipedia.org/wiki/Stowage_factor, 12 March 2016
IWT Sector Development Strategy and Business Development Study for Capacity Augmentation of National Waterway 1 from Haldia to Allahabad 200
Assumptions
It has been assumed that the Medium Augmentation shall be completed by 2025.
Vessel Sizes
The average vessel size of 1000MT has been assumed to ply across the stretches in
2015.
By 2017 the shallow draft vessels design will be available and accordingly the vessel
size across different stretches shall increase from 1000MT to 2000MT by 2020.
The medium augmentation (MAC) shall be completed by 2025 and by then the average
vessel size shall increase to 2500MT. In 2035 it has been assumed that the existing
vessels of 2015 would have phased out and the average vessel size shall become
3000MT.
The vessel carrying capacity has been assumed same across NW-1 inspite of different
characteristic of waterway from Haldia to Farakka and Farakka to Allahabad. The LAD
in stretch between Haldia to Farakka is more but the radius of curvature of bends is
limiting factor on the vessel size and not able to use tug and tow concept. Whereas the
stretch between Farakka to Allhabad has lower LAD but stretches are wider, have less
number of bends and with larger radius of curvature hance Tug and Tow has been
assumed to be used for the stretch.
Directional Flow of Traffic
It has been assumed that in 2020 the vessels shall be able to get cargo in both directions
for about 25% of the total cargo and in 2025 50% and by 2045 the number shall be about
70%.
Freight rates
The freight rates have been taken averaging the upstream and downstream cargo and
the effect of the vessel size on freight rates has been also accounted for. The operational
period for the vessels has been assumed to be 250 days in a year.
Year 2015 2020 2025 2035 2045
Vessel Size
in MT 1000 2000 2500 3000
IWT BC 1.83 1.6725 1.475 1.396 1.3565
IWT MAC 1.1025 0.92 0.868 0.816
IWT FAC 1.05 0.868 0.816 0.675
Growth
The growth has been accumulated on cumulative year on year basis.
IWT Sector Development Strategy and Business Development Study for Capacity Augmentation of National Waterway 1 from Haldia to Allahabad 201
Table 83: Earliest consideration of NW-1 term-inals for forecast calculation (per time block)
Source: PMU / IWAI, March 2016
Finally, inclination to shift to the NW-1
depends on the inauguration date of each
multi-modal terminal. Construction of six
terminals is envisaged (detailed planning
has partly been initiated) with finalization
date before the year 2020. In parallel
growth to the expected cargo-traffic
volumes, other terminals are planned to be
constructed between the years 2020 and
2025, with construction of the last terminals
upstream of Ramnagar/Varanasi envisaged
to be finalized between the years 2025 and
2035. Table 84 depicts the years for which
any multi-modal terminal envisaged to be
established alongthe NW-1 can be
considered earliest for calculation with the
Consultants’ Transport Forecasting Model.
Through an iteration process, the
Consultants calculated all feasible
alternatives for a multi-modal terminal,
through which cargo could be routed for all
O/D pairs for which the optimum terminal
would not be finalized before 2020.
10.1.4 Volume forecasts
After the decision whether a transport case could be shifted to IWT, the volumes of 2014 are
extrapolated to the forecast years 2020, 2025, 2035 and 2045. The transport model
extrapolates the divertible volumes by using assumptions on growth rates collected from
relevant market actors (shippers, consignees) in the states of West Bengal, Bihar, Jharkhand
and Uttar Pradesh. In addition, and especially in case that there are no statements available
from market actors, the model takes macro-economic growth rates as parameters for
extrapolation. These general market growth rates are calculated with the methodology of
elasticity techniques, using the development pattern of relevant economies per different cargo
types (dry bulk, liquid bulk, neo-bulk, general cargo and other cargo types).
Growth Rates:
As market actors can give solid estimations on the development of their transport volumes only
for the next 5-10 years, the general market growth rates are used by the model for all mid- and
long-term volume forecast from 2020 onwards until 2045. For that time frame, the model is
calculating an average weighed growth rate per O/D-pair based on the market actors’ growth
rate and of the general market growth rates. The following table indicates the weights between
growth rates reported by market actors and the general market dynamics. For earlier years,
more weight is given to the growth rates specifically reported for an OD-Pair. For later periods,
more weight is put on the general market dynamics.
IWT Sector Development Strategy and Business Development Study for Capacity Augmentation of National Waterway 1 from Haldia to Allahabad 202
Table 84: Forecast growth rates – Weighting of specific and general market expectations by year
Source: Consultants, 2015
The general market growth rates have been based on elasticity analysis of historic production
and demand data. Elasticity is a tool for measuring the responsiveness of a function to changes
in parameters. For example, to determine the elasticity of the two parameters ‘Traffic Volumes’
and ‘GDP’, the following equation can be applied:
𝐸𝑙𝑎𝑠𝑡𝑖𝑐𝑖𝑡𝑦 =% 𝑐ℎ𝑎𝑛𝑔𝑒 𝑖𝑛 𝑠𝑎𝑛𝑑 𝑡𝑜𝑛𝑛𝑎𝑔𝑒
% 𝑐ℎ𝑎𝑛𝑔𝑒 𝑖𝑛 𝐺𝐷𝑃
Following this equation, the elasticity is the ratio of the %change in one variable to the %change
in the other variable. Thus, if the elasticity is larger than 1, the relationship between the two
parameters is considered to be elastic (a parameter responds largely to small changes in other
parameters). If it is less than 1, the relationship is said to be inelastic (it does not change much
in response to changes in other parameters). In order to forecast growth rates of volumes of
different commodities year by year, the current volumes are multiplied by the forecasted %
change in GDP or in population and by the ‘multiplier’ which is specific to each commodity
type.
Growth rates thus derive from analyzed and assumed elasticities in combination with the
forecasts of real GDP and population. GDP is considered the main driver for most commodities;
however, population is considered the main driver for agricultural and staple goods.
Table 85: Real GDP and population forecast India (annual %-change)
2015 2016 2017 2018 2019 2020 2025 2035 2045
GDP 7.46 7.47 7.55 7.65 7.70 7.75 6.61 5.18 4.25
Population 1.24 1.22 1.21 1.19 1.17 1.15 1.02 0.74 0.48
Source: GDP: 2015 IMF data for years until 2020, thereafter 2014 OECD long-term baseline projections from OECD Economic
Outlook No. 95. Population forecast based on data from UN ESA 2015.
The following table provides an overview over the derived general market growth rates, based
on analysis of historic elasticities and under consideration of GDP and population forecasts. In
line with common practice, growth rates have been derived under the general assumption of
decreasing elasticities to account for increasing market saturations as well as a structural
change of the economy towards services. Thus, the forecast may be seen to have a somewhat
conservative edge.
2015 2016-20 2021-25 2026-35 2036-45
Reported Growth Rate 100% 90% 50% 25% 0%
General Market Growth Rate 0% 10% 50% 75% 100%
IWT Sector Development Strategy and Business Development Study for Capacity Augmentation of National Waterway 1 from Haldia to Allahabad 203
Table 86: General market growth factors for traffic forecast (2015-2045)
Commodity Type Driver Average Yearly Traffic Growth Factors
2015-2020 2021-2025 2026-2035 2036-2045
Coal Fertilizer
GDP 1.09 1.03 1.02 1.01
Population 1.03 1.02 1.01 1.01
Rice Wheat Maize
Population 1.01 1.01 1.01 1.01
Population 1.02 1.02 1.01 1.01
Population 1.01 1.01 1.01 1.00
Other Food Grains Corn Flour
Population 1.02 1.01 1.01 1.01
Sand Stone Chips
GDP 1.10 1.05 1.03 1.02
Natural Aggregates Lime Stone Concrete
GDP 1.10 1.05 1.03 1.02
Cement Iron Ore
GDP 1.06 1.05 1.03 1.02
GDP 1.01 1.01 1.01 1.01
Fly Ash Animal Feedstuff Plastic Granules
GDP 1.04 1.04 1.03 1.02
Population 1.02 1.02 1.01 1.01
GDP 1.07 1.06 1.04 1.03
LPG Gas Petroleum Edible Oil
GDP 1.05 1.04 1.03 1.01
Population 1.04 1.02 1.01 1.01
Logs Paper
GDP 1.05 1.04 1.03 1.02
ODC Steel Container Handloom & Agro Equipment
GDP 1.05 1.04 1.03 1.02
GDP 1.06 1.04 1.03 1.02
GDP 1.13 1.07 1.04 1.03
GDP 1.07 1.05 1.04 1.03
Population 1.03 1.02 1.01 1.01
Vehicles GDP 1.09 1.08 1.05 1.03
Source: Consultants, 2015
The following paragraphs close with some particular remarks on three relevant commodities:
coal, construction materials, and containers.
Coal:
Until 2018 a certain number of coal-heated thermal power plants will start operation along
NW-1. To overcome any erratic supplies of indigenous coal, the MOP allows power plants to
blend imported coal to the extent of 20%.52 Thus, the transport model assumes that
approximately 20% of coal requirements of those thermal power plants which are or will be
located near to the NW-1 will be satisfied through imported coal which in turn is potential
volume for IWT.
Sheet 16 “Coal Projects - Project Region” of Volume II: Transport Forecast Model presents a list
of already existing or planned thermal power plants. Subject to their distance from NW-1, the
model takes into account the thermal power plants marked in blue. For all these future thermal
52 Coal Movement on Ganga (NW-1), IWAI presentation, 25 February 2010, p.18
IWT Sector Development Strategy and Business Development Study for Capacity Augmentation of National Waterway 1 from Haldia to Allahabad 204
power plants, specific O/D-pairs have been added to the forecast model in order to account for
the associated coal volumes expected on NW-1.
Construction Materials:
With regard to commodities that are closely linked with India’s building industry, such as sand,
stone chips, natural aggregates, lime stone or concrete, there will be relatively high annual
growth rates in the next five years until 2020 due to the goals laid down in the 11th and 12th
Five-Year Plans of the Indian Government. The following figure shows India's last years’
construction spending (in billions US$ per market year) with a CAGR of 13.4% for residential
construction, and CAGR of 12.2% for non-residential constructions.
Figure 55: India’s construction spendings
Source: Consultants, 2015 based on data IHS Global Insight (2009)
and numbers of 11th Five-Year-Plan
The growth in construction sector in GDP (3.85% in 2010-2011 compared to 2.85% in 2006-07)
has primarily been on account of increased spending on physical infrastructure in the last few
years through programs such as National Highway Development (NHDP) and PMGSY/Bharat
Nirman (India’s Twelfth Five Year Plan, Chapter 19, p. 362). The Consultants calculated the
annual average growth rate (AAGR) in this sector to be about 8% in the year 2020, decreasing
to 2% in 2045.
Containers:
With an AAGR of about 13%, container traffic growth is expected to be relatively high during
the initial years, driven by the general economic development as well as increasing
containerization. The latter effect is likely to be significant in particular after opening of
multimodal terminals along NW-1, which will facilitate the multi-modal transport in the
corridor.
It should be noted, however, that the mentioned effects will decrease over time. As a
consequence, the Consultants calculated the AAGR to decline to 3% by the year 2045 based on
decreasing elasticities.
10.2 Results of traffic forecast for existing and augmented NW-1
Given the freight tariff rates of the competing transport modes roads and railways, and
assuming that short-range pre- and onward carriage will not be charged more than 50% higher
IWT Sector Development Strategy and Business Development Study for Capacity Augmentation of National Waterway 1 from Haldia to Allahabad 205
than longer range road transport, the Consultants calculated the freight tariff rates for shipping
dry bulk, bagged, neo-bulk and general cargo on the NW-1 as indicated in the previous Chapter
10.1.3. From IR data sources, the Consultants concluded that terminalhandling charges in the
railway mode are already included in the published freight tariff rates (explained by a relatively
high charge for the shortest segment of 1-125 km distance).
10.2.1 Total cargo volumes by case
Under the above assumptions (see Chapter 10.1.1 for a description of the below three cases),
following cargo traffic volumes (by types) could be projected for the entire waterway.
Table 87: Cargo volumes projected 2020-2045 – by scenario (tons)
Year Low Augmentation Case
Medium Augmentation Case
Full Augmentation Case
2020 120,14,210 218,88,955 225,22,417 2025 143,64,941 373,27,425 431,49,885 2035 168,59,505 556,27,176 916,10,968 2045 181,42,494 654,54,128 1320,11,894
Source: Consultants’ Market Survey July-October 2015, calculations by transport model
Above table shows that, in the case of sufficient development of the NW-1 (medium
augmentation) as planned, more than 65 MMT of cargo could be shifted onto the NW-1 by the
year 2045. This accumulated cargo volume is derived from diverted traffic (for details see Sheet
15: “Traffic Forecast - Freight Rates Comparison including already existing IWT traffic” of
Volume II: Transport Forecast Model) out of the almost 520 O/D pairs which were identified as
potentially feasible during the Consultants’ market survey.
Figure 56: Cargo volumes projected 2020-2045 – by scenario (tons)
Source: Consultants’ Market Survey July-October 2015, calculations by transport model
The relatively small margin between medium and full augmentation cases is due to the fact
that most shipping traffic would be expected in the downstream sectors of the NW-1 (see next
section) which will be dredged to 3m depth also under the Medium Augmentation Case.
0
0.1
0.2
0.3
0.4
0.5
0.6
0.7
0.8
0.9
1
0 0 0 0 0
#REF! #REF! #REF! Linear (#REF!)
IWT Sector Development Strategy and Business Development Study for Capacity Augmentation of National Waterway 1 from Haldia to Allahabad 206
For the above reason and due to the fact that the Medium Augmentation Case almost perfectly
reflects the dredging depths as presently planned by the MoS, the following sections are
limited to a discussion of this MAC. Low and full augmentation cases are presented in the data
interpretation sheets 3 to 14 of Volume II: Transport Forecast Model.
10.2.2 Cargo flows by original transport mode
Apart from slightly more than 5 MMT (mostly coal and fly ash) presently shipped on the NW-1
(and the connected IBPR), more than three fourth of the land-based cargo traffic would be
diverted away from roads (see below table). This high proportion is due to the fact that in the
Project region much higher cargo volumes are transported by trucks.
Table 88: Cargo flows by original transport mode before deviation (MAC, million tons)
Years Rail Road IWT Future IWT
Grand Total
2020 0.89 17.20 2.30 1.50 21.89
2025 11.91 21.05 2.87 1.50 37.33
2035 22.29 28.95 2.89 1.50 55.63
2045 22.71 30.88 10.36 1.50 65.45
Source: Consultants’ Market Survey July-October 2015, calculations by transport model
Future IWT traffic consists of imported coal to upstream thermal power plants (TPPs), which is
expected to be diminished following GoI policy (see Chapter 5).
Figure 57: Cargo volumes by original transport mode before deviation (million tons)
Source: Consultants’ Market Survey July-October 2015, calculations by transport model
10.2.3 Cargo volumes upstream against downstream flows
The following section compares the traffic flow development on the NW-1, distinguishing
between upstream and downstream shipping.
Of the 2014 cargo volumes shipped on the NW-1, about 70% are being transported upstream.
Most of this cargo consists of imported coal being shuttled to the Farakka TPP.
0.00
10.00
20.00
30.00
40.00
50.00
60.00
70.00
2020 2025 2035 2045
Rail Road IWT Future IWT
IWT Sector Development Strategy and Business Development Study for Capacity Augmentation of National Waterway 1 from Haldia to Allahabad 207
Table 89: Cargo flows upstream vs downstream – development 2020-2045 (MAC, million tons)
Years Upstream Downstream Grand Total
2020 15.37 6.52 21.89
2025 29.78 7.55 37.33
2035 36.69 18.94 55.63
2045 46.22 19.24 65.45
Source: Consultants’ Market Survey July-October 2015, calculations by transport model
By the year 2045, the share of upstream cargo would increase to 70%, much of it originating
from shipments of imported coal to the thermal power plants which are being erected mainly
in the downstream sectors (Bihar) of the NW-1. Fly ash results from burning the coal at TPPs,
thus fly ash equivalent to about one-third of coal volumes constitutes one major commodity
for downstream shipment. Furthermore, a combination of overseas and coastal cargo from
Haldia and Kolkata would result in increased shipments from the middle stretches of the NW-
1 catchment area to the Varanasi-Allahabad region.
Figure 58: Cargo flows upstream vs downstream 2020-2045 (million tons)
Source: Consultants’ Market Survey July-October 2015, calculations by transport model
Shipments by 2,000-ton barges on the middle stretches of the NW-1 will be made possible
through large river-dredging works there, which will facilitate large barge operations on the
Ballia-Allahabad sector of the NW-1.
10.2.4 Volumes by cargo types
The following section lays out the development of shipping distinguished by cargo (packaging)
types by comparing the cargo flows between beginning (year 2015) and end (year 2045) of the
projection period.
As the below table and graphic impressively show, dry-bulk cargo shipments would constitute
the major cargo type to be moved on the NW-1. With almost two-third of total volumes, this
cargo type holds the highest potential to be diverted onto the NW-1.
15.37
29.7836.69
46.22
6.52 7.55
18.94 19.24
0.00
5.00
10.00
15.00
20.00
25.00
30.00
35.00
40.00
45.00
50.00
2020 2025 2035 2045
CHART TITLE
Upstream Downstream
IWT Sector Development Strategy and Business Development Study for Capacity Augmentation of National Waterway 1 from Haldia to Allahabad 208
Table 90: Cargo volumes by type projected 2015-2045 (MAC, million tons)
Year 2020 2025 2035 2045
Bagged 1.93 2.07 4.12 4.19
Container 4.19 4.53 4.98 5.38
Dry Bulk 11.33 26.05 41.29 50.57
General Cargo 1.62 1.69 1.76 1.77
Liquid Bulk 0.01 0.01 0.01 0.01
Neo-Bulk 2.75 2.93 3.12 3.18
Ro-Ro 0.05 0.05 0.35 0.36
Grand Total 21.89 37.33 55.63 65.45
Source: Consultants’ Market Survey July-October 2015, calculations by transport model
Between the year 2025 and 2035, container shipments from Kolkata to both the industrial
Varanasi-Allahabad region and for onward trucking into the Katmandu Valley of Nepal would
be established on the NW-1. Containerized cargo would reach a significant volume of more
than 5 MMT by the year 2045.
Figure 59: Cargo volumes by type projected 2015-2045 (million tons)
Source: Consultants’ Market Survey July-October 2015, calculations by transport model
Bagged cargo flows would reach 4.19 MMT by the year 2045. Finally, flows of neo-bulk
shipments consisting mainly of prefabricated steel for housing and plant construction would
reach 3.18 MMT.
10.2.5 Cargo volumes by commodity
Shipments of construction materials, particularly natural aggregates (stone chips and bagged
cement), would benefit most from waterway improvements. With more than 24 MMT by 2045,
this commodity group would constitute by far the largest proportion of projected cargo traffic
on the NW-1. With more than 11 MMT, coal would follow suit. Large quantities of fly ash
(Minerals & Chemicals) would constitute a significant counter-flow to coal shipments.
2 0 2 0 2 0 2 5 2 0 3 5 2 0 4 5
Bagged Container Dry Bulk General Cargo
Liquid Bulk Neo-Bulk Ro-Ro Grand Total
IWT Sector Development Strategy and Business Development Study for Capacity Augmentation of National Waterway 1 from Haldia to Allahabad 209
Table 91: Cargo volume forecast 2015-2045 by commodity group (MAC, million tons)
Year Coal Construction
Materials
Consumer
Goods
Container Fertilizer Food and
Foodstuff
Gas and
Petroleum
Minerals &
Chemicals
Project
Cargo
Vehicles Grand
Total
2020 1.92 9.97 0.34 4.19 0.21 2.26 0.84 1.61 0.48 0.05 21.89
2025 8.12 17.97 0.41 4.53 0.22 2.38 0.89 2.26 0.50 0.05 37.33
2035 13.39 29.71 0.42 4.98 0.50 2.46 0.96 2.35 0.51 0.35 55.63
2045 20.98 31.43 0.43 5.38 0.50 2.48 0.97 2.40 0.52 0.36 65.45
Source: Consultants’ Market Survey July-October 2015, calculations by transport model
Container would constitute the third most important commodity group with almost 5.38 MMT
of containerized cargo by 2045. Foodstuff, mainly bagged grains, with 2.48 MMT would
represent another important commodity group.
Figure 60: Cargo volume projection by commodity group 2015-2045 (million tons)
Source: Consultants’ Market Survey July-October 2015, calculations by transport model
Gas & petroleum moved in drums (neo-bulk) plus project cargo, generally too heavy and
spacious to be trucked per road or transported on rail, with about 1 MMT constitute the last
important commodity groups.
0.00
10.00
20.00
30.00
40.00
50.00
60.00
70.00
2020 2025 2035 2045
Coal Construction Materials Consumer Goods Container
Fertilizer Food and Foodstuff Gas and Petroleum Minerals & Chemicals
Project Cargo Vehicles
IWT Sector Development Strategy and Business Development Study for Capacity Augmentation of National Waterway 1 from Haldia to Allahabad 210
Below table and figure detail the overleaf-described split of groups into individual commodities.
Table 92: Cargo volume forecast 2015-2045 by individual commodity (MAC, tons)
Year Bleaching Powder
Cement Coal Container Fertilizer Flour Fly Ash Food Food Grains
Iron Ore Lime Stone
Logs & Wood
LPG Gas
2020 650 1063697 1917071 4191502 213658 30047 1558354 1624342 87208 19830 4169 104069 11095
2025 656 1148182 8123698 4526822 219267 30907 2095654 1689101 91895 124938 4377 108441 11650
2035 663 2851943 13388403 4979504 498621 31483 2095654 1756115 94742 166364 4032827 111844 11999
2045 669 2908982 20975354 5377864 503607 31798 2137567 1773676 95689 168027 4113484 114081 12119
Minerals Natural Aggregates
Paper Petroleum Plastic Granules
Project Cargo
Rice Sand Statues Steel Textiles Tobacco Vehicles Wheat Grand Total
24040 7639598 16028 832073 10194 483597 51094 170130 129444 991904 191560 0 51454 472148 21888955
24761 15433856 16919 878156 10805 498203 53605 178637 133327 1096808 259634 20528 54541 492059 37327425
24761 21339920 17522 952224 66093 510729 55023 178637 134661 1191692 271152 16586 345096 502918 55627176
25008 22900159 17872 961746 68075 520944 55573 182210 134661 1215526 279287 16752 355449 507947 65454128
Source: Consultants’ Market Survey July-October 2015, calculations by transport model
As a summary of this forgoing section, the Consultants state that in the MAC the commodity mix would attain a mixture rather typical for IWT, with construction
materials, coal, minerals & chemicals, containers and bagged food & foodstuff being shipped in highest volumes.
IWT Sector Development Strategy and Business Development Study for Capacity Augmentation of National Waterway 1 from Haldia to Allahabad 211
Figure 61: Cargo volume projection by individual commodity 2015-2045 (tons)
Source: Consultants’ Market Survey July-October 2015, calculations by transport model
0
10000000
20000000
30000000
40000000
50000000
60000000
70000000
2020 2025 2035 2045
Wheat
Vehicles
Tobacco
Textiles
Steel
Statues
Sand
Rice
Project Cargo
Plastic Granules
Petroleum
Paper
Natural Aggregates
Minerals
LPG Gas
Logs & Wood
Lime Stone
Iron Ore
IWT Sector Development Strategy and Business Development Study for Capacity Augmentation of National Waterway 1 from Haldia to Allahabad 212
10.3 Examination of origin-destination pairs
This section finally presents the Consultants’ forecast for the three selected O/D pairs based
on the cost advantages of multi-modal against pure land-based transport, as calculated by the
transport model and exemplified in Chapter 6.5.1.
Overleaf Table 93 depicts the growth rates which the Consultants calculated for each individual
commodity as a trend from historical growth modified by future population and GDP
development. Generally, these cargo-traffic growth rates are expected to decline as India’s
population growth is diminishing. An O/D pair could be diverted via the NW-1 only as soon as
the multi-modal terminals at both ends of the water voyage leg have been established.The
Consultants considered this progressive development of multi-modal terminals – according to
IWAI information – for the year blocks 2020, 2025 and 2035 as depicted in overleaf Table 93.
In line with the Consultants’ Transport Model, the table indicates the Medium-Augmentation
Case (MAC) cargo-traffic forecast in terms of both volumes (tons) and transport productivity
(ton-km).
Table 93: Important commodities via NW-1 & respective growth rates
Commodity Type
Earliest Consideration of Terminals
(year)
Growth Factor 2016-2020
Growth Factor 2021-2025
Growth Factor 2026-2035
Growth Factor 2036-2045
Coal 2020 1.08 1.06 1.04 1.01
Fly Ash 2015 1.04 1.04 1.03 1.02
Iron Ore 2025 1.09 1.06 1.03 1.01
Lime Stone 2035 1.06 1.05 1.03 1.02
Sand 2025 1.10 1.05 1.03 1.02
Stone Chips 2020 1.10 1.05 1.03 1.02
Plastic Granules 2020 1.05 1.06 1.04 1.03
Grain 2020 1.00 1.01 1.01 1.01
Cement 2020 1.10 1.07 1.05 1.02
Fertilizer 2025 1.03 1.02 1.01 1.01
Steel 2020 1.06 1.04 1.03 1.02
Petroleum 2025 1.09 1.07 1.04 1.01
Logs & Wood 2020 1.10 1.07 1.05 1.02
Textiles 2020 1.03 1.04 1.03 1.03
Project Cargo 2020 1.05 1.04 1.03 1.02
Statues 2020 1.05 1.03 1.01 1.00
Paper 2020 1.05 1.05 1.03 1.02
Food 2020 1.05 1.03 1.02 1.01
Container 2020 1.10 1.08 1.06 1.03
Vehicles 2035 1.05 1.06 1.05 1.03
IWT Sector Development Strategy and Business Development Study for Capacity Augmentation of National Waterway 1 from Haldia to Allahabad 213
10.4 IWT-cargo volumes through existing and planned major multi-modal terminals
The following sections depict the forecast traffic flows individually through the existing or
planned major multi-modal terminals, viz Haldia, Kolkata, Sahibganj, Patna and
Ramnagar/Varanasi.
10.4.1 Haldia Multi-modal Terminal and Sagar Island
Haldia MMT constitutes the largest IWT-infrastructure development downstream of the Farakka
Barrage. Under the MAC, total cargo volumes are forecast to reach more than 7.6 MMT by the
year 2045 (for details see Sheet 10: “Cargo-Volume Data Interpretation - Multimodal Cargo
Potential Haldia MMT” of Volume II: Transport Forecast Model).
This terminal is dedicated to handle mainly bulk cargoes, much of which would constitute coal
loaded for shipment to upstream TPPs which are being erected mainly in Bihar. This coal could
alternatively be transshipped midstream off-shore Sagar Island. This major cargo stream is
reflected in below Table 94 which indicates loaded cargo volumes more than double of
discharged ones.
Table 94: Haldia MMT - 2020-2045 forecast by loaded versus unloaded cargo (MAC, million
tons)
Year Load Unload Total
2020 4.55 3.40 7.95
2025 11.35 4.23 15.59
2035 11.92 4.44 16.36
2045 19.54 4.51 24.04
Source: Consultants’ Market Survey July-October 2015, calculations by transport model
Figure 62: Haldia MMT loaded versus unloaded cargo 2020-2045 (million tons)
IWT Sector Development Strategy and Business Development Study for Capacity Augmentation of National Waterway 1 from Haldia to Allahabad 214
Source: Consultants’ Market Survey July-October 2015, calculations by transport model
Table 95: Haldia MMT - 2020-2045 cargo forecast by cargo type (MAC, million tons)
Year Bagged Container Dry Bulk Neo-Bulk General Cargo
Total
2020 0.43 0.16 5.15 1.27 0.93 7.95
2025 0.44 0.17 12.61 1.40 0.96 15.59
2035 0.74 0.19 12.89 1.56 0.98 16.36
2045 0.75 0.21 20.51 1.58 0.99 24.04
Source: Consultants’ Market Survey July-October 2015, calculations by transport model
By the year 2045, dry-bulk cargo, would be the major cargo. Neo-bulk and general cargo would
also constitute important cargo types. In contrast, bagged and containerized cargo volumes
would almost be negligible.
Figure 63: Haldia MMT - 2020-2045 cargo forecast by cargo type (million tons)
4.55
11.35 11.92
19.54
3.40
4.23 4.44
4.51
0.00
5.00
10.00
15.00
20.00
25.00
30.00
2020 2025 2035 2045
Unload
Load
IWT Sector Development Strategy and Business Development Study for Capacity Augmentation of National Waterway 1 from Haldia to Allahabad 215
Source: Consultants’ Market Survey July-October 2015, calculations by transport model
Coal, gas & petroleum, foodstuff (mostly bagged grain) and minerals & chemicals would
constitute the most important commodity groups.
Table 96: Haldia MMT - 2020-2045 cargo forecast by commodity groups (MAC, million tons)
Year Coal Construction Materials
Consumer Goods
Container Fertilizer Gas and Petroleum
Minerals & Chemicals
Project Cargo
Food and Foodstuff
Total
2020 1.82 0.31 0.12 0.16 0.35 1.00 3.14 0.05 1.02 7.95
2025 8.02 0.38 0.18 0.17 0.36 1.06 4.32 0.05 1.05 15.59
2035 8.26 0.45 0.19 0.19 0.60 1.14 4.41 0.05 1.07 16.36
2045 15.79 0.46 0.20 0.21 0.61 1.15 4.50 0.05 1.08 24.04
Source: Consultants’ Market Survey July-October 2015, calculations by transport model
0.00
5.00
10.00
15.00
20.00
25.00
30.00
2020 2025 2035 2045
Bagged Container Dry Bulk Neo-Bulk General Cargo
IWT Sector Development Strategy and Business Development Study for Capacity Augmentation of National Waterway 1 from Haldia to Allahabad 216
Figure 64: Haldia MMT - 2020-2045 cargo forecast by commodity group (million tons)
Source: Consultants’ Market Survey July-October 2015, calculations by transport model
The GoI might need to decide whether operation of other dry bulk cargoes could be diverted to Haldia
MMT away from Kolkata GRT, as demand at the latter terminal (see next section) might outrun the supply
of facilities.
0.00
5.00
10.00
15.00
20.00
25.00
30.00
2020 2025 2035 2045
Coal Construction Materials Consumer Goods
Container Fertilizer Gas and Petroleum
Minerals & Chemicals Project Cargo Food and Foodstuff
IWT Sector Development Strategy and Business Development Study for Capacity Augmentation of National Waterway 1 from Haldia to Allahabad 217
10.4.2 Kolkata Garden Reach Terminal
Kolkata GRT will be integrated into the large production and demand generated within the
Kolkata metropolitan area. Despite the terminal’s location in a central area (usually with rather
balanced demand and supply), the Consultants expect differences in loaded versus unloaded
cargo volumes to be very unbalanced. The Consultants expect traffic volumes to increase more
than tenfold during the forecast period 2020-2045, of which more than threefourth would be
cargo loaded for upstream shipments.
Table 97: Kolkata GRT - 2020-2045 forecast by loaded versus unloaded cargo (MAC, million
tons)
Year Load Unload Total
2020 5.01 2.21 7.21
2025 5.36 2.32 7.69
2035 5.89 12.04 17.92
2045 6.29 12.22 18.51
Source: Consultants’ Market Survey July-October 2015, calculations by transport model
Figure 65: Kolkata GRT loaded vs unloaded cargo 2020-2045 (million tons)
Source: Consultants’ Market Survey July-October 2015, calculations by transport model
One major reason for this unbalance would be the terminal’s dedication to handling mainly
general cargoes, most of which would be containerized bound for Nepal and upstream NW-1
(for details see Sheet 11: “Cargo-Volume Data Interpretation - Multi-modal Cargo Potential
Kolkata GRT” of Volume II: Transport Forecast Model). Kolkata GRT could thus develop into an
important supply base for the upstream waterway region.
5.01 5.36 5.89 6.29
2.21 2.32
12.04 12.22
0.00
2.00
4.00
6.00
8.00
10.00
12.00
14.00
16.00
18.00
20.00
2020 2025 2035 2045
Load Unload
IWT Sector Development Strategy and Business Development Study for Capacity Augmentation of National Waterway 1 from Haldia to Allahabad 218
Table 98: Kolkata GRT - 2020-2045 cargo forecast by cargo type (MAC, million tons)
Year Bagged Container Dry Bulk General Cargo
Liquid Bulk Neo-Bulk
Ro-Ro Total
2020 0.39 4.03 0.30 0.30 0.01 2.13 0.05 7.21
2025 0.43 4.35 0.31 0.32 0.01 2.21 0.05 7.69
2035 0.70 4.79 9.48 0.33 0.01 2.27 0.35 17.92
2045 0.71 5.17 9.61 0.33 0.01 2.31 0.36 18.51
Source: Consultants’ Market Survey July-October 2015, calculations by transport model
Figure 66: Kolkata GRT - 2020-2045 cargo forecast by cargo type (million tons)
Source: Consultants’ Market Survey July-October 2015, calculations by transport model
By far the major commodity would be containerized cargo, followed by construction materials
(mainly stone chips and bagged cement) discharged to cater for construction activities in the
city, and by minerals & chemicals presently loaded at Howrah Goods Yard on the western
Hooghly side opposite of Kolkata city.
Table 99: Kolkata GRT - 2020-2045 cargo forecast by commodity groups (MAC, million tons)
Year Coal Construction Materials
Consumer Goods
Container Fertilizer Food and Foodstuff
Gas and Petroleum
Minerals & Chemicals
Project Cargo
Vehicles Total
2020 0.10 1.36 0.16 4.03 0.00 0.59 0.42 0.03 0.48 0.05 7.21
2025 0.10 1.42 0.16 4.35 0.00 0.63 0.43 0.04 0.49 0.05 7.69
2035 5.18 5.76 0.17 4.79 0.00 0.64 0.45 0.10 0.50 0.35 17.92
2045 5.23 5.87 0.17 5.17 0.00 0.65 0.45 0.10 0.51 0.36 18.51
Source: Consultants’ Market Survey July-October 2015, calculations by transport model
Container shipments to the industrial Varanasi-Allahabad region and for onward trucking into
the Katmandu Valley of Nepal would constitute alarge proportion of the containerized cargo.
0.00
2.00
4.00
6.00
8.00
10.00
12.00
14.00
16.00
18.00
20.00
2020 2025 2035 2045
Bagged Container Dry Bulk General Cargo Liquid Bulk Neo-Bulk Ro-Ro
IWT Sector Development Strategy and Business Development Study for Capacity Augmentation of National Waterway 1 from Haldia to Allahabad 219
Figure 67: Kolkata GRT - 2020-2045 cargo forecast by commodity group (million tons)
Source: Consultants’ Market Survey July-October 2015, calculations by transport model
0.00
2.00
4.00
6.00
8.00
10.00
12.00
14.00
16.00
18.00
20.00
2020 2025 2035 2045
Coal Construction Materials Consumer Goods Container Fertilizer
Food and Foodstuff Gas and Petroleum Minerals & Chemicals Project Cargo Vehicles
IWT Sector Development Strategy and Business Development Study for Capacity Augmentation of National Waterway 1 from Haldia to Allahabad 220
10.4.3 Sahibganj Multi-modal Terminal
Sahibganj MMT would develop as a terminal entirely dedicated to shipping bulk cargo (stone
chips & aggregates, limited amounts of coal) upstream to the urban areas with high demand for
construction materials, i.e. Varanasi and Patna (for details see Sheet 12: “Cargo-Volume Data
Interpretation - Multi-modal Cargo Potential Sahibganj MMT” of Volume II: Transport Forecast
Model). The Consultants forecast total cargo volumes to reach almost 43.5 MMT by the year
2045, of which more than 65% would be loading operations.
Table 100: Sahibganj MMT - 2020-2045 forecast by loaded versus unloaded cargo (MAC,
million tons)
Year Load Unload Total
2020 8.08 1.85 9.92
2025 16.13 7.26 23.39
2035 27.07 7.31 34.38
2045 28.69 14.78 43.47
Source: Consultants’ Market Survey July-October 2015, calculations by transport model
Much of the demand for construction materials downstream of the Farakka Barriage (see
Chapter 10.2.5) is expected to be shipped through Pakur, Farakka and other small terminals (see
next chapter).
Figure 68: Sahibganj MMT loaded versus unloaded cargo 2020-2045 (million tons)
Source: Consultants’ Market Survey July-October 2015, calculations by transport model
Sabibganj MMT would attain a central position as bulk-cargo loading center at the middle NW-
1, with the major commodity group being construction materials (mainly stone chips &
aggregates).
8.08
16.13
27.07 28.69
1.85
7.26
7.31
14.78
0.00
5.00
10.00
15.00
20.00
25.00
30.00
35.00
40.00
45.00
50.00
2020 2025 2035 2045
Load Unload
IWT Sector Development Strategy and Business Development Study for Capacity Augmentation of National Waterway 1 from Haldia to Allahabad 221
Table 101: Sahibganj MMT - 2020-2045 cargo forecast by commodity groups (MAC, million
tons)
Year Coal Construction Materials
Consumer Goods
Food and Foodstuff
Minerals & Chemicals
Fertilizer Total
2020 1.76 7.80 0.01 0.27 0.00 0.08 9.92
2025 7.28 15.61 0.01 0.30 0.10 0.08 23.39
2035 12.34 21.51 0.01 0.31 0.08 0.12 34.38
2045 19.86 23.08 0.01 0.32 0.08 0.12 43.47
Source: Consultants’ Market Survey July-October 2015, calculations by transport model
Figure 69: Sahibganj MMT - 2020-2045 cargo forecast by cargo type (million tons)
Source: Consultants’ Market Survey July-October 2015, calculations by transport model
0.00
5.00
10.00
15.00
20.00
25.00
30.00
35.00
40.00
45.00
50.00
2020 2025 2035 2045
Coal Construction Materials Consumer Goods
Food and Foodstuff Minerals & Chemicals Fertilizer
IWT Sector Development Strategy and Business Development Study for Capacity Augmentation of National Waterway 1 from Haldia to Allahabad 222
10.4.4 Patna Terminal
Patna already holds a double-berth adjacent to the NH19 road-bridge crossing the Ganges River.
However, cargo operations had, in the past, so far not taken off. With sufficient improvements
to the LAD as planned by the GoI and anticipated in the MAC, cargo shipments would take off
after the year 2018 (for details see Sheet 13: “Cargo-Volume Data Interpretation - Multi-modal
Cargo Potential Patna MMT” of Volume II: Transport Forecast Model). Until the year 2045, cargo
volumes would increase to more than 22 MMT, of which more than 90% would be unloaded at
the terminal for onward distribution by truck and rail.
Table 102: Patna - 2020-2045 forecast by loaded versus unloaded cargo (MAC, million tons)
Year Load Unload Total
2020 0.91 6.67 7.58
2025 0.96 12.54 13.50
2035 1.03 19.86 20.89
2045 1.05 21.43 22.48
Source: Consultants’ Market Survey July-October 2015, calculations by transport model
In contrast to the major downstream multi-modal terminal at Kolkata, Patna MMT would mainly
serve as an important distribution center, where large amounts of dry-bulk, bagged, neo-bulk
and general cargo cargo would be unloaded for onward transport, much of it trucked northward
into Nepal.
Figure 70: Patna Terminal loaded versus unloaded cargo 2020-2045 (million tons)
Source: Consultants’ Market Survey July-October 2015, calculations by transport model
0.91 0.96 1.03 1.05
6.67
12.54
19.8621.43
0.00
5.00
10.00
15.00
20.00
25.00
2020 2025 2035 2045
Load Unload
IWT Sector Development Strategy and Business Development Study for Capacity Augmentation of National Waterway 1 from Haldia to Allahabad 223
Table 103: Patna Terminal - 2020-2045 cargo forecast by cargo type (MAC, million tons)
Year Bagged Dry Bulk Neo-Bulk General Cargo
Total
2020 1.15 5.18 0.96 0.30 7.58
2025 1.24 10.94 1.00 0.32 13.50
2035 2.91 16.51 1.14 0.33 20.89
2045 2.97 18.01 1.16 0.33 22.48
Source: Consultants’ Market Survey July-October 2015, calculations by transport model
Figure 71: Patna Terminal - 2020-2045 cargo forecast by cargo type (million tons)
Source: Consultants’ Market Survey July-October 2015, calculations by transport model
Most (more than 90% of total) of the unloaded cargo would consist of construction material
(stone chips and cement) to cover the demand both with the fast growing city of Patna and the
metropolitan areas of Varanasi and Allahabad.
Table 104: Patna Terminal - 2020-2045 cargo forecast by commodity groups (MAC, million tons)
Year Coal Construction Materials
Consumer Goods
Gas and Petroleum
Minerals & Chemicals
Project Cargo
Fertilizer Food and Foodstuff
Total
2020 0.05 6.50 0.07 0.26 0.02 0.21 0.00 0.49 7.58
2025 0.73 11.68 0.07 0.27 0.02 0.22 0.00 0.51 13.50
2035 0.82 18.67 0.07 0.33 0.02 0.22 0.24 0.53 20.89
2045 0.88 20.17 0.07 0.33 0.02 0.23 0.24 0.54 22.48
Source: Consultants’ Market Survey July-October 2015, calculations by transport model
0.00
5.00
10.00
15.00
20.00
25.00
2020 2025 2035 2045
Bagged Dry Bulk Neo-Bulk General Cargo
IWT Sector Development Strategy and Business Development Study for Capacity Augmentation of National Waterway 1 from Haldia to Allahabad 224
Figure 72: Patna Terminal - 2020-2045 cargo forecast by commodity group (million tons)
Source: Consultants’ Market Survey July-October 2015, calculations by transport model
0.00
5.00
10.00
15.00
20.00
25.00
2020 2025 2035 2045
Patna
Coal Construction Materials Consumer Goods Gas and Petroleum
Minerals & Chemicals Project Cargo Fertilizer Food and Foodstuff
IWT Sector Development Strategy and Business Development Study for Capacity Augmentation of National Waterway 1 from Haldia to Allahabad 225
10.4.5 Ramnagar Multi-modal Terminal
Under the present least-available depth (LAD) limitations, the Consultants expect no IWTrelated
operations to take place at the Ramnagar MMT. However, with sufficient improvements to the
LAD as planned by the GoI and anticipated in the MAC, Ramnagar MMT would be connected by
barge operations to the Sector 4 (Ballia-Varanasi) of the NW-1. As Varanasi constitutes an
important transportation hub on the Delhi–Kolkata axis – with a fibrant connection to both NH2
and the EDFC – significant consolidation and distribution operations via the NW-1 could now be
exercised within the terminal. Cargo traffic in this section of the NW-1 would shoot up to 10.32
MMT, through Ramnagar MMT, in the year 2045 (for details see Sheet 14: “Cargo-Volume Data
Interpretation - Multi-modal Cargo Potential Ramnagar MMT” of Volume II: Transport Forecast
Model).
As below Table 105 indicates, future cargo traffic volumes would be rather balanced as Varanasi
constitutes both an important production center as well as a central distribution point.
Table 105: Ramnagar MMT - 2020-2045 forecast by loaded versus unloaded cargo (MAC,
million tons)
Year Load Unload Total
2020 2.20 1.35 3.55
2025 2.35 1.47 3.82
2035 8.51 1.61 10.12
2045 8.67 1.66 10.32
Source: Consultants’ Market Survey July-October 2015, calculations by transport model
Figure 73: Ramnagar MMT loaded versus unloaded cargo 2020-2045 (million tons)
Source: Consultants’ Market Survey July-October 2015, calculations by transport model
2.20 2.35
8.51 8.67
1.35 1.47
1.61 1.66
0.00
2.00
4.00
6.00
8.00
10.00
12.00
2020 2025 2035 2045
Load Unload
IWT Sector Development Strategy and Business Development Study for Capacity Augmentation of National Waterway 1 from Haldia to Allahabad 226
These consolidation and distribution operations between trucks and railway could be exercised
as DFCCIL is expected to operate a terminal within Ramnagar MMT.
Table 106: Ramnagar MMT - 2020-2045 cargo forecast by cargo type (MAC, million tons)
Year Bagged Container Dry Bulk General Cargo
Neo-Bulk Ro-Ro Liquid Bulk
Total
2020 1.40 0.16 0.14 0.66 1.13 0.05 0.01 3.55
2025 1.50 0.17 0.15 0.69 1.23 0.05 0.01 3.82
2035 3.31 0.19 4.25 0.74 1.27 0.35 0.01 10.12
2045 3.37 0.21 4.34 0.75 1.29 0.36 0.01 10.32
Source: Consultants’ Market Survey July-October 2015, calculations by transport model
With sufficient LAD improvements upstream of Varanasi, the Consultants would expect vehicles
from the Delhi area to be loaded onto barges for downstream shipment at Allahabad.
Figure 74: Ramnagar MMT - 2020-2045 cargo forecast by cargo type (million tons)
IWT Sector Development Strategy and Business Development Study for Capacity Augmentation of National Waterway 1 from Haldia to Allahabad 227
Source: Consultants’ Market Survey July-October 2015, calculations by transport model
0.00
2.00
4.00
6.00
8.00
10.00
12.00
2020 2025 2035 2045
Bagged Container Dry Bulk General Cargo Neo-Bulk Ro-Ro Liquid Bulk
IWT Sector Development Strategy and Business Development Study for Capacity Augmentation of National Waterway 1 from Haldia to Allahabad 228
Table 107: Ramnagar MMT - 2020-2045 cargo forecast by commodity groups (MAC, million
tons)
Year Coal Construction Materials
Consumer Goods
Container Fertilizer Food and Foodstuff
Minerals & Chemicals
Project Cargo
Vehicles Gas and Petroleum
Total
2020 0.11 1.64 0.33 0.16 0.00 0.98 0.03 0.24 0.05 0.01 3.55
2025 0.11 1.75 0.40 0.17 0.00 1.04 0.04 0.24 0.05 0.01 3.82
2035 0.19 7.50 0.41 0.19 0.04 1.09 0.09 0.25 0.35 0.01 10.12
2045 0.19 7.65 0.42 0.21 0.04 1.10 0.09 0.25 0.36 0.01 10.32
Source: Consultants’ Market Survey July-October 2015, calculations by transport model
Figure 75: Ramnagar MMT - 2020-2045 cargo forecast by commodity group (million tons)
Source: Consultants’ Market Survey July-October 2015, calculations by transport model
10.4.6 Ghazipur Multi-modal Terminal
The preferred location for a potential multi-modal terminal at Ghazipur is on the southern side of
the Ganges River, thus opposite the city, as shown by the below imagery.
0.00
2.00
4.00
6.00
8.00
10.00
12.00
2020 2025 2035 2045
Coal Construction Materials Consumer Goods Container
Fertilizer Food and Foodstuff Minerals & Chemicals Project Cargo
Vehicles Gas and Petroleum
IWT Sector Development Strategy and Business Development Study for Capacity Augmentation of National Waterway 1 from Haldia to Allahabad 229
Figure 76: Preferred location for potential multi-modal terminal at Ghazipur, U.P.
Source: Google Earth; information from PMU/IWAI
However, this location would necessitate a pre- or onward carriage by truck via the NH97
river bridge, an estimated road distance of 7 km.
Figure 77: Possible location for a multi-modal terminal in Ghazipur, U.P.
Source: Google Earth; Consultants’ investigation
IWT Sector Development Strategy and Business Development Study for Capacity Augmentation of National Waterway 1 from Haldia to Allahabad 230
A calculation of potential O/D pairs through the Consultants’ Transport Model had identified a
potential of 85.000 metric tons cargo for a multi-modal terminal (MMT) at Ghazipur. This is
exemplified in Annex 8.
The Transport Model calculated only one O/D pair of cargo that could potentially be shipped
via the NW-1. This O/D pair represents imported thermal coal to be used by the Buxar thermal
power plant. However, as Government policy foresees coal imports to be phased out, the
Consultants agreed with IWAI to reduce coal volumes by 4% per year the entire forecast period.
Local Cargo
The cargo volumes as included into the transport model are the ones that had been identified
during the Consultants’ market survey of August-October 2015. The map in Figure 77 overleaf
depicts the location of interviews held by their market surveyors. Although these market surveyors
had spent significant efforts in particularly screening the region close to the NW-1, they had not
identified any significant potential cargo at, or in the vicinity of, Ghazipur. Therefore, the surveyors
could not hold any interviews with stakeholders in or around Ghazipur. Consequently, the
Consultants cannot see a demand for a MMT to operate local products.
IWT Sector Development Strategy and Business Development Study for Capacity Augmentation of National Waterway 1 from Haldia to Allahabad 231
Figure 78: Location of one or more interviews with producing units in the Allahabad-Munger sector (red dots)
Source: Consultants’ market survey August-October 2016
IWT Sector Development Strategy and Business Development Study for Capacity Augmentation of National Waterway 1 from Haldia to Allahabad 232
Regional Cargo
As to regional cargo, the overleaf table depicts the number of daily truck movements into and
out of the city of Ghazipur. Two of the origins/destinations (Mau, Azamgarh) are located far
away from the NW-1. The other origins/destinations (Varanasi, Buxar, Zamania) are located on
the NW-1. However, the preferred location for a potential multi-modal terminal at Ghazipur is
on the southern side of the Ganges River, thus opposite the city.
This location would necessitate a pre- or onward carriage by truck via the NH97 river bridge,
an estimated road distance of 7 km. The Consultants estimated the road distance from
Ramnagar MMT to Varanasi at 10 km, from Gola Ghat to Buxar as 0 km, and from Zamania to
any possible future terminal site (still to be acquired) within the city also as 0 km.
In case of dry-bulk cargo (sand, stone chips and soil representing just over 15% of total truck
loads) between Ghazipur and Varanasi, the Consultants’ transport model calculated the
threshold to make shipping by barge profitable at a trucking price well over Rs 5 / ton-km, a
freight rate their market surveyors have been rarely told of across the entire survey area. The
same holds true for the origins/destinations of Buxar and Zamania, where a trucking price of
close to Rs 5 / ton-km would constitute the threshold. Other cargo types (bagged, neo-bulk,
general cargo) could not compete at all against door-to-door trucking, as terminal handling
costs would be higher compared to dry-bulk cargo movements. Assuming such high trucking
prices were charged (and the truckers would not react through price dumping), shortdistance
shipping of dry-bulk cargoes (sand, stone chips and soil) could be financially feasible.
There exists a possibility of additional 130 cargo trucks/day carrying clothes, food grain and
cement from Varanasi/ Mirzapur through Ghazipur, and onwards from Ghazipur to Nepal (at
the time of survey no cargo movement was recorded due to unrest at the Nepal border). Out
of this number, about 40-45 trucks could move on the NW-1 from Varanasi via Ghazipur to
Nepal. Moreover, there is a local movement of about 10 trucks/day of vegetables and
agriculture produce from Ghazipur to Varanasi. Finally, there is also potential of about 40,000
tons/annum of jute products from Kolkata for Ghazipur.53
The calculated total cargo, under the assumptions as noted below the overleaf table, would
then amount to just below 2 MMT per year.
53 Information from PMU/IWAI provided 19 February 2016
IWT Sector Development Strategy and Business Development Study for Capacity Augmentation of National Waterway 1 from Haldia to Allahabad 233
Table 108: Detail of Trucks/Cargo at Ghazipur Route (number of trucks per 24-hour day)
Notes: *Other-Vegetable, Fruit, Coal, Bricks, wood, Furniture etc Load per full truck (tons): 16 Operating days per year: 300 Source: PMU / IWAI, 13 February and 19 February 2016
IWT Sector Development Strategy and Business Development Study for Capacity Augmentation of National Waterway 1 from Haldia to Allahabad 234
Transit Cargo
As to transit cargo, the Consultants rechecked their data as depicted in Annex 9. As can be
seen in the orange-coded columns there, in no case would a deviation through a multi-modal
terminal at Ghazipur be more cost-effective than through the terminals calculated by their
transport model. O/D pairs crossing the NW-1 west of Ghazipur could be deviated more cost-
effectively through an MMT at Ramnagar. For instance, wheat trucked from Jaunpur to
Manihari and shifted onto the NW-1 at Ramnagar MMT would incur a total cost of 1502.8
Rs/ton (30.7% cheaper than pure trucking) as against 1592.5 Rs/ton if shifted at Ghazipur
(26.6% cheaper than pure trucking). Similarly, O/D pairs crossing the NW-1 east of Ghazipur
could be deviated more cost-effectively through an MMT at Ballia. For instance, rice trucked
from Naugarh to Kolkata and shifted onto the NW-1 at Ballia would incur a total cost of 2840.1
Rs/ton (15.9% cheaper than pure trucking) as against 2887.9 Rs/ton if shifted at Ghazipur
(14.5% cheaper than pure trucking). The Consultants would like to highlight that although
their survey identified all potential cargo, their transport model considers only those cargo
streams which are adjacent to the Ganges River and could be shifted onto the NW-1. Any
other cargo which crosses Ghazipur perpendicular to the NW-1 can of course not be
considered as potential cargo for this waterway.
Container traffic bound for Birgunj (Nepal) would be channeled more cost-effectively through
an MMT at Patna, as also identified by the IFC expert. The reason is that the road distance
from Patna to Birgunj (Nepal) is shorter than the distance between Ghazipur and Birgunj
(Nepal). Additionally, the IWT distance from Kolkata to any multi-modal terminal (including
Ghazipur) located upstream of Patna is larger and transport time therefore longer in
comparison to Patna.
Summarizing the Consultants’ investigation of three (local, regional and transit) cargo data
bases and after thorough analysis, they come to the conclusion that predominantly short-
distance shipping could provide a possible demand for a multi-modal Terminal at Ghazipur.
Under very optimistic assumptions as laid down on the previous pages 3 and 4, total cargo
would amount to about 3 MMT in the year 2020.
Table 109: Ghazipur Terminal - 2020-2045 forecast by loaded versus unloaded cargo (MAC, million
tons)
Year Load Unload Total
2020 0.96 2.38 3.35
2025 0.99 5.15 6.14
2035 1.01 5.58 6.59
2045 1.02 5.69 6.72
Source: Consultants’ Market Survey July-October 2015, calculations by transport model
IWT Sector Development Strategy and Business Development Study for Capacity Augmentation of National Waterway 1 from Haldia to Allahabad 235
Figure 79: GhazipurMMT loaded versus unloaded cargo 2020-2045 (million tons)
Source: Consultants’ Market Survey July-October 2015, calculations by transport model
Table 110: Ghazipur Terminal - 2020-2045 cargo forecast by cargo type (MAC, million tons)
Year Dry Bulk
Bagged General Cargo
Total
2020 2.33 0.03 0.98 3.35
2025 5.10 0.03 1.01 6.14
2035 5.53 0.04 1.03 6.59
2045 5.64 0.04 1.04 6.72 Source: Consultants’ Market Survey July-October 2015, calculations by transport model
Figure 80: Ghazipur MMT - 2020-2045 cargo forecast by cargo type (million tons)
Source: Consultants’ Market Survey July-October 2015, calculations by transport model
0.96 0.99 1.01 1.02
2.38
5.155.58 5.69
0.00
1.00
2.00
3.00
4.00
5.00
2020 2025 2035 2045
Unload
Load
0.00
2.00
4.00
6.00
8.00
2020 2025 2035 2045
Dry Bulk Bagged General Cargo
IWT Sector Development Strategy and Business Development Study for Capacity Augmentation of National Waterway 1 from Haldia to Allahabad 236
10.4.7 Kalughat Multi-modal Terminal
Kalughat, near Sitabganj about 20 km upstream of Patna gaighat, constitutes a second
location which the GoI has earmarked for future medium-sized MMTs (see below Figure 81).
A Kalughat MMT would be an ideal location for transferring containers, shipped on the NW-1
from Kolkata GRT, for onward trucking into the Katmandu Valley of Nepal. Also, no bridge
needs to be crossed by truck traffic, as this area lies north of the Ganges River.
Figure 81: Regional location of Kalughat Multi-modal Terminal
Source: Google Earth; information by Howe India, 19 April 2016
Below map gives a closer view to the location of a future Kalughat MMT.
IWT Sector Development Strategy and Business Development Study for Capacity Augmentation of National Waterway 1 from Haldia to Allahabad 237
Figure 82: Possible location for an alternative multi-modal terminal at Kalughat
Source: Information by Howe India, 19 April 2016
Overleaf Table 109 indicates that traffic through a future Kalughat MMT would be
concentrated on dry-bulk and containerized cargo (see Annex 10 for detailed figures).
Figure 83: Kalughat Terminal loaded versus unloaded cargo 2020-2045 (million tons)
Source: Consultants’ Market Survey July-October 2015, calculations by transport model
Possible
Kalughat
MMT site
0.18 0.18 0.20 0.20
4.03 4.354.79 5.17
0.00
1.00
2.00
3.00
4.00
5.00
6.00
2020 2025 2035 2045
Kalughat
Unload
Load
IWT Sector Development Strategy and Business Development Study for Capacity Augmentation of National Waterway 1 from Haldia to Allahabad 238
Table 111: Kalughat Terminal cargo forecast, 2020-2045 (MAC, tons)
Year Bagged General Cargo
Container Total
2020 0.11 0.06 4.03 4.21
2025 0.12 0.07 4.35 4.54
2035 0.12 0.08 4.79 4.99
2045 0.12 0.08 5.17 5.38 Source: Consultants’ Market Survey July-October 2015, calculations by transport model
Total cargo traffic in the year 2045 would amount to 5.38 MMT, of which more than 90%
would constitute containerized cargo.
Figure 84: Kalughat Terminal - 2020-2045 cargo forecast by cargo type (million tons)
Source: Consultants’ Market Survey July-October 2015, calculations by transport model
10.4.8 Tribeni transshipment terminal
Tribeni is located 53 km upstream of Kolkata respectively 158 km upstream of Haldia MMT.
Tribeni constitutes one of three locations which the GoI has earmarked for a medium-sized
transhipment terminal. The Consultants visualize the location depicted below as a possible
site for transhipment operations.
0.00
1.00
2.00
3.00
4.00
5.00
6.00
2020 2025 2035 2045
Bagged General Cargo Container
IWT Sector Development Strategy and Business Development Study for Capacity Augmentation of National Waterway 1 from Haldia to Allahabad 239
Figure 85: Possible location for a transhipment terminal in Tribeni, W.B.
Source: Google Earth; Consultants’ investigation
IWAI intends to tranship cargo between large ships (approximately 5,000 tons) and small
vessels (2,000 tons). IWAI estimates that economis-of-scale will warrant additional costs of
transhipment.
Overleaf Table 110 indicates thecargo amounts which could be transhipped at Tribeni (see
Annex 11 for detailed figures). Basis of the calculation is the idea that during the monsoon
season (approximately three months) the river has sufficient water depth 5,000-ton ships.
The Consultants therefore calculated one-fourth (25%) of the cargo volumes forecast to be
shipped past Tribeni (see Volume II: Final Transport Forecast Model for detailed figures).
Table 112: Tribeni transshipped cargo volume forecast, 2020-2045 (MAC, tons)
Cargo Type 2020 2025 2035 2045
Dry Bulk Liquid Bulk Bagged
1,523,469 2,050,099 3,169,547 3,580,848
0 0 4,187 4,840
28,514 105,514 178,589 199,428
Neo-Bulk General Cargo Container Ro-Ro
140,805 472,714 694,733 860,265
0 3,751 4,487 4,727
215,186 319,900 1,776,738 2,315,551
0 0 21,042 28,052
Total 1,907,974 2,951,977 5,849,324 6,993,712 Source: Consultants’ Market Survey July-October 2015, calculations by transport model
Of the cargo types depicted in the above table, IWAI envisages mainly bulk cargo to be
transhipped at Tribeni (particularly coal and stone chips).
10.5 Demand distribution between various transport corridors and modes For each planning horizon the distribution of future demand will be forecasted. Certain
transport routes (O/D routes) as well as the transport modes in general will be considered.
Possible
Tribeni
terminal site
IWT Sector Development Strategy and Business Development Study for Capacity Augmentation of National Waterway 1 from Haldia to Allahabad 240
The development of the transport modes is depending on several aspects like monetary and
non-monetary as well as logistical and non-logistical. The relevance of the different aspect is
expected to change during the years. The considered aspects are named below and their
expected development and individual consideration in the distribution forecast are described
as follows:
Monetary costs: It is expected that fuel and staff costs will continue to increase. Thus, saving
of fuel as well as an as efficient as possible utilization of staff will be important for provision
of viable transport services in the future.
Non-monetary costs: Non-monetary costs represent other sources of sacrifice or efforts than
the above mentioned monetary costs. Besides the direct expenditure there are also other
events or conditions generating additional efforts which influence the decision of choosing
one transport or another. These are for example in general so called time costs and
psychological costs. In detail these could be described by the terms like time saving,
established procedures, safety as well as creation of an environmental friendly image. Finally
all these aspects generate costs but they are “not visible” or expressed by a rate.
If the time saving aspect matters when choosing a transport mode it is important for the
decision maker to transport the cargo very fast to its destination or to avoid delays by
diminishing the risk of getting into traffic jams or other delays causing events. Psychological
costs are generated e.g. by the fact that the decision maker prefers to stay with the already
established procedures or transport mode respectively. Established procedures are
ostensible reliable as they are known to the decision maker. Additionally it is quite
convenient to stay with an established system (although it might cost more). According to
statistics the different transport mode are more or less prone to accidents. The
environmental issues like consideration of emissions or creation of an eco-friendly image by
efforts to generate a comparative low carbon footprint per transport or similar are also non-
monetary costs.
In the future e.g. the principles “National Mission for Clean Ganga” will become more and
more important for the transport and logistics industry. It is on its way as a registered society
originally formed by Ministry of Environment, Forests and Climate Change (MoEFCC) since on
12th August 2011. The aims and objectives of NMCG are to ensure effective abatement of
pollution, water quality and environmentally sustainable development. It is expected that
environmental efforts as well as economical efforts will be executed in a balanced way. By
this it could be quite likely that for example new vessel engine technologies like the use of
LNG powered engines will step more and more into the focus. These engines do generate
lesser emissions than the conventional diesel powered engines.
Additionally it is expected that the establishment of “green ports” will continue. In 2015/16
for example Haldia will be declared as the first "green port" in the country for using bio-
diesel in its operations. Probably this will also have an effect on the design of logistics chains
as the use of certified or awarded port location will also be taken into account.
Logistical aspects: These aspects determine the choice of a transport mode considering
logistics issues like availability of infra- and superstructure. If a warehouse is needed, than it
IWT Sector Development Strategy and Business Development Study for Capacity Augmentation of National Waterway 1 from Haldia to Allahabad 241
is important that a suitable facility is provided. Probably it is also important to have a good
rail connection to use the advantages of this transport mode for further on transport. If
certain loading, discharging or handling equipment are necessary their availability will
influence the decision for or the structure of the supply chain. The ability of navigation aid is
also something that will have an impact on the choice of transport. It is expected that all
these technical issues will improve steady over the years and will become more and more
supportive for the inland waterway.
Non-logistical aspects mainly cover cargo-related issues like certain storage temperature,
continuous cooling chain, perishability, heating or similar. The more the cargo cannot be
handled in a suitable standardized way the more influence these aspects have on the design
and/or choice of the transport route.
Besides that also the political focus and direction is important. As the current PM has
described his will to support and push the strengthening of IWT there are also efforts to
comply with the “Vision 2020” which defines the aims how the railway sector should develop
within the next Years. This paper has been published in June 2009. Some of the mayor
targets related to cargo traffic are:
• Freight services would be transformed by segregation of freight and passenger corridors,
construction of dedicated freight corridors, improving the speed of transit, cost-
efficiencies in bulk transport and meeting the needs of customers in terms of service
delivery, logistics services, transit time and tariff.
• Railways will aim at capturing 50% of the freight moving over 300 km distance and more
than 70% of the bulk cargo moving in large volumes in the same distance range.
Currently the Ministry of Railways is working on a paper called “Vision 2030”.
IWT Sector Development Strategy and Business Development Study for Capacity Augmentation of National Waterway 1 from Haldia to Allahabad 242
11 Socio Economic and Environment Benefits
11.1 Absolute and comparative benefits to environment due to the modal shift and
transportation of cargo using IWT sector
General considerations
Inland Waterway Transport (IWT) offers a comparatively low cost and environmentally sound
alternative to road and rail transportation especially for bulk and containerized cargo.
Infrastructure requirements of IWT in comparison to road and rail transport are also relatively
low, although some investments in port facilities, connecting road/rail infrastructure and the
establishment and maintenance of waterways’ minimum draft and for aids to navigation have
to be made. Compared to other modes of transport which are often confronted with
congestion and capacity problems, inland waterway transport is characterized by its reliability,
its low environmental impact and its major capacity for increased exploitation.
It is therefore obvious that IWT can play a very important role when high quality ports and
waterway connections are available in combination with high transport demand and industrial
activities. In addition to a good waterway infrastructure, also connecting transport networks
have to be established and have to work efficiently to make IWT attractive – road and/or rail
connections should be available at a place of discharge/loading in order to transport the cargo
to or from the producer or consumer of the transported cargoes as most of the production
sites are not located directly at the river but some distance away.
Generally, Inland Waterways Transport is considered to be one of the environmentally
friendliest ways of transportation.
At present, no information on the environmental performance of the inland waterway
transport system in India or on the exact environmental figures of road and rail transport is
available to compare the environmental performance of the different modes. Consequently,
data and figures related to the sectors in the US and Europe are taken to illustrate the
environmental impacts of IWT in general. Although the inland waterways sector of India differs
from the situation in other countries, the overall environmental impact of the different modes
of transport can be compared, based on the international data from Europe and the US.
Within this study, only the benefits and impacts to be expected due to modal shift and
increased use of IWT are considered. The environmental impacts related to dredging,
bandalling and construction are evaluated in a separate study executed by a different team of
consultants.
In the following, different parameters influencing the environmental impacts of IWT are
considered.
IWT Sector Development Strategy and Business Development Study for Capacity Augmentation of National Waterway 1 from Haldia to Allahabad 243
Emissions
Environmental impact
Carbon Dioxide CO2 Global warming
Particulate Matter PM Human toxicity, summer smog, carcinogenic
Nitrogen oxides (NOX) Human toxicity, Acidification eutrophication, eco-toxicity, summer smog
Sulfur oxides (SOX) Human toxicity, Acidification, eco-toxicity
Waste – influencing the water quality
• Oily and greasy waste resulting from vessel operation (depending on the type of fuel used)
• Cargo related waste
• Sewage water, garbage, cleansing slurry and slops
Energy efficiency and related CO2 production54
The energy efficiency of inland waterways transport in comparison to other modes of
transport, especially road transport, is generally much higher, as is indicated in many studies
world-wide. To cite just a few of these studies, please find below examples for energy efficiency
of the different modes of transport from the USA as well as from Europe.
Figure 86: Comparison of cargo capacity of different modes of transport
Source: Tennessee-Tombigbee Waterway, http://business.tenntom.org/why-use-the-waterway/shipping-comparisons/
54 A very thorough and detailed analysis is done in the study on Long and medium term perspectives of IWT in the European
Union, executed by the consortium of CE Delft, Planco, MDS Transmodal, viadonau and NEA for the European Commission Directorate-General MOVE published December 2011
IWT Sector Development Strategy and Business Development Study for Capacity Augmentation of National Waterway 1 from Haldia to Allahabad 244
However, these generalized figures should not be taken without considering the individual
circumstances of each case. Sound calculations of energy consumption by different transport
modes and their comparison must consider the specific conditions of transport. This includes:
technical characteristics of vehicles, load factors of these vehicles, infrastructure
characteristics and specific traffic conditions.
As an example, for road freight transport the traffic flow is decisive. According to complex
model calculations, the average fuel consumption of trucks and truck-trailer combinations on
German highways in 2005 was as follows55:
• Unrestricted traffic flow: 29.2 liters per 100 km;
• Medium level of traffic disturbances: 30.8 liters per 100 km;
• Significant traffic disturbances: 31.8 liters per 100 km;
• Stop and Go: 61.9 liters per 100 km.
This example illustrates, that, in order to come to an unambiguous picture of actual
environmental impacts, all figures related to transport and fuel consumptions must be
considered for each individual logistics chain, respectively route.
Energy consumption related to rail freight transport also must consider specific transport
conditions. Such specific conditions include: technical specifications of locomotives, number of
wagons per train, train length, train gross weight, ratio of net to gross train weight, and train
speed. Furthermore, specific conditions of selected routes (e.g. topography) and number of
stops can be considered in order to come to a realistic picture.
The same applies to calculations related to inland waterways transport. Here, the load factor,
the engine / propulsion / fuel used, the construction and the type of vessel, the current as well
as the pre-haulage plus end-haulage to and from the transshipment sites, to name just a few
factors, must be considered.
In general terms the below figure illustrates the energy efficiency of the different modes of
transport and lead to a very positive picture of IWT when compared to road and rail.
Figure 87: Energy efficiency of different modes of transport
Source: Tennessee-Tombigbee Waterway, http://business.tenntom.org/why-use-the-waterway/shipping-comparisons/
55 Economical and Ecological Comparison of Transport Modes Road, Railways, Inland Waterways PLANCO 2007
at:http://www.bafg.de/DE/08_Ref/U1/03_Projekte/05_Verkehrstraeger/verkehrstraeger_kurz_engl.pdf?__blob=publicationFile (21.09.2015)
IWT Sector Development Strategy and Business Development Study for Capacity Augmentation of National Waterway 1 from Haldia to Allahabad 245
Figure 88: Comparison of distances transported for one ton of freight given the same energy
input
Source: German Federal Waterways and Shipping Administration, http://www.efficiency-from-
germany.info/ENEFF/Navigation/EN/Energyefficiency/Transport/InlandWaterways/inland-waterways.html
Other emissions
Not only CO2 emissions have to be considered when evaluating the environmental impacts of
the different modes of transport, but other gases like hydrocarbons, carbon monoxide and
NOX must be taken into account. Some studies show that even the emissions of these other
gases are favorable if compared to road transport. One example is given in the figure below.
Figure 89: Comparison of emissions per ton-mile
Source: Tennessee-Tombigbee Waterway, http://business.tenntom.org/why-use-the-
waterway/shipping-comparisons/
The above figure show that the emissions of hydrocarbons, carbon monoxide as well as nitrous
oxide emitted per ton-mile are much lower in IWT, especially compared to road transport, thus
indicating that a shift to inland waterways transport from road or rail would have positive
environmental impacts indeed.
However, inland navigation vessels need to fulfill some prerequisites in order to reach the
highest environmental standards and thus be the environmentally friendliest mode of
transport. Below, some of these prerequisites are listed.
• The use of low or no polluting energies (low sulfur or sulfur-free diesel, LNG, electricity,
etc.):
• Installation of state-of-the-art engine and propulsion arrangements;
• Selective Catalytic Reduction (SCR) (to reduce nitrogen oxides NOx and Particulate Matter
emissions)
• Installation of Particulate Matter filter
• Speed regulator giving advice on fuel economic operating speed
IWT Sector Development Strategy and Business Development Study for Capacity Augmentation of National Waterway 1 from Haldia to Allahabad 246
There are undoubtedly positive impacts to be expected from shift to inland waterways
transport from road transport as far as the reduction of CO2 is concerned, because IWT has
relatively low energy consumption in relation to tons/volumes of cargo transported and thus
a low carbon footprint. Noise and environmental impacts from infrastructure are also rather
low. Also, IWT decreases the burden on the transport network – if more goods are transported
by waterway, there is less traffic on the roads leading to better transport flow for the remaining
traffic and less deterioration of road infrastructure and finally to less CO2 production resulting
from road transport. Further, the railway system can be released from part of the burden,
freeing capacities for passengers and for cargoes not fit to be transported by water.
However, looking at the pollution resulting from other pollutants like particulate matters, NOX
and SOX, the situation is not so unambiguous. Air pollutants, including NOX and sulfur dioxide
(SO2) as well as particulate matter, are directly emitted into the air due to fuel combustion.
Here, the impacts of transport heavily depend on the quality of fuel and the state of the art of
the engines / propulsion of the inland waterways vessels used.
A recent study comparing the impact of transport using diesel as fuel comes to the following
conclusion regarding the environmental impacts of goods transported by truck, rail and inland
waterways – all using diesel engines - from Vienna, Austria to Budapest, Hungary. The graph
below clearly shows that road transport uses more fuel to transport the same amount of
goods; however, despite the bigger fuel consumption the emission of particulate matters is by
far higher in inland waterways transportation. This figures shows that the transport mode with
the lowest energy consumption is the railway. Here it has to be taken into account, that in
many parts of Europe, the railways is running electrically and not on fossil fuel, which leads to
lower greenhouse gas emissions. (It should be noted that most IWT craft – and also their
engines - in that area are in the age bracket of 40 to 50 years).
Figure 90: Comparison analysis between road, rail and IWT emissions
Source: United Nations Economic Commission for Europe: Diesel Engine Exhausts – Myths and Reality, p. 27f
IWT Sector Development Strategy and Business Development Study for Capacity Augmentation of National Waterway 1 from Haldia to Allahabad 247
This comparison shows that although there is a high potential for environmentally friendly
inland waterways transport, IWT must invest in advanced technology to stay ahead of the
competing transport modes.
The Central Commission for the Navigation of the Rhine also states in an inspection report: “…
However, the other carriers that compete with inland navigation are making advances in
reducing their greenhouse gas emissions. If inland navigation wants to retain its competitive
advantage as being “environmentally friendly”, it also needs to further reduce its greenhouse
gas emissions.”56
Waste
As many of the fears expressed by stakeholders (fishermen, inhabitants of adjacent
communities) related to new terminal construction and increase of inland waterway transport
concerned potentially increased water pollution of the rivers, water polluting waste is also
briefly addressed within this study.
Following the classification of the Central Commission for the River Rhine in Europe, the
waste is divided into three categories, as mentioned above:
• Oily and greasy waste resulting from vessel operation
• Cargo related waste
• Sewage water, garbage, cleansing slurry and slops
Rivers are invaluable and unique ecosystems with unique aquatic life – in the case of the river
Ganges dolphins and turtles are especially valuable species in certain areas, next to different
fish – and they also provide livelihood for fishermen and serve as freshwater supply for
neighboring communities as well as for religious purposes. Therefore, water pollution from
any source should be prevented. The only way to ensure that pollution is prevented and waste
collected in dedicated facilities and brought to proper treatment, is to set up environmental
rules and regulations for the IWT sector and, of course, take care of enforcement of these
regulations.
In Europe, inland waterway transport plays an important role, especially on the Rhine and
Danube and their connecting canal systems. At the same time, environmental consciousness
is well developed in the European societies. In order to prevent water pollution, international
agreements for pollution prevention and treatment of waste, respectively avoiding waste,
have been elaborated and implemented. One example how to prevent pollution and deal with
waste is the International Convention on the Collection, Deposit and Reception of Waste
generated during Navigation on the Rhine and other Inland Waterways, elaborated in 1996
and in force since November 2009. The rules stipulated in the Convention aim at57
• encouraging the prevention of waste generation,
• facilitating the disposal to the dedicated waste reception facilities along the waterway
network,
56 Possibilities for reducing fuel consumption and greenhouse gas emissions from inland navigation - Summary of the report
by the Inspection Regulations Committee for the 2012 Autumn Meeting (Annex 2 to protocol 2012-II-4 of the Central Commission for the Navigation of the Rhine, 29 November 2012), p.3. 57 57 http://www.cdni-iwt.org/en/presentation-of-cdni/ (accessed 22 Sep 2015)
IWT Sector Development Strategy and Business Development Study for Capacity Augmentation of National Waterway 1 from Haldia to Allahabad 248
• ensuring adequate funding in view of the “polluter-pays principle”, and
• facilitating compliance with the prohibitions of discharge of the waste into surface water.
Part A of this convention deals with wastes arising from operating the vessel. Wastes occurring
in the engine room are specifically addressed: i.e. used oil, bilge water, used grease, used
cloths, used filters and similar wastes. To dispose of these wastes, a network of special waste
reception vessels is installed all over the European inland waterways to ensure easy access for
the inland waterways barges and vessels. This network consists mostly of oil separator vessels
that dock on to vessels during passage. As these wastes occur in any type of vessel, the costs
for installing and maintaining these facilities are shared by all vessels via a special “disposal
fee” which has to be paid by all vessels. The amount is calculated for all types of vessel on the
same basis – based on the amount of diesel bunkered. For each 1000 liters of diesel, a disposal
fee of 7.50 Euro is due. The amount is the same for any type of vessel and entitles the vessels
to dispose of their waste free of charge.
Part B deals with handling cargo residue and waste that are due to the shipment of cargoes.
The main aim is to minimize cargo residues that have to be collected and treated as waste by
optimizing the discharge procedures of the vessels. The regulations prescribe certain standards
for discharge, depending on the characteristics of the individual cargo. The correct execution
of the discharge procedures has to be confirmed by the recipient of the cargo by issuing a
special document to the ship. In this document it also has to be stated, where cargo residues
are brought to in case they do not remain at the cargo recipient.
Part C takes care of “household waste” – sewage water, garbage, sludge and slop. In this
respect, special attention has to be paid to ferry and passenger vessels as they can
accommodate a huge number of persons, leading to high volumes of this type of waste, which
must not be thrown or pumped into the water. Cargo vessels can usually dispose of their
garbage in waste collection installations installed directly at the landing facilities. Ferry and
cruise vessels have to collect the garbage on board and hand it over to commercial garbage
treatment companies which have to be paid. Sewage water and slop must be either collected
on board, and handed over to special facilities at shore, or have to be treated on board. The
cleared water can then be released into the rivers, but the residue sludge must be kept on
board and handed over to special reception facilities.
The procedures as well as the fees to cover the costs for implementation are regulated in the
convention. To ensure that a similar system can be implemented in India, first of all the political
will of the states has to be there and then a joint system to enforce these rules has to be in
place. But international examples like the one briefly introduced above show that it is possible
to ensure that the water quality will not be compromised by inland waterway transport58.
58 More ideas on how to deal with ship generated waste and waste water can also be found e.g. in the EU-financed CO-
WANDA Project dealing with the Danube river (COnvention for WAste management for inland Navigation on the Danube), web-site: https://co-wandaproject.eu/home.html
IWT Sector Development Strategy and Business Development Study for Capacity Augmentation of National Waterway 1 from Haldia to Allahabad 249
Conclusions
All in all it can be stated that IWT is an environmentally friendly mode of transport and that a
shift especially from road transport to inland waterway transport will generate environmental,
but also social benefits. Numerous studies of fuel efficiency have been conducted and
practically every one of these studies shows similar results; that is that inland waterway
transport is the most fuel efficient mode of transportation for moving bulk raw materials and
bulky goods (like heavy lifts, over-dimensioned units, project cargo, etc.); it is the least energy
intensive method of freight transportation when moving equivalent amounts of cargo, and it
consumes less energy than alternative modes per ton-kilometer. These factors, combined with
the remoteness of the vessels’ operating environment from population centers, substantially
reduce the impact of its exhaust emissions, especially in comparison with road transport.
For inland waterways transport as well as for rail transport, the volume of cargo transported,
but also the type of engine or propulsion used determine the specific emissions and thus the
environmental impacts for a trip. The more cargo is transported by one vessel per one trip, the
higher the environmental benefits. Next to these factors, the pre and end-haulage have to be
considered in order to come to a realistic picture of emissions produced by the entire transport
of a certain cargo. However, it can be clearly stated, that only in extraordinary cases the
emissions of IWT (or railway) are higher than those of road transport. This might only happen
in case of a very low load factor, e.g. in the low water periods when the vessels cannot be fully
loaded.
In order to ensure highest environmental benefits of inland waterways transport, strict
emission regulations for IWT should be elaborated and implemented. Next to reducing fuel
consumption, these might include among others the allowed levels of emissions for Particulate
Matter as well as for nitrogen oxides (NOX) and SOX, requiring for example the use of low
sulfur or sulfur-free diesel.
Low sulfur or sulfur-free fuel will in itself reduce emissions considerably (SOX by 98% and PM
by 17%), but is also a prerequisite for application of various other emission reduction
techniques achieved after treatment of the emissions, like SCR catalysts, soot filters etc. By
using these techniques 80% to 90% of the remaining NOX and PM in the exhaust gasses can be
reduced59. New engines can easily cope with low sulfur fuel or sulfur-free fuel (modern diesel
engines in cars operate on sulfur-free diesel), but given the fact that marine diesel engines
have a long life span of approximately 20 years, old engines are still in place. In case of these
old engines fuel additives or fuel type adapted lubricants will have to be used in order to enable
them to run with low sulfur diesel.
If no stringent regulations are applied, the environmental gap between road transport and IWT
will rapidly become smaller in India, like already nowadays in Europe. In Europe, a major
concern thereby is the poor progress made on the emission of air pollutants, in particular with
the emission of NOX and Particulate Matter. In contrast to the road haulage sector the
emission standards for new engines in IWT are much less stringent and the average lifetime of
engines in inland vessels is very long; therefore, the implementation of large-scale innovations
59 European Barge Union: EBU-Statement on Inland Navigation and Environmental Sustainability in the Danube River Basin, 25 June 2007
IWT Sector Development Strategy and Business Development Study for Capacity Augmentation of National Waterway 1 from Haldia to Allahabad 250
takes comparatively long time. Consequently, inland waterway transport already has higher
air pollutant emission levels than road transport per ton-kilometer for certain vessel types.60
In order to ensure that IWT will remain the environmentally friendliest way of transport, a
combination of lower emission limits, low sulfur or sulfur-free diesel fuel and financial
incentives for implementation of emission reduction techniques will have to be implemented
to achieve a major improvement in emission reductions from inland navigation.
Another way to reduce emissions is of course the use of fuel saving technologies, by using new
propulsion system technologies, modern construction material and resistance-reducing
scantlings for vessels. Lower fuel consumption not only leads to lower emissions but also
reduces operating costs and is therefore generally attractive for ship owners. Also in this area,
the implementation of state incentives like tax reduction for ships constructed with special
material and innovative, fuel saving shape as well as state of the art propulsion engines will
assist to achieve good environmental standards in IWT and ensure that not only the executions
of a future increase of mass bulk transport but also a future modal shift to inland waterway
transport will bring high environmental benefits.
As in India the IWT sector is still under development and working on a very low level of
transport activities there is a big chance for India to start the development of the sector with
the use of state-of-the-art vessels which take environmental and fuel efficiency concerns into
consideration in vessel construction and propulsion. This way, India could ensure that due to
the application of latest technologies the modal shift to inland waterways transportation really
leads to measurable environmental benefits. Many of the transports will be dedicated
transports of for example coal to a power plant or other raw materials to dedicated end users.
Such transports on dedicated transport routes that work in a dedicated, long-term supply
chain, can reap the greatest ecological and economical benefits by being performed by
specialized, dedicated vessels with advanced vessel and propulsion technologies European
examples show that in cases where more or less dedicated transports take place, ship owners
build dedicated vessels which can be optimized for a given route.
Given the fact that especially bulk cargo lends itself for IWT environmental benefits will arise
by shifting this type of cargo transport from road to inland waterways. One motorized inland
waterways vessel with a load of 2,000 tons carries as much cargo as 50 railway cars at 40 tons
each or 80 trucks at 25 tons each61. Combined with comparably low transport costs, inland
vessels show an excellent cost-benefit-ratio.
Next to bulk cargo, also project and out-of-gauge cargo can easily be transported by inland
waterways vessels. Due to their size and loading capacity, inland vessels are especially suitable
for transporting goods with unusual sizes and weights like transformers, turbines and the like.
Both the two other modes of transport – road and rail – often already work at capacity limit
and suffer from congestion in the case of road and capacity problems in case of the railway.
Thus, inland waterways with a lot of free capacity can help to remedy this situation and offer
comparatively low cost, environmentally friendly and reliable services.
60 United Nations Economic Commission for Europe: Diesel Engine Exhausts – Myths and Reality, p.24ff. 61 EU financed 7th Framework Program – PLATINA II Project
IWT Sector Development Strategy and Business Development Study for Capacity Augmentation of National Waterway 1 from Haldia to Allahabad 251
12. Annexes
IWT Sector Development Strategy and Business Development Study for Capacity Augmentation of National Waterway 1 from Haldia to Allahabad 252
Annex 1: List of Market-Survey Interviews
Haldia-Farakka Sector
Sl No.
Date of Interview
Name of Company/ Organisation
Function Location Agenda Remarks
1. 05-Aug-
2015 Agro Suppliers Syndicate
Producer cum Supplier of Agro Equipment and Supplies
16, Ganesh Chandra Ave 4th floor, Kolkata.
Surveyed cargo volumes and rate of transportation in Kolkata area and also about the O/D pairs
Very Co-operative
2. 05-Aug-
2015 Debson Pumps Pvt ltd
Agro equipment manufacturer/supplier
14, Bentink St, Kolkata
Surveyed cargo volumes and rate of transportation in Kolkata area and also about the O/D pairs
Very Co-operative
3. 05-Aug-
2015 Ranjan Agro Industrial Co.
Agro equipment Supplier Marshal House , 33/1, N.s.Rd, Kolkata
Surveyed cargo volumes and rate of transportation in Kolkata area and also about the O/D pairs
Problems in understanding questionnaire but cooperative
4. 27-Jul-2015
Chandok & Associates
Order supplier of Aggregates/Stone chips )
RDB Boulevard, 8th Flr, Sector V, Salt Lake City, Kolkata-700091
Surveyed cargo volumes and rate of transportation in Pakur, Nalhati and Kolkata area and also about the O/D pairs
Very Co-operative
5. 04-Aug-
2015 Aero Agro Chemical Industries Ltd
Manufacturer of Agro Chemical
R.N Mukherjee Rd, Kolkata
Surveyed cargo volumes and rate of transportation in Kolkata area and also about the O/D pairs
Problems in understanding questionnaire but cooperative
6. 03-Aug-
2015 CTS Industries Ltd
Manufacturer/Order supplier of Aggregates & Stone chips
37 Shakespear Sarani, Kolkata
Surveyed cargo volumes and rate of transportation in Pakur, Nalhati, Sahibgunj and Kolkata area and also about the O/D pairs
Although promised to share data through questionnaire but could not deliver same due to reluctant attitude / Yet to receive infos on Questionnaire pending
7. 05-Aug-
2015 JVL Oil Refinery
Manufacturer / supplier of Edible Oil
AJC Bose Rd, Kolkata Surveyed cargo volumes and rate of transportation 8.etc in Haldia area and also about the O/D pairs
Although promised to share data through questionnaire but could not deliver same due to reluctant attitude / Yet to receive infos on Questionnaire pending
8. 17-Aug-
2015 ACC Ltd
Manufacturer / Supplier of Cement, Concrete
Damodar Cement Works P.O. Sunuri 723 121 Madhukunda District Purulia West Bengal / Sindri Cement Works P.O. ACC Colony, Pin- 828 124 District Dhanbad, Jharkhand
Surveyed cargo volumes and rate of transportation etc in all West Bengal area and also about the O/D pairs
Very Co-operative
9. 19-Aug-
2015 Tirupati Vessels Pvt Ltd
Barge /Tug Owner; Commodity handled Fly Ash on NW-1
Sarat Bose Rd, Kolkata
Surveyed cargo volumes and rate of transportation etc on NW-1 and Bangladesh area and also about the O/D pairs
Although promised to share data through questionnaire but could not deliver same due to reluctant attitude / Yet to receive infos on Questionnaire pending
IWT Sector Development Strategy and Business Development Study for Capacity Augmentation of National Waterway 1 from Haldia to Allahabad 253
10. 19-Aug-
2015 Krishna Shipping & Logistics
Barge/Tug Owner; Commodity handled ODCs on NW-1 & NW-2
Diamond Chambers, Chowringhee, Kolkata
Surveyed cargo volumes and rate of transportation etc in NW-1 and NW-2 area
Problems in understanding questionnaire but cooperative
11. 07-Aug-
2015 Ruchi Soya Industries Ltd
Producer of Edible Oil Shakespeare Sarani, Kolkata
Surveyed cargo volumes and rate of transportation etc in Haldia area and also about the O/D pairs
Although promised to share data through questionnaire but could not deliver same due to reluctant attitude / Yet to receive infos on Questionnaire pending
12. 06-Aug-
2015 Pioneer Agro Industries
Producer of Fertilizers K.S.Roy Rd, Kolkata – 1
Surveyed cargo volumes and rate of transportation in Kolkata area and also about the O/D pairs
Problems in understanding questionnaire but cooperative
13. 06-Aug-
2015
Adhunik Power & Natural Resources Ltd
Thermal Power Industries AJC Bose Rd, Crescent Towers, Kolkata/Haldia
Surveyed cargo volumes and rate of transportation etc in Haldia area and also about the O/D pairs
Although promised to share data through questionnaire but could not deliver same due to reluctant attitude / Yet to receive infos on Questionnaire pending
14. 12-Aug-
2015 Jindal ITF Ltd
Barge operator- Transporting coal from Sagar Is to Farakka
Shakespear Sarani, Kolkata
Surveyed cargo volumes and rate of transportation etc in NW-1 area and also about the O/D pairs
Very Co-operative
15. 11-Aug-
2015 Bothra Shipping Services Pvt Ltd
Forwarder & Terminal Operator
Kolkata, Paradip Port, Bhubaneswar, Visakhapatnam Port, Kakinada Port, Krishnapatnam Port, Mangalore Port
Surveyed cargo volumes and rate of transportation etc in Kolkata port area and also about the O/D pairs
Very Co-operative
16. 17-Aug-
2015 TCI Seaways
Multimodal Integrated Supply Chain Solutions Provider
TCI House, 69 Institutional area, Sector-32, Gurgaon-122007
Surveyed cargo volumes and rate of transportation etc in Kolkata/Haldia port area and also about the O/D pairs
Very Co-operative
17. 01-Sept-
2015 Shri Shyam Agro Bioatech Pvt Ltd
Producer of Agro Products - Wheat Flour (Atta), Flour (Maida) and Cattle Feed
Raniganj, W.B. Surveyed cargo volumes and rate of transportation etc in Raniganj, West Bengal area and also about the O/D pairs
Problems in understanding questionnaire but cooperative
18. 01-Sept-
2015 BABA Ispat Pvt. Ltd Producer of Iron & Steel Raniganj, W.B.
Surveyed cargo volumes and rate of transportation etc in Raniganj, West Bengal area and also about the O/D pairs
Problems in understanding questionnaire
19. 03-Sept-
2015 Lafarge India Pvt Ltd Producer of Cement
Mejia, Vill-Amdanga, Bankura, -722183, W.B.
Surveyed cargo volumes and rate of transportation etc in Bankura Dist, West Bengal area and also about the O/D pairs
Very co-operative
20. 29-Aug-
2015 Birla Corporation Ltd Producer of Cement
Durgapur Cement Works, Durgapur-713203, W.B.
Surveyed cargo volumes and rate of transportation etc in Durgapur Dist, West Bengal area and also about the O/D pairs
Very co-operative
21. 13-Aug-
2015 United Phosphorus Ltd
Producer of Raw Materials of Insecticides
Near Durgachawk Town, Haldia
Surveyed cargo volumes and rate of transportation etc in Haldia area and also about the O/D pairs
Very co-operative
IWT Sector Development Strategy and Business Development Study for Capacity Augmentation of National Waterway 1 from Haldia to Allahabad 254
22. 04-Aug-
2015 Bicco Agro Products pvt Ltd
Producer of Fertilizers Kolkata – 69 Surveyed cargo volumes and rate of transportation etc in Haldia area and also about the O/D pairs
Problems in understanding questionnaire but cooperative
23. 18-Aug-
2015 ABC India Ltd
Project Logistics and Retail Transporter (FTL) for ODC/H-Lift transportation
40/8, Ballygunj Circular Rd, Kolkata-700019
Surveyed cargo volumes, Equipment owned and rate of transportation etc in Kolkata/ Haldia / NW-1 & NW-2 area and also about the O/D pairs
Very co-operative
24. 25-Aug-
2015 J M BAXI & CO.
Ship Agents, Forwarder, Port and Terminal operator / Commodity – Containers, Bulk & Project cargo
Kolkata Surveyed cargo volumes and rate of transportation etc in Kolkata/ Haldia area and also about the O/D pairs
Very co-operative
25. 10-Aug-
2015 Aishwarya Shipping & Logistics, Kolkata
Customs Agent , Forwarder / Commodity – Refractory Cargo
Kolkata Surveyed cargo volumes and rate of transportation etc in Kolkata/ Haldia area and also about the O/D pairs
Co-operative
26. 10-Aug-
2015 Everett India Pvt Ltd
Shipping Agent / Commodities handled – Steel, General Cargo, Lime Stone, Coal
50, Chowringhee Rd, Kolkata-71
Surveyed cargo volumes and rate of transportation etc in Kolkata/ Haldia area and also about the O/D pairs
Co-operative
27. 10-Aug-
2015 Eastern Navigation Pvt. Ltd.
Shipping Line (River Transporters only) / Commodities handled – Heavy Lift – ODCs
Mercantile Buildings, 2nd Floor, 9/12 Lal Bazar Street, Kolkata-700001
Surveyed cargo volumes, Equipment owned and rate of transportation etc in Kolkata/ Haldia / NW-1 & NW-2 area and also about the O/D pairs
Very co-operative
28. 12-Aug-
2015 Karnani Minerals Pvt. Ltd
Trader / Commodities handled – Lime Stone, Silica Sand
Kolkata Surveyed cargo volumes and rate of transportation in Kolkata area and also about the O/D pairs
Very co-operative
29. 10-Aug-
2015 Vivada Corporation Pvt Ltd
Inland Barge Operator / Commodities handled – Petroleum Products
14 Southern Ave, ( Dr Meghnad Saha Sarani)3rd Floor, Kolkata 700 026
Surveyed cargo volumes, Equipment owned and rate of transportation etc in Kolkata/ Haldia / NW-1 & NW-2 area and also about the O/D pairs
Very co-operative
30. 13-Aug-
2015 Royal Movers India
Integrated Logistic Service provider ( Road Transportation)
B. H. Road, Kolkata - 700104
Provided Road Transportation rate for Individual Commodity as per different O/D pairs
Very co-operative
31. 13-Aug-
2015 TATA Chemicals Pvt Ltd
Producer of Chemicals Durgachak, Haldia Surveyed cargo volumes and rate of transportation in Haldia area and also about the O/D pairs
Although promised to share data through questionnaire but could not deliver same due to reluctant attitude or may be unwilling to share same / Yet to receive infos on Questionnaire pending
32. 13-Aug-
2015 Hindustan Uni-Lever
Producer of Detergent materials
Durgachak, Haldia Surveyed cargo volumes and rate of transportation in Haldia area and also about the O/D pairs
Although promised to share data through questionnaire but could not deliver same due to reluctant attitude or may be unwilling to share same / Yet to receive infos on Questionnaire pending
IWT Sector Development Strategy and Business Development Study for Capacity Augmentation of National Waterway 1 from Haldia to Allahabad 255
33. 17-Aug-
2015 Prism Logistics Logistic Service Provider Kolkata
Surveyed cargo volumes and rate of transportation in Kolkata/Haldia area and also about the O/D pairs
Although promised to share data through questionnaire but could not deliver same due to reluctant attitude or may be unwilling to share same / Yet to receive infos on Questionnaire pending
34. 04-07-
Aug-2015 28 more Companies Agro/Fertilizers industries
Kolkata / Howrah Market area
Problems in understanding questionnaire No infos received due to reluctant attitude of sharing data
35. 04-Sept-
2015 New Shankar Stone Works
Crusher Owner / Supplier of Aggregates
Bahadurpur, Nalhati, W.B.
Problems in understanding questionnaire Data received verbally
36. 04-Sept-
2015 Sharda Stone Works
Crusher Owner / Supplier of Aggregates
Bahadurpur, Nalhati, W.B.
Problems in understanding questionnaire Data received verbally
37. 04-Sept-
2015 Rohan Industries
Crusher Owner / Supplier of Aggregates
Bahadurpur, Nalhati, W.B.
Problems in understanding questionnaire Data received verbally
38. 31-Aug-
2015 Eastern Railway Authorities
Railway rate/Volume inquiry
Koilaghat, Kolkata No data shared on the commodities, O/D pairs, rates etc
Data collected from Railway website.
39. 01-Sept-
2015 Pakur Railway Authority
Railway rate/Volume inquiry
Pakur, Jharkhand Shared only Railway volume and rate data Data received verbally
40. 13-15-
Sept-2015
Eastern Freight Corridor Corporation of India
Railway rate/Volume inquiry
New Alipore, Kolkata Unable to share the actual volume/rate data Projected data information collected from website as advised by them.
41. 14-15-
Sept-2015 HDC Railway
Railway rate/Volume inquiry
Chiranjibpur, Haldia Surveyed cargo volumes, O/D pairs, rate etc by Railway transportation from HDC
Still awaiting data
42. 31-Aug to 05-Sept-
2015
At least 70 interviews in Pakur (50), Nalhati (5) and Rampurhat (15) areas were roadside interviews as per locations of different stone-chip crushers. Most of them were not ready to share data. Some of them shared only O/D pairs but unable to provide other data. Out of these 70 interviews, only 6 interviews resulted in complete data collection within these regions. All data were received verbally.
Source: Consultants’ Market Survey July – October 2015
Terminal and shipping operators interviewed:
1. Bothra Shipping Services Pvt Ltd / Forwarder & Terminal Operator / Established: 1977 / Location: Kolkata, Paradip Port, Bhubaneswar, Visakhapatnam Port,
Kakinada Port, Krishnapatnam Port, Mangalore Port / Nos. of Staff: 358, / Nos. of Transport Devices: Tippers 124, Payloaders 45, Excavators 18, Excavators
With Grabs 5, Liebherr Shore Cranes Lhm 400/550: 8, Lhm 984; 2.
2. TCI Seaways (TCI House, 69 Institutional area, Sector-32, Gurgaon-122007) / Multimodal Integrated Supply Chain Solutions Provider with a global presence /
Established: 1958 / Location: 1100 locations all over India / Staff: 5,000+ / with extensive infrastructure, TCI today moves 2.5% of India's GDP by value. Over
9,000 trucks in operation / Fleet of 4 cargo ships / 10.5 million sq.ft. of warehousing space / CHA license.
3. Vivada Corporation Pvt Ltd. (14 Southern Ave (Dr Meghnad Saha Sarani) 3rd Floor, Kolkata 700 026 Email: [email protected]) / Inland Barge
Operator / Established 1966 / No. of Staff: Permanent 140, Contract 90.
IWT Sector Development Strategy and Business Development Study for Capacity Augmentation of National Waterway 1 from Haldia to Allahabad 256
Farakka-Munger Sector
Sr. No Survey Period Organization/Company Industry Location Reason Remarks
1 29-Jul-15 M/s. Ammadia Mines Stone Chips and Aggregates Sakrigali
Current mode of transportation
includes road and railway and the
players look at IWT as an alternative.
Could be a potential for IWT and hence
surveyed.
As a general remark on the interview process and
responses received, it was found that the mining
agencies and industries were highly resistant to sharing
information on the characteristics of the
company/establishment, individual production
capacity, future growth and costs involved. Albeit, they
were expressing a favorable response to the proposed
new IWT facility, there was ambiguity in the cost
advantages and operational issues. This resulted in
unclear response to questions like "their interest" and
"investment in developing Sahibganj MMT".
2 29-Jul-15 M/s. Dilip and Brothers Stone Works Stone Chips and Aggregates Sakrigali
3 3-Aug-15 M/s. Puthulbabu Stone crushers Stone Chips and Aggregates Sakrigali
4 3-Aug-15 M/s. Bajrangee Stone works Stone Chips and Aggregates Sakrigali
5 3-Aug-15 M/s. Mungerilal Stone Works Stone Chips and Aggregates Sakrigali
6 6-Aug-15 M/s. CTC Stone crushers, Mahadevganj Stone Chips and Aggregates Sahibganj
7 6-Aug-15 M/s. Yashraj Block Stone, Mr. Bajrangi Prasad Yadav Stone Chips and Aggregates Sahibganj
8 6-Aug-15 Mr. Ram Savare Tiwari Stone crushers Stone Chips and Aggregates Sahibganj
9 7-Aug-15 M/s. Mumtaz Stone, Mr. Mumtaz Ansari Stone Chips and Aggregates Sahibganj
10 5-Aug-15 Mr. Rajesh Kumar Jaiswal Stone works Stone Chips and Aggregates Sahibganj
11 7-Aug-15 M/s. F.A. Stone Works Stone Chips and Aggregates Sahibganj
12 10-Aug-15 M/s. Yashraj Block Stone, Mr. Bajrangi Prasad Yadav Stone Chips and Aggregates Sahibganj
13 4-Aug-15 M/s. Black Stone Works, Mr. Wahavavuddin Stone Chips and Aggregates Sahibganj
14 10-Aug-15 M/s. Vaishnav Stone Works, Mr. Avadh Kishore Sinh Stone Chips and Aggregates Sahibganj
15 10-Aug-15 M/s. Sarve Shri Sunny Stone Works, Mr. Amit Kumar Stone Chips and Aggregates Sahibganj
16 11-Aug-15 Mr. Anil Yadav Stone works Stone Chips and Aggregates Sahibganj
17 5-Aug-15 Mr. Mukesh Yadav, Munger Stone Chips and Aggregates Sakrigali
18 4-Aug-15 M/s. Black Stone Works, Mr. Ved Prakash Khurania Stone Chips and Aggregates Sahibganj
19 7-Aug-15 Mr. Pradhan Stone works Stone Chips and Aggregates Mirzachowki
20 7-Aug-15 M/s. MKGN Stone Works Stone Chips and Aggregates Mirzachowki
21 12-Aug-15 M/s. Mamatha Stone Works Stone Chips and Aggregates Mirzachowki
22 13-Aug-15 M/s. Maa Bhavani Stone Works Stone Chips and Aggregates Mirzachowki
23 13-Aug-15 M/s. Vaishnav Stone Works Stone Chips and Aggregates Mirzachowki
24 7-Aug-15 M/s. Hindusthan Stone Works Stone Chips and Aggregates Mirzachowki
25 7-Aug-15 M/s. Ashoka Engineering Stone works Stone Chips and Aggregates Mirzachowki
26 8-Aug-15 M/s. Parvathy Stone works Stone Chips and Aggregates Mirzachowki
27 12-Aug-15 M/s. RQS Silica Sand Mining Company. Silica Sand Mining Mangalhat
28 12-Aug-15 M/s. SMC Silica Sand Mining Company. Silica Sand Mining Mangalhat
29 21-Aug-15 M/s. Tirupati Pvt. Limited & Katihar Jute Mills Textile Industry Katihar
30 24-Aug-15 M/s. TG Force India Pvt. Ltd. Food Production Katihar
31 24-Aug-15 M/s. Purnea Mushrooms Pvt. Ltd. Food Production Katihar
IWT Sector Development Strategy and Business Development Study for Capacity Augmentation of National Waterway 1 from Haldia to Allahabad 257
32 4-Aug-15 Sahibganj Railway Station Stone Chips and Aggregates, Cement, Rice Sahibganj The left-listed stations are major loading/ unloading
points in the region. Hence the
magnitude of loading recorded
and origins/ destinations were collected for the
past year from these railway stations to
ascertain the demand specifically
met by rail.
33 6-Aug-15 Sakrigali Railway Station Stone Chips and Aggregates Sakrigali
34 7-Aug-15 Mirzachowk Railway Station Stone Chips and Aggregates Mirzachowki
35 7-Aug-15 Bakudi Railway Station Stone Chips and Aggregates Bakudi
36 6-Aug-15 Barharwa Railway Station Stone Chips and Aggregates Barharwa
37 11-Aug-15 Kotalpukur Railway Station Stone Chips and Aggregates Kotalpukur
38 12-Aug-15 Pakur Railway Station Stone Chips and Aggregates, Coal Pakur
39 12-Aug-15 Rajmahal railway Station Silica Sand Rajmahal
40 20-Aug-15 Katihar Railway Station Fertilizer, Cement Katihar
41 13-Aug-15 Baghalpur Railway Station Rice, Wheat, Fertilizer, Cement Baghalpur
42 13-Aug-15 Kahalgaon Railway Station Coal, Flyash Kahalgaon
43 7-Aug-15 Pirpainti Railway Station Coal Pirpainti
Source: Consultants’ market survey, August-October 2015
Munger-Ballia Sector
No. Commodity Location of producers
(origin) Location of users
(destination) Address of the Firm
1 Cement Naya Bhojpur Buxar
Amar Cement Bhandar, Bhogpur, Buxar 2 Sand Naya Bhojpur Koilwar
3 Stone Chips Naya Bhojpur Sasaram
4 Stone Chips Sasaram Aara
Raju, Gitti, Kharsar, Majhin, Sasaram, Rohtas, Bihar 5 Stone Chips Sasaram Mohinya
6 Stone Chips Sasaram Dinara
7 Stone Chips Sasaram Buxar
8 Rice Dalmiyanagar Buxar Suraj, Ricemill, Dalmiyanagar, Rohtas, Bihar
9 Stone Chips Sasaram Aara
Dhanu, Gitti Machinery, Utpadan, Sasaram, Rohtas, Bihar 10 Stone Chips Sasaram Mohinya
11 Stone Chips Sasaram Dinara
12 Stone Chips Sasaram Buxar
13 Rice Dehri Aara Gupta G, Ricemill, Dalmiyanagar, Dihri, Rohtas, Bihar
14 Stone Chips Sasaram Aara Arunidhi, Gitti, Kharsar Machine, Sasaram, Rohtas, Bihar
IWT Sector Development Strategy and Business Development Study for Capacity Augmentation of National Waterway 1 from Haldia to Allahabad 258
15 Stone Chips Sasaram Mohinya
16 Stone Chips Sasaram Dinara
17 Stone Chips Sasaram Buxar
18 Stone Chips Sasaram Aara
Ajit, Gitti, Kharsar, Machine, Sasaram, Rohtas, Bihar 19 Stone Chips Sasaram Mohinya
20 Stone Chips Sasaram Dinara
21 Stone Chips Sasaram Buxar
22 Stone Chips Sasaram Aara
Aditya, Gitti, Kharsar, Machine, Sasaram, Bihar 23 Stone Chips Sasaram Mohinya
24 Stone Chips Sasaram Dinara
25 Stone Chips Sasaram Buxar
26 Stone Chips Sasaram Aara
Parinidhi, Gitti, Kharsar, Machine, Sasaram, Rohtas, Bihar 27 Stone Chips Sasaram Mohinya
28 Stone Chips Sasaram Dinara
29 Stone Chips Sasaram Buxar
30 Stone Chips Sasaram Aara
Raju, Gitti, Kharsar, Sasaram, Rohtas, Bihar 31 Stone Chips Sasaram Mohinya
32 Stone Chips Sasaram Dinara
33 Stone Chips Sasaram Buxar
34 Stone Chips Sasaram Aara
Jairam, Gitti, Kharsar, Machine, Sasaram, Rohtas, Bihar 35 Stone Chips Sasaram Mohinya
36 Stone Chips Sasaram Dinara
37 Stone Chips Sasaram Buxar
38 Stone Chips Sasaram Aara
Jagnu, Gitti, Kharsar, Ricemill, Sasaram, Rohtas, Bihar 39 Stone Chips Sasaram Mohinya
40 Stone Chips Sasaram Dinara
41 Stone Chips Sasaram Buxar
42 Cement Bihiya Aara Ramco Aodhyogik Kendra, Bihiya
43 Cycle Jagdishpur Aara Vijay Cycle Store, Jagdishpur, Bhogpur
44 Urea Bhadsara Aara Amit Khad Bhandar, Bhadsara
45 Rice Bhadsara Aara Maa Sharda Ricemill, Bhadsara, Jagdishpur, Bhogpur
46 Rice Pero BSFC (Aara) Jai Maa Laxmi ji Rice Mill, Piro, Aara
47 Cement Bihiya Aara
Deepak Cement Store, Bihiya 48 Sand Bihiya Koilwar
49 Stone Chips Bihiya Sasaram
50 Rice Hasawahdeh BSFC (Aara) Rajiv Kumar Singh, 9308249030
51 Rice Kaithua BSFC (Aara) Maa Vaishno Devi Ricemill, Kaithua
52 Rice Agiwa Bazar BSFC (Aara) Maa Vindhyavaaisni Mini Ricemill, Agiwa Bazaar
IWT Sector Development Strategy and Business Development Study for Capacity Augmentation of National Waterway 1 from Haldia to Allahabad 259
53 Rice Lehthan BSFC (Aara) Tiway ji, Ricemill, Lehthani
54 Iron Bar Fatuwa Odisa Kaamdhenu Chad Company, Fatuwa, Patna
55 Iron Bar Fatuwa Kolkata
56 Machine Fatuwa Kolkata Voltas Company, Fatuwa, Patna, Bihar
57 Wire Fatuwa Purjia Shri Bala ji Oil Company, Fatuwa, Patna
58 Iron Bar Fatuwa Odisa Dada ji Company, fatuwa, Patna
59 Iron Bar Didar Ganj (Fatuwa) Odisa Magadh Chad Company, Didarganj, Fatuwa, Patna
60 Iron Bar Didar Ganj (Fatuwa) Odisa Vinay Iron Chad Company, Didar Ganj, Fatuwa, Patna, Bihar
61 Rice Bihiya BSFC (Aara) Sunil Dukaan, Bahiya
62 Wheat Bihiya BSFC (Aara)
63 Cement New Bhojpur Buxar
Kasim Cement Store, Bhogpur, Buxar 64 Sand New Bhojpur Koilwar
65 Stone Chips New Bhojpur Sasaram
66 Cement Bihiya Aara
Ramdhani Cement Store, Bihiya 67 Sand Bihiya Koilwar
68 Stone Chips Bihiya Sasaram
69 Cement Bihiya Aara
Maa Vindhyavaaisni Cement Store, Bihiya 70 Sand Bihiya Koilwar
71 Stone Chips Bihiya Sasaram
72 Cement Bihiya Aara
Maa Jagdamba Cement Store, Bihiya 73 Sand Bihiya Koilwar
74 Stone Chips Bihiya Sasaram
75 Iron Bar Fatuwa Odisa Dada ji Company, fatuwa, Patna
76 Cement Bihiya Aara
yadav Cement Store, Bihiya 77 Sand Bihiya Koilwar
78 Stone Chips Bihiya Sasaram
79 Cement Bihiya Buxar
Raju Cement Store, Naya Bhogpur 80 Sand Bihiya Koilwar
81 Stone Chips Bihiya Sasaram
82 Cement Bihiya Aara
Arun Cement Store, Bihiya 83 Sand Bihiya Koilwar
84 Stone Chips Bihiya Sasaram
85 Cement Bihiya Aara
Rajesh Gitti Store, Bihiya 86 Sand Bihiya Koilwar
87 Stone Chips Bihiya Sasaram
88 Cement Bihiya Buxar
Ojha, Cement Store, Naya Bhogpur 89 Sand Bihiya Koilwar
90 Stone Chips Bihiya Sasaram
IWT Sector Development Strategy and Business Development Study for Capacity Augmentation of National Waterway 1 from Haldia to Allahabad 260
91 Cement Bihiya Aara
Bansighar Cement Store, Bihiya 92 Sand Bihiya Koilwar
93 Stone Chips Bihiya Sasaram
94 Cement Bihiya Buxar
Shukla Building Material, KrishnaBrahma, Buxar 95 Sand Bihiya Koilwar
96 Stone Chips Bihiya Sasaram
97 Cement Bihiya Buxar
Jai Bhole Shankar, Naya Bhogpur, Buxar 98 Sand Bihiya Koilwar
99 Stone Chips Bihiya Sasaram
100 Cement Bihiya Buxar
Raja Cement Store, Naya Bhogpur 101 Sand Bihiya Koilwar
102 Stone Chips Bihiya Sasaram
103 Cement Bihiya Buxar
Maa Baalu Bhandar, Naya Bhogpur 104 Sand Bihiya Koilwar
105 Stone Chips Bihiya Sasaram
106 Cement Bihiya Buxar
Pandey Cement Store, Naya Store, Buxar 107 Sand Bihiya Koilwar
108 Stone Chips Bihiya Sasaram
109 Cement Bihiya Buxar
Mira, Cement Store, Naya Bhogpur 110 Sand Bihiya Koilwar
111 Stone Chips Bihiya Sasaram
112 Oils Nalanda Kolkata Mohini Oils Mills Nalanda
113 Rice Nalanda Whole Nalanda District Pawanpuri Ricemill, Nalanda
114 Rice Nalanda BFCS Radhika Rice Mills, Silao, Nalanda, Bihar
115 Rice Nalanda BFCS Ishan Chawal Utpadan, Nalanda, Bihar
116 Rice Nalanda BFCS Budh Bihar Rice Mill, Nalanda, Bihar
117 Wheat Nalanda BFCS Omprakash Roller Flour Mill, Nalanda, Bihar
118 Edibles Items Nalanda Sasaram
Maa shitlao-OM-Storage Pvt. Ltd. Nalanda 119 Edibles Items Nalanda Bhojpur
120 Edibles Items Nalanda Buxar
121 Edibles Items Nalanda Jahanabad
122 Drinking Water Nalanda Delhi Relent Enterprises pvt ltd, visthapit, Colony Nagdin-2, Rajgir, Nalanda
123 Potato Nalanda All Bihar Metallite Food Processing Pvt Ltd, Islampur Road, Nalanda, Bihar
124 Bleaching Powder Gaya Kolkata Madhu Chemicals, 1st Floor, Leela Palace, Near Tulsi market, gaya, Bihar
125 Iron Gaya Odisa Vishnu Krishi Udyog, 4750 Saft, Gaya, Bihar
126 Tool Room Gaya Kolkata Mital Bhai Construction 4750 Saft, Gaya, Bihar
127 Tool Room Gaya Odisa
128 Plastic Granules Gaya Aara Muskan Plastic, Nima Tola Choraha, Budhgaya, Gaya, Bihar
IWT Sector Development Strategy and Business Development Study for Capacity Augmentation of National Waterway 1 from Haldia to Allahabad 261
129 Plastic Granules Gaya Sasaram
130 Plastic Granules Gaya Patna
131 Plastic Granules Gaya Purjia
132 Iron Gaya Odisa Kavita Enterprises, Swaraj Puri Road, Gaya, Bihar
133 Iron Gaya Odisa NTP Industries, Narayani Tubewell, 81, Tekari Road, Gaya, Bihar
134 Iron Gaya Kolkata Alfa paints, Gurudwara Road, Gaya, Bihar
135 PVC Pipes HI Diary & Agro Product Ltd, Boring Road, Opp. AM College, Adjacent to Petrol Pump
136 Processed Food Amar pali Food Pvt. Ltd. Opp. Tara Mandir, Hazipur Industrial Area
137 Battery Gaya Kolkata Infra power, ahmad ali house, Nagmitia Road, Gaya, Bihar
138 Ilaichi (Cardamom) Gaya Kolkata Basanti Food Products, ramana road, gaya, Bihar
139 Electric Pipes Bela Patna D.B. Electrical Industries, Plot No. 6, D-6, Industrial Estate, Bela, Phase-I, Muzzafar pur
140 Paper Bela Delhi Sai Packing Factory, Bela, Muzzafarpur, Bihar
141 Tank Bela Delhi Gangotari Adhyogik, Bela, Muzzafarpur, Bihar
142 Plastic Bela Uttar Pradesh IP Industrial, Bela, Muzzafarpur, Bihar
143 Chicken Feed Bela Delhi Khag Parsankaran Udyag, Bela, Muzzafarpur, Bihar
144 Tabacco Bela Kolkata Archana Tambacco, Bela, Muzzaffarpur,Bihar
145 Pulses Bela Patna Ripu Foods, Bela, Muzzaffar Pur, Bihar
146 Agriculture Beka Bokaro Kishan Engineering Works, Bela, Muzzaffarnagar, Bihar
147 Pulses Samastipur Patna Mahabir Enterprises, Samastipur, Bihar
148 Flour Samastipur Dhanbad Natraj Industries, Harpur, Aloth, Samastipur, Bihar
149 Wheat Samastipur Kolkata Shri bala ji Adhyogik, Samastipur, Bihar
150 Milk Samastipur All Bihar Mitla Dugadh utpadak Sahkari Sanggh Ltd, Samastipur, Bihar
151 Chicken Feed Samastipur Dhanbad Shivshakti Agro Industries, Samastipur, Bihar
152 Minery Samastipur Odisa Mithla Engineering Adhyogik, Samastipur, Bihar
153 Thinner Samastipur Patna Samrat Labrotaries, harpur, Samastipur, Bihar
154 Tank Samastipur Delhi RS Industries, Samastipur, Bihar
155 Machinery Darbhanga Bokara Vishwakarma Industries, bela, Darbhanga, Biahr
156 Machinery Darbhanga Odisa Shri Krishna Engineering, Naya Adhyogik Prangan, Bela, Darbhanga, Bihar
157 Pulses Darbhanga Patna Pankaj Mini Daal Mill, bela, Darbhanga, Bihar
158 Aluminium Darbhanga Bokaro Pooja Metal Industries, Bela, Darbhanga, Bihar
159 Pipe Khadakpur (Patna) Banaras
Mahashakti Pipe Industries, Saidpur Tola, Patna 160 Pipe Khadakpur (Patna) Assam
161 Pipe Khadakpur (Patna) Guwahati
162 Pipe Khadakpur (Patna) Ranchi
163 Iron Bar Fatuwa Odisa jai Jagdamba Chad Udyog, Fatuwa, Patna, Bihar
164 Iron Bar Fatuwa Kolkata Shri Bala ji Iron, Fatuwa, Bihar
165 Besan Fatuwa Haldia Shyam Besan, Fatuwa, Patna, Bihar
166 Iron Bar Baikhatopur Kolkata
IWT Sector Development Strategy and Business Development Study for Capacity Augmentation of National Waterway 1 from Haldia to Allahabad 262
167 Stone Chips Fatuwa Sasaram Raj Enterprises, Fatuwa, Patna
168 Chicken Feed Samastipur Patna Massila Agro Industries, Samastipur, Bihar
169 Latex Ficus Industries, D-18, Industrial Estate, Bela, Muzzaffarpur, Bihar
170 Urea Bela Delhi Bajrang Rasayan Khad, Bela, Muzzafarpur, Bihar
171 Plastic Bela Bhopal Aditya Industrial, Plastic, Bela, Muzzafarpur, Bihar
172 Plastic Bela Patna Shri Krishna Product, Bela, Phase-I, Muzzaffarpur, Bihar
173 Mustard Oil Bela Gela (Muzzafarpur)
Shiv Food Industries, N4, Industries State, Bela, Muzzaffarpur, Bihar 174 Besan Bela Gela (Muzzafarpur)
175 Flour Bela Gela (Muzzafarpur)
176 Electric Bela Bokaro Malhotra Engineering Works Pvt. Ltd. Bela, Muzzafarpur, Bihar
177 Bricks Madhubani Dhanbad Chouthi Eet Bhatta, Bhawara, Madhubani, Bihar
178 Bricks Madhubani Dhanbad Fatmi Eet Bhatta, Bhawara, Madhubani
179 Bricks Madhubani Dhanbad Moti Eet Bhatta, Madhubani, Bihar
180 Bricks Madhubani Jhadiya Umesh Paamnaami, Eet Bhatta, Salempur, Madhubani, Bihar
181 Bricks Madhubani Jhadiya Madab Eet, Raghunathpur, Madhubani, Bihar
182 Bricks Madhubani Dhanbad Dosti Eet Bhatta, Gibaspur, madhubani, Bihar
183 Bricks Madhubani Dhanbad Bhawaki Eet Bhandar, Gibaspur, Madhubani, Bihar
184 Bricks Madhubani Dhanbad Yakeshwar kumar paamnaami, yodharan, madhuabni, Bihar
185 Bricks Madhubani Jhadiya Krishna Eet Bhatta, Yodhrana, Madhubani,, Bihar
186 Bricks Madhubani Dhanbad Gold Eet Factory, Rati, Madhubani, Biahr
187 Bricks Madhubani Dhanbad Ghar Eet Bhandar, RATI, madhubani, Bihar
188 Flour Begusarai Patna OM Food Procession Pvt. Ltd., Industries area, Deona, Begusarai, Bihar
189 Wood Begusarai Odisa Padarath Saw Mill, Baruni Industrial area, Begusarai, Bihar
190 Flour Begusarai Patna Jay shree industries, industrial area, Burani, begusarai, Bihar
191 Tiles Begusarai Rajasthan Pawan tiles, Dewana Industrial area, Burani, Begusarai, Bihar
192 Coal Begusarai Dhanbad Premier Adhyogik, Jauna Adhyogik Chetra, begusarai, Bihar
193 Tiles Begusarai Rajasthan surya tiles industries, 4-IB, Industrial Area, Baruni, Begusarai, Bihar
194 Flour Begusarai Patna Sarv Shri Om Food Product, Industrial Area Baruni, Begusarai, Bihar
195 Fodder Begusarai Patna Gopal Sampurana Pashu Aahar, Industrial Area, Baurani, Begusarai,Bihar
196 Hydraulic Trailor Begusarai Bokaro Shiv Shakti Engineering Works, Industrial area Dewana, Begusarai, Bihar
197 Industrial Machinery Begusarai Odisa JP Engineering Adhyogik, Dewana, Begusarai, Bihar
Source: Consultants’ market survey, August-October 2015
IWT Sector Development Strategy and Business Development Study for Capacity Augmentation of National Waterway 1 from Haldia to Allahabad 263
Ballia-Allahabad Sector
Sr No. Date Location Organisation/ Company
Function Agenda Remarks
1 08.09.15 Ballia FCI Distribution of Grain Surveyed Cargo Volumes, Freight Costs , O/D Pairs Percentage Split of Transport, Awareness / Advantages / Incentives of Water Transportation
Co-operative
2 06.09.15 Ballia Indian Railways Transportation of Cargo / Goods by Train
Surveyed Cargo Volumes, Freight Costs, O/D Pairs Co-operative
3 10.09.15 Ballia Mandi Samiti Ballia Supplier of Fruits/ Vegetables
Surveyed Cargo Volumes, Freight Costs , O/D Pairs Percentage Split of Transport, Awareness / Advantages / Incentives of Water Transportation
Co-operative
4 12.09.15 Mau FCI Distribution of Grain Surveyed Cargo Volumes, Freight Costs , O/D Pairs Percentage Split of Transport, Awareness / Advantages / Incentives of Water Transportation
Co-operative
5 14.09.15 Mau Mandi Samiti Kopaganj
Supplier of Fruits/ Vegetables
Surveyed Cargo Volumes, Freight Costs , O/D Pairs Percentage Split of Transport, Awareness / Advantages / Incentives of Water Transportation
Co-operative
6 15.09.15 Mau FCI Distribution of Grain Surveyed Cargo Volumes, Freight Costs , O/D Pairs Percentage Split of Transport, Awareness / Advantages / Incentives of Water Transportation
Co-operative
7 15.09.15 Mau Indian Railways Transportation of Cargo / Goods By Train
Surveyed Cargo Volumes, Freight Costs, O/D Pairs Reluctant to give information
8 16.09.15 Azamgarh Indian Railways Transportation of Cargo / Goods by Train
Surveyed Cargo Volumes, Freight Costs, O/D Pairs Cooperative
9 16.09.15 Azamgarh FCI Distribution of Grain Surveyed Cargo Volumes, Freight Costs , O/D Pairs Percentage Split of Transport, Awareness / Advantages / Incentives of Water Transportation
Very cooperative
10 17.09.15 Jaunpur Amba Cement Producing of Cement Surveyed Cargo Volumes, Freight Costs , O/D Pairs Percentage Split of Transport, Awareness / Advantages / Incentives of Water Transportation
Very cooperative
11 17.09.15 Jaunpur Gangesh Cement Producing of Cement Surveyed Cargo Volumes, Freight Costs , O/D Pairs Percentage Split of Transport, Awareness / Advantages / Incentives of Water Transportation
Reluctant to give information
12 17.09.15 Jaunpur Sale Tax Office Collection of Revenues / Tax from Industries
Industries in District for Surveying Cargo Volumes, Freight Costs, O/D Pairs Sale tax office informed about number of industries in district
13 17.09.15 Jaunpur Abhinav Steel And Power Ltd
Manufacture of Steel / Thermal Plant
Surveyed Cargo Volumes, Freight Costs , O/D Pairs Percentage Split f Transport, Awareness / Advantages / Incentives of Water Transportation
Reluctant to give information, provided information about thermal plant but information on steel industry not given
14 17.09.15 Jaunpur H.I.L Ltd C.K Birla Group Sathariya
Manufacturing of Roofsheets
Surveyed Cargo Volumes, Freight Costs , O/D Pairs Percentage Split of Transport, Awareness / Advantages / Incentives of Water Transportation
Very co-operative
15 17.09.15 Jaunpur H.I.L Ltd C.K Birla Group Jhajjar
Manufacturing of Roofsheets
Surveyed Cargo Volumes, Freight Costs , O/D Pairs Percentage Split of Transport, Awareness / Advantages / Incentives of Water Transportation
Very co-operative
16 17.09.15 Jaunpur H.I.L Ltd C.K Birla Group Faridabad
Manufacturing of Roofsheets
Surveyed Cargo Volumes, Freight Costs , O/D Pairs Percentage Split of Transport, Awareness / Advantages / Incentives of Water Transportation
Very co-operative
17 17.09.15 Kushinagar Ramakant Transport
Transport /Supplier of Aggregates /Sand
Surveyed Cargo Volumes, Freight Costs , O/D Pairs Percentage Split of Transport, Awareness / Advantages / Incentives of Water Transportation
Co-operative
IWT Sector Development Strategy and Business Development Study for Capacity Augmentation of National Waterway 1 from Haldia to Allahabad 264
18 18.09.15 Jaunpur Afri Balu Mandi Supplier of Aggregates / Sand
Surveyed Cargo Volumes, Freight Costs , O/D Pairs Percentage Split of Transport, Awareness / Advantages / Incentives of Water Transportation
Co-operative
19 18.09.15 Jaunpur FCI Distribution of Grain Surveyed Cargo Volumes, Freight Costs , O/D Pairs Percentage Split of Transport, Awareness / Advantages / Incentives of Water Transportation
Co-operative
20 18.09.15 Shahganj Indian Railways Transportation of Cargo / Goods by Train
Surveyed Cargo Volumes, Freight Costs , O/D Pairs Percentage Split of Transport, Awareness / Advantages / Incentives of Water Transportation
Co-operative
21 18.09.15 Shahganj Agrasen Flour Mill Producer of Agro (Wheat Flour)
Surveyed Cargo Volumes, Freight Costs , O/D Pairs Percentage Split of Transport, Awareness / Advantages / Incentives of Water Transportation
Co-operative
22 18.09.15 Shahganj Moto Aahar Pvt Ltd
Producer of Agro (Wheat Flour)
Surveyed Cargo Volumes, Freight Costs , O/D Pairs Percentage Split of Transport, Awareness / Advantages / Incentives of Water Transportation
Co-operative
23 19.09.15 Sultanpur Kisan Shahkari Chini Mill Ltd
Producer Of Sugar Surveyed Cargo Volumes, Freight Costs , O/D Pairs Percentage Split of Transport, Awareness / Advantages / Incentives of Water Transportation
Co-operative
24 19.09.15 Kushinagar FCI Distribution of Grain Surveyed Cargo Volumes, Freight Costs , O/D Pairs Percentage Split of Transport, Awareness / Advantages / Incentives of Water Transportation
Co-operative
25 19.09.15 Sultanpur Sale Tax Office Collection of Revenues / Tax from Industries
Industries in District for Surveying Cargo Volumes, Freight Costs, O/D Pairs Sale tax office informed about number of industries in district
26 19.09.15 Sultanpur Indian Railways Transportation of Cargo / Goods By Train
Surveyed Cargo Volumes, Freight Costs, O/D Pairs Co-operative
27 19.09.15 Pratapgarh Sale Tax Office Collection of Revenues / Tax from Industries
Industries in District for Surveying Cargo Volumes, Freight Costs, O/D Pairs Sale tax office informed about number of industries in district
28 19.09.15 Kushinagar Sale Tax Office Collection of Revenues / Tax from Industries
Industries in District for Surveying Cargo Volumes, Freight Costs, O/D Pairs Sale tax office informed about number of industries in district
29 19.09.15 Kushinagar FCI Distribution of Grain Surveyed Cargo Volumes, Freight Costs , O/D Pairs Percentage Split of Transport, Awareness / Advantages / Incentives of Water Transportation
Co-operative
30 21.09.15 Allahabad (Naini)
Indian Railways Transportation of Cargo / Goods By Train
Surveyed Cargo Volumes, Freight Costs, O/D Pairs Co-operative
31 21.09.15 Gorakhpur FCI Distribution of Grain Surveyed Cargo Volumes, Freight Costs , O/D Pairs Percentage Split of Transport, Awareness / Advantages / Incentives of Water Transportation
Co-operative
32 21.09.15 Gorakhpur Narayan Roadlines Transport /Supplier of Aggregates /Sand
Surveyed Cargo Volumes, Freight Costs , O/D Pairs Percentage Split of Transport, Awareness / Advantages / Incentives of Water Transportation
Co-operative
33 21.09.15 Gorakhpur Sanjay Roadways Transport /Supplier of Aggregates /Sand
Surveyed Cargo Volumes, Freight Costs , O/D Pairs Percentage Split of Transport, Awareness / Advantages / Incentives of Water Transportation
Problems in understanding questionnaire
34 21.09.15 Gorakhpur Rajiv Janta Transport
Transport /Supplier of Aggregates /Sand
Surveyed Cargo Volumes, Freight Costs , O/D Pairs Percentage Split of Transport, Awareness / Advantages / Incentives of Water Transportation
Co-operative
35 21.09.15 Kushinagar United Provinces Sugar Company Ltd
Sugar Producer Surveyed Cargo Volumes, Freight Costs , O/D Pairs Percentage Split of Transport, Awareness / Advantages / Incentives of Water Transportation
Reluctant to give information
36 21.09.15 Kushinagar Triveni Eng. And Industries Ltd
Sugar Producer Surveyed Cargo Volumes, Freight Costs , O/D Pairs Percentage Split of Transport, Awareness / Advantages / Incentives of Water Transportation
Co-operative
IWT Sector Development Strategy and Business Development Study for Capacity Augmentation of National Waterway 1 from Haldia to Allahabad 265
37 21.09.15 Kushinagar New Sugar Mills Sugar Producer Surveyed Cargo Volumes, Freight Costs , O/D Pairs Percentage Split of Transport, Awareness / Advantages / Incentives of Water Transportation
Co-operative
38 22.09.15 Allahabad (Naini) Michel Ganj
Indian Railways (Northern Railway Loco Siding)
Transportation of Cargo / Goods By Train
Surveyed Cargo Volumes, Freight Costs, O/D Pairs Co-operative
39 22.09.15 Gorakhpur Prashant Transport Transport /Supplier of Aggregates /Sand
Surveyed Cargo Volumes, Freight Costs , O/D Pairs Percentage Split of Transport, Awareness / Advantages / Incentives of Water Transportation
Reluctant to give information
40 22.09.15 Gorakhpur Jaiswal Transport Transport /Supplier of Aggregates /Sand
Surveyed Cargo Volumes, Freight Costs , O/D Pairs Percentage Split of Transport, Awareness / Advantages / Incentives of Water Transportation
Reluctant to give information
41 22.09.15 Gorakhpur U.P. Ballia Transport
Transport /Supplier of Aggregates /Sand
Surveyed Cargo Volumes, Freight Costs , O/D Pairs Percentage Split of Transport, Awareness / Advantages / Incentives of Water Transportation
Reluctant to give information
42 22.09.15 Gorakhpur Sangam Transport Transport /Supplier of Aggregates /Sand
Surveyed Cargo Volumes, Freight Costs , O/D Pairs Percentage Split of Transport, Awareness / Advantages / Incentives of Water Transportation
Problems in understanding questionnaire
43 22.09.15 Gorakhpur Bengali Transport Transport /Supplier of Aggregates /Sand
Surveyed Cargo Volumes, Freight Costs , O/D Pairs Percentage Split of Transport, Awareness / Advantages / Incentives of Water Transportation
Reluctant to give information
44 22.09.15 Allahabad Sargam
Sail (Warehouse) Storage Surveyed Cargo Volumes, Freight Costs , O/D Pairs Percentage Split of Transport, Awareness / Advantages / Incentives of Water Transportation
Very co-operative
Source: Consultants’ market survey, August-October 2015
IWT Sector Development Strategy and Business Development Study for Capacity Augmentation of National Waterway 1 from Haldia to Allahabad 266
Annex 2: Roadside Interviews to identify Truck Loads
Interviews at Toll Plaza: Dulagarh
Trucks (no) Cargo Origin Destination Distance (km) Volume (tons)
19 Container Kolaghat Haldia 18
11 Diesel Alampur Kolkata 12 kL
7 Chicken Granules U.P. Durgapur 475 20
7 Wire Dulagad Baruni 400 10
6 Iron U.P. Kashipur 1,000 20
5 Paper Karnataka Kolkata 2,200 20
5 Onion Rajgarh Dulagad 893 20
4 Onion Madras Dulagad 22
4 Gas Kolkata U.P. 1,000 12
3 Potatoes Bihar Howrah 20
3 Corn Purniya Durgapur 360 20
3 Rice Purniya Dulagad 475 15
2 Wire Nagaland Luberiya 18
1 Pulses Chattisgarh Durgi Para 850 20
1 Hindustan Surf Haldia Bihar 20
1 Chicken Granules Banagarh Dulagad 450 20
1 Container Nagaland Kanpur 13
1 Oil Tanker Kolkata U.P. 1,000 12
1 Corn Purniya Durgapur 360 12
1 Chemical Powder Durgapur AP 1,800 12
1 Crude Oil Howrah Barauni 575 10
1 Coca Cola Hajipur Kolkata 10
1 Corn Purniya Dulagad 475 8
1 Calisum Ankleswer Kasipur 2,100 6
1 Clothes Kolkata Patna 920 4
91 Total number of interviews
Date: 22-07-2015
Interviews at Toll Plaza: Dankuni
Trucks (no) Cargo Origin Destination Distance (km) Volume (tons)
10 Hero Bikes Delhi Kolkata 1,500 50 pc
7 Maida Patna Kolkata 750 20
7 Plastic Granules Kanpur Kolkata 1,700 15
5 Maruti Suzuki Cars Delhi Kolkata 1,550 8 cars
5 LPG Muradabad Paharpur 85 15
4 Hyundai Cars Delhi Kolkata 1,550 8
3 Iron Danapur Rajarhat 600 15
2 Chicken Granules Patna Mahnar 800 21
2 Paper Bulandnagar Durgapur 1,300 20
2 Wall Putty Jabalpur Kalyani 1,300 20
2 Maida Lalganj Kolkata 962 16
2 Crane Equipment Bihar Rajaghat 600 16
1 Paper Bihar Durgapur 1,300 20
1 Iron Danapur Kolkata 500 18
1 Iron Danapur Rajarhat 600 18
1 Cloth Ahmedabad Durgapur 2,200 16
1 Iron Patna Bengal 680 15
1 Iron Patna Rajarhat 600 15
1 Iron Patna Bangladesh Border 747 12
1 Shoe Materials Delhi Batanagar 1,650 11.5
59 Total number of interviews
Date: 28-07-2015
IWT Sector Development Strategy and Business Development Study for Capacity Augmentation of National Waterway 1 from Haldia to Allahabad 267
Interviews at Toll Plaza: Mecheda
Trucks (no) Cargo Origin Destination Distance (km) Volume (tons)
35 Indian Oil (empty) Patna Haldia 16
34 Fly Ash Mecheda Haldia
32 Plastic Granules Haldia Muzzaparnagar 1,650 50
30 Edible Oil (empty) Kolkata Haldia 16
24 Coal Haldia Orissa 420 20
19 Container Khidirpore Haldia
16 Cement (empty) Haldia Madhukunda 0
14 HP Gas Haldia Pharpur
10 Container Haldia Uttrakhand 12
10 Fly Ash Kolaghat Haldia
9 Container (empty) Haldia Khidirpore 0
7 Indian Oil Haldia Guwathi 34
7 Cement Madhukunda Haldia 20
7 Bharat Gas Haldia Kolkata
5 Cement Madhukunda Haldia 326 20
4 Coal (empty) Khragpur Haldia 0
4 Indian Oil Haldia Debra (Kolkata)
4 Steel Plates Haldia Dankuni
3 Coal Haldia Khragpur 17
3 Fly Ash (empty) Haldia Kolaghat 0
3 Gas (empty) Tirpai Haldia 0
3 HP Gas (empty) Kolkata Haldia 0
2 Indian Oil (empty) Jamshedpur Haldia 16
1 Cement Mirza Haldia 20
1 Chemical Tanker Haldia Kandla 20
1 Indian Oil Haldia Guwathi 16.5
1 Indian Oil (empty) Ara Haldia 16
1 Gas (empty) Kolaghat Haldia 0
1 General (empty) Kolaghat Haldia 0
1 Indian Oil Haldia Kolkata
292 Total number of interviews
Date: 23-07-2015
Source: Consultants’ Market Survey July – October 2015
IWT Sector Development Strategy and Business Development Study for Capacity Augmentation of National Waterway 1 from Haldia to Allahabad 268
Roadside interviews on NH-31 - Summary of commodities and tonnages, origins and destinations
Commodity Type No of Vehicles
Origin Destination Average Tonnage
Total Tonnage LCV 2-Axle 3-Axle MAV LCV 2-Axle 3-Axle MAV
Coal 58 Guwahati Odisa
4.5 9.4 13.5 18.0
1039.8
23 29 Guwahati Barh 835.4
Cement 94 Siliguri Kolkata 1261.8
47 Kolkata Guwahati 630.9
Rice and Wheat
99 305 Kolkata Siliguri 5032.9
484 49 47 115 Kolkata Guwahati 5342.2
363 Guwahati Siliguri 1624.2
58 Haryana Siliguri 1039.8
94 87 Punjab Guwahati 2821.6
58 Delhi 1039.8
130 UP/Allahabad Siliguri 2339.7
Crushed Stone and Flyash
58 Siliguri Farakka 1039.8
25 14 Siliguri Kolkata 493.0
87 Krishnagunj Farakka 815.6
Total 25,356.4
Roadside interviews on NH-31C - Summary of commodities and tonnages, origins and destinations
Commodity Type No of Vehicles
Origin Destination Average Tonnage
Total Tons LCV 2-Axle 3-Axle MAV LCV 2-Axle 3-Axle MAV
Coal 3 5 2 Kolkata
Nepal
4.5 9.4 13.5 18.0
84.7
7 14 Guwahati 157.8
Cement
3 Kolkata
Nepal
43.2
32 Guwahati 297.0
7 14 1 Shillong 172.2
5 Tripura 42.4
5 7 Lanka (Assam) 143.1
Rice and Wheat
3 Guwahati
Nepal
15.3
1 Kolkata 14.4
5 1 Falakata 56.8
1 Dalkhola 14.4
Total 1041.4
Source: Consultants’ Market Survey July – October 2015
IWT Sector Development Strategy and Business Development Study for Capacity Augmentation of National Waterway 1 from Haldia to Allahabad 269
Annex 3: Commodities identified in Haldia-Farakka NW-1 sector (tons)
Commodity Cargo volume
2014 Cargo volume
2015 Producer - Raniganj, W.B / User - Durgapur, Asansol, kolkata , W.B by road Flour Wheat ( Atta ) 60,000 60,000 Flour ( Maida ) 40,000 Cattle Feed 20,000 20,000 Producer - Raniganj, W.B / User - Burdwan , W.B by Roads Iron & Steel 40,000 40,000 Producer - Mejia,Bankura, W.B / User – Kolkata/Shalimar , W.B by Road and Rail Cement 1,620,000 1,920,000 Producer - Madhukunda, Purulia, W.B. / User – All W.B. by road and rail
- Sindri Cement Works, Dhanbad, Jharkhand / User - All Bihar by road and rail
Cement 24,000,000 24,000,000
Producer – Dankuni, Mogra, W.B / User – Jorhat, Tezpur, Tinsukia, Assam Fertilizers 200 200 Producer – Kolkata, W.B / User – Jorhat, Tinsukia, Assam, Rajasthan Fertilizers 200 200 Producer, Haldia,W.B.- Gajraula,U.P / User – Jammu, Kashmir, Haldia Raw materials/Insecticides 2,000 2,000 Producer cum Supplier – Kolkata, W.B. / User – Bhagalpur, Bihar by Road Agro Equipment and Spares 1,000 1,000 Producer cum Supplier – Kolkata, W.B. / User – Patna, Bihar by Road Agro Equipment and Spares 6,000 6,000
Order Supplier, Nalhati, W.B/Pakur,Jharkhand / User – Chittagong, Bangladesh Aggregates 120,000 300,000 Inland Barge Operator – Haldia / Users – Budge budge, Haldia port area, Namkhana, Kolkata Petroleum Products 230,000 250,000 Shipping Line (River Transporters only) – Kolkata, Haldia / Users – Upper Assam at NW2 ODcs ( Gen/Stat/Trafos etc) 5,000 2013: 4,000 Project Logistics and Retail Transporter (FTL)- Kolkata, Haldia / User - Tezpur, Jogigopha, Biswanath Chariali, Assam at NW2 via Indo-Bangla Protocol route Generator /Transformer, Metro Coaches, Reactor etc.)
0.20,000 2013: 1,000
ODC General Cargo 90,000 2013: 80,000
Forwarder and Terminal Operator : 5km dist within the port limit Location- Kolkata, Paradip Port, Bhubaneswar, Visakhapatnam Port, Kakinada Port, Krishnapatnam Port, Mangalore Port by road
Coal 4530,000 5550,000 Iron Ore 1290,000 2330,000 Fertilizer 1960,000 2000,000 Food grains and Other Bulk 2010,000 1650,000
Ship Agents, Forwarder, Terminal operator – Kolkata, Haldia / User – Indian Sub-continent, Asean South Containers 500,000 TEU 500,000 TEU Bulk 10,000,000 10,000,000 Project Cargo 1,000,000 1,000,000
Multimodal Integrated Supply Chain Solutions Provider : In Indian Coastal Waters by coastal vessels Containers 15,000 TEU 13,000 TEU
Customs Agent , Forwarder – NS dock / CFS, Kolkata / Users - Outside KoPT within 4 km Refractory Cargo 20,000 2013: 20,000 Shipping Agent - Kolkata Steel 30,000 2013: 20,000 General Cargo 80,000 2013: 50,000 Lime Stone 50,000 2013: 20,000 Coal 100,000 2013: 150,000 Trader - Kolkata / Users – Allahabad Lime Stone 3,000 3,000 Silica Sand 4,000 30,000
Source: Consultants’ Market Survey July – October 2015
IWT Sector Development Strategy and Business Development Study for Capacity Augmentation of National Waterway 1 from Haldia to Allahabad 270
Annex 4: Farakka-Munger Survey Information
Table 1: Patna region district-wise commodity survey (roads)
SN District (Origin)
Commodity Destination
1 Patna Steel Bars, Steel pipes, PVC Pipes, Dairy Products, Rice, Cement, Sand, Potato, Fruits, Paints, Stone chips etc.
Limited to state only
2 Bhojpur Rice mills, Wheat, Cement, Sand, Dairy Products UP and Bihar
3 Buxar Rice mills, Wheat, Sand, Potatoes, Brick kilns Bihar, West Bengal
4 Rohtas Rice production, Wheat, Vegetable oil/ghee Bihar, UP, West Bengal
5 Gaya Tools, CI castings, PVC pipes, Electric appliances like starters, pump sets etc, Batteries, Dry Paints, Charcoal dust, Bleaching pwdr etc.
Bihar, West Bengal
6 Nalanda Flour mills, Drinking Water plants, Masoor dal, rice mills Bihar, West Bengal
7 Darbhanga Utensils, Daal Mills, Agriculture machinery, Rice cultivation, Potato, Wheat
Bihar, Nepal
8 Samastipur Milk, Chicken feed, Agriculture machines, Wheat, Flour mills, Paint thinner, PVC storage tanks etc.
Bihar, West Bengal, Nepal
9 Mujafarpur Biscuit, flour mills, rice mills, Steel bars, Chicken feed, PVC Pipes, Drinking Water, Kurkure / Chips Packaging, Dairy products
National Level via Patna
10 Begusarai Carbon, Agricultural industries, Flour mills, Soya milk, Cattle feed, Tiles etc
Bihar, Nepal, West Bengal
11 Madhubani Brick kilns Bihar, Nepal
12 Chhapra Sone river sand Entire Northern Bihar
13 Siwan Sand Entire northern Bihar
14 Khagaria Sand, Cement, Rice, Wheat, Flour Etc. Entire northern Bihar Note: Most of the places presumably charge by road only Rs 4/ton-km Source: Consultants’ Market Survey July – October 2015
Source: Consultants’ Market Survey July – October 2015
Tractors waiting to cross Mokama Bridge
IWT Sector Development Strategy and Business Development Study for Capacity Augmentation of National Waterway 1 from Haldia to Allahabad 271
Annex 5: Monthly Cargo Movements (tons)
Table 1: Stone chips loading operations at railway stations, 2014-15
Month Pakur Bakudi Barharwa Mirzachowk Sahibganj (loading)
Sahibganj (unloading)
April 436,800 101,400 65,000 13,000 30,904 6,336
May 455,000 72,800 72,800 23,400 40,769 15,574
June 387,400 85,800 75,400 28,600 20,579 12,495
July 384,800 96,200 80,600 33,800 12,882 13,557
August 395,200 96,200 93,600 52,000 25,737 14,218
September 418,600 124,800 93,600 59,800 33,665 15,724
October 369,200 101,400 65,000 65,000 30,870 14,751
November 421,200 111,800 91,000 13,000 51,439 11,957
December 434,200 98,800 83,200 52,000 28,810 13,388
January 452,400 106,600 101,400 49,400 33,556 10,047
February 400,400 137,800 85,800 26,000 36,085 6,687
March 468,000 163,800 111,800 20,800 70,243 14,548
Total 5,023,200 1,297,400 1,019,200 436,800 415,539 149,282
Source: Consultants’ market survey, August-October 2015
Table 2: Coal and other commodities loading operations at railway stations, 2014-15
Month Pakur
Thermal Coal Pirpainti
Thermal Coal Mirzachowk Silica Sand
April 395,064 201,190 7,800
May 599,912 98,766 5,200
June 764,522 58,528 2,600
July 819,392 0 7,800
August 779,154 0 5,200
September 577,964 0 13,000
October 475,540 0 2,600
November 654,782 58,528 7,800
December 654,782 0 7,800
January 566,990 0 2,600
February 537,726 98,766 0
March 490,172 128,030 0
Total 7,316,000 643,808 62,400
Source: Consultants’ market survey, August-October 2015
IWT Sector Development Strategy and Business Development Study for Capacity Augmentation of National Waterway 1 from Haldia to Allahabad 272
Table 3: Coal shipped to Super Thermal Power Plants
Month Kahalgaon GHTL RTPP GNTB
April 577,964 58,528 215,822 51,212
May 490,172 160,952 164,610 62,186
June 453,592 354,826 87,792 65,844
July 314,588 230,454 190,216 87,792
August 351,168 285,324 120,714 84,134
September 340,194 201,190 120,714 106,082
October 592,596 186,558 120,714 80,476
November 570,648 117,056 117,056 47,554
December 647,466 296,298 204,848 62,186
January 632,834 274,350 204,848 146,320
February 497,488 248,744 226,796 32,922
March 493,830 223,138 230,454 18,290
Total 5,962,540 2,637,418 2,004,584 844,998
Source: Consultants’ market survey, August-October 2015
Table 4: Unloading of commodities at Bhagalpur railway station-2014-15
Month Cement Rice Wheat Fertilizer
April 20,800 5,200 2,600 0
May 28,600 5,200 5,200 5,200
June 26,000 10,400 5,200 5,200
July 10,400 7,800 13,000 5,200
August 15,600 13,000 15,600 5,200
September 20,800 18,200 5,200 5,200
October 15,600 13,000 7,800 2,600
November 13,000 15,600 10,400 2,600
December 15,600 7,800 5,200 5,200
January 26,000 7,800 2,600 2,600
February 18,200 5,200 7,800 0
March 31,200 7,800 7,800 2,600
Total 241,800 117,000 88,400 41,600
Source: Consultants’ market survey, August-October 2015
IWT Sector Development Strategy and Business Development Study for Capacity Augmentation of National Waterway 1 from Haldia to Allahabad 273
Annex 6: Rail and Road Connectivity at Sahibganj
IWT Sector Development Strategy and Business Development Study for Capacity Augmentation of National Waterway 1 from Haldia to Allahabad 274
Annex 7: Railway Freight Charges for Class 150-Type Commodity
Source: www.fois.indianrail.gov.in
Distance Rate per Ton from
Distance Rate per Ton from from to to from
1 125 212.7 901 950 1330.1
126 150 259.4 951 1000 1396.1
151 175 290.7 1001 1100 1529.4
176 200 325.1 1101 1200 1663.1
201 225 356.9 1201 1300 1796.1
226 250 391.1 1301 1400 1928.4
251 275 425.3 1401 1500 2060.7
276 300 459.0 1501 1625 2189.1
301 325 491.0 1626 1750 2357.6
326 350 524.1 1751 1875 2424.3
351 375 557.3 1876 2000 2585.9
376 400 591.0 2001 2125 2612.0
401 425 625.1 2126 2250 2765.6
426 450 658.8 2251 2375 2790.6
451 475 692.0 2376 2500 2937.5
476 500 726.6 2501 2625 2983.7
501 550 795.2 2626 2750 3125.7
551 600 863.1 2751 2875 3170.0
601 650 930.5 2876 3000 3307.8
651 700 997.5 3001 3125 3350.4
701 750 1065.2 3126 3250 3484.5
751 800 1131.5 3251 3375 3526.2
801 850 1197.9 3376 3500 3656.7
851 900 1264.1
IWT Sector Development Strategy and Business Development Study for Capacity Augmentation of National Waterway 1 from Haldia to Allahabad 275
Annex 8: Cost comparison of O/D pairs identified during through our market survey, calculated against potential O/D pairs channeled through Ghazipur
Note: Yellow-headed columns show the commodities of the O/D pairs which have any potential to be deviated via the NW-1; grey-headed columns show origins and destinations of the commodities (all of which are presently trucked on roads) and their associated costs (Rs/ton); green-headed columns show the possible multi-modal deviation with terminals, their associated costs (Rs/ton) and the percentage of costs below (-) or above (+) road transport; blue-headed columns show the recalculated multi-modal deviation through a multi-modal terminal at Ghazipur, their associated costs (Rs/ton) and the percentage of costs below (-) or above (+) road transport.
Source: Consultants’ market survey; recalculation by transport model
IWT Sector Development Strategy and Business Development Study for Capacity Augmentation of National Waterway 1 from Haldia to Allahabad 276
Annex 9: Potential Transhipment Cargo via Tribeni (MAC augmentation case, tons)
continued on next page