Page 1
Copyright © 2021 Tehran University of Medical Sciences. Published by Tehran University of Medical Sciences. This work is licensed under a Creative Commons Attribution-Noncommercial 4.0 International license (https://creativecommons.org/licenses/bync/4.0/). Non-commercial uses of the work are permitted, provided the original work is properly cited.
Journal of Biostatistics and Epidemiology
J Biostat Epidemiol. 2021;7(1):70-85
Original Article
Identifying the Dietary Patterns and Chronic Disease’s Effective Factors on the General
Health Condition of Tehran’s Opposite Gender Adult Twins in 2017
Pegah Hemmatyar1,*, Sahar Hemmatyar¹, Shahryar Eghtesadi1, Anahita Hoshyarrad2, Mahmoud Mahmoudi
Majdabadi3
1Department of Nutrition, Faculty of Medical Sciences and Technologies, Islamic Azad University, Science and Research Branch, Tehran, Iran. 2National Nutrition and Food Technology Research Institute, Shahid Beheshti University of Medical Sciences, Tehran, Iran. 3Department of Health Services, Faculty of Medical Sciences and Technologies, Islamic Azad University, Science and Research Branch, Tehran, Iran.
ARTICLE INFO ABSTRACT
Received 11.01.2021
Revised 13.02.2021
Accepted 05.03.2021
Published 15.03.2021
Key words:
Opposite gender twins;
Dietary patterns;
General health;
Factor analysis;
Birth weight
Introduction: The incidence of multiple births in the world has increased significantly .There are few
studies on the nutritional status of twins, to our knowledge, no study has been conducted in this field in
Iran. These are among many reasons that make this study, which aims to identify major dietary patterns
and Chronic Disease’s Effective Factors on the General Health Condition of Tehran’s Opposite Gender
Adult Twins, valuable. Materials and Methods: 128 people (64 pairs) of Opposite Gender Twins participated in this study. After
completing the general information questionnaires, International Physical Activity, Semi-quantitative food
frequency, and general health, anthropometric indices, and their blood pressure were measured. Dietary
patterns were identified by factor analysis. The relationship between dietary patterns and factors affecting
chronic diseases with general health was calculated using the logistic regression method. Results: Two western and healthy dietary patterns were identified. There was a significant relationship
between the Western dietary pattern and age, gender, and father's education. Twin participants who scored
higher in a quarter of the Western dietary pattern were younger than those with lower scores, with men
increasing and women decreasing. There was a significant difference in the distribution of healthy dietary
pattern with age, economic status, and systolic blood pressure. An increasing relationship was observed in
age. The results showed that in first Twins, only Birth Weight, and Physical Activity, whereas, in second
Twins besides Birth Weight, gender and Marital status were among the most significant factors in
determining the general health of participants.
Conclusion: The present study shows that there are two major dietary patterns: healthy and western. The
Western dietary pattern has the most variance and this indicates the nutritional transition and prevalence of
the Western dietary pattern in Iran. The main finding of this study is the association of birth weight with
general health in both twins. Birth weight is directly related to health. Those with low birth weight have
more health problems in contrast to those with normal birth weight.
* . Corresponding Author Email: [email protected]
Page 2
Hemmatyar P et al. Vol 7 No 1 (2021)
Identifying the Dietary Patterns and Chronic Disease’s Effective Factors on the General Health Condition
71
Introduction
Over the past two decades, the rate of multiple
births has increased dramatically. One of the
most important factors in this process is using
infertility treatments. In addition, women over
the age of 30 are more likely to give birth to
twins, and the number of women giving birth at
this age is increasing (1-6). According to the
population database of the Civil Registration
Organization in Iran in 1994, about 3% of births
were twins.
In previous studies, this group was largely
neglected, in contrast to the point that being twin
itself is a condition that slows fetal growth, due
to the competition for the same nutritional
source, which in turn causes metabolic
abnormalities in Twins (7-8). It is important to
note that low birth weight alone is not the cause
of disease and other factors and variables also
play a role in causing diseases, such as diet,
genetic and biological factors like intrauterine
environment, maternal mental state during
pregnancy, child-rearing method, education,
childhood and adolescence environment,
childhood experience, pollution, socio-
economic aspects of the family, food consumed
at home, method of cooking, parental behaviors
(9-10). In many studies, these factors are
presented and considered as confounding
variables, many of which are uncontrollable, but
by studying the community of twins, we can
largely control these factors because most of the
preceding factors are similar between twins. By
studying twins, it is relatively easy to compare
the environmental factors that are common and
those that are not (including different friends and
anything else) among them and observe the role
of those factors (11-13).
By changing lifestyle from traditional to
western, Iran is experiencing a rapid nutritional
transition that has simultaneously led to an
increase in problems with chronic diet-related
illnesses. Determining food consumption
patterns is a useful guide for educating people,
promoting food literacy and nutrition policies,
and helps researchers to understand better the
existing patterns and their relationship to disease
risk factors. The American Dietetic Association
also suggests that in healthy eating messages to
people, the emphasis should be on dietary
patterns instead of foods or meals (14-17). Given
that the incidence of twins is increasing thus, in
this context the study of Iranian twins diet in
terms of geographical differences and especially
cultural differences that can lead to the
separation of Opposite Gender twins in Iran
(including school, friends, room, etc) is
important and all of which has a unique feature
to study.
The study of twins is a promising clue for
researchers to identify the role of genetics and
the effect of nutrition and can provide valuable
data about the etiology of diseases and the
effectiveness in their control and management.
However, extensive studies will be needed in the
future to identify the mechanisms of these
observations (18). We hope that this study is the
first stepping-stone to further studies in this field
and the results might be useful in reducing the
burden of disease and costs in this group.
Materials and Methods
This cross-sectional study was performed
randomly (based on the phone numbers provided
to us by the Iranian Twins Association) on 128
(64 pairs) adult opposite gender twins in Tehran
who came to the Iranian Twins and Multiples
Association in 2017.
The weight was measured with the least clothes
on, without shoes using a German digital scale
(beurer) with an accuracy of 100grams. The
height was measured with the standing gauge.
Participants were standing barefoot and their
shoulders were in a normal position. With an
accuracy of 0.5 cm, Body mass index was
Page 3
Hemmatyar P et al. Vol 7 No 1 (2021)
Identifying the Dietary Patterns and Chronic Disease’s Effective Factors on the General Health Condition
72
calculated based on the simple formula of kg/m2
where kg stands for a person's weight in
kilograms and m2 is their height in square
meters. Blood pressure and heartbeat were
measured by a German Digital
sphygmomanometer (beurer). The device was
placed on the upper arm and the participants
were sitting in a relaxed position.
General information including age, birth order
(either first or second twins), sex, birth
weight(obtained by asking mothers or referring
to the health document), occupation, economic
status, education, parental education, marital
status, years of twins living together(Which
were qualitatively divided into three groups:
low, medium and high), smoking, history of
various diseases such as: gastrointestinal,
cancer, kidney, liver, diabetes, Thyroid, etc.
were collected through a general questionnaire
during an interview.
Usual dietary intakes were collected using a
semi-quantitative food frequency questionnaire
(FFQ) over the past year. The food frequency
questionnaire included a list of 147 foods with a
standard size of each food, and individuals
expressed their frequent consumption of each
food according to the standard size during the
last year. This method to determine dietary
patterns has been used and validated in previous
studies by Esmailzadeh, Azadbakht, Mirmiran et
al (19-20). Then the mentioned amounts of each
food were converted to grams per day using the
manual home scales (21). In order to identify
dietary patterns and to reduce the complexity of
the data, initially, 147 food items were classified
into 28 pre-defined food groups based on
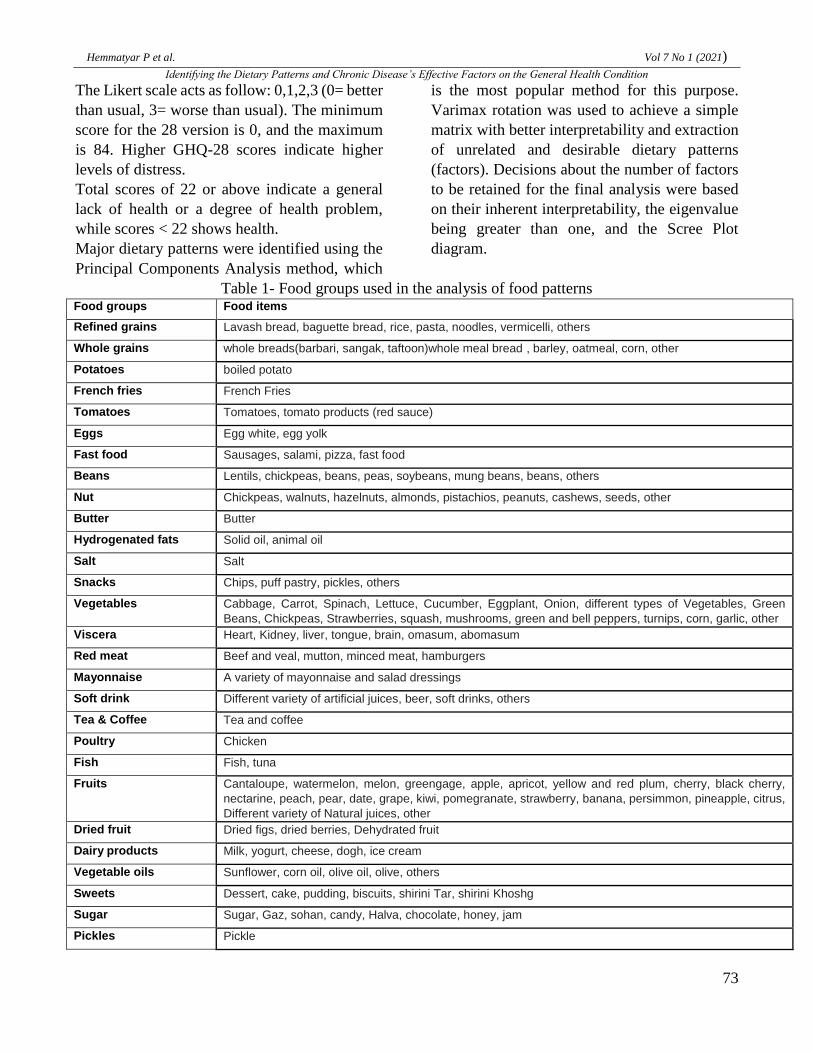
previous studies (Table 1) (22-25).
Physical activity was assessed using the IPAQ
(International Physical Activity Questionnaires).
This questionnaire has been used in various
studies in many countries and its validity and
reliability have been confirmed (26-31).
This questionnaire is prepared in a way that is
reported based on the intensity of physical
activity MET (Metabolic Equivalents) over the
past week. It includes 7 short questions which
was used to collect the number of physical
activities other than daily routine activities.
General health was assessed using the GHQ28
(General Health Questionnaire). Goldberg first
developed this questionnaire in 1972. The main
original form has 60 questions and its short
version from12 to 28 questions. The 28-question
version has more validity and better sensitivity
and specificity (32-33). They have been
prepared and translated into 38 languages and
psychometric studies have been performed on it
in 70 countries. The test evaluates a person's
symptoms from one month before the test.
This questionnaire is one of the mental health
tools that is widely used in the field of
psychometric quality assessment and bears
acceptable validity and reliability in scientific
societies among which Iran is the one (34-35).
In this version, the questions are classified as
follows: first, some are about physical
symptoms, second about anxiety and sleep
disorders, third the symptoms of Social
functioning (ability to do daily tasks and
decision-making power) and finally Depression
symptoms (hopelessness and suicidal thoughts).
Statistical analysis of data was performed using
SPSS software version 19. The questionnaire of
physical activity and general health were also
analyzed according to their established
guidelines as follows:
For physical activity, the metabolic equations of
MET are calculated (MET for walking is 3.3, for
moderate activity is 4, and for vigorous activity
is 8), which is multiplied in minutes and number
of days of doing those activities. Finally, the sum
of total activities, is obtained.
The general health questionnaire is scored in
different ways, each of which has its own
application in research and clinical studies. The
most common scoring method is the Likert type.
In our study, the Likert scoring method has been
used.
Page 4
Hemmatyar P et al. Vol 7 No 1 (2021)
Identifying the Dietary Patterns and Chronic Disease’s Effective Factors on the General Health Condition
73
The Likert scale acts as follow: 0,1,2,3 (0= better
than usual, 3= worse than usual). The minimum
score for the 28 version is 0, and the maximum
is 84. Higher GHQ-28 scores indicate higher
levels of distress.
Total scores of 22 or above indicate a general
lack of health or a degree of health problem,
while scores < 22 shows health.
Major dietary patterns were identified using the
Principal Components Analysis method, which
is the most popular method for this purpose.
Varimax rotation was used to achieve a simple
matrix with better interpretability and extraction
of unrelated and desirable dietary patterns
(factors). Decisions about the number of factors
to be retained for the final analysis were based
on their inherent interpretability, the eigenvalue
being greater than one, and the Scree Plot
diagram.
Table 1- Food groups used in the analysis of food patterns Food items Food groups
Lavash bread, baguette bread, rice, pasta, noodles, vermicelli, others Refined grains
whole breads(barbari, sangak, taftoon)whole meal bread , barley, oatmeal, corn, other Whole grains
boiled potato Potatoes
French Fries French fries
Tomatoes, tomato products (red sauce) Tomatoes
Egg white, egg yolk Eggs
Sausages, salami, pizza, fast food Fast food
Lentils, chickpeas, beans, peas, soybeans, mung beans, beans, others Beans
Chickpeas, walnuts, hazelnuts, almonds, pistachios, peanuts, cashews, seeds, other Nut
Butter Butter
Solid oil, animal oil Hydrogenated fats
Salt Salt
Chips, puff pastry, pickles, others Snacks
Cabbage, Carrot, Spinach, Lettuce, Cucumber, Eggplant, Onion, different types of Vegetables, Green
Beans, Chickpeas, Strawberries, squash, mushrooms, green and bell peppers, turnips, corn, garlic, other
Vegetables
Heart, Kidney, liver, tongue, brain, omasum, abomasum Viscera
Beef and veal, mutton, minced meat, hamburgers Red meat
A variety of mayonnaise and salad dressings Mayonnaise
Different variety of artificial juices, beer, soft drinks, others Soft drink
Tea and coffee Tea & Coffee
Chicken Poultry
Fish, tuna Fish
Cantaloupe, watermelon, melon, greengage, apple, apricot, yellow and red plum, cherry, black cherry,
nectarine, peach, pear, date, grape, kiwi, pomegranate, strawberry, banana, persimmon, pineapple, citrus,
Different variety of Natural juices, other
Fruits
Dried figs, dried berries, Dehydrated fruit Dried fruit
Milk, yogurt, cheese, dogh, ice cream Dairy products
Sunflower, corn oil, olive oil, olive, others Vegetable oils
Dessert, cake, pudding, biscuits, shirini Tar, shirini Khoshg Sweets
Sugar, Gaz, sohan, candy, Halva, chocolate, honey, jam Sugar
Pickle Pickles
Page 5
Hemmatyar P et al. Vol 7 No 1 (2021)
Identifying the Dietary Patterns and Chronic Disease’s Effective Factors on the General Health Condition
74
In this study, factor loading greater than 0.2 were
considered to determine food groups in each
food pattern.
Factor load indicates the correlation between a
food group with each food pattern, and larger
loadings indicate greater correlation and a
positive or negative sign indicates a direct or
inverse relationship between that group and the
dietary pattern. The dietary score of the
individuals was calculated separately for each
template according to the amount of food
consumed from each food group in that
template. Factor scores were categorized as
quartiles for each dietary pattern. Then, the
logistic regression analysis was used to calculate
the odds ratios (ORs) and 95% confidence
interval for a degree of health problem related to
dietary patterns and Chronic Disease’s Effective
Factors.
All values are reported as mean ± quantitative
deviation for quantitative variables and as a
percentage for qualitative variables; Chi-square
test was used to compare the qualitative
variables between the quarters of each dietary
pattern. For quantitative variables, one-way
ANOVA analysis was used. If a one-way
analysis of variance was significant, the Tukey
test was used to facilitate the comparison of the
two groups.
Results
The mean and standard deviation of the age of
the participants was 32 ± 12 years. Two major
dietary patterns which are extracted by the use of
principle component analysis are presented in
table 2. Dietary patterns were named based on
the food groups in the factors. The factor loading
of the food groups are listed separately by the
food pattern. Higher factor loading are the
expression of the greater share of that food group
in the dietary pattern. The first model was named
"Western dietary pattern" with a variance of
9.88% and the second pattern was named
"healthy dietary pattern" with a variance of
8.53%.
The Western dietary pattern includes: refined
grains, whole grains, potatoes, French fries,
eggs, fast food, beans, butter, salt, snacks, red
meat, mayonnaise, soft drinks, dairy products,
sweets, sugar, pickles, and the healthy dietary
pattern included: tomatoes, nuts, vegetables,
fish, fruits, vegetable oils and low consumption
of foods such as fried potatoes, fast food, butter,
hydrogenated fats, salty snacks, and poultry. The
two extracted dietary patterns accounted for
18.41% of the total variance of the population.
Factor scores were categorized as quartiles for
each dietary pattern. The characteristics of the
participants in terms of different quarters of
known dietary patterns are listed in Table 3.
Gender differences were observed in the
distribution of the Western dietary pattern
scores. The participants in the top quartile of the
Western dietary pattern were significantly more
likely to be male compare to participants in the
lowest quartile(p=0.001). Participants in the
highest quarters of the Western dietary pattern
were younger than those in the lowest quarters
(p=0.03). Participants in the upper quartiles of
the Western dietary pattern were more likely to
have more educated father than those in the
lowest quartiles(p=0.04).
In addition, age was inversely related to the
Western dietary pattern and positively correlated
with the healthy dietary pattern. Those who
scored higher in the quarters of a healthy dietary
pattern had higher systolic blood pressure but
just until the third quarter (p=0.04). Also,
participants in the highest quartiles of the
healthy dietary patterns had a better economic
status (p=0.03).
Odds ratios (ORs) and 95% confidence intervals
for the degree of health problem associated with
the identified dietary patterns are given in Table
4. No significant relationship was observed
between dietary patterns obtained from factor
analysis and general health in the observed
twins.
Page 6
Hemmatyar P et al. Vol 7 No 1 (2021)
Identifying the Dietary Patterns and Chronic Disease’s Effective Factors on the General Health Condition
75
Table 2- Factor load of food groups in extracted food patterns
Dietary pattern Food groups
healthy western
0.49 Refined grains
0.36 Whole grains
0.23 Potatoes
-0.21 0.34 French fries
0.55 Tomatoes
0.41 Eggs
-0.35 0.41 Fast food
0.58 Beans
0.53 0.33 Nuts
-0.35 0.31 Butter
-0.22 Hydrogenated fats
0.22 Salt
-0.28 0.33 Snacks
0.69 Vegetables
Viscera
0.28 Red meat
0.62 Mayonnaise
0.36 Soft drink
Tea & Coffee
-0.28 Poultry
0.37 0.28 Fish
0.53 Fruits
0.37 Dried fruit
0.28 Dairy products
0.27 Vegetable oils
0.27 0.38 Sweets
0.22 Sugar
0.40 Pickles
8.537 9.882 Variance
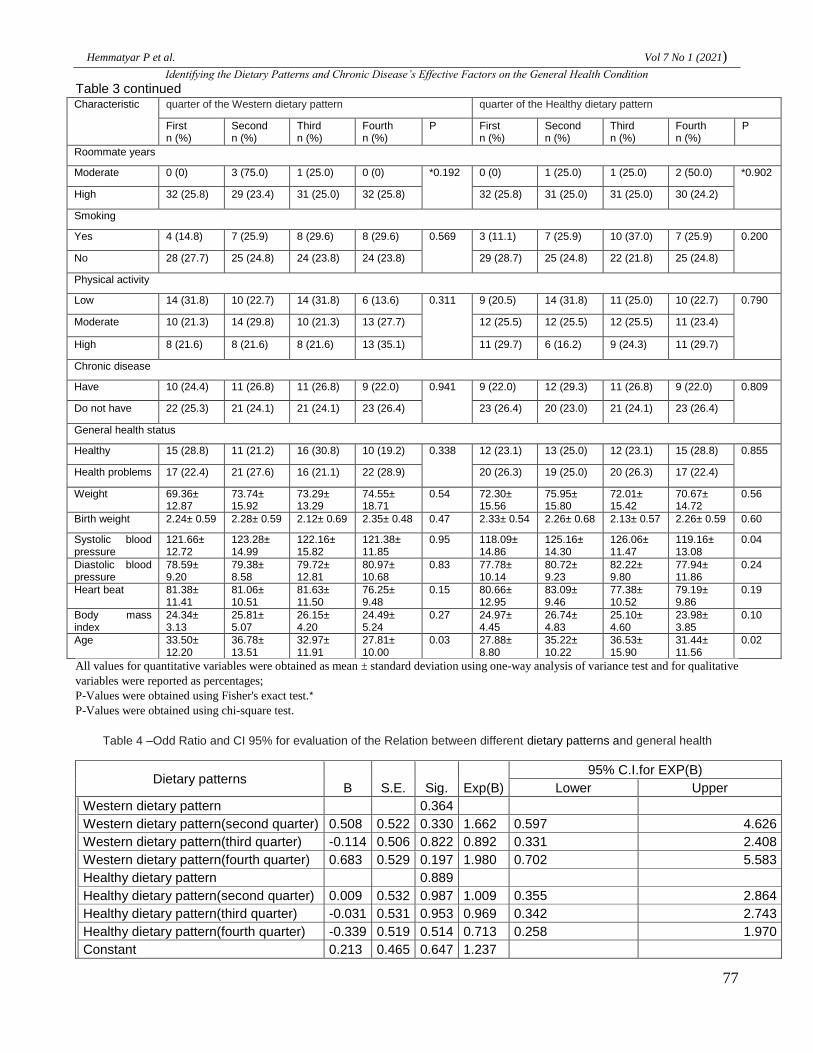
Table 3- Demographic and clinical characteristics of twins according to the quarters of food patterns
quarter of the Healthy dietary pattern quarter of the Western dietary pattern Characteristic
P Fourth n (%)
Third n (%)
Second n (%)
First n (%)
P Fourth n (%)
Third n (%)
Second n (%)
First n (%)
Gender
0.251 14 (22.2) 18 (28.6) 12 (19.0) 19 (30.2) 0.001 25 (39.7) 14 (22.2) 14 (22.2) 10 (15.9) Male
18 (27.7) 14 (21.5) 20 (30.8) 13 (20.0) 7 (10.8) 18 (27.7) 18 (27.7) 22 (33.8) Female
Page 7
Hemmatyar P et al. Vol 7 No 1 (2021)
Identifying the Dietary Patterns and Chronic Disease’s Effective Factors on the General Health Condition
76
quarter of the Healthy dietary pattern quarter of the Western dietary pattern Characteristic
P Fourth n (%)
Third n (%)
Second n (%)
First n (%)
P Fourth n (%)
Third n (%)
Second n (%)
First n (%)
Marital status
0.374 22 (26.5) 19 (22.9) 18 (21.7) 24 (28.9) 0.513 24 (28.9) 21 (25.3) 19 (22.9) 19 (22.9) Single
10 (22.2) 13 (28.9) 14 (31.1) 8 (17.8) 8 (17.8) 11 (24.4) 13 (28.9) 13 (28.9) Married
Education
0.315 11 (22.0) 11 (22.0) 11 (22.0) 17 (34.0) 0.051 18 (36.0) 14 (28.0) 10 (20.0) 8 (16.0) High school Diploma
21 (26.9) 21 (26.9) 21 (26.9) 15 (19.2) 14 (17.9) 18 (23.1) 22 (28.2) 24 (30.8) University degree
Father's education
0.623 26 (27.7) 22 (23.4) 22 (23.4) 24 (25.5) 0.042 20 (21.3) 20 (21.3) 28 (29.8) 26 (27.7) High school Diploma
6 (17.6) 10 (29.4) 10 (29.4) 8 (23.5) 12 (35.3) 12 (35.3) 4 (11.8) 6 (17.6) University degree
Mother's education
0.297 26 (25.0) 23 (22.1) 29 (27.9) 26 (25.0) 0.297 23 (22.1) 26 (25.0) 29 (27.9) 26 (25.0) High school Diploma
6 (25.0) 9 (37.5) 3 (12.5) 6 (25.0) 9 (37.5) 6 (25.0) 3 (12.5) 6 (25.0) University degree
Separation of parents
*0.781 5 (35.7) 2 (14.3) 4 (28.6) 3 (21.4) *0.195 2 (14.3) 3 (21.4) 7 (50.0) 2 (14.3) Yes
27 (23.7) 30 (26.3) 28 (24.6) 29 (25.4) 30 (26.3) 29 (25.4) 25 (21.9) 30 (26.3) No
Employed
0.430 14 (23.3) 13 (21.7) 19 (31.7) 14 (23.3) 0.800 15 (25.0) 15 (25.0) 17 (28.3) 13 (21.7) Yes
18 (26.5) 19 (27.9) 13 (19.1) 18 (26.5) 17 (25.0) 17 (25.0) 15 (22.1) 19 (27.9) No
Job
0.218 18 (27.3) 18 (27.3) 12 (18.2) 18 (27.3) 0.738 17 (25.8) 17 (25.8) 14 (21.2) 18 (27.3) Unemployed
11 (28.9) 7 (18.4) 14 (36.8) 6 (15.8) 9 (23.7) 7 (18.4) 13 (34.2) 9 (23.7) Employee or retired
3 (12.5) 7 (29.2) 6 (25.0) 8 (33.3) 6 (25.0) 8 (33.3) 5 (20.8) 5 (20.8) On one's own
Economic situation
0.037 3 (10.0) 14 (46.7) 6 (20.0) 7 (23.3) 0.564 9 (30.0) 7 (23.3) 9 (30.0) 5 (16.7) Low
9 (23.7) 6 (15.8) 11 (28.9) 12 (31.6) 8 (21.1) 12 (31.6) 6 (15.8) 12 (31.6) Moderate
20 (33.3) 12 (20.0) 15 (25.0) 13 (21.7) 15 (25.0) 13 (21.7) 17 (28.3) 15 (25.0) High
Page 8
Hemmatyar P et al. Vol 7 No 1 (2021)
Identifying the Dietary Patterns and Chronic Disease’s Effective Factors on the General Health Condition
77
Table 3 continued quarter of the Healthy dietary pattern quarter of the Western dietary pattern Characteristic
P Fourth n (%)
Third n (%)
Second n (%)
First n (%)
P Fourth n (%)
Third n (%)
Second n (%)
First n (%)
Roommate years
*0.902 2 (50.0) 1 (25.0) 1 (25.0) 0 (0) *0.192 0 (0) 1 (25.0) 3 (75.0) 0 (0) Moderate
30 (24.2) 31 (25.0) 31 (25.0) 32 (25.8) 32 (25.8) 31 (25.0) 29 (23.4) 32 (25.8) High
Smoking
0.200 7 (25.9) 10 (37.0) 7 (25.9) 3 (11.1) 0.569 8 (29.6) 8 (29.6) 7 (25.9) 4 (14.8) Yes
25 (24.8) 22 (21.8) 25 (24.8) 29 (28.7) 24 (23.8) 24 (23.8) 25 (24.8) 28 (27.7) No
Physical activity
0.790 10 (22.7) 11 (25.0) 14 (31.8) 9 (20.5) 0.311 6 (13.6) 14 (31.8) 10 (22.7) 14 (31.8) Low
11 (23.4) 12 (25.5) 12 (25.5) 12 (25.5) 13 (27.7) 10 (21.3) 14 (29.8) 10 (21.3) Moderate
11 (29.7) 9 (24.3) 6 (16.2) 11 (29.7) 13 (35.1) 8 (21.6) 8 (21.6) 8 (21.6) High
Chronic disease
0.809 9 (22.0) 11 (26.8) 12 (29.3) 9 (22.0) 0.941 9 (22.0) 11 (26.8) 11 (26.8) 10 (24.4) Have
23 (26.4) 21 (24.1) 20 (23.0) 23 (26.4) 23 (26.4) 21 (24.1) 21 (24.1) 22 (25.3) Do not have
General health status
0.855 15 (28.8) 12 (23.1) 13 (25.0) 12 (23.1) 0.338 10 (19.2) 16 (30.8) 11 (21.2) 15 (28.8) Healthy
17 (22.4) 20 (26.3) 19 (25.0) 20 (26.3) 22 (28.9) 16 (21.1) 21 (27.6) 17 (22.4) Health problems
0.56 70.67± 14.72
72.01± 15.42
75.95± 15.80
72.30± 15.56
0.54 74.55± 18.71
73.29± 13.29
73.74± 15.92
69.36± 12.87
Weight
0.60 2.26± 0.59 2.13± 0.57 2.26± 0.68 2.33± 0.54 0.47 2.35± 0.48 2.12± 0.69 2.28± 0.59 2.24± 0.59 Birth weight
0.04 119.16± 13.08
126.06± 11.47
125.16± 14.30
118.09± 14.86
0.95 121.38± 11.85
122.16± 15.82
123.28± 14.99
121.66± 12.72
Systolic blood pressure
0.24 77.94± 11.86
82.22± 9.80
80.72± 9.23
77.78± 10.14
0.83 80.97± 10.68
79.72± 12.81
79.38± 8.58
78.59± 9.20
Diastolic blood pressure
0.19 79.19± 9.86
77.38± 10.52
83.09± 9.46
80.66± 12.95
0.15 76.25± 9.48
81.63± 11.50
81.06± 10.51
81.38± 11.41
Heart beat
0.10 23.98± 3.85
25.10± 4.60
26.74± 4.83
24.97± 4.45
0.27 24.49± 5.24
26.15± 4.20
25.81± 5.07
24.34± 3.13
Body mass index
0.02 31.44± 11.56
36.53± 15.90
35.22± 10.22
27.88± 8.80
0.03 27.81± 10.00
32.97± 11.91
36.78± 13.51
33.50± 12.20
Age
All values for quantitative variables were obtained as mean ± standard deviation using one-way analysis of variance test and for qualitative
variables were reported as percentages;
P-Values were obtained using Fisher's exact test.*
P-Values were obtained using chi-square test.
nd general healthdietary patterns aOdd Ratio and CI 95% for evaluation of the Relation between different –Table 4
Dietary patterns B S.E. Sig. Exp(B)
95% C.I.for EXP(B)
Lower Upper Western dietary pattern 0.364
Western dietary pattern(second quarter) 0.508 0.522 0.330 1.662 0.597 4.626
Western dietary pattern(third quarter) -0.114 0.506 0.822 0.892 0.331 2.408
Western dietary pattern(fourth quarter) 0.683 0.529 0.197 1.980 0.702 5.583
Healthy dietary pattern 0.889
Healthy dietary pattern(second quarter) 0.009 0.532 0.987 1.009 0.355 2.864
Healthy dietary pattern(third quarter) -0.031 0.531 0.953 0.969 0.342 2.743
Healthy dietary pattern(fourth quarter) -0.339 0.519 0.514 0.713 0.258 1.970
Constant 0.213 0.465 0.647 1.237
Page 9
Hemmatyar P et al. Vol 7 No 1 (2021)
Identifying the Dietary Patterns and Chronic Disease’s Effective Factors on the General Health Condition
78
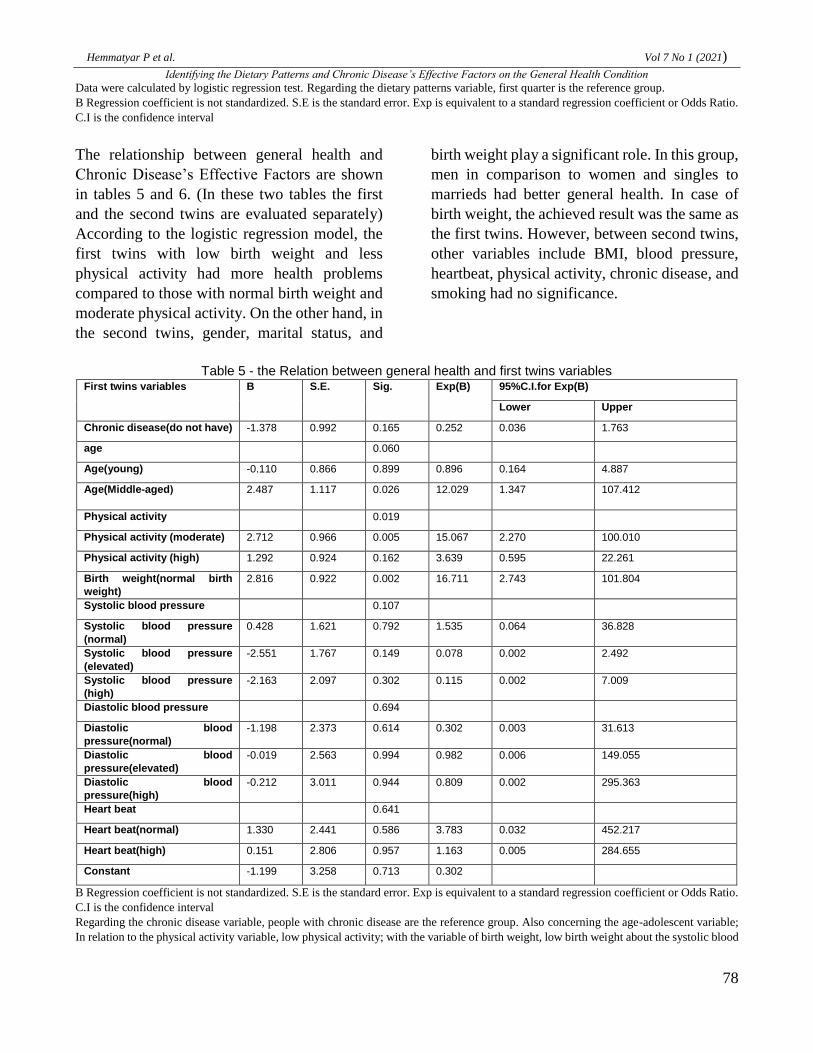
Data were calculated by logistic regression test. Regarding the dietary patterns variable, first quarter is the reference group.
B Regression coefficient is not standardized. S.E is the standard error. Exp is equivalent to a standard regression coefficient or Odds Ratio.
C.I is the confidence interval
The relationship between general health and
Chronic Disease’s Effective Factors are shown
in tables 5 and 6. (In these two tables the first
and the second twins are evaluated separately)
According to the logistic regression model, the
first twins with low birth weight and less
physical activity had more health problems
compared to those with normal birth weight and
moderate physical activity. On the other hand, in
the second twins, gender, marital status, and
birth weight play a significant role. In this group,
men in comparison to women and singles to
marrieds had better general health. In case of
birth weight, the achieved result was the same as
the first twins. However, between second twins,
other variables include BMI, blood pressure,
heartbeat, physical activity, chronic disease, and
smoking had no significance.
Table 5 - the Relation between general health and first twins variables
95%C.I.for Exp(B) Exp(B) Sig. S.E. B First twins variables
Upper Lower
1.763 0.036 0.252 0.165 0.992 -1.378 Chronic disease(do not have)
0.060 age
4.887 0.164 0.896 0.899 0.866 -0.110 Age(young)
107.412 1.347 12.029 0.026 1.117 2.487 Age(Middle-aged(
0.019 Physical activity
100.010 2.270 15.067 0.005 0.966 2.712 Physical activity (moderate)
22.261 0.595 3.639 0.162 0.924 1.292 Physical activity (high)
101.804 2.743 16.711 0.002 0.922 2.816 Birth weight(normal birth
weight)
0.107 Systolic blood pressure
36.828 0.064 1.535 0.792 1.621 0.428 Systolic blood pressure
(normal)
2.492 0.002 0.078 0.149 1.767 -2.551 Systolic blood pressure
(elevated)
7.009 0.002 0.115 0.302 2.097 -2.163 Systolic blood pressure
(high)
0.694 Diastolic blood pressure
31.613 0.003 0.302 0.614 2.373 -1.198 Diastolic blood
pressure(normal)
149.055 0.006 0.982 0.994 2.563 -0.019 Diastolic blood
pressure(elevated)
295.363 0.002 0.809 0.944 3.011 -0.212 Diastolic blood
pressure(high)
0.641 Heart beat
452.217 0.032 3.783 0.586 2.441 1.330 Heart beat(normal)
284.655 0.005 1.163 0.957 2.806 0.151 Heart beat(high)
0.302 0.713 3.258 -1.199 Constant
B Regression coefficient is not standardized. S.E is the standard error. Exp is equivalent to a standard regression coefficient or Odds Ratio.
C.I is the confidence interval
Regarding the chronic disease variable, people with chronic disease are the reference group. Also concerning the age-adolescent variable;
In relation to the physical activity variable, low physical activity; with the variable of birth weight, low birth weight about the systolic blood
Page 10
Hemmatyar P et al. Vol 7 No 1 (2021)
Identifying the Dietary Patterns and Chronic Disease’s Effective Factors on the General Health Condition
79
pressure variable, low systolic blood pressure; In relation to diastolic blood pressure variable, low diastolic blood pressure and in relation
to heart rate variable, low heart rate is the reference group.
Table 6 - the Relation between general health and second twins variables
95%C.I.for Exp(B) Exp(B) Sig. S.E. B Second twins variables
Upper Lower
0.591 0.054 0.178 0.005 0.611 -1.723 Gender(female)
0.744 0.068 0.224 0.015 0.612 -1.496 Marital status(married)
7.981 0.001 0.572 2.077 Constant
67.147 2.666 13.380 0.002 0.823 2.594 Birth weight(normal birth
weight)
7.503 0.058 1.062 2.015 Constant
B Regression coefficient is not standardized. S.E is the standard error. Exp is equivalent to a standard regression coefficient or Odds Ratio.
C.I is the confidence interval
For the gender variable, men are the reference group and for the marital status variable, singles are the reference group. In the case of the
birth weight variable, the low birth weight is the reference group.
Discussion
The present study identified the Dietary Pattern
and Chronic Disease’s Effective Factors on the
General Health Condition of Tehran’s opposite
Gender Adult Twins in 2017. Two dietary
patterns extracted using PCA included the
healthy dietary pattern and the Western dietary
pattern. The healthy dietary pattern is mostly
based on fruits, vegetables, liquid oil, and the
western dietary pattern is mostly characterized
by the higher intake of meat, processed foods,
solid fat, and sweets. In this study, low
consumption of poultry in healthy dietary
pattern was unexpected. But maybe the reason is
that the participants fried their poultry. And this
is one of the limitations of those studies that use
FFQ and PCA, which do not consider the life
style.
The study of the diets of twins is very limited. In
Iran, to our knowledge, no study has been done
on the diets of opposite-gender twins and no
report is available, so it is not possible to cite and
compare with previous research in the country.
Mentioning and analyzing several relevant and
noteworthy studies on the twins' dietary patterns
can be valuable.
The patterns obtained in our study are similar to
the food patterns extracted in the Bree and Berg
studies (36-37).
Bree et al. (36) in a study of the American male
and female twins over the age of 50, identified
two major dietary patterns: 1- Unhealthy diet
with high consumption of fat, salt, and sugar and
2- Healthy dietary including fruits, vegetables,
fish, dairy and so on. Berg et al. (37) conducted
a study on male twins aged 19 to 92 years old
who were asked to consume fruits, vegetables,
fruit juices, fish, unhealthy snacks, fast food, and
beverages. A healthy and unhealthy dietary
pattern were suggested by factor analysis.
On the other hand, there are different studies
done on twins’ major dietary patterns such as
Teucher et al. (38). In a prospective study of
female twins aged 18 to 79 years in England,
they identified 5 main dietary patterns: 1. Fruits
and vegetables, 2. High alcohol consumption, 3.
Traditional English, 4. Dietary, and 5. Low meat
consumption. Moreover, the other one is
Pallister et al. (39) they in a study of English
twins who filled out their food questionnaire
online, identified 4 food patterns: 1. Fruits and
vegetables 2. Distinctive taste 3. High sweetness
and carbohydrates 4. Meat. The other one is
Keskitalo et al. (40). The researchers identified
four dietary factors: 1. Healthy foods, 2. Fat-rich
foods, 3. Sweet foods, and 4. Meats.
Since there is no similar study done in Iranian
twins, it is also possible to compare our study
with previous studies in which they determined
Page 11
Hemmatyar P et al. Vol 7 No 1 (2021)
Identifying the Dietary Patterns and Chronic Disease’s Effective Factors on the General Health Condition
80
the major dietary patterns by factor analysis in
other observed groups. For example, Haddad
Tabrizi et al. identified two desirable and
undesirable dietary patterns among non-
postmenopausal women (24). Similarly,
Rezazadeh et al., in a study on adult women in
Tehran in 2007, identified two healthy and
unhealthy dietary patterns (23).
As can be deduced from the dietary patterns
extracted in various studies as well as our study,
the healthy dietary pattern and the western
dietary pattern( Although the names differ in
different studies, the nutrient content of the
patterns mostly indicate these two patterns) are
not just the major and exclusive patterns of the
twins. Most studies in adults ("Twins" and
"singleton") have reached these patterns as well
(41-43).
At the end of the study, we come to this
conclusion that the Western dietary pattern has
the most variance and this indicates the
nutritional transition and prevalence of Western
dietary patterns in Iran. The similarity between
the dietary patterns of our society with the
Western countries is not that surprising. Because
in our country, rapid changes in lifestyle,
physical activity, and diet are occurring, which
can be attributed to the increase in urbanization
in recent years (44). This shows the significance
of our result once more.
In the following paragraphs, we discuss other
variable results. In the case of Gender, age, and
father’s education, differences were observed in
the distribution of Western dietary pattern
scores. With the increasing Western dietary
score, the percentage of men increased, but the
percentage of women decreased with increasing
Western dietary score, which has been shown in
studies by other researchers as well. This can be
due to the higher awareness of women about
food, nutrition, and health, the more attention
women pay to their appearance, the more they
prefer the taste of healthy food and the more time
they spend preparing food in comparison to the
men (45). Participants in the highest quarters of
the Western dietary pattern were younger than
those in the lowest quarters.
Our findings indicated that, in the case of
systolic blood pressure, age and economic
status, those who scored higher in the quarters of
a healthy dietary pattern had higher systolic
blood pressure but just until the third quarter
These findings are in contrast to other studies,
which showed a significant adverse association
between healthy dietary pattern and systolic
blood pressure. It can be justified in a way that
since this study was performed on a different
population, we cannot compare this group of
twins with other groups of non-twins. Maybe in
normal twins, the normal range of blood
pressure is another number. To support this,
there was a study done on Twins and non-twins
in the age range of 18-50 years, which showed
that the twins had higher blood pressure than the
non-twins did (46).
The regression logistic shows no significant
relationship between dietary patterns obtained
from factor analysis and general health in the
observed twins. The reason for this can be that
in FFQ, life style is not considered and on the
other hand in this study, according to WHO’s
definition, (” Health is a state of complete
physical, mental and social well-being and not
merely the absence of disease or infirmity”.), we
just did not observe one factor.
However, birth weight was directly related to
health. Those with low birth weight have more
health problems in contrast to those with normal
birth weight. In other studies, this theory has
been confirmed. For example, Benston et al. in
their study evaluate IBS and the symptoms of
anxiety and depression among Norwegian twins.
Their results showed that low birth weight was
associated with an increased risk of IBS (47).
According to the logistic regression model, the
first twins with less physical activity had more
health problems compared to those with
moderate physical activity. On the other hand, in
Page 12
Hemmatyar P et al. Vol 7 No 1 (2021)
Identifying the Dietary Patterns and Chronic Disease’s Effective Factors on the General Health Condition
81
second twins, gender and marital status play a
significant role. In this group, men in
comparison to women and singles to marrieds
had better general health. Though in the present
study, women follow the healthy dietary pattern
were not healthier.
There are some limitations to the interpretation
of the study results. In assessing food intake
using the food frequency questionnaire, there are
errors such as measurement error including
underreporting or over reporting of some or all
of the food items in this method. (48). Another
limitation is that there is no gold standard for
determining the number of factors (patterns) and
naming patterns in the factor analysis method. It
is based on the experience and value judgment
of the researcher. Some food groups including
dairy products were not categorized into
subgroups. For example, dairy products include
low-fat dairy and high-fat dairy. There is a
concern that the results may not be replicated in
different populations and even within the same
study population (49).
Since our study was cross-sectional and was
conducted in a limited period and due to the
budget consideration, for further research we
highly recommended a similar study to that of
Hasselbalch et al. They collected the
participants’ food intake of Danish male and
female twins between the ages of 18 and 67. The
results of this study showed that some food
groups are under the influence of genetics and
others under the influence of the environment.
The results indicate that the intake of
macronutrients and food groups was affected by
genetic differences among individuals. It also
shows the important effect of common
environmental factors that has rarely been
considered in adult twin studies (50-52)
Conclusion
The present study showed that there are two
major dietary patterns: the healthy dietary
pattern and the western dietary pattern. The
Western dietary pattern has the most variance
and this indicates the nutritional transition and
prevalence of Western dietary pattern in Iran.
Because in our country, rapid lifestyle changes,
physical activity, and diet are occurring, which
can be attributed to the increase in urbanization
in recent years (44).
If our findings are confirmed by prospective
studies, recognizing these dietary patterns can be
suggestive in improving dietary patterns, dietary
recommendations, and nutritional counseling.
On the other hand, though studying the
nutritional status and health of twins is of high
importance, in Iran there is not much done on
that.
The main finding of this study was the
association of birth weight with general health in
both twins. Birth weight was directly related to
health. Those with low birth weight have more
health problems in contrast to those with normal
birth weight.
Further studies are warranted and the
development and establishment of a sort of
systematic and accurate national archives of
twin populations that exist in countries such as
the United States, Canada, Norway, Denmark,
etc. are recommended. This archive in the future
will allow researchers to conduct their studies
with large sample size so that they can increase
the accuracy, application, and precision of their
obtained information. Since the participants in
this study were in the adult range, it is suggested
that in further studies, extensive research be
done on the nutritional status and health of
infants and children.
Acknowledgments:
This article is the result of a thesis for obtaining
a master's degree in nutrition from the Islamic
Azad University, Science and Research Branch
of Tehran. We would like to thank the Iranian
Twins Association and especially all the twins
who participated in the research also we would
like to express our special thanks of gratitude to
Dr. Niloofar Hemmatyar(PhD holder of English
Page 13
Hemmatyar P et al. Vol 7 No 1 (2021)
Identifying the Dietary Patterns and Chronic Disease’s Effective Factors on the General Health Condition
82
language and Literature) to help us translating
this article.
References
1. Dafallah SE, Yousif EM. A comparative
study of twin and triplet pregnancy. Saudi Med
J [Internet]. 2004 Apr [cited 2018 Sep
7];25(4):502–6. Available from:
http://www.ncbi.nlm.nih.gov/pubmed/1508322
5
2. Hayes EJ. ACOG Practice Bulletin No.
144: Multifetal gestations: twin, triplet, and
higher-order multifetal pregnancies. Obstet
Gynecol [Internet]. 2014;123(5):1118–32.
Available from:
http://www.ncbi.nlm.nih.gov/pubmed/2478587
6
3. Martin JA, Hamilton BE, D P, Sutton
PD, Ventura SJ, Menacker F, et al. National
Vital Statistics Reports Births : Final Data for
2013. Statistics (Ber). 2015;64(1):1–104.
4. Lee YM, Cleary-Goldman J, D’Alton
ME. The Impact of Multiple Gestations on Late
Preterm (Near-Term) Births. Clin Perinatol.
2006;33(4):777–92.
5. Wright VC, Chang J, Jeng G, Macaluso
M. Assisted reproductive technology
surveillance. Morb Mortal Wkly Rep [Internet].
2012;61(7):1–23. Available from:
http://www.ncbi.nlm.nih.gov/pubmed/2311428
1
6. Bortolus R, Zanardo V, Trevisanuto D.
[Epidemiology of identical twin pregnancy].
Pediatr Med Chir [Internet]. [cited 2018 Sep
7];23(3–4):153–8. Available from:
http://www.ncbi.nlm.nih.gov/pubmed/1172384
9
7. Loos R, Derom C, Vlietinck R, Derom R.
The East Flanders Prospective Twin Survey
(Belgium): A population-based register. Twin
Res. 1998;1(4):167–75.
8. Ramos-Arroyo M a, Ulbright TM, Yu
PL, Christian JC. Twin study: relationship
between birth weight, zygosity, placentation,
and pathologic placental changes. Acta Genet
Med Gemellol (Roma). 1988;37(3–4):229–38.
9. Chakravarti A, Little P. Nature, nurture
and human disease. Nature.
2003;421(6921):412–4.
10. Guttmacher AE, Collins FS, Ph D,
Carmona RH. sounding board The Family
History — More Important Than Ever. Am J
Med Genet. 2004;351(22):2333–6.
11. Pimpin L, Ambrosini G. Dietary intake
of young twins: nature or nurture? Am J …
[Internet]. 2013;98(5):1326–34. Available from:
http://ajcn.nutrition.org/content/98/5/1326.short
12. Scheibehenne B, Todd PM, van den Berg
SM, Hatemi PK, Eaves LJ, Vogler C. Genetic
influences on dietary variety - Results from a
twin study. Appetite [Internet]. 2014;77:131–8.
Available from:
http://dx.doi.org/10.1016/j.appet.2014.03.001
13. Rissanen A, Koskenvuo M, Ro T.
Acquired preference especially for dietary fat
and obesity : a study of weight-discordant
monozygotic twin pairs. Int J Obes.
2002;26:973–7.
14. Ghassemi H, Harrison G, Mohammad K.
An accelerated nutrition transition in Iran. Public
Health Nutr [Internet]. 2002 Feb 22 [cited 2018
Sep 7];5(1A):149–55. Available from:
http://www.journals.cambridge.org/abstract_S1
368980002000216
15. Hu FB, Hu FB. Dietary pattern analysis:
a new direction in nutritional epidemiology.
Curr Opin Lipidol [Internet]. 2002;13(1):3–9.
Available from:
http://www.ncbi.nlm.nih.gov/pubmed/1179095
7
16. Abdi F, Atarodi Z, Mirmiran P, Esteki T.
A Review of Nutritional Status in Iranian
Population. Focus Sci [Internet]. 2016;2(3):1–
10. Available from:
http://focsci.com/archive/article/8
17. Freeland-Graves J, Nitzke S, Denny S,
Askew EW, McMahon KE, Owen AL, et al.
Position of the American Dietetic Association:
Page 14
Hemmatyar P et al. Vol 7 No 1 (2021)
Identifying the Dietary Patterns and Chronic Disease’s Effective Factors on the General Health Condition
83
Total diet approach to communicating food and
nutrition information. J Am Diet Assoc.
2002;102(1):100–8.
18. Cardoso C, Afonso C, Bandarra N. The
Importance of Dietary Behavior to the Health of
Monozygotic Twins. J Community Med Health
Educ [Internet]. 2017;7(3):1–11. Available
from: https://www.omicsonline.org/open-
access/the-importance-of-dietary-behavior-to-
the-health-of-monozygotic-twins-2161-0711-
1000526.php?aid=89891
19. Esmaillzadeh A, Azadbakht L KM.
Dietary Pattern Analysis: A New Approach to
Identify Diet-disease Relations. Iran J Nutr Sci
Food Technol. 2007;2(2):71–80.
20. Hosseini-Esfahani F, Asghari G,
Mirmiran P, Jalali Farahani S AF.
Reproducibility and Relative Validity of Food
Group Intake in a Food Frequency
Questionnaire Developed for the Tehran Lipid
and Glucose Study. RJMS [Internet]. 2010 [cited
2020 Feb 24];17(71):41–55. Available from:
http://rjms.iums.ac.ir/article-1-1458-fa.html
21. Ghafarpour M, Houshiar-Rad A, Kianfar
H, Ghaffarpour M. The Manual for Household
Measures, Cooking Yields Factors and Edible
Portion of Food [Internet]. Tehran: Keshavarzi
Press; 1999 [cited 2018 Sep 7]. Available from:
https://www.scienceopen.com/document?vid=e
3b677f8-3b9e-4ca8-9f18-34a31647a44b
22. Hosseyni Esfahani F, Jazayeri A,
Mirmiran P, Mehrabi Y, Azizi F. Dietary
patterns and their association with socio-
demographic and lifestyle factors among
Thehrani adults: Tehran Lipid and Glucose
Study. J Sch Public Heal Inst Public Heal Res
[Internet]. 2008 [cited 2018 Sep 7];6(1):23–36.
Available from:
http://sjsph.tums.ac.ir/browse.php?a_id=149&si
d=1&slc_lang=en
23. Rezazadeh1 A, Rashidkhani2 B,
Omidvar2 N. Evaluation of major dietary
patterns and general and central obesity in adult
women of north Tehran in 2007. Res Med
[Internet]. 2010 [cited 2018 Sep 7];33(4):246–
58. Available from:
http://pejouhesh.sbmu.ac.ir/browse.php?a_id=6
93&sid=1&slc_lang=en
24. Hadad Tabrizi S, Haji Faraji M,
Houshiar Rad A, Abadi A, Hosseinpanah F.
Association between the metabolic syndrome
and food patterns in non-menopause women.
Iran J Nutr Sci Food Technol [Internet]. 2010
[cited 2018 Aug 25];5(1):39–48. Available
from: http://nsft.sbmu.ac.ir/article-1-277-
en.html
25. Hasselbalch AL, Heitmann BL, Kyvik
KO, Sorensen TIA. Studies of Twins Indicate
That Genetics Influence Dietary Intake. J Nutr
[Internet]. 2008;138(12):2406–12. Available
from:
http://jn.nutrition.org/cgi/doi/10.3945/jn.108.08
7668
26. Vasheghani-Farahani A, Tahmasbi M,
Asheri H, Ashraf H, Nedjat S, Kordi R. The
Persian, last 7-day, long form of the
International Physical Activity Questionnaire
:translation and validation study. Asian journal
of sports medicine. 2011;2(2):106.
27. Hazavehei SMM, Asadi Z, Hassanzadeh
A, Shekarchizadeh P. Comparing the effect of
two methods of presenting physical education Π
course on the attitudes and practices of female
Students towards regular physical activity in
Isfahan University of Medical Sciences. Iranian
Journal of Medical Education. 2008;8(1):121-
31.
28. Estebsari F, Shojaizadeh D, Mostafayi
D, Farahbakhsh M. Designing and intervention
educational to increase physical activity for
students girl based on PRECEDE Model to
Improve physical activity in female students.
Hayat. 2010; 16 (1): 48-54.
29. Craig C, Marshall A, Sjostrom M,
Bauman A, Booth M, Ainsworth B. International
physical activity questionnaire: 12-country
reliability and validity. Med Sci Sports Exerc.
2003;35(8):1381-96.
Page 15
Hemmatyar P et al. Vol 7 No 1 (2021)
Identifying the Dietary Patterns and Chronic Disease’s Effective Factors on the General Health Condition
84
30. Booth ML, Ainsworth BE, Pratt M,
Ekelund ULF, Yngve A, Sallis JF, et al.
International physical activity questionnaire: 12-
country reliability and validity. Med Sci Sports
Exerc. 2003;195:1381-95.
31. Moghaddam MHB, Aghdam FB,
Jafarabadi MA, Allahverdipour H, Nikookheslat
SD, Safarpour S. The Iranian version of
International Physical Activity Questionnaire
(IPAQ) in Iran: Content and construct validity,
factor structure, internal consistency and
stability. World Appl Sci J. 2012;18(8):1073–
80.
32. Banks M. Validation of General Health
Questionnaire in a young community sample.
Psychol Med. 1983;13:349–53.
33. Goldberg D. The Validity of two
Versions of the GHQ in the WHO Study of
Mental Illness in General Health Care. Psychol
Med. 1997;27:191–7.
34. Taghavi M. [Assessment of the validity
and reliability of the general health
questionnaire]. J Psychol2001; 5: 381-98. (
Persian)
35. Noorbala AA, Bagheri Yazdi SA,
Mohammad K. The Validation of General
Health Questionnaire- 28 as a Psychiatric
Screening Tool. Hakim Research Journal. 2009;
11(4): 47- 53. [In Persian]
36. van den Bree MB, Eaves LJ, Dwyer JT.
Genetic and environmental influences on eating
patterns of twins aged >/=50 y. Am J Clin Nutr
[Internet]. 1999;70(4):456–65. Available from:
http://www.ncbi.nlm.nih.gov/entrez/query.fcgi?
cmd=Retrieve&db=PubMed&dopt=Citation&li
st_uids=10500013
37. Van Den Berg L, Henneman P, Willems
Van Dijk K, Delemarre-Van De Waal HA,
Oostra BA, Van Duijn CM, et al. Heritability of
dietary food intake patterns. Acta Diabetol.
2013;50(5):721–6.
38. Teucher B, Skinner J, Skidmore PML,
Cassidy A, Tait SJF, Hooper L, et al. Dietary
Patterns and Heritability of Food Choice in a UK
Female Twin Cohort How to cite this article :
Dietary Patterns and Heritability of Food Choice
in a UK Female Twin Cohort.
2012;10(2007):734–48.
39. Pallister T, Sharafi M, Lachance G,
Pirastu N, Mohney RP, MacGregor A, et al.
Food Preference Patterns in a UK Twin Cohort.
Twin Res Hum Genet. 2015;18(6):793–805.
40. Keskitalo K, Silventoinen K, Tuorila H,
Perola M, Pietiläinen KH, Rissanen A, et al.
Genetic and environmental contributions to food
use patterns of young adult twins. Physiol
Behav. 2008;93(1–2):235–42.
41. Deshmukh-Taskar PR, O’Neil CE,
Nicklas TA, Yang S-J, Liu Y, Gustat J, et al.
Dietary patterns associated with metabolic
syndrome, sociodemographic and lifestyle
factors in young adults: the Bogalusa Heart
Study. Public Health Nutr [Internet].
2009;12(12):2493. Available from:
http://www.journals.cambridge.org/abstract_S1
368980009991261
42. Hu FB, Rimm E, Smith-Warner SA,
Feskanich D, Stampfer MJ, Ascherio A, et al.
Reproducibility and validity of dietary patterns
assessed with a food-frequency questionnaire.
Am J Clin Nutr [Internet]. 1999;69(2):243–9.
Available from:
http://www.ncbi.nlm.nih.gov/pubmed/9989687
43. Rashid Khani B, Ye W, Terry P, Wolk A.
Reproducibility and Validity of Major Dietary
Patterns among Swedish Women Assessed with
a Food-Frequency Questionnaire. Am Soc Nutr
Sci. 2004;134(6):1541–5.
44. Fallahi E, Anbari K. Identification of
dominant dietary patterns in Iranian adults.
Lorestan Univ Med Sci Iran. 2012;14(5):29–39.
45. Turrell G. Determinants of gender
differences in dietary behavior. Nutr Res.
1997;17(7):1105–20.
46. Bo S, P.Cavallo, G.Ciccone,
L.Scaglione, G.Pagano. Endocrinology &
Page 16
Hemmatyar P et al. Vol 7 No 1 (2021)
Identifying the Dietary Patterns and Chronic Disease’s Effective Factors on the General Health Condition
85
Diabetes or of being a twin ? Exp Clin
Endocrinol Diabetes. 2001;109:135–40.
47. Bengtson MB, Aamodt G, Vatn MH,
Harris JR. Co-occurrence of IBS and symptoms
of anxiety or depression, among Norwegian
twins, is influenced by both heredity and
intrauterine growth. BMC Gastroenterol.
2015;15(1):1–9.
48. Kerver JM, Yang EJ, Bianchi L, Song
WO. Dietary patterns associated with risk
factors for cardiovascular disease in healthy US
adults. Am J Clin Nutr [Internet].
2003;78(6):1103–10. Available from:
http://www.ncbi.nlm.nih.gov/pubmed/1466827
1
49. Martinez ME, Marshall JR, Sechrest L.
Invited commentary: factor analysis and the
search for objectivity. Am J Epidemiol
[Internet]. 1998;148(1):17–9. Available from:
http://aje.oxfordjournals.org/
50. Keskitalo K, Silventoinen K, Tuorila H,
Perola M, Pietiläinen KH, Rissanen A, et al.
Genetic and environmental contributions to food
use patterns of young adult twins. Physiol
Behav. 2008;93(1–2):235–42.
51. De Castro JM. Genes and environment
have gender-independent influences on the
eating and drinking of free-living humans.
Physiol Behav. 1998;63(3):385–95.
52.Hasselbalch AL, Heitmann BL, Kyvik KO,
Sorensen TIA. Studies of Twins Indicate That
Genetics Influence Dietary Intake. J Nutr
[Internet]. 2008;138(12):2406–12. Available
from:
http://jn.nutrition.org/cgi/doi/10.3945/jn.108.08
7668