J. Fluid Mech. (2012), vol. 696, pp. 374–401. c Cambridge University Press 2012 374 doi:10.1017/jfm.2012.55 Stability characteristics of a counter-rotating unequal-strength Batchelor vortex pair Kris Ryan†, Christopher J. Butler and Gregory J. Sheard Fluids Laboratory for Aeronautical and Industrial Research (FLAIR), Department of Mechanical and Aerospace Engineering, Monash University, VIC 3800, Australia (Received 13 April 2011; revised 6 November 2011; accepted 23 January 2012; first published online 6 March 2012) A Batchelor vortex represents the asymptotic solution of a trailing vortex in an aircraft wake. In this study, an unequal-strength, counter-rotating Batchelor vortex pair is employed as a model of the wake emanating from one side of an aircraft wing; this model is a direct extension of several prior investigations that have considered unequal- strength Lamb–Oseen vortices as representations of the aircraft wake problem. Both solution of the linearized Navier–Stokes equations and direct numerical simulations are employed to study the linear and nonlinear development of a vortex pair with a circulation ratio of Λ =-0.5. In contrast to prior investigations considering a Lamb–Oseen vortex pair, we note strong growth of the Kelvin mode [-2, 0] coupled with an almost equal growth rate of the Crow instability. Three stages of nonlinear instability development are defined. In the initial stage, the Kelvin mode amplitude becomes sufficiently large that oscillations within the core of the weaker vortex are easily observable and significantly affect the profile of the weaker vortex. In the secondary stage, filaments of secondary vorticity emanate from the weaker vortex and are convected around the stronger vortex. In the tertiary stage, a transition in the dominant instability wavelength is observed from the short-wavelength Kelvin mode to the longer-wavelength Crow instability. Much of the instability growth is observed on the weaker vortex of the pair, although small perturbations in the stronger vortex are observed in the tertiary nonlinear growth phase. Key words: vortex dynamics, vortex instability, vortex interaction 1. Introduction The production of coherent vortices is an inescapable feature of nearly all practical fluid flows. Understanding the mechanisms governing the development and dissipation of vortex cores has application at nearly all scales of flow, from the development of micro-scale turbulence to the dissipation of synoptic-scale flow structures. Given the wide breadth of application, it is no surprise that this field has generated significant interest for many years – see e.g. the review by Kerswell (2002). A stable vortex is made susceptible to the growth of both elliptic (Kelvin mode) instabilities and sinuous (Crow) instabilities through the addition of an external strain field. The presence of a neighbouring vortex, parallel to the vortex of interest, induces such a strain field, allowing for the growth of cooperative instabilities to develop on each vortex core. In the absence of an external strain field, perturbations rotate around † Email address for correspondence: [email protected]
Stability characteristics of a counter-rotatingunequal-strength Batchelor vortex pair
Kris Ryan†, Christopher J. Butler and Gregory J. Sheard
Fluids Laboratory for Aeronautical and Industrial Research (FLAIR), Department of Mechanical andAerospace Engineering, Monash University, VIC 3800, Australia
(Received 13 April 2011; revised 6 November 2011; accepted 23 January 2012;first published online 6 March 2012)
A Batchelor vortex represents the asymptotic solution of a trailing vortex in an aircraftwake. In this study, an unequal-strength, counter-rotating Batchelor vortex pair isemployed as a model of the wake emanating from one side of an aircraft wing; thismodel is a direct extension of several prior investigations that have considered unequal-strength Lamb–Oseen vortices as representations of the aircraft wake problem. Bothsolution of the linearized Navier–Stokes equations and direct numerical simulationsare employed to study the linear and nonlinear development of a vortex pair witha circulation ratio of Λ = −0.5. In contrast to prior investigations considering aLamb–Oseen vortex pair, we note strong growth of the Kelvin mode [−2, 0] coupledwith an almost equal growth rate of the Crow instability. Three stages of nonlinearinstability development are defined. In the initial stage, the Kelvin mode amplitudebecomes sufficiently large that oscillations within the core of the weaker vortex areeasily observable and significantly affect the profile of the weaker vortex. In thesecondary stage, filaments of secondary vorticity emanate from the weaker vortex andare convected around the stronger vortex. In the tertiary stage, a transition in thedominant instability wavelength is observed from the short-wavelength Kelvin mode tothe longer-wavelength Crow instability. Much of the instability growth is observed onthe weaker vortex of the pair, although small perturbations in the stronger vortex areobserved in the tertiary nonlinear growth phase.
1. IntroductionThe production of coherent vortices is an inescapable feature of nearly all practical
fluid flows. Understanding the mechanisms governing the development and dissipationof vortex cores has application at nearly all scales of flow, from the development ofmicro-scale turbulence to the dissipation of synoptic-scale flow structures. Given thewide breadth of application, it is no surprise that this field has generated significantinterest for many years – see e.g. the review by Kerswell (2002).
A stable vortex is made susceptible to the growth of both elliptic (Kelvin mode)instabilities and sinuous (Crow) instabilities through the addition of an external strainfield. The presence of a neighbouring vortex, parallel to the vortex of interest, inducessuch a strain field, allowing for the growth of cooperative instabilities to develop oneach vortex core. In the absence of an external strain field, perturbations rotate around
the base vortex, with no growth or decay in amplitude (Kelvin 1880). The externalstrain field can act to halt the rotation of the perturbation field, while simultaneouslyamplifying the perturbation.
The Crow instability manifests as a sinuous instability whose axial wavelength istypically far larger than the initial separation distance of the vortex cores. It was firstanalytically described for a counter-rotating vortex pair of equal circulation magnitudeby Crow (1970). Crow demonstrated, using a vortex filament model, that the lineargrowth of the mode manifested as a symmetric oscillation that grows on each vortexat a 45 inclination to an imaginary line drawn between each unperturbed vortex.Crow’s (1970) analysis was subsequently extended by Widnall, Bliss & Tsai (1974),who corrected an asymptotic simplification in Crow’s study, allowing the model to beextended to correctly predict instabilities at higher wavenumbers. The vortex filamentmodel has been extended to consider a co-rotating vortex pair by Jimenez (1975) andBristol et al. (2004), who independently demonstrated that the instability could notdevelop for such a case. Crouch (1997) and Fabre, Jacquin & Loof (2002) have furtherextended the model to consider the effect of multiple vortex filaments, reminiscent ofthe wake of an aircraft.
For a counter-rotating vortex pair of equal circulation magnitude, the late-stagedevelopment of the Crow instability leads to the initially parallel vortex coresconnecting periodically along their axis, and the system transforms into a series ofvortex rings – see e.g. Scorer & Davenport (1970) and Garten et al. (2001). Theprocesses underpinning the late-stage development have only recently been quantifiedby Leweke & Williamson (2011). By contrast, for counter-rotating vortex pairs ofunequal circulation magnitude, large-wavelength Crow perturbations emanating fromthe weaker vortex wrap around the stronger vortex during nonlinear development (seeMarshall, Brancher & Giovannini 2001; Ortega, Bristol & Savas 2003; Bristol et al.2004).
By contrast to the Crow instability, an elliptic instability can exhibit a positivegrowth for both co- and counter-rotating vortex pairs – see e.g. the experimentalfindings of Leweke & Williamson (1998) and Meunier & Leweke (2005). The axialwavelength of an elliptic instability is typically of the same order as the vortex coreradius. Given this scaling, the instability is dependent on the local features of theunperturbed vortex profile, and hence a filament analysis similar to that proposed byCrow (1970) is insufficient for the description of the mode. Tsai & Widnall (1976)conducted a first-order analysis for a Rankine vortex immersed within an infinitesimalstrain field; independently, Moore & Saffman (1975) provided an analytical frameworkfor a generic vortex profile. Subsequent investigations have considered the growthof elliptic instabilities for a variety of vortex profiles, including the Burgers andLamb–Oseen profiles (Eloy & Le Dizes 1999), the addition of an axial velocityto the Rankine vortex profile (Lacaze, Birbaud & Le Dizes 2005) and a Batchelorvortex (Lacaze, Ryan & Le Dizes 2007). The analytical framework describing thedevelopment of short-wave, elliptic instabilities has been summarized by Kerswell(2002).
These investigations have shown that the elliptic instability is amplified due tothe coupling of a pair of Kelvin modes, which, while neutrally stable for anisolated vortex, resonate with an externally imposed strain field. The Kelvin modepair are restricted to having the same axial wavenumber in addition to theirazimuthal wavenumbers being restricted, such that, if one Kelvin mode has azimuthalwavenumber mi, the second Kelvin mode must have an azimuthal wavenumbermii = mi ± 2. (We refer to mode couplings in the generic form [mi,mii, n] throughout.
376 K. Ryan, C. J. Butler and G. J. Sheard
Note that n refers to the branch number of the mode coupling – see e.g. Saffman(1992) for further details.) The elliptic instability process is tuned to a selectnormalized axial wavenumber κ = ka (where k is the axial wavenumber and adescribes the vortex core radius). Away from this axial wavenumber, the process isdetuned, leading to a reduction in the growth rate. Eloy & Le Dizes (1999) providedan analytical framework to describe this detuning process.
Eloy & Le Dizes (1999) point out that the detuning process has importantimplications for the nonlinear development of elliptic instabilities. Coupled with theviscous diffusion, which increases the vortex radius as a function of time, the criticalnormalized axial wavenumber changes as a function of time. Over time, the growthrate will reduce at a given wavenumber, reducing the growth rate as the instabilityalters the structure of the base vortex pair.
Numerous studies have investigated the stability of vortex pairs to the combinedeffects of both Crow and elliptic mode perturbations. Leweke & Williamson (1998),in their investigation of an equal-strength counter-rotating Lamb–Oseen vortex pair,identified the development of both an elliptic mode (consisting of a coupling of Kelvinmodes with azimuthal wavenumber [−1, 1]) and the large-wavelength Crow instability.They noted that the presence of both modes significantly enhanced the dissipativeeffect that may be provided by either mode in isolation. Importantly, they observedthe development of a series of transverse, counter-rotating ‘secondary vortex’ pairsduring the nonlinear growth phase of the instability. These secondary vortices transferenergy from one vortex to its neighbour, enhancing mixing and promoting dissipationof both vortices. Through dye visualizations, Leweke & Williamson (1998) observedtwo secondary vortex tubes originating per Kelvin mode [−1, 1] wavelength. Directnumerical simulation (DNS) conducted by Laporte & Corjon (2000) verified thesefindings. Recently, Schaeffer & Le Dizes (2010) detailed the nonlinear dynamics for amode [−1, 1] for a Lamb–Oseen vortex.
A counter-rotating vortex pair of equal circulation magnitude represents a uniquesituation, where both vortices travel with a constant velocity perpendicular to animaginary line drawn between the two vortices. As is well understood (see e.g. LeDizes & Laporte 2002), in general, a vortex pair will rotate about a fixed point. In thissituation, both vortices will observe a rotating strain field. For both Crow and Kelvinmodes, this global rotation rate alters the κ for optimal tuned growth, the mode shapeand the growth rate of the perturbation. This effect was investigated by Le Dizes &Laporte (2002) and So, Ryan & Sheard (2011) for a Lamb–Oseen vortex pair for thecase of elliptic instabilities and by Bristol et al. (2004) for Crow instabilities.
More recent investigations have considered a Batchelor vortex in an externallyinduced strain field. The Batchelor vortex is the asymptotic solution to the linearizedNavier–Stokes equation for a trailing line vortex profile far downstream of anaircraft (Batchelor 1964), and is therefore a closer approximation to an experimentalaircraft wake than the Lamb–Oseen vortex profile. In particular, the Batchelor vortexincorporates an axial velocity component, which has the potential to lead to instabilitygrowth on an isolated vortex, without the need for an externally imposed strain field.Both inviscid modes and viscous modes (whose growth rate diminishes as Re→∞)have been shown to occur. Several authors have shown that it is the relative strengthof the axial velocity to azimuthal velocity that determines the stability of an isolatedBatchelor vortex (see e.g. Ash & Khorrami 1995). An isolated Batchelor vortex withlow axial velocity magnitude has been shown to be stable in the inviscid framework.A recent study by Heaton (2007) has shown that instabilities develop even for small
Stability of a Batchelor vortex pair 377
axial velocities, but their growth rate is considerably smaller than that found for theelliptical modes under investigation.
Lacaze et al. (2007) have shown that a counter-rotating, equal-strength Batchelorvortex pair (with small axial velocity) leads to the growth of more complex short-wavemode shapes in preference to the Kelvin mode [−1, 1]. These modes may also bedescribed in terms of alternative Kelvin mode couplings. In particular, mode [−2, 0]and mode [−3,−1] have been shown to grow in the presence of an axial velocity,the preferred instability mode being dependent on the ratio of axial velocity to theswirl velocity. DNS conducted by Ryan & Sheard (2007) considered the developmentof the [−2, 0] mode on a Batchelor vortex pair of equal circulation strength. Fora sufficiently high axial velocity component, this mode has approximately the samelinear growth rate as the [−1, 1] mode for a Lamb–Oseen vortex pair (Lacazeet al. 2007; Roy et al. 2008). By contrast to prior findings for a Lamb–Oseenvortex pair, the nonlinear dissipation of the Batchelor vortex pair was muted, withnegligible improvements in dissipation rates beyond two-dimensional dissipation. Theinvestigation failed to identify the formation of secondary vortices during the nonlinearphase of growth; Ryan & Sheard (2007) suggested that the perturbation mode shapewas not conducive to the formation of secondary vortices. Recent work by Royet al. (2011) compared the growth of short-wave instabilities on co- and counter-rotating vortex pairs of equal circulation strength. They demonstrated, through dyevisualization, the growth of both mode [−2, 0, 1] and (for the counter-rotating vortexpair) the Crow instability. Their experiment confirmed prior analytical and simulatedresults for Batchelor vortex pairs.
Given the significant differences noted for an equal-strength Batchelor vortex pair(when compared with a Lamb–Oseen vortex pair), it is highly improbable that priorstudies on the evolution of unequal-strength Lamb–Oseen vortex pairs would havefindings directly comparable to an unequal-circulation-strength Batchelor vortex pair.This study extends previous investigations by considering a Batchelor vortex pair withlow axial velocity and circulation strength ratio Λ = −0.5; it is reasoned that thefundamental physics describing the evolution of this vortex pair is representative of awide range of unequal-strength circulation ratios.
This paper is organized as follows. Section 2 provides details of the model beingconsidered. The numerical techniques employed are defined in § 4, while a descriptionof the numerical domain under consideration is described in § 5. The two-dimensionalrelaxation of the vortex pair is described in § 6.1, before linear stability analysisfindings (§ 6.2) and DNS findings (§§ 6.3–6.6) are described.
2. ObjectiveThis study considers a relatively simple system comprising two Batchelor vortices
of unequal circulation strength. The vortices are separated by a distance b and have acharacteristic radius a. In general, a Batchelor vortex is defined completely as
ωxy = Γ
πa2e− (r/a)
2, (2.1)
W = W∗a0 |Γ |2πa2
e− (r/a)2, (2.2)
where ωxy is the axial vorticity field, W the axial velocity field, Γ the circulation,r the radial distance away from the vortex core, and W∗ the axial velocity coefficient.Note that a0 represents the initial characteristic core radius; as the vortex evolves, the
378 K. Ryan, C. J. Butler and G. J. Sheard
characteristic radius increases due to diffusion, and (to first approximation) may bedetermined at any time t from
a=√
a20 + 4νt, (2.3)
where ν is the fluid kinematic viscosity.Three key parameters have previously been shown to control the growth rate in
an equal-strength Batchelor vortex pair (Lacaze et al. 2007), namely the Reynoldsnumber, defined as Re = Γ/ν, the external strain rate, εext , and the axial velocitycoefficient, W∗. The external strain rate describes the strain acting on a vortex purelyby the presence of its neighbour. It is proportional to both the separation distanceof the vortices and the circulation of the adjacent vortex, and may be written innon-dimensional form (see e.g. Lacaze et al. 2007) as
εext = Sext
Ω0=(a
b
)2Γadj
Γi, (2.4)
Sext = Γadj
2πb2, (2.5)
Ω0 = Γi
2πa2, (2.6)
where Sext is the dimensional form of the external strain rate, Ω0 is the rotationinduced by the vortex at its centre, Γadj is the circulation of the adjacent vortex, and Γi
is the circulation of the vortex of interest. As described by Le Dizes & Laporte (2002),the strain rate actually measured at the vortex core is dependent on both εext and theprofile of the vortex core in question. The growth rate of the elliptic instability maybe shown to be proportional to this internal strain rate, εint . For vortices of Gaussianprofile, Le Dizes & Laporte (2002) have shown that εint may be related to εext as
εint =[
1.5+ 0.038(
0.16− Γi + Γadj
2Γadj
(a
b
)2)−9/5
]εext . (2.7)
An additional controlling parameter considered in this study is the circulation ratio,Λ = Γ1/Γ2 (note that, for any given variable φ, φ1 refers to the weaker vortex andφ2 to the stronger vortex throughout). As discussed in § 1, a value of Λ away fromΛ = −1 will induce a global rotation of the vortex pair, which will alter the growthof the instability modes away from that predicted for Λ = −1. In addition, we haveassumed that the peak axial velocity passing through the two vortices is equal. Giventhat both vortices have the same maximum axial velocity, an unequal circulation ratioimplies an unequal axial velocity coefficient through the definition
W∗2W∗1= |Λ|. (2.8)
From consideration of figure 9 in Lacaze et al. (2007), we anticipate that it is possible,if not likely, that an unequal-strength Batchelor vortex pair will exhibit different modesof instability growth on each vortex core across a wide range of Λ values for moderateaxial velocity magnitudes. That is, the Kelvin mode coupling, which is most unstableon one vortex, will differ from that on the neighbouring vortex, simply due to thevariation in axial velocity coefficient.
For this study Re = 2800 and a separation distance a0/b = 0.25 was chosen (notethat this implies that both vortices initially have the same characteristic radius a0). We
Stability of a Batchelor vortex pair 379
consider a value of Λ = −0.5 and a maximum axial velocity coefficient of W∗1 = 0.3(as such, W∗2 = 0.15). These values have been chosen because, when considering theanalytical work described in Lacaze et al. (2007), they provide the best opportunityto observe significant perturbation growth across both vortices. In addition, we notethat an isolated Batchelor vortex with these values of W∗ would be stable to three-dimensional perturbations (see Lacaze et al. 2007, and references therein).
Considering the work of Lacaze et al. (2007) we predict a priori that a Kelvin mode[−2, 0, 1] will dominate the weaker vortex, while a Kelvin mode [−1, 1, 1] will beobserved on the stronger vortex. A Crow instability should develop on both vortices.Given the substantially lower value of εi anticipated in the stronger vortex, much ofthe perturbation growth is anticipated on the weaker vortex.
3. ApproachTwo methods were employed to simulate the vortex system. The first technique
predicts which linear modes will become most unstable through solution of thelinearized Navier–Stokes equations. Using this technique, numerical modelling isperformed in two stages. Initially, the time-dependent two-dimensional flow field ispredicted through the solution of the two-dimensional Navier–Stokes equations. Thisallows the vortex system to ‘relax’ to a solution of the Navier–Stokes equations. Thesystem is then frozen, and the linearized Navier–Stokes equations are then solved ina rotating reference frame to determine the stability of the two-dimensional systemto three-dimensional disturbances. This technique is identical to that previously usedby So et al. (2011) to consider the growth of instabilities of an unequal-strengthLamb–Oseen vortex pair.
The second technique employed DNS to validate the stability analysis findings, andto investigate the nonlinear growth of the instabilities. The DNS investigation wasinitialized by superimposing two Batchelor vortices separated by a distance b. Therelaxation of the vortex pair was simulated in three-dimensional space. As has beenshown by both Sipp, Jacquin & Cossu (2000) and Le Dizes & Verga (2002) (andverified in both §§ 6.1 and 6.3.1), relaxation of the vortex pair occurs over a veryshort period of time, which is significantly less than the time scale over which linearperturbations grow.
where u is the velocity vector and P is the kinematic pressure. The linear stabilityanalysis technique solves the linearized form of (4.1) and (4.2) (as described bySheard, Fitzgerald & Ryan 2009), whereas the DNS technique solves (4.1) and (4.2)directly.
For both the DNS and linear stability analysis investigations, a spectral-elementmethod was employed to spatially discretize the relevant form of (4.1) and (4.2) inthe plane normal to the axes of the vortex pair. High-order Gauss–Legendre–Lobattopolynomials were used as interpolants within each macro-element, and spatial accuracywas determined by choosing the order of the tensor product of these polynomials. This
380 K. Ryan, C. J. Butler and G. J. Sheard
technique, described in detail by Karniadakis & Sherwin (2005), has the significantadvantage of near spectral convergence, while allowing controllable mesh density asper finite element methods.
Time integration was performed using a third-order accurate operator splittingscheme based on backwards differencing (Karniadakis, Israeli & Orszag 1991). Thealgorithm has been described in a number of previous investigations, notably Sheardet al. (2009) for DNS simulations and So et al. (2011) for linear stability analysis.
4.1. The direct numerical simulation techniqueThe DNS technique employs a Fourier/spectral-element method to spatially resolvethe domain in the third dimension. Here, the flow field at each point on the two-dimensional grid is described by a Fourier expansion in the axial direction. In theformulation employed, the Fourier modes are only coupled during the advection sub-step; the pressure and diffusion sub-steps are computed in a decoupled fashion. Thisleads to a significant advantage for parallel simulations over fully three-dimensionalspectral-element simulations. This approach has been employed previously for a widevariety of simulations – see e.g. Karniadakis & Triantafyllou (1992), Thompson,Hourigan & Sheridan (1996) and Blackburn & Sherwin (2004) among many others.The global spectral approach has the advantage of pseudo-spectral convergence, but theboundary conditions in the axial direction are restricted to be periodic.
4.2. The linear stability analysis techniqueLinear stability analysis determines the stability of a two-dimensional base flow fieldto perturbations of a predetermined axial wavenumber. The linear stability analysistechnique solves the linearized form of (4.1) and (4.2); this linearized form differsfrom the full three-dimensional Navier–Stokes equations only in the advection term,and thus an almost identical algorithm can be employed as described for the DNStechnique. Importantly, the technique assumes a time-independent base flow field.However, for a finite Reynolds number, an unequal-strength vortex pair will evolvedue to dissipative effects. To overcome this problem, the base flow field is frozenat the conclusion of the relaxation period (see § 6.1). Owing to the rotation of thevortex pair, freezing the base flow field requires the perturbation field to be evolvedwithin a rotating reference frame that matches the base flow field. This rotation of theperturbation field ensures that the Coriolis forces induced by the rotation of the basevortex pair are accounted for. Thus, in the rotating reference frame, the base flow fieldis modelled as steady-state after the conclusion of the relaxation phase.
For T-periodic base flow fields (of which a steady-state base flow field is a specialexample), the perturbation field evolves over one period subject to an operator A as
u′t+T = A(u′t), (4.3)
where u′t represents any one of the perturbation velocity components or perturbationpressure field calculated at time t. The eigenvalues to this problem may be written as
µ= exp(σT), (4.4)
where σ corresponds to the growth rate of the instability.Owing to the size of the systems under investigation, A is not constructed explicitly.
Instead, the base flow and perturbation field are integrated in time and leadingeigenvalues are determined using an implicitly restarted Arnoldi method. This schemehas been validated against an independent implementation by Blackburn & Sheard
Stability of a Batchelor vortex pair 381
(2010), while the work of Sheard et al. (2009) validated the scheme against DNSresults and experimental findings.
4.3. Potential limitations of the direct numerical simulation techniqueThe Fourier decomposition of the Navier–Stokes equations in the axial directionrestricts the model to only consider periodic boundary conditions in the axial extent;this may lead to results that differ from those observed experimentally. Previousinvestigations have shown that the critical wavelength of Crow instabilities scales withthe separation distance of the two vortices κCrow = kb, while the shorter-wavelengthKelvin modes scale with the vortex core radii κKelvin = ka.
The increase in the vortex core radius over time, equation (2.3), will increaseκKelvin, leading in a decrease in the growth rate predicted from the DNS simulationaway from that predicted from linear investigations (Eloy & Le Dizes 1999). Thiseffect may be minimized by increasing the Reynolds number of the simulation (hencedecreasing the viscous growth of the vortex radii) and increasing the number of Kelvinmode instability wavelengths contained within the axial extent of the domain. In thepresent study, eight Kelvin mode instability wavelengths and three Crow instabilitywavelengths were contained within the domain.
5. Computational detailsA circular domain of radial extent 100a0 was employed in the x–y plane for all
simulations described herein. The vortex pair was modelled in the centre of thedomain within a highly resolved portion of the mesh. The highly resolved region hadan extent 23a0 × 23a0, and comprised square macro-elements. The extent of the highlyresolved region was determined through several trial simulations. Reducing the size ofthe highly resolved region led to advection of vortex filaments outside of this regionduring late stages of nonlinear growth in DNS simulations.
The number of macro-elements required for the simulation was determined throughan h-type resolution study, whereby the effect of macro-element size was considered.In the refined region, macro-elements of width 1x = 0.5a0 through to 1x = 1.2a0
were considered. For each mesh, the Lagrangian polynomial interpolant order chosenwas p = 9. The internal strain rate, εint , and the peak vorticity measured at the coreof each vortex were calculated at the conclusion of the relaxation phase for eachmesh. Variations of less than 1 % were observed between 1x = 0.5 and 1x = 0.8 forall variables considered. Subsequently, the central refined region consisted of squareelements each of width 1x = 0.8a0. Away from the resolved region, the mesh densitydecreased with increasing radius. The domain extent chosen was found to be sufficient,such that the non-slip wall boundary conditions imposed at the perimeter of thedomain did not influence the development of the vortex pair. Overall, the mesh wascomposed of 589 quadrilateral conforming elements.
In addition to the h-type resolution, mesh independence was established byperforming a p-type resolution study whereby the order of the Lagrangian polynomialinterpolants within each element was successively increased until the solution wasmesh-independent. Both the development of the two-dimensional base field and theperturbation growth rate of the two leading modes (investigated at ka = 2.5) weremodelled as a function of p. The perturbation growth rate was compared, as theperturbation field typically yields spatially smaller-scale structures than the base flowfield – and thus gives a more accurate indication of the mesh resolution required. Aswith the h-type resolution study, the internal strain rate, εint , and the peak vorticity
382 K. Ryan, C. J. Butler and G. J. Sheard
measured at the core of each vortex were calculated at the conclusion of the relaxationphase. Variations of less than 1 % were observed between p = 12 and p = 15 for allvariables considered. An eleventh-order (p = 12) Lagrangian polynomial interpolantwas used for the tensor-product expansion basis for all subsequent calculations.
The DNS investigations considered an axial extent of 27.25 × a0. This allowed forthree wavelengths of the large-wavelength Crow instability and eight wavelengths ofthe Kelvin mode to be captured within the domain. Section 6.2 details the criticalwavelengths of both these modes as predicted from the linear stability analysis, whichdirected the axial domain extent of the DNS investigation.
In all, 80 Fourier modes were calculated in the axial direction, allowing for eightFourier modes to resolve each Kelvin mode and 27 Fourier modes to describe eachCrow mode. During the DNS investigation, the highest Fourier mode was monitoredto ensure that any aliasing was limited. At the transition to nonlinear growth (whereany effect of aliasing was noted to be highest), the kinetic energy within the highestFourier mode was measured at ' 4 × 10⁻⁶. This was O(10−6) times the energymeasured for the Kelvin mode, O(10−7) times the energy measured for the Crowmode, and O(10−9) times the energy of the fundamental m= 0 mode.
6. Results6.1. Two-dimensional relaxation of the base flow field
The two-dimensional base flow is initialized simply by superimposing two Batchelorprofile vortices a distance b apart. As is well documented, two superimposed Batchelorprofile vortices are not a solution to the Euler equations and as a result undergo arapid adaptation period. The adaptation phase was shown to be dominated by inviscidforces by Le Dizes & Verga (2002) for co-rotating vortices and by Sipp et al. (2000)for counter-rotating vortices, and involves each vortex in the vortex pair evolving froma circular profile to an elliptical one. The evolution involves the oscillation in theprofile of each vortex and may be monitored by considering εint measured within eachvortex core. As the vortex pair adapt to the Euler solution, oscillations in εint decay.The critical time after which the base field is said to have adapted is determinedthrough monitoring the oscillations of εint as a function of time. Both Sipp et al.(2000) and Le Dizes & Verga (2002) found that the time scale for adaptation wasdirectly dependent on the circulation of the vortex. As they only considered equal-strength vortices, only one time scale was appropriate. However, in our case, two timescales may be defined, as each vortex has a different circulation.
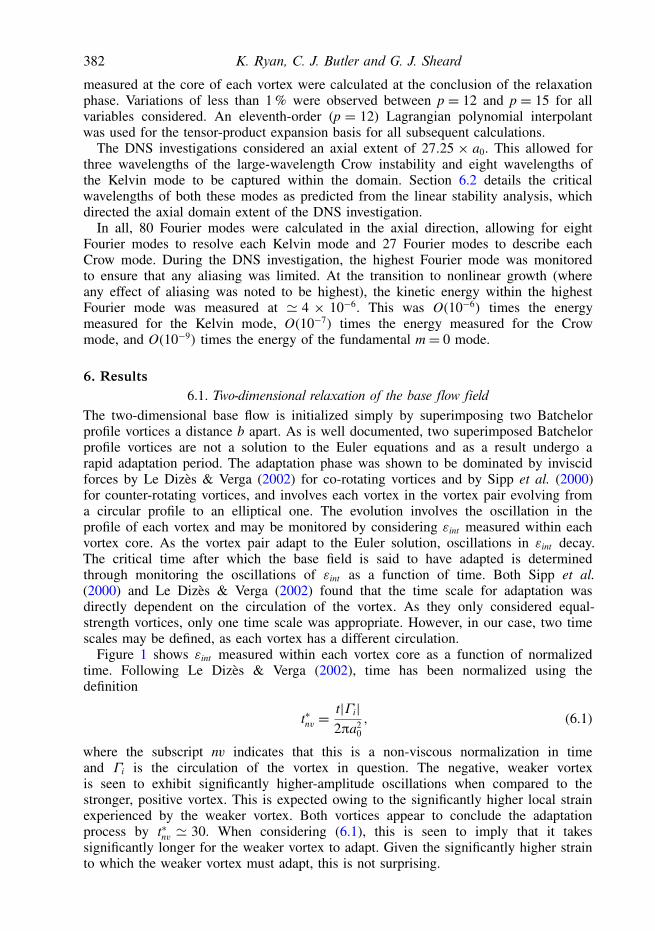
Figure 1 shows εint measured within each vortex core as a function of normalizedtime. Following Le Dizes & Verga (2002), time has been normalized using thedefinition
t∗nv =t|Γi|2πa2
0
, (6.1)
where the subscript nv indicates that this is a non-viscous normalization in timeand Γi is the circulation of the vortex in question. The negative, weaker vortexis seen to exhibit significantly higher-amplitude oscillations when compared to thestronger, positive vortex. This is expected owing to the significantly higher local strainexperienced by the weaker vortex. Both vortices appear to conclude the adaptationprocess by t∗nv ' 30. When considering (6.1), this is seen to imply that it takessignificantly longer for the weaker vortex to adapt. Given the significantly higher strainto which the weaker vortex must adapt, this is not surprising.
Stability of a Batchelor vortex pair 383
t*n
0 10 20 30 50
6
40
2
4
FIGURE 1. Internal strain-rate magnitude (εint ) as a function of normalized time t∗nv ,measured at the core of each vortex; —, stronger vortex; – –, weaker vortex.
TABLE 1. Parameter values at the conclusion of the relaxation period (t∗nv = 30 based onthe weak vortex); Γ1 refers to the weaker vortex and Γ2 refers to the stronger vortex.
Viscous diffusion of the vortices results in increasing overlap of the vorticesas a function of time. The effect is driven purely by viscous diffusion, andmay be modelled to first approximation by superimposing two circular vortices adistance b apart and allowing for viscous diffusion in the absence of relaxation.Over long periods of time, the Reynolds number, based on the circulation of thevortex in question, was found to reduce exponentially. However, over the shorttime periods investigated in this study (including the entirety of the DNS resultsdiscussed later), the variation in Reynolds number is well approximated as a linearreduction with time. Table 1 details Re, εint , εext and W∗ for each vortex at theconclusion of the relaxation process (t∗nv = 30 based on the weak vortex); in addition,a/b = 0.361 at this time. We note that εint ' 2εext , as predicted for this systemusing (2.7).
The axial vorticity and strain-magnitude fields of the adapted flow field are shownin figure 2, corresponding to t∗nv = 30. This is the flow field used as the base flow inthe stability analysis study. The strain field is found to be significantly higher withinthe weaker vortex than the stronger one. This would imply that, for an excited globalmode, instability growth should be stronger in the weaker vortex.
6.2. Linear stability analysis
Figure 3(a) shows the normalized growth rates obtained from the linear stabilityanalysis, as a function of wavenumber. Following the work of Le Dizes & Laporte(2002), the wavenumber is normalized by the vortex core radius (here chosen as thecore radius of the strong vortex); and the growth rate has been normalized using the
384 K. Ryan, C. J. Butler and G. J. Sheard
(b)(a)
FIGURE 2. (a) Vorticity field and (b) strain field at the conclusion of the adaptation phase(t∗nv = 30). Contour lines show the vortex core radii (a) strained from their original radius ofa0; dashed lines indicate negative vorticity. Shaded contours indicate the strength of the fieldin question; in panel (a) darker shading indicates negative vorticity, lighter shading indicatespositive vorticity; in panel (b) darker shading indicates a stronger magnitude of strain.
global turnover time, where
tG = 4π2b20
|Γ1|(1+Λ), (6.2)
is the time taken for the vortex pair to make one revolution about each other. Note thatwe use the initial separation distance b0 in (6.2). This leads to two non-dimensionalparameters to describe the growth of perturbations,
σ ∗ = σ × tG, (6.3)
t∗ = t
tG, (6.4)
referred to as the normalized growth rate and normalized time, respectively.Five modes have been identified as growing on the vortex system. Of these, three
dominate – having significant growth rates. These are the long-wavelength Crowinstability, and the shorter-wavelength Kelvin modes [−1, 1, 1] and [−2, 0, 1]. Thisis in agreement with the predictions of Lacaze et al. (2007) and contrasts with themodes that grow on Lamb–Oseen vortex pairs (where only the Crow instability andthe Kelvin mode [−1, 1] exhibit positive growth).
The Crow instability has a peak σ ∗ = 8.67 at a critical wavenumber of κc = ka =0.75, in excellent agreement with the analytical predictions of Bristol et al. (2004).Using their model, we find a peak σ ∗ = 8.9 at a critical wavenumber of κc = 0.62.The mode shape is shown in figure 3(b), and is similar in profile to that describedpreviously by many authors – for example, Crow (1970) and Widnall et al. (1974)for equal-strength vortices and So et al. (2011) for unequal-strength vortices. Theperturbation field was found to evolve predominantly in the vicinity of the weakervortex in preference to the stronger vortex.
Of the short-wavelength (Kelvin) instabilities, mode [−2, 0, 1] is found to dominateover the majority of the wavelengths considered. A peak growth rate of σ ∗ = 8.5 at acritical wavenumber of κc ' 2.4 was observed. While this peak growth rate is slightlylower than that of the Crow instability, the separation in critical wavenumbers shouldallow both instabilities to be clearly identifiable experimentally. The mode shape formode [−2, 0, 1] is shown in figure 3(c); a classical mode [−2, 0, 1] shape is observed
Stability of a Batchelor vortex pair 385
ka1 2 3 4 5 60
4
6
10(a)
(c) (d )(b)
2
8
FIGURE 3. (a) Growth rate for each of the modes identified in the linear stability analysis,as a function of normalized wavenumber ka. Modes have been identified as: —, large-wavelength Crow instability; − · −, Kelvin mode [−1, 1, 1]; - - -, Kelvin mode [−2, 0, 1];– ·· –, Kelvin mode [−2, 0, 2]; — — —, Kelvin mode [−3,−1, 1]. (b–d) Perturbation axialvorticity fields for: (b) the Crow instability, (c) Kelvin mode [−2, 0, 1], and (d) Kelvinmode [−1, 1, 1]. In each case, shaded contours are of the perturbation field; lightly shadedregions indicate a positive perturbation, darker shaded regions indicate a negative perturbation.Contour lines illustrate the base flow field as per figure 2.
on both vortices – compare with the profiles described by Lacaze et al. (2007) andRoy et al. (2008). As with the Crow instability, the perturbation field is dominant onthe weaker vortex. Indeed, the amplitude of the perturbation mode shape acting on thestronger vortex is only '6 % of that acting on the weaker vortex.
Over a very narrow range of ka, the Kelvin mode [−1, 1, 1] is observed to bethe dominant perturbation mode. A peak growth rate of σ ∗ = 7.01 is observed,at κc = 1.64. While the mode [−1, 1, 1] is the mode with highest growth forka = [1.2, 1.5], the mode [−2, 0, 1] also exhibits a significant growth rate in thisrange.
We therefore anticipate that both modes would be observed to competeexperimentally at this wavenumber. However, the substantially higher growth rate ofmode [−2, 0, 1] (in the vicinity of ka = [2.0, 3.0]) should mean that this mode shapewould dominate the overall perturbation into the nonlinear growth regime. Therefore,the mode competition would be difficult to isolate and identify, and should havelittle impact on the overall mode shape that the vortices exhibit. The mode shape for[−1, 1, 1] is shown in figure 3(d). Once again, the perturbation field is dominant onthe weaker vortex.
Comparing our findings with the results of Lacaze et al. (2007), we find that thevalue of κc varies considerably from that found for an equal-strength counter-rotating
386 K. Ryan, C. J. Butler and G. J. Sheard
Λ
AR
40
60
80
–1.0 –0.8 –0.6 –0.4 –0.20
0.2
0.4
0.6
0.8
1.0
Λ–1.0 –0.8 –0.6 –0.4 –0.2
(a) (b)
FIGURE 4. Vortex filament model predictions for the growth of the large-wavelength Crowinstability. (a) The ratio of perturbation amplitude (AR) acting on the strong vortex to theperturbation amplitude acting on the weak vortex, as a function of Λ. The circle indicates theamplitude ratio obtained from the linear stability calculations at Λ = −0.5. (b) The principalangle of the perturbation for the strong vortex (solid line) and the weak vortex (dashed line)as a function of Λ. The circles indicate the principal angles observed from the linear stabilitycalculations at Λ = −0.5: the open circle corresponds to the strong vortex; the filled circlecorresponds to the weak vortex.
Batchelor vortex pair. For mode [−2, 0, 1], our finding of κc is 60 % higher thanthat found for a counter-rotating pair at W∗ = 0.3 (Lacaze et al. 2007). By contrast,for mode [−1, 1, 1], our finding of κc is 61 % less than that observed for a counter-rotating pair at W∗ = 0.15. We note that Lacaze et al. (2007) did not report a growthof mode [−1, 1, 1] at W∗ = 0.3, nor a growth of mode [−2, 0, 1] at W∗ = 0.15.
Both Le Dizes & Laporte (2002) and Roy et al. (2008) compared the variation in κc
for co- and counter-rotating equal-strength Lamb–Oseen vortex pairs. In general, theyfound that the co-rotating vortex pair exhibited a lower κc for all instability modesidentified. This is ascribed to the global rotation rate inducing an additional Coriolisforce on the system. In addition, Roy et al. (2008) considered the variation in κc for aco-rotating, equal-strength Batchelor vortex pair. Curiously, they found that κc for bothmodes [−1, 1, 1] and [−2, 0, 1] reduced when compared with the findings of Lacazeet al. (2007) for a counter-rotating Batchelor vortex pair.
While our vortex pair profile is substantially different from either investigation, theincrease in κc for mode [−2, 0, 1] reported here is surprising, and is worthy of futureinvestigation.
Additionally, the rotation of the vortex pair was noted by Roy et al. (2008) toexpand the range of ka over which significant growth of a mode was observed tooccur, when compared to an equal-strength, counter-rotating pair. Figure 3(a) concurswith this finding.
Two other modes were identified (mode [−2, 0, 2] and mode [−3,−1, 1]), bothof which were predicted analytically by Lacaze et al. (2007). Neither mode had asignificant growth rate, and it is not anticipated that they would have significant impactexperimentally.
6.2.1. Development of the Crow instability on unequal-strength vortex pairsA vortex filament model was employed to consider the Crow instability growing
on an unequal-strength counter-rotating vortex pair. This extended the results from
Stability of a Batchelor vortex pair 387
the linear stability analysis from the case of Λ = −0.5 to the range Λ = [−1,−0.1].The technique was precisely the same as that described by Bristol et al. (2004). Theself-induction of each vortex core was calculated through solution of the dispersionequations provided by Saffman (1992).
The vortex filament model assumes that perturbations take the form of sinuousoscillations along the axis of each vortex. The model may be reduced to an eigenvalueproblem, where the eigenvalues represent the global growth rate, and the eigenvectorsrepresent the mode shape components. In particular, by taking the amplitude of theeigenvectors for each vortex, a ratio of ‘perturbation strength’ can be determined,measuring the relative strength of the perturbation on each vortex core. In addition, theplane of oscillation of the mode shape may be determined for each vortex, leading tothe definition of a principal angle (θP). Here, the principal angle describes the anglethat the mode shape makes with an imaginary line joining the vortex cores. Previousinvestigations have identified |θP| ' 45 for Λ=−1.
The growth rates observed from the vortex filament model agree precisely with thatreported by Bristol et al. (2004), with the growth rate increasing by '28 % as Λincreases from −1 to −0.1. However, the ratio of perturbation amplitude acting on thestronger vortex with respect to the weaker vortex varies appreciably over this range(figure 4a). At Λ = −0.5, the stronger vortex is predicted to have a mode amplitudeonly 20 % that of the weaker vortex. The linear stability analysis study predicts aslightly higher ratio of 29 % at Λ = −0.5. The results shown in figure 4(a) wouldimply that the Crow instability will have relatively little impact on the development ofthe strong vortex for |Λ| . 0.8. This questions the efficacy of the Crow instability toenhance the dissipation of a generic vortex pair; the significant dissipation noted forΛ=−1 is an almost unique example where both vortices have substantial perturbationgrowth. This is despite the increase in the global growth rate of the mode as Λ→ 0.
In addition, the principal angle (θP) varies significantly for the stronger vortex as afunction of Λ. Indeed, at Λ = −0.5, the vortex filament theory predicts θP ' 79 forthe stronger vortex, in agreement with the linear stability analysis model (as shownin figure 4b). As will be shown, this angle plays an important role in the nonlineardevelopment phase.
As shown by Bristol et al. (2004), the rotation rate of the vortex pair plays asignificant role in the perturbation growth of the Crow instability. Indeed, in theabsence of rotation, the filament model predicts the growth of instabilities for bothco- and counter-rotating vortex pairs. Following the analysis of Widnall et al. (1974)and Bristol et al. (2004), we now consider the equations governing a decoupledvortex filament pair, where the growth of instabilities on one vortex is not consideredwhen determining the growth of instabilities on the neighbouring vortex. Using thisapproach, we can define
Ar =Λsin(2θP2)
sin(2θP1), (6.5)
where θP1 is the principal angle for the weaker vortex and θP2 is the principal angle forthe stronger vortex. We note that, should |θP1| = |θP2| = 45, AR would reduce linearlywith Λ. Comparing this with the findings in figure 4(a), the variation in either θP1 andor θP2 is to be anticipated.
For the decoupled system described, the principal angle for each vortex may bewritten as
cos(2θP1)=Ω +Λ$, (6.6)
388 K. Ryan, C. J. Butler and G. J. Sheard
cos(2θP2)= 1Λ(Ω +$) , (6.7)
Ω =Λ+ 1, (6.8)
where Ω is the normalized rotation rate of the vortex pair and $ is the self-inducedangular velocity of a perturbation induced about the unperturbed axis of the vortexin question – see Saffman (1992) and Bristol et al. (2004) for further details. Forthe Crow instability, $ is a positive value, representing a retrograde rotation of theperturbations about the vortex. It is clear from (6.8) that the rotation rate of the vortexpair (Ω) plays a significant role in determining the principal angle of oscillation. Inaddition, we note that, given the retrograde nature of the Crow instability, a decoupledanalysis predicts that no principal angle θP2 satisfies (6.6) for Λ= [−0.5, 0], and hencewe would anticipate no growth on the stronger vortex for this range of Λ. Thus,the growth found on the stronger vortex in this range, for both the linear stabilityanalysis study and the vortex filament study, must be induced by a direct coupling ofinstabilities growing on the weaker vortex.
We note that, for peak growth, θP = ±45. For the stronger vortex, owing to theretrograde motion of the perturbation, this is not possible except for the unique caseof Λ = −1. Considering (6.7), we anticipate that θP > ±45, for all cases except forΛ=−1, in agreement with the findings of the coupled filament model (figure 4b).
For the weaker vortex, θP = ±45 may occur for all values of Λ = [−1, 0], and wesurmise that it is for this reason that the coupled filament analysis technique showsthat θP1 remains near 45 for all values of Λ, resulting in peak instability growth onthe weaker vortex.
6.3. Direct numerical simulation results6.3.1. Two-dimensional evolution of the vortex pair
The initial profile of the vortex pair for the DNS simulations has been described in§ 2. Relaxation of the vortex pair was determined in full three-dimensional space, andwas noted to agree precisely with that found in § 6.1. Relaxation of the vortex pair wasdeemed to be complete at t∗nv = 30, corresponding to t∗ = 0.47. At this time, the vortexpair exhibited the same characteristics as previously described in § 6.1 and presented intable 1. Relaxation was concluded prior to perturbation growth being recorded in anyhigher modes.
6.3.2. Perturbation growth on the vortex pairFigure 5 shows the development of the instability as a function of time. Here,
we visualize the flow field by employing the λ2 field, defined as the secondeigenvalue solution to the tensor S2 + Ω 2 (Jeong & Hussain 1995). Here, S is thesymmetric component of the velocity gradient tensor (∇u), and Ω is its antisymmetriccomponent. A vortex core is defined to exist where λ2 < 0, and the extremity ofthe vortex core is described by the contour λ2 = 0. Figure 5(a) shows a snapshot att∗ = 1.56, corresponding to a time soon after the transition from linear to nonlineargrowth of the perturbation field. The helical structure of the instability mode growingon the weaker vortex is typical of mode [−2, 0]. No perturbations are visible on thestronger vortex. Figure 5(b–d) shows snapshots during the nonlinear development ofthe perturbation. From t∗ = 1.81, vortex filaments are observed to emanate from theweaker vortex; at later times these wrap around the stronger vortex core (t∗ & 2.07).At t∗ = 2.34 (the final time shown in figure 5), the weak vortex has broken up intoa series of discrete vortex filaments, each wrapped around the stronger vortex. Thelooping structures cause periodic stretching of the stronger vortex, generating periodic
Stability of a Batchelor vortex pair 389
(a) (b)
(c) (d )
FIGURE 5. Snapshots showing iso-surface contours of the λ2 field during nonlineardevelopment of the instability (taken from DNS): (a) t∗ = 1.56; (b) t∗ = 1.81; (c) t∗ = 2.07;and (d) t∗ = 2.34. In each case, the iso-surface contour level chosen is λ2 =−0.1.
t*0 1 2 3
Cro
w
7.4
3
10–2
10–1
100
101
Kel
vin
8.4
6
40
45
50
55
60
t*0 1 2 3
(a) (b)
FIGURE 6. The square root of the total kinetic energy by mode as a function of t∗. (a) Plot ofE1/2 for mode 3 corresponding to the Crow instability (solid line) and mode 8 correspondingto the Kelvin mode [−2, 0, 1] instability (dashed line). The gradient of these lines providesthe growth rate of the instability modes, and measurements are indicated through the lineargrowth phase. (b) The reduction in E1/2 for the fundamental mode; the transition to nonlineargrowth is apparent at the point where the gradient changes discontinuously.
undulations of the stronger vortex profile (t∗ = 2.34), with a period commensurate withthe Crow instability wavelength. However, the perturbations are relatively small andthe stronger vortex retains its coherence until the conclusion of the simulation.
Following the work of Laporte & Corjon (2000), the square root of the kineticenergy (E1/2), measured for each Fourier mode, was used to directly predict the growthrate of perturbations. Figure 6(a) shows E1/2 for mode m= 3 (representing the growthof the Crow instability) and mode m = 8 (representing the growth of the Kelvinmode [−2, 0, 1]). These were the modes identified as displaying most energy using thestability analysis technique. Correspondingly, they were the modes that exhibited thehighest energy during the linear phase of growth in the DNS investigation.
Linear growth of the short-wavelength mode commences at t∗ ' 0.55, with a growthrate of σ ∗ = 8.46 being observed – in close agreement with the linear stability analysis
390 K. Ryan, C. J. Butler and G. J. Sheard
(σ ∗ = 8.5). Linear growth concludes at t∗ ' 1.5 where nonlinear terms begin todominate, reducing the growth rate in agreement with theory presented by Eloy &Le Dizes (1999).
The Crow instability commences linear growth at a later time, t∗ ' 0.65. Its lineargrowth rate is smaller than the Kelvin mode with σ ∗ = 7.43 (in close agreement withthe linear stability analysis where σ ∗ = 8.67). Linear growth of the Crow instabilityconcludes at t∗ ' 2.00. We note that the growth rate of the Crow instability becomesnonlinear at a later stage than the Kelvin mode. This may be directly linked tothe larger wavelength of the Crow instability. Small-scale structures, evolving in thenonlinear growth phase, have less impact on the large-wavelength Crow instabilitywhen compared to the comparatively short-wavelength Kelvin mode.
The growth rates predicted from the DNS, during the linear growth regime, werefound to be very close to those predicted by linear stability analysis, verifying theapplicability of the linear stability analysis technique employed. During the lineargrowth phase, the decrease in growth rate of the Kelvin mode, observed in the DNScalculations, is due to vortex core radii growth as a function of time, as described in§ 4.3.
Figure 6(b) shows E1/2 for the zeroth (two-dimensional) mode; E1/2k=0 is noted to
decay as a function of time during the linear phase of growth. An abrupt decrease inE1/2
k=0 is observed as the Crow instability transitions from linear to nonlinear growth, asenergy is transferred away from the Ek=0 mode to higher modes. At the conclusion ofthe simulation (t∗ = 3.00), E1/2
k=0 is '10 % less than what would be anticipated throughthe action of dissipative forces alone. From observation of figure 5, we note that muchof this energy transfer happens within the weaker vortex.
6.3.3. Perturbation mode shapes: direct numerical simulation resultsPerturbation fields at each critical wavenumber were obtained by extracting the
Fourier mode from the calculated DNS flow field corresponding to the instability modeof interest. This allows the resultant instability mode shapes to be compared directlywith the results from the linear stability study.
Two wavenumbers are considered here, corresponding to ka = 1.5 (where mode[−1, 1, 1] and mode [−2, 0, 1] were predicted to compete) and ka = 2.5 (where mode[−2, 0, 1] was predicted to dominate). While not shown here, the relatively simplermode shape corresponding to the Crow instability was found to agree precisely withthat predicted by the linear stability analysis technique.
Figure 7(a) shows an arbitrarily chosen x–y slice of the perturbation field forka = 1.5 at t∗ = 1.2. The twisting nature of mode [−2, 0, 1] means that the modeshape varies significantly along the axis of the vortex. The axial position of the x–yslice has been chosen to agree closely with the mode shapes shown in figure 3. Themode shape acting on the weaker vortex is clearly dominated by mode [−2, 0, 1].By contrast, on the stronger vortex, the mode shape, while strictly being definedas a mode [−2, 0, 1] profile, bears striking similarities to mode [−1, 1, 1] shown infigure 3(d).
During the linear growth phase, the mode shapes are well described as T2-periodicalong the axial direction. That is, the perturbation structures are identical half aperturbation wavelength along the axis, except that the sign of the perturbation isreversed. For this reason, we also consider the perturbation field for ka= 1.5 a quarterof a wavelength away from that shown in figure 7(a) (shown in figure 7b). At thiscross-section, the mode shape corresponds to mode [−2, 0, 1] on both vortices.
Stability of a Batchelor vortex pair 391
(a) (b)
(c) (d)
FIGURE 7. Perturbation axial vorticity fields obtained from DNS investigation. Fields areobtained by extracting Fourier modes of interest from the total solution. The panels showslices of these fields taken along the z axis. Slice locations have been chosen to comparedirectly with the findings from the linear stability study (figure 3). (a) The perturbation fieldfor mode 5. (b) The same mode as (a), but the slice is taken one quarter of a wavelengthfurther along the z axis. (c) The perturbation field for mode 8. (d) The same mode as (c), butthe slice is taken one quarter of a wavelength further along the z axis. In each case, shadedcontours are of the perturbation field; lightly shaded regions indicate a positive perturbation,and darker shaded regions indicate a negative perturbation. Line contours illustrate the baseflow field as per figure 2.
Figure 7(c,d) shows arbitrarily chosen x–y slices of the perturbation field forka = 2.5 at t∗ = 1.2. In this case, the perturbation mode shape growing on bothvortices is in agreement with that predicted for mode [−2, 0, 1]. In particular, themode shape shown in figure 7(c) is nearly identical to that predicted by the linearstability analysis (figure 3c).
6.4. Nonlinear development – stage 1Given that the weaker vortex displays significantly more deformation through the
nonlinear growth phase, we now consider the nonlinear perturbations growing on it inisolation. Nonlinear development of the vortex pair occurs over two distinct stages.In the first stage, the weaker vortex evolves to form axially periodic ‘clumps’of vorticity with a wavelength commensurate with the Kelvin perturbation. Thesecond stage is distinguished by the development of azimuthal filaments of vorticityemanating from the weaker vortex; these evolve to wrap around the stronger vortex.
392 K. Ryan, C. J. Butler and G. J. Sheard
A number of approaches exist to define the profile of a vortex core in a three-dimensional domain, principal among which is the λ2 field. Several prior investigationshave considered the magnitude of vorticity (|ω|) as a definition of the vortex coreprofile (see e.g. Laporte & Corjon 2000; Bristol et al. 2004), while others haveconsidered the axial component of vorticity in isolation (Leweke & Williamson 1998).As will be shown, we note a significant difference in the profile of the vortex coreas defined by the λ2 field when compared to the magnitude of vorticity (|ω|). Thismay result in significant differences in vortex profile when comparing experimentalvisualizations to DNS investigations, which have predominantly considered |ω|. Inorder to investigate the cause of this discrepancy, it is advantageous to simplify theequations that define the λ2 field, such that the dominant processes underpinning theinitial stages of nonlinear development may be clearly elucidated.
The definition of the λ2 field can be rewritten in a significantly simpler form by theassumption that the rate of change of all velocity components in the axial directionis less pronounced than that in the x–y plane. This assumption is valid for tworeasons: first, the base flow field has no variation in the axial direction; second, theperturbation velocity components vary more abruptly in the x–y plane than in the axialdirection. We assume that this same approximation holds during the initial stages ofthe nonlinear growth regime. Hence we may write
ωxz ' τxz ' ∂w
∂x, (6.9)
ωyz ' τyz ' ∂w
∂y, (6.10)
τzz ' 0. (6.11)
With these assumptions, the antisymmetric component of the velocity gradient tensorsimplifies to
Ω '
0 ωxy∂w
∂x
−ωxy 0∂w
∂y
−∂w
∂x−∂w
∂y0
, (6.12)
and the symmetric component of the velocity gradient tensor to
S '
τxx τxy∂w
∂x
τxy τyy∂w
∂y
∂w
∂x
∂w
∂y0
. (6.13)
From these definitions, and in the vicinity of the weaker vortex, we may approximatethe equation defining the eigenvalues (λ) as
(−ω2xy + τ 2
xx + τ 2xy − λ)2 λ+ α2(−ω2
xy + τ 2xx + τ 2
xy − λ)+β2(−ω2
xy + τ 2xx + τ 2
xy − λ)= 0, (6.14)
Stability of a Batchelor vortex pair 393
α = ωxy∂w
∂y+ τxx
∂w
∂x+ τxy
∂w
∂y, (6.15)
β =−ωxy∂w
∂x+ τyy
∂w
∂y+ τxy
∂w
∂x. (6.16)
The development of (6.14)–(6.16) relies on the assumption that τzz ' 0. This allowsus to write that, owing to continuity, τxx ' −τyy. Inspection of (6.14) reveals that thecomponent defining λ2 (the second largest root of (6.14)) may be written as
λ2ε =−ω2xy − τxxτyy + τ 2
xy =∂v
∂x
∂u
∂y− ∂u
∂x
∂v
∂y. (6.17)
Here we have defined λ2ε (our simplified approximation) to differentiate this from anexact calculation of the λ2 field. Perhaps unsurprisingly, it is the component of strainin the x–y plane, coupled with ωxy, that acts to dominate the definition of the λ2 field.Herein we define
τD = τ 2xy − τxxτyy (6.18)
as the ‘dominant strain’. Should the magnitude of the dominant strain exceed thatof ω2
xy, then the local fluid environment is dominated by the strain field, and the λ2εfield will not identify a vortex core at this location.
We note in passing that the approximation for λ2 defined by (6.17) is equallyvalid for the case of a Lamb–Oseen vortex pair. However, in that case, we may alsoassume that the axial component of velocity is small relative to the other components,simplifying (6.14).
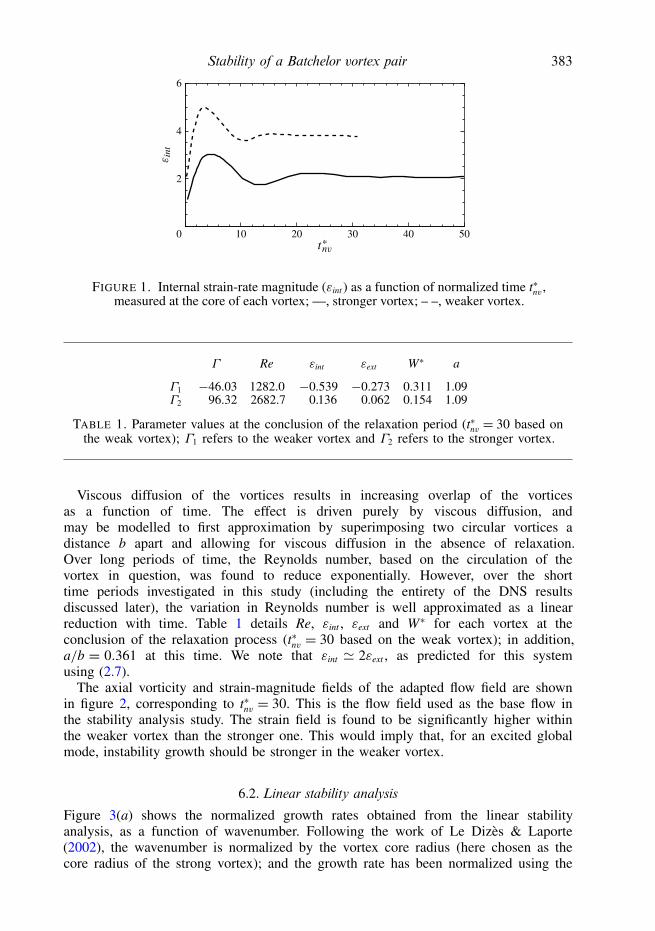
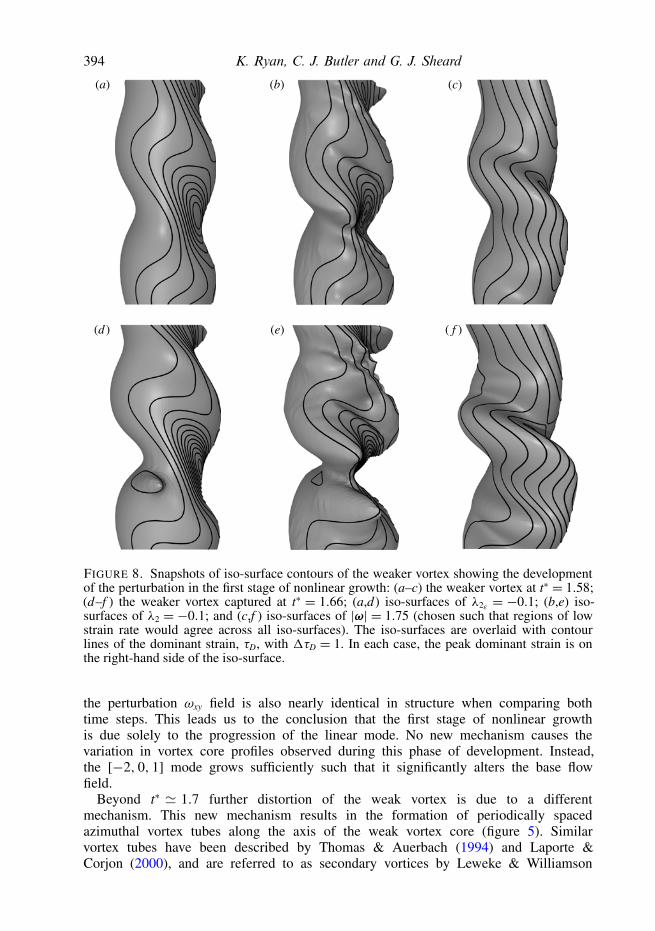
Figure 8 shows three definitions predicting the profile of the weaker vortex core fort∗ = 1.57 (figure 8a–c) and t∗ = 1.66 (figure 8d–f ). Iso-surfaces of the λ2ε field areshown in figures 8(a) and 8(d); iso-surfaces of the λ2 field are shown in figures 8(b)and 8(e); and iso-surfaces of |ω| are shown in figures 8(c) and 8(f ). The values of λ2,λ2ε and |ω| have been carefully chosen to ensure that the profiles agree in areas wherethe strain rate approaches zero. In each case, the strong vortex (not shown) is to theright-hand side of the weaker vortex. It is clear that the λ2 field identifies a vortex coreprofile that is markedly different from that identified by considering |ω|. At both times,the iso-surfaces of λ2ε correctly identify the major structures of the λ2 iso-surface.
Importantly, localized regions of tapering on the right-hand side of the vortex coreprofile (identified by both λ2 and λ2ε ) are not observed when considering the |ω|field. Indeed, these regions correspond closely to a localized thickening of the vortexcore profile, as predicted by the |ω| field. Figure 8 also identifies that the region ofhighest dominant strain rate corresponds almost precisely with the location of localizedtapering, in agreement with (6.17). On the left-hand side of the vortex, the profilesdescribed by both λ2 and |ω| agree very closely. We note that the dominant strain rateis negligible on the left-hand side of the vortex core. The effect of the dominant strainis to cause the Λ2 field to develop out of phase with |ω| along the axis of the weakervortex.
The dominant strain rate varies along the axis of the vortex with a periodcommensurate with the [−2, 0, 1] mode. Indeed, the periodic variation in λ2 is duepurely to the nonlinear development of the [−2, 0, 1] mode. We can show this byisolating the Fourier mode corresponding to the mode [−2, 0, 1] (ka= 2.5 in this case).Figure 9 shows cross-sections of the perturbation dominant strain rate for t∗ = 1.00(well within the linear growth regime) and t∗ = 1.66 (well within the nonlinear growthregime). The profiles of the two fields are essentially identical. While not shown,
394 K. Ryan, C. J. Butler and G. J. Sheard
(a) (b) (c)
(d ) (e) ( f )
FIGURE 8. Snapshots of iso-surface contours of the weaker vortex showing the developmentof the perturbation in the first stage of nonlinear growth: (a–c) the weaker vortex at t∗ = 1.58;(d–f ) the weaker vortex captured at t∗ = 1.66; (a,d) iso-surfaces of λ2ε = −0.1; (b,e) iso-surfaces of λ2 = −0.1; and (c,f ) iso-surfaces of |ω| = 1.75 (chosen such that regions of lowstrain rate would agree across all iso-surfaces). The iso-surfaces are overlaid with contourlines of the dominant strain, τD, with 1τD = 1. In each case, the peak dominant strain is onthe right-hand side of the iso-surface.
the perturbation ωxy field is also nearly identical in structure when comparing bothtime steps. This leads us to the conclusion that the first stage of nonlinear growthis due solely to the progression of the linear mode. No new mechanism causes thevariation in vortex core profiles observed during this phase of development. Instead,the [−2, 0, 1] mode grows sufficiently such that it significantly alters the base flowfield.
Beyond t∗ ' 1.7 further distortion of the weak vortex is due to a differentmechanism. This new mechanism results in the formation of periodically spacedazimuthal vortex tubes along the axis of the weak vortex core (figure 5). Similarvortex tubes have been described by Thomas & Auerbach (1994) and Laporte &Corjon (2000), and are referred to as secondary vortices by Leweke & Williamson
Stability of a Batchelor vortex pair 395
(a)
(c)
(b)
(d)
FIGURE 9. Perturbation dominant strain fields obtained from DNS investigation. Fields areobtained by extracting the eighth Fourier mode (corresponding to the Kelvin mode [−2, 0, 1])from the total solution. Images show slices of these fields taken along the z axis: (a,b) att∗ = 1.00 (well within the linear growth phase); (c,d) at t∗ = 1.66 (well within the nonlineargrowth phase); (b) and (d) are taken one quarter of a wavelength away from (a) and (c),respectively. In each case, shaded contours are of the perturbation field; lightly shaded regionsindicate a positive perturbation, and darker shaded regions indicate a negative perturbation.Line contours illustrate the base flow field as per figure 2.
(1998) for the case of equal-strength Lamb–Oseen vortices. Owing to the change indominant driving mechanism, we refer to t∗ ' 1.7 as the transitional time.
6.5. Nonlinear development – stage 2: the generation of secondary vorticesFigure 10 shows the progression of the weaker vortex core through the second stage
of the nonlinear growth regime. Iso-surfaces of λ2 =−0.1 are shown in figure 10(a–c),while iso-surfaces of |ω| = 1.75 are shown in figure 10(d–f ).
Considering the |ω| field, we note that there are two distinct bulges, which aredrawn azimuthally to the right-hand side of the weaker vortex core (and hence drawntowards the stronger vortex). These azimuthal bulges are noted to occur at a frequencycommensurate with the short-wavelength instability, and are referred to herein assecondary vortices.
The location of peak λ2, along the axis of the weak vortex, at the conclusion of theinitial stage of nonlinear growth induces two arms of λ2 to emanate from the weakervortex core at every position where |ω| exhibits an azimuthal bulge (and crosses thecritical streamline).
396 K. Ryan, C. J. Butler and G. J. Sheard
AABB
CC
AABB
CC
(a)
(d)
(b)
(e)
(c)
( f )
FIGURE 10. Snapshots of iso-surface contours showing the development of the perturbationin the second stage of nonlinear growth: (a–c) the weak vortex using iso-contours ofλ2 = −0.1; (d–f ) the weak vortex using iso-contours of |ω| = 1.75; (a,d) t∗ = 1.71;(b,e) t∗ = 1.79; (c,f ) t∗ = 1.87. The iso-surfaces are overlaid with contour lines of thedominant strain, τD, with 1τD = 2. In each case, the peak dominant strain is on the right-handside of the iso-surface.
Observation of the x–y streamlines, calculated in a reference frame fixed to themoving vortex pair, reveals the mechanism driving the formation of the secondaryvortices. Figure 11 shows, at a range of axial locations, contours of ωxy withstreamlines overlaid. At each axial location, the streamlines form hyperbolic pointslocated upstream and downstream of the vortex pair. The streamline joining the twohyperbolic points is referred to as the critical streamline. Any vorticity crossing thecritical streamline will be convected azimuthally around the neighbouring (stronger)vortex.
This phenomenon is well known; in two-dimensional flows, it leads to vortexstripping (see e.g. Mariotti, Legras & Dritschel 1994), significantly altering theprogression of the vortex pair. In three-dimensional flows, the vorticity crosses thecritical streamline periodically at the same axial wavelength as the Kelvin mode.Where the Crow instability draws one vortex closer to its neighbour, the effect isheightened, as a greater magnitude of vorticity crosses the critical streamline.
In figure 11(b), a proportion of the ωxy field, emanating from the weaker vortex,has crossed the critical streamline. At later times, this region of vorticity continues tobe pulled away from the weaker vortex core position, around the stronger vortex.Cross-sections taken immediately above (figure 11a) and below (figure 11c) theazimuthal bulge have less vorticity crossing the critical streamline. We observe thatthe slice shown in figure 11(b) has a local minimum in λ2; local maxima are observed
Stability of a Batchelor vortex pair 397
(a) (b) (c)
FIGURE 11. Cross-sections of vortex core development at t∗ = 1.79: (a), (b) and (c)correspond to sections AA, BB and CC, respectively, in figure 10. Shaded contours are ofωxy; dashed lines are λ2 = −0.1; and thin continuous lines are streamlines calculated in thereference frame attached to the rotating vortex pair.
immediately above and below this slice, leading to two arms of λ2 to be formed foreach Kelvin mode wavelength.
Our observations of the progression of the λ2 field are in close agreement with theexperimental observations of Leweke & Williamson (1998). They noted two secondaryvortex filaments occurring per short-wavelength instability for a counter-rotating, equal-strength Lamb–Oseen vortex pair. While the Kelvin mode [−1, 1, 1] (observed on theLamb–Oseen vortex pair) is substantially different in profile to the [−2, 0, 1] modeobserved here, we predict that the strain field would induce similar effects on theprogression of the Lamb–Oseen vortex pair to that described in § 6.4.
6.6. Late-stage nonlinear development
Figure 12 shows the late-stage development of the vortex pair (t∗ = 1.87 tot∗ = 2.21). Both λ2 and the magnitude of vorticity (|ω|) are employed to identifythe vortex core. The process described in § 6.5 has continued, pulling filaments fromthe weaker vortex completely around the stronger vortex. At these later stages, theCrow instability dominates the advection of the weaker vortex, leading to three distinctlocations where the weaker vortex has been sheared around the stronger vortex. Thesmaller-scale Kelvin mode structures are still present, but they are only significant atthree distinct locations in the axial direction.
It is interesting to note that, at this late stage of development, the peak magnitudeof vorticity is contained within the azimuthal filaments emanating from the weakervortex (not within the stronger vortex); the increased strength in vorticity is due tothe conservation of momentum as the azimuthal filaments are stretched around thestronger vortex.
In addition, we observe that the vorticity profile predicted by the |ω| fieldapproaches that predicted by λ2 as a function of time. Indeed, at t∗ = 2.2, onlyminor variations are observed between the two definitions. This convergence of vortexcore profile definitions is due to the late-stage evolution of the weaker vortex core asfilaments of azimuthal vorticity are stretched around the stronger vortex. We note that,within each vortex filament, the maximum vorticity component acts in the azimuthaldirection (relative to the stronger vortex), parallel to the direction of principal strain.For this reason, λ2 ' |ω|, and the two definitions converge. This is in sharp contrast tothe early stages of nonlinear development, where the direction of maximum vorticitywas normal to the direction of principal shear (as discussed in § 6.4).
398 K. Ryan, C. J. Butler and G. J. Sheard
(a)
(c)
(e)
(b)
(d )
( f )
FIGURE 12. Snapshots of iso-surface contours showing the late-stage development of theperturbation: the vortex pair is captured at (a,b) t∗ = 1.87, (c,d) t∗ = 2.00 and (e,f ) t∗ = 2.21;(a,c,e) iso-contours of λ2 = −0.1; (b,d,f ) iso-contours of |ω| = 1.75. This iso-contour levelof |ω| has been chosen such that the profile of the stronger vortex appears identical to thatpredicted by λ2 =−0.1.
7. DiscussionOverall, our findings question the efficacy of Crow and Kelvin instability modes to
enhance the dissipation of the vortex pair system for |Λ| 6= 1. Our choice of W∗ wascrucial in selecting which elliptic modes would dominate – a different selection wouldhave promoted other modes to grow in preference. However, considering the workof both Lacaze et al. (2007) and Roy et al. (2008), modes [−1, 1, 1], and [−2, 0, 1]dominate other modes for a considerable range of W∗ for both co- and counter-rotatingvortex pairs of equal circulation strength magnitude. We also note that the choice ofa/b (and hence εext) has a direct effect on the growth rate of any of the instabilitiesdiscussed.
Our detailed investigation of Λ = −0.5 clearly shows that, while the weaker vortexundergoes significant twisting and stretching, the stronger vortex exhibits virtually novariation in its structure, in general agreement with the finding for an unequal-strengthLamb–Oseen vortex pair (see e.g. Bristol et al. 2004). There are two causes forthis: first, the strain induced on the stronger vortex is significantly weaker, resultingin lower-amplitude perturbation mode shapes in the vicinity of the stronger vortex;second, the reduction in strain on the stronger vortex alters the principal angleof the Crow instability acting on the stronger vortex. In the case of Λ = −1, theprincipal angle drives the perturbed vorticity towards the critical streamline, allowingthe neighbouring vortex to further stretch the perturbed vorticity filaments in thenonlinear phase of growth. However, as θp increases, the (weakly) perturbed vortexelements of the strong vortex are no longer driven towards the critical streamline,reducing instability growth in the nonlinear phase.
Stability of a Batchelor vortex pair 399
The global rotation of the vortex pair induces high growth over a wider range of kathan found for an equal-strength counter-rotating vortex pair, in agreement with priorstudies.
As predicted by Lacaze et al. (2007), it is the [−2, 0] Kelvin mode that growspreferentially to the [−1, 1] mode observed for Lamb–Oseen vortex pairs. As theBatchelor vortex represents the asymptotic solution for a trailing line vortex profile fardownstream of an aircraft, it is unlikely that the mode [−1, 1] would be observed inan aircraft wake. Indeed, from the theoretical predictions presented by Lacaze et al.(2007), this will only occur for very low values of W∗. However, regardless of whichshort-wavelength instability mode dominates, it is the advection of vorticity elementsacross the critical streamline that provides the most dramatic dissipation of a vortexcore. Successful use of such passive dissipation techniques relies on the linear modeshape to actively propel vortex elements in this manner.
8. Conclusions
The combination of a linear stability analysis study with a three-dimensional directnumerical simulation has allowed us to determine the evolution of instabilities in anunequal-strength counter-rotating Batchelor vortex pair through both the linear andnonlinear growth regimes.
As shown by Lacaze et al. (2007), Batchelor vortex pairs exhibit a range of Kelvinmode shapes beyond those found for Lamb–Oseen vortex pairs. Our findings supporttheir conclusions: a Kelvin mode [−2, 0] is observed to grow in preference to theKelvin mode [−1, 1] in the linear growth phase, and this alters the progression ofthe nonlinear development, especially in the initial and secondary stages of nonlineardevelopment. Tertiary nonlinear development is dominated by the Crow instability. Themode shape and growth rate of the Crow instability is nearly identical to that expectedfor a Lamb–Oseen vortex pair, and thus the final mode shape of the vortex pairappears similar to prior DNS investigations of a Lamb–Oseen vortex pair.
Instability growth occurs predominantly on the weaker vortex, leading to secondaryvortex filaments wrapping around the stronger vortex. It is only in the tertiary stage ofnonlinear growth that perturbations are observed to grow on the stronger vortex.
Acknowledgements
The authors thank the Monash eResearch Centre (MeRC) for access to their centralcompute facility. C.J.B. thanks Monash Engineering for the Engineering ResearchAllowance supporting his study. G.J.S. thanks NCI for access to their NationalFacility through a Merit Allocation Scheme grant. NCI is supported by the AustralianCommonwealth Government. K.R. and G.J.S. received financial support from MonashUniversity Faculty of Engineering Small Grants.
400 K. Ryan, C. J. Butler and G. J. Sheard
R E F E R E N C E S
ASH, R. L. & KHORRAMI, M. R. 1995 Vortex stability. In Fluid Vortices (ed. S. I. Green), chap. 8,pp. 317–372. Kluwer.
BATCHELOR, G. K. 1964 Axial flow in trailing line vortices. J. Fluid Mech. 20 (4), 645–658.BLACKBURN, H. M. & SHEARD, G. J. 2010 On quasi-periodic and subharmonic Floquet wake
instabilities. Phys. Fluids 22 (3), 031701.BLACKBURN, H. M. & SHERWIN, S. J. 2004 Formulation of a Galerkin spectral element–Fourier
method for three-dimensional incompressible flows in cylindrical geometries. J. Comput. Phys.197 (2), 759–778.
BRISTOL, R. L., ORTEGA, J. M., MARCUS, P. S. & SAVAS, O. 2004 On cooperative instabilities ofparallel vortex pairs. J. Fluid Mech. 517, 331–358.
CROUCH, J. D. 1997 Instability and transient growth for two trailing-vortex pairs. J. Fluid Mech.350, 311–330.
CROW, S. C. 1970 Stability theory for a pair of trailing vortices. AIAA J. 8 (12), 2172–2179.ELOY, C. & LE DIZES, S. 1999 Three-dimensional instability of Burgers and Lamb–Oseen vortices
in a strain field. J. Fluid Mech. 378, 145–166.FABRE, D., JACQUIN, L. & LOOF, A. 2002 Optimal perturbations in a four-vortex aircraft wake in
counter-rotating configuration. J. Fluid Mech. 451, 319–328.GARTEN, J. F., WERNE, J., FRITTS, D. C. & ARENDT, S. 2001 Direct numerical simulations of the
Crow instability and subsequent vortex reconnection in a stratified flow. J. Fluid Mech. 426,1–45.
HEATON, C. J. 2007 Centre modes in inviscid swirling flows, and their application to the stability ofthe Batchelor vortex. J. Fluid Mech. 576, 325–348.
JEONG, J. & HUSSAIN, F. 1995 On the identification of a vortex. J. Fluid Mech. 285, 69–94.JIMENEZ, J. 1975 Stability of a pair of corotating vortices. Phys. Fluids 18, 1580–1581.KARNIADAKIS, G. E., ISRAELI, M. & ORSZAG, S. A. 1991 High-order splitting methods for the
incompressible Navier–Stokes equations. J. Comput. Phys. 97 (2), 414–443.KARNIADAKIS, G. E. & SHERWIN, S. J. 2005 Spectral/hp Element Methods for Computational
Fluid Dynamics, 2nd edn. Oxford University Press.KARNIADAKIS, G. E. & TRIANTAFYLLOU, G. S. 1992 Three-dimensional dynamics and transition
to turbulence in the wake of bluff objects. J. Fluid Mech. 238, 1–30.KERSWELL, R. R. 2002 Elliptical instability. Annu. Rev. Fluid Mech. 34, 83–113.LACAZE, L., BIRBAUD, A.-L. & LE DIZES, S. 2005 Elliptic instability in a Rankine vortex with
axial flow. Phys. Fluids 17, 017101–1.LACAZE, L., RYAN, K. & LE DIZES, S. 2007 Elliptic instability in a strained Batchelor vortex.
J. Fluid Mech. 577, 341–361.LAPORTE, F. & CORJON, A. 2000 Direct numerical simulations of the elliptic instability of a vortex
pair. Phys. Fluids 12, 1016–1031.LE DIZES, S. & LAPORTE, F. 2002 Theoretical predictions for the elliptical instability in a
two-vortex flow. J. Fluid Mech. 471, 169–201.LE DIZES, S. & VERGA, A. 2002 Viscous interactions of two co-rotating vortices before merging.
J. Fluid Mech. 467, 389–410.LEWEKE, T. & WILLIAMSON, C. H. K. 1998 Cooperative elliptic instability of a vortex pair.
J. Fluid Mech. 360, 85–119.LEWEKE, T. & WILLIAMSON, C. H. K. 2011 Experiments on long-wavelength instability and
reconnection of a vortex pair. Phys. Fluids 23, 024101.KELVIN, LORD 1880 Vibrations of a columnar vortex. Phil. Mag. 10, 155–168.MARIOTTI, A., LEGRAS, B. & DRITSCHEL, D. G. 1994 Vortex stripping and the erosion of
coherent structures in two-dimensional flows. Phys. Fluids 6, 3954.MARSHALL, J. S., BRANCHER, P. & GIOVANNINI, A. 2001 Interaction of unequal anti-parallel
vortex tubes. J. Fluid Mech. 446, 229–252.MEUNIER, P. & LEWEKE, T. 2005 Elliptic instability of a co-rotating vortex pair. J. Fluid Mech.
533, 125–159.
Stability of a Batchelor vortex pair 401
MOORE, D. W. & SAFFMAN, P. G. 1975 The instability of a straight vortex filament in a strainfield. Proc. R. Soc. Lond. A 346, 413–425.
ORTEGA, J. M., BRISTOL, R. L. & SAVAS, O. 2003 Experimental study of the instability ofunequal-strength counter-rotating vortex pairs. J. Fluid Mech. 474, 35–84.
ROY, C., LEWEKE, T., THOMPSON, M. C. & HOURIGAN, K. 2011 Experiments on the ellipticinstability in vortex pairs with axial core flow. J. Fluid Mech. 677, 383–416.
ROY, C., SCHAEFFER, N., LE DIZES, S. & THOMPSON, M. C. 2008 Stability of a pair ofco-rotating vortices with axial flow. Phys. Fluids 20, 094101.
RYAN, K. & SHEARD, G. J. 2007 Nonlinear growth of short-wave instabilities in a Batchelorvortex pair. In Proceedings of the 16th Australasian Fluid Mechanics Conference, Schoolof Engineering, The University of Queensland (ed. P. Jacobs, T. McIntyre, M. Cleary, D.Buttsworth, D. Mee, R. Clements, R. Morgan & C. Lemckert). pp. 1463–1469.
SAFFMAN, P. G. 1992 Vortex Dynamics. Cambridge University Press.SCHAEFFER, N. & LE DIZES, S. 2010 Nonlinear dynamics of the elliptic instability. J. Fluid Mech.
646, 471–480.SCORER, R. S. & DAVENPORT, L. J. 1970 Contrails and aircraft downwash. J. Fluid Mech. 43 (3),
451–464.SHEARD, G. J., FITZGERALD, M. J. & RYAN, K. 2009 Cylinders with square cross section: wake
instabilities with incidence angle variation. J. Fluid Mech. 630, 43–69.SIPP, D., JACQUIN, L. & COSSU, C. 2000 Self-adaptation and viscous selection in concentrated
two-dimensional vortex dipoles. Phys. Fluids 12, 245.SO, J., RYAN, K. & SHEARD, G. J. 2011 Short-wave instabilities on a vortex pair of unequal
strength circulation ratio. Appl. Math. Model. 35 (4), 1581–1590.THOMAS, P. J. & AUERBACH, D. 1994 The observation of the simultaneous development of a long-
and a short-wave instability mode on a vortex pair. J. Fluid Mech. 265, 289–302.THOMPSON, M. C., HOURIGAN, K. & SHERIDAN, J. 1996 Three-dimensional instabilities in the
wake of a circular cylinder. Exp. Therm. Fluid Sci. 12 (2), 190–196.TSAI, C.-Y. & WIDNALL, S. E. 1976 The stability of short waves on a straight vortex filament in a
weak externally imposed strain field. J. Fluid Mech. 76, 721–733.WIDNALL, S. E., BLISS, D. B. & TSAI, C.-Y. 1974 The instability of short waves on a vortex ring.