Copyright © 2020 Nigerian Meteorological Society Page 62
JOURNAL OF METEOROLOGY AND CLIMATE SCIENCE J. Met & Clim. Sci. 18(1): 62-69 (March, 2020)
Nigerian Meteorological Society
N.Met.S
RAINFALL CHARACTERISTICS IN THE HUMID AND
TRANSITION ZONES OF SOUTHWEST, NIGERIA
*1LAYI-ADIGUN,
B. O,
1UFOEGBUNE G.C,
1MAKINDE A.A,
2AHMAD S.M,
3OYELAKIN J.F &
1DADA V.O.
1Department of Water Resources Management and Agricultural Meteorology, Federal University of
Agriculture, Abeokuta, Ogun State; 2Department of Biological, Geological and Environmental Sciences, University of Bologna, Italy;
3Department of Civil Engineering, University of Ibadan, Oyo State
*Corresponding Author: [email protected]
Abstract: Rainfall characteristics are important for agriculture since they are the variable constant in rain-fed agriculture.
Three important characteristics of rainfall are its amount, frequency and intensity, the values of which vary from place to place,
day to day, month to month and also year to year. Precise knowledge of these characteristics is essential for planning the full
utilization of rainfall. This study compared rainfall characteristics in the humid zone (Lagos) and transition zones (Abeokuta and
Ibadan) in South-Western Nigeria. Daily rainfall data for 26 years (1985-2010) were used to determine the rate of
evapotranspiration using the FAO56 Penman-Monteith method for evapotranspiration while dry spells and rain days were
subjected to inferential and descriptive statistics. During the 26years period, the mean rainfall in Abeokuta, Ibadan and Lagos
was 1236.77mm, 1418.8mm and 1507mm respectively. Results found that there was no statistically significant difference in
amount and incidence of rainfall in Lagos and Ibadan only. On average, dry spell varies from 6-35days with
Lagos>Abeokuta>Ibadan while Abeokuta had the mean highest evapotranspiration rate followed by Ibadan and Lagos, during
the study period.
Keywords: Mean amount, humid period, climate change, moisture, crop growth
INTRODUCTION
Precipitation or rainfall, is the most dynamic
hydrometeorological variable which controls
the existence of ecosystems and also the
agricultural, industrial, and economic
development of a country and may show high
variability in its distribution. Understanding the
spatial and temporal distribution of rainfall is
critical for framing and implementing better
agricultural and industrial development
projects (Arvor et al, 2014).
Individuals have devoted more effort at
collecting climatic data than to their
subsequent analysis. The major way to improve
data quality is to analyze the existing data to
demonstrate their importance and
shortcomings. Rainfall is a climatic parameter
that affects the way and manner man lives. It
affects every facet of the ecological system,
flora and fauna inclusive. Hence, the study of
rainfall is important and cannot be over
emphasized (Obot and Onyeukwu, 2010).
Rainfall is by far the most important element
of climate change in Nigeria and water
resources potential in the country and the
impact could be measured in terms of
effects on crop growth, availability of soil
water, soil erosion, incident of pest and
diseases, sea level rise and decrease in soil
fertility (Adejuwon, 2004)
Agricultural productivity is strongly linked to
rainfall variability, than any other element of
climate in the tropics because farmers rely on
rain fed agriculture. Therefore water scarcity is
a major constrain to crop production. Rainfall
determines not only where and when to plant
crops but also whether crop will yield
effectively or not. The amount of rainfall that
is normally received determines which type of
agriculture the can be carried out, and which
crop that can be cultivated in a region. The
seasonal rainfall occurrence regulates the
agricultural calendar in the tropical region of
Africa (Ayanlade et al, 2009).
Rainfall provides most of the needed water for
agriculture in the tropics. The role of moisture
in agriculture is even more spectacular in
tropics where because of relative high
temperature throughout the year, the rate of
evaporation is constantly high. On the other
hand, rainfall is highly seasonal over most part
of the tropics. Because temperature is high
Copyright © 2020 Nigerian Meteorological Society Page 63
Layi-Adigun, B.O, Ufoegbune G.C, Makinde A.A, Ahmad S.M, Oyelakin J.F and Dada V.O.
throughout the year, to ensure the growth of
crops over most parts of the tropics with
exception of few mountain areas, the growing
season/harvest unlike in the temperate region
is determined by availability of rainfall (Ayoade,
2003)
High or low precipitation has significant effect
on agriculture. All crops need at least some
water to survive; therefore rain (being the most
common source of water) is important to
agriculture. A regular rainfall pattern is usually
vital for crop development but too much or
too little rainfall can be harmful, even
devastating to crops. Drought can kill crops if
it‘s severe, while overly wet weather can cause
harmful fungus to flourish and affecting crops.
Different crops need varying amounts of
rainfall to survive. In areas with excessive
rainfall, soil nutrients diminish and erosion
increase (Southern Sudan Agrometeorology
Update, 2010). Whenever there is late onset,
hunger, temporal unemployment and poverty
loom. Dry spells and droughts which are
related to rainfall and occur annually in Nigeria
(Audu E.B et al 2012, Sawa B.A 2011) are
injurious to crops leading to crop failure.
Living organisms (both plants and animals
including man) cannot survive without
optimum water supply. Although, it has been
argued that rainfall (water) and temperature are
the most important climatic determinants of
crop survival and production especially in
Nigeria. However, generally; temperature has
remained favorable to crop production
especially during the growing season, but
rainfall is not only disappointing, but also
erratic, highly unreliable and unpredictable.
Meanwhile, Nigeria which still practices rain –
fed agriculture rely on the ―mercy of nature‖ to
produce adequate food and the needed raw
materials for the few agro allied industries.
(Adebayo, 1997, Audu, 2012)
Generally, the study of the weather and
climatic elements of a region is vital for
sustainable development of agriculture and
planning. Particularly, rainfall and temperature
temporal analyses for trends, fluctuations and
periodicities are deemed necessary as such can
indirectly furnish the ―health‖ status of an
environment. A declining and/or rising trend
etc. may be quite instructive for different
segments of the human and natural systems.
Impending long or short term weather –
related natural disasters for instance may be
predicted and better mitigated or adaptive
actions initiated through the analysis of the
fluctuations and return periods of the series.
Extreme weather events that can lead to
drought and prolonged heat spell; flooding etc.
can be accessed through the statistical analysis
of a region‘s temporal rainfall regime
(Afangideh et al 2010).
Over the years, there has been considerable
increase in rainfall records which are very
important in planning and design of the water
projects and Agro Meteorological studies. The
study of weather and climatic element; rainfall
of Abeokuta, Ibadan and Lagos respectively is
vital for sustainable development of agriculture
and planning.
Extreme and unusual weather events, resulting
in loss of life and property and disruption of
socio-economic activities, are part of daily
experiences all over the world. The increasing
frequency and intensity of these events
constitute a major challenge to socio-economic
development, particularly in developing
countries. The main aim of this study is to
compare rainfall characteristics in the
Abeokuta, Ibadan and Lagos as timely
continuous analysis of weather and climate
information is a vital tool for planning in key
sectors of the economy that are sensitive to
weather. The knowledge amount of rainfall,
number of rainy days and its distribution over
the cropping season are important for timely
preparation of seed bed, selection of crop
varieties, choice of cropping pattern.
METHODOLOGY
Description of Study Area: The study areas
of this discourse are Abeokuta, Ibadan and
Lagos in South Western Nigeria. Abeokuta lies
in the rainforest belt of the tropics between
Latitude 7˚10 N and 7˚15 N and longitude
3˚17 E and 3˚ 26 E. Abeokuta is 100 km North
of Lagos and 80km Southwest of Ibadan with a
terrain composed of granite and metamorphic
rock of basement complex with an altitude
ranging from 120 m to 180m above sea level.
The topography is rugged with distinctly
pronounced domed and boulder strewn hills
Copyright © 2020 Nigerian Meteorological Society Page 64
J. Met & Clim. Sci. 18(1): 62-69 (March, 2020)
rising approximately 170m above sea level.
Ibadan is located on Latitude 7˚20 and 7˚26 of
the equator and 3˚48 and 3˚56 east of the
Greenwich Meridian. Ibadan is located in the
southern eastern part of Oyo State and about
120km east of the border with the Republic of
Benin in the forest zone close to the boundary
between the forest and the savanna. The city
ranges in elevation from 150m in the valley
area to 275m above sea level on the major
north-south ridge which crosses the central
part of the city. Lagos is located at latitude 6
27 N and Longitude 3 24 E. This falls just
above the equator on African continent. This
elongated state spans the Guinea coast of the
Atlantic Ocean for over 180km., from the
Republic of Benin on the west to its boundary
with Ogun state in the east. The topography of
Lagos is dominated by its system of islands,
sandbars and lagoons. The city itself sprawls
over four main islands: Lagos, Iddo, Ikoyi and
Victoria which are connected to each other and
to the mainland by a system of bridges. The
entire territory is low lying being only 22feets
above sea level.
Figure 1: Map of the study areas
Data Sources: Daily rainfall data for 26 years
(1985-2010) were obtained from the archives
of National Horticultural Research Institute
(NIHORT), Department of Water Resources
Management & Agricultural Meteorology
(Federal University of Agriculture Abeokuta)
and Nigerian Meteorological Agency (NIMET)
where rainfall data are routinely measured and
recorded. Availability and reliability of the
annual rainfall data was considered foremost,
as each station has longstanding operational
synoptic stations, standard equipment and
personnel, data to be gathered are therefore
high grade.
Data Analysis: Instat⁺ software application
was used to explain and analyze the rainfall
data. Rainfall data was entered into excel
spread sheet and were imported into Insat plus.
The study employed the FAO56 Penman-
Monteith method to analyze rate of
evapotranspiration. The FAO56 Penman-
Monteith method estimates ET rates for a well
Copyright © 2020 Nigerian Meteorological Society Page 65
Layi-Adigun, B.O, Ufoegbune G.C, Makinde A.A, Ahmad S.M, Oyelakin J.F and Dada V.O.
referenced water surface based on physical
atmospheric observations of solar radiation,
temperature, wind speed and relative humidity.
This estimate is commonly referred to as
reference ET.
( )
where Rn is the net radiation, G is the soil heat
flux, (es-ea) represents the vapour pressure
deficit of the air, ra is the mean air density at
constant pressure, Cp is the specific heat of the
air, D represents the slope of the saturation
vapour pressure temperature relationship, g is
the psychrometic constant, and rs and ra are the
(bulk) surface and aerodynamic resistances.
The Analysis of Variance (ANOVA) was used
to test for variation among the average total
and mean annual rainfall of the three weather
stations by comparing their means to see if
there are statistically significant differences
among them.
A preliminary task, when looking at dry spells,
is to define a dry day. The obvious definition is
any day with zero rainfall. However, when
comparing stations, one often finds that
different observers are not equally
conscientious in the recording of small
rainfalls, or in the extent to which data are
rounded. The criterion used in this study
adopts Nigerian Meteorological Agency
(NIMET) standard for South Western Nigeria.
NIMET adopts rainfall threshold value of 0.85
mm and defines the starts of the raining season
as the first 10 days period with at least 30 mm
of rainfall with dry spells not exceeding 5 days
in the next ten day period. It rained for 2325
days out of about 9516 days. Year 1986 had
extremely low and the lowest annual amount of
rainfall of 796.8 mm over the 26 years period
which could have led to drought, reduction in
crop yield and available water resources.
RESULTS AND DISCUSSION
Table 1 showed the total rainfall, mean rainfall
and rainy days for respective years from 1985
to 2010 in the study area. In Abeokuta, total
amount of rainfall was 32155.9 mm, mean
amount of rainfall was 1236.77 mm and mean
monthly amount of 103.64 mm while the
highest amount of rainfall was 1615.7 mm in
year 2007 and lowest is 796.8 mm in 1986. It
showed the number of rainy days i.e. a day with
rainfall amount above the threshold amount of
0.85 mm, this means that days with rainfall
amount less than the threshold doesn‘t count
as rainy days.
In Ibadan, The total amount of rainfall was
36888.4 mm, mean amount of rainfall was
1418.79 mm and mean monthly amount of
118.23 mm while the highest amount of rainfall
was 2115 mm in year 2008 and the lowest is
1007.7 mm in 1998. It rained for 2346 days out
of about 9516 days. Year 1992, 1994, 2001and
2004 also had very low annual amount of
rainfall of 1131.2 mm, 1034.4 mm and 1204.2
mm respectively. Year 1987, 1989, 1990, 1991,
1993, 1996 and 2001 had rainfall varying
slightly from the mean. In Lagos, the total
amount of rainfall was 39192.4 mm, mean
amount of rainfall was 1507.4 mm and mean
monthly amount of 125.62 mm while the
highest amount of rainfall is 1802.3 mm in year
2002 and lowest is 926.5mm in 1998. It rained
for 2334 days out of about 9516 days.
Overall, the mean annual rainfall in Abeokuta
was 1236.77 mm, though the number of years
below the mean is more than the number of
years above it. The values of those above the
mean are very alarming; the abnormal rainfall
in Abeokuta could be harmful to the types of
crop grown in the locality. The annual rainfall
in Abeokuta favors the growing of maize,
pepper, tomato etc. The mean annual rainfall in
Ibadan is 1418.8 mm, with the number of years
below the mean equal to the number of years
above it; the values of those above the mean
are very alarming as well. The mean annual
rainfall in Lagos was 1507.4 mm; the number
of years below the mean is less than those
above it. It is worthy of note that despite their
proximity, Abeokuta, Ibadan and Lagos have
different years of maximum rainfall amounts.
Copyright © 2020 Nigerian Meteorological Society Page 66
J. Met & Clim. Sci. 18(1): 62-69 (March, 2020)
Table 1: Characteristics of rainfall in the study area during the study period
Year Abeokuta Ibadan Lagos
TR MEAN RD TR MEAN RD TR MEAN RD
1985 1092.3 91 85 1492.3 124.4 95 1052.9 87.7 91
1986 796.8 66.4 69 1475 122.9 71 1015.2 84.6 73
1987 1277.1 106.4 103 1345.3 112.1 93 1688.7 140.7 87
1988 1608.5 134 96 1455.5 121.3 93 1927 160.6 93
1989 1370.8 114.2 110 1265 105.4 92 1368.9 114 85
1990 1105.2 92.1 90 1287.3 107.3 94 1610.1 134.2 87
1991 1173.1 97.6 101 1321.9 110.2 93 1671.8 139.3 96
1992 1076.5 89.7 87 1131.2 94.3 83 1188.4 99 81
1993 1193.6 99.5 81 1344.6 112.1 93 1671.5 139.3 92
1994 878.8 73.2 77 1034.4 86.2 79 1141.3 95.1 74
1995 1177.5 98.1 102 1483.5 123.6 81 1629.8 135.9 121
1996 1471.6 122.6 101 1358.4 113.2 100 1589.5 132.5 89
1997 1354.9 113 93 1251.6 104.3 116 1749.6 145.8 78
1998 1118.5 93.2 82 1007.7 84 80 926.5 77.2 60
1999 1529.8 127.5 92 1860.8 155 115 1667.9 139 100
2000 1209.9 100.8 85 1392.8 116 76 1209.6 100.8 91
2001 849.2 70.8 68 1230.2 102.5 79 1392.1 116 88
2002 1253.1 104.4 88 1588.6 132.4 96 1802.3 150.2 96
2003 1470.2 122.5 91 1616.6 134.7 86 1692.1 141 91
2004 1167.2 97.3 87 1204.2 100.4 75 1699.2 141.6 92
2005 924.2 77 73 1487.6 124 85 1483.9 123.s7 90
2006 1149.3 95.8 82 1733.4 144.5 92 1516.9 126.4 97
2007 1615.7 134.6 91 1486.9 123.9 101 1649.1 137.4 86
2008 1398.3 116.5 92 2115 176.3 101 1779.9 148.3 104
2009 1346 112.2 90 1428.5 119 85 1384.4 115.4 85
2010 1547.8 129 109 1490.1 124.2 92 1683.8 140.3 107
*TR- Total rainfall RD-Rainy Days Mean-Mean monthly rainfall
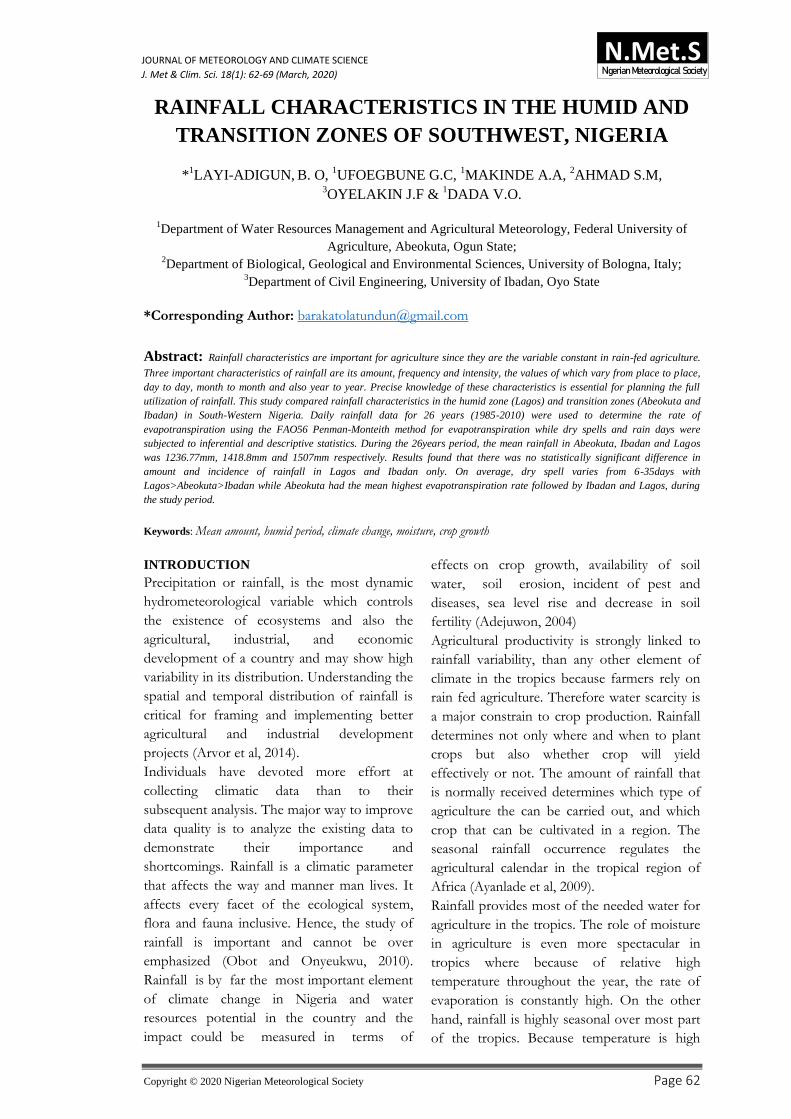
Annual variation of dry spell in the study areas
Lagos has the highest number of long spell in
the humid period, followed by Abeokuta and
Ibadan. The longest dry spell during the study
period in the study area is 34days. The longest
dry spell in the Abeokuta ranges between 6-25
days which could have been detrimental to
crops grown. The crops may have been aided
by irrigation during the period of dry spell to
enhance crop growth and prevent loss of
crops.
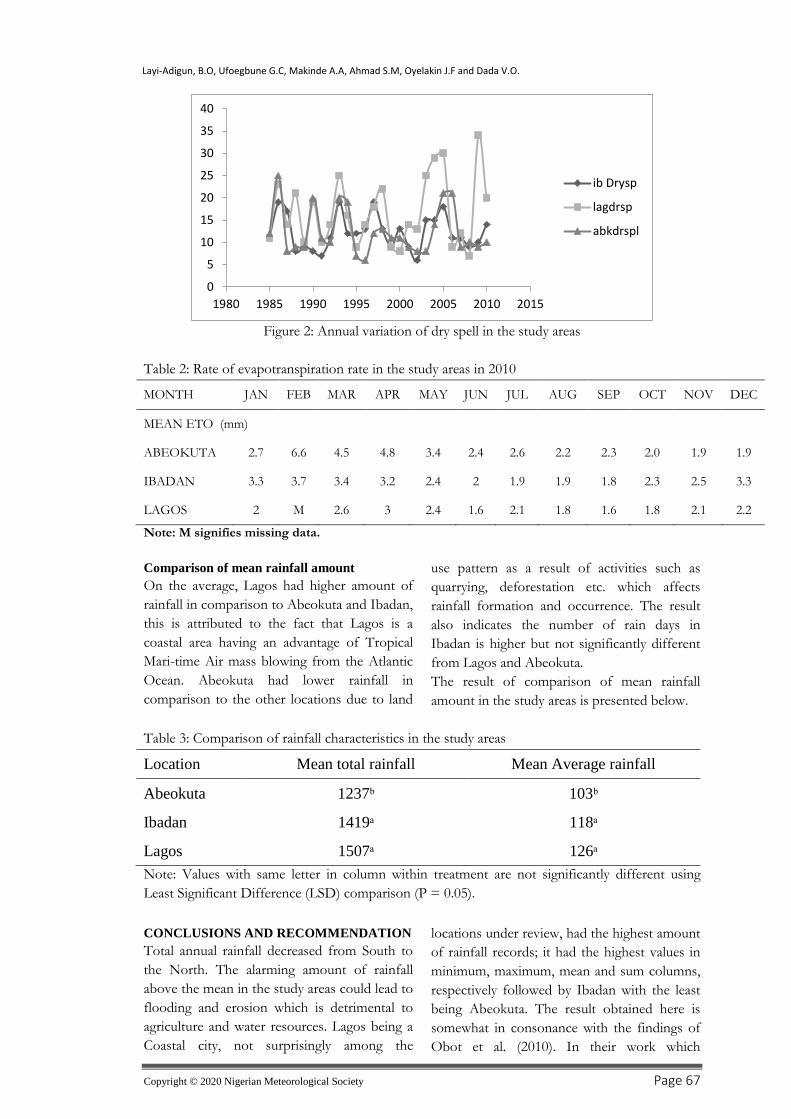
Determination of rate of evapotranspiration
Table 2 illustrated the evapotranspiration rate
in the study area. In Abeokuta, the mean
annual evapotranspiration rate was 3.2mm.
February had the highest evapotranspiration
rate of 6.6mm (peak value) with November
and December with least amount of 1.9mm
respectively. For Ibadan, the mean annual
evapotranspiration rate is 2.7mm. February had
the highest evapotranspiration rate of 3.7mm
with September with least amount of 1.8mm.
In Lagos, the mean annual evapotranspiration
rate is 2.2mm. April has the highest
evapotranspiration rate of 3mm with June and
September with least amount of 1.6mm.
Highest evapotranspiration rate for Ibadan and
Abeokuta was recorded in February while
highest evapotranspiration rate for Lagos was
recorded in April. Abeokuta had the mean
highest evapotranspiration rate followed by
Ibadan and Lagos. The highest rate of
evapotranspiration was recorded during dry
season.
Copyright © 2020 Nigerian Meteorological Society Page 67
Layi-Adigun, B.O, Ufoegbune G.C, Makinde A.A, Ahmad S.M, Oyelakin J.F and Dada V.O.
Figure 2: Annual variation of dry spell in the study areas
Table 2: Rate of evapotranspiration rate in the study areas in 2010
MONTH JAN FEB MAR APR MAY JUN JUL AUG SEP OCT NOV DEC
MEAN ETO (mm)
ABEOKUTA 2.7 6.6 4.5 4.8 3.4 2.4 2.6 2.2 2.3 2.0 1.9 1.9
IBADAN 3.3 3.7 3.4 3.2 2.4 2 1.9 1.9 1.8 2.3 2.5 3.3
LAGOS 2 M 2.6 3 2.4 1.6 2.1 1.8 1.6 1.8 2.1 2.2
Note: M signifies missing data.
Comparison of mean rainfall amount
On the average, Lagos had higher amount of
rainfall in comparison to Abeokuta and Ibadan,
this is attributed to the fact that Lagos is a
coastal area having an advantage of Tropical
Mari-time Air mass blowing from the Atlantic
Ocean. Abeokuta had lower rainfall in
comparison to the other locations due to land
use pattern as a result of activities such as
quarrying, deforestation etc. which affects
rainfall formation and occurrence. The result
also indicates the number of rain days in
Ibadan is higher but not significantly different
from Lagos and Abeokuta.
The result of comparison of mean rainfall
amount in the study areas is presented below.
Table 3: Comparison of rainfall characteristics in the study areas
Location Mean total rainfall Mean Average rainfall
Abeokuta 1237ᵇ 103ᵇ
Ibadan 1419ᵃ 118ᵃ
Lagos 1507ᵃ 126ᵃ
Note: Values with same letter in column within treatment are not significantly different using
Least Significant Difference (LSD) comparison (P = 0.05).
CONCLUSIONS AND RECOMMENDATION
Total annual rainfall decreased from South to
the North. The alarming amount of rainfall
above the mean in the study areas could lead to
flooding and erosion which is detrimental to
agriculture and water resources. Lagos being a
Coastal city, not surprisingly among the
locations under review, had the highest amount
of rainfall records; it had the highest values in
minimum, maximum, mean and sum columns,
respectively followed by Ibadan with the least
being Abeokuta. The result obtained here is
somewhat in consonance with the findings of
Obot et al. (2010). In their work which
0
5
10
15
20
25
30
35
40
1980 1985 1990 1995 2000 2005 2010 2015
ib Drysp
lagdrsp
abkdrspl
Copyright © 2020 Nigerian Meteorological Society Page 68
J. Met & Clim. Sci. 18(1): 62-69 (March, 2020)
assessed 30 years (1978-2007) rainfall data in
Nigeria, they concluded that Nigeria is
bounded at the extreme South by the Atlantic
Ocean and Calabar having the highest values in
maximum, mean and sum rainfall values was
attributed to the fact that it is a coastal city.
This study also found that the longest dry
spells in the humid period (April to October)
occurs mostly during the August break which
varies from three weeks to one month and the
dry spell occurring in April and October
indicates that rainfall is well established after
the dry spell in April and the dry season starts
in October i.e. the wet season in the transition
zones is between April to October. Rainfall
retreats truly towards the end of October and
early November. Thus, the months of April
and May qualify as the first two months into
the rainy season while the last two months to
the end of the rainy season in the sub-region
are September and October.
The result also revealed that Abeokuta, Ibadan
and Lagos had evapotranspiration rate of
3.2mm, 2.7mm and 2.2mm respectively. In year
2010, Abeokuta had higher rate of
evapotranspiration than the other study areas.
This could be due to its location in a
mountainous region which is expected to
generate more heat. The evapotranspiration
rate of Lagos can be linked to its proximity to
the Atlantic Ocean. Also, the lower rate is also
due to the missing data in February hence, the
result for Lagos is inconclusive.
In conclusion, there is no significant difference
between the mean annual amount of rainfall in
Lagos and Ibadan but there is difference
between the mean annual amount between
Lagos and Abeokuta, and Ibadan and
Abeokuta respectively.
The study recommends that farmers should
plant crops that can withstand high variability
of rainfall especially in Abeokuta. Relevant
authorities in the study areas should put
appropriate measures in place to prevent
flooding which could lead to loss of lives and
properties. Ground practices such as mulching,
terracing etc. should be encouraged in order to
reduce rate of evapotranspiration especially in
Abeokuta
REFERENCES
Adebayo, A.A. ‗‗The Application of Agro –
Climatology to Agricultural Planning in
Adamawa State, Nigeria‖. Journal of
Applied Science and Management, Vol. 1,
No. 1. Pg. 69. 1997
Adejuwon, S. A. ‗‗Impact of Climate Variability
and Climate Change on Crop Yield in
Nigeria‖. Being the lead paper
presented at the stakeholders‘
workshop on Assessment of Impacts
and Adaptation to Climate Change
(AIACC), Obafemi Awolowo
University, Ile-Ife, Sept.20-21, 2004.
Afangideh A.I., Francis E. Okpiliya and Eja
E.I. ―A Preliminary Investigation into the
Annual Rainfall Trend & Patterns for
Selected Towns in Parts of South-Eastern
Nigeria‖. Journal of Sustainable
Development Vol.3, No.3, pgs. 1-8.
September 2010.
Arvor D, Dubreuil V, Ronchail J, Simões M,
Funatsu B.M. ― Spatial patterns of rainfall
regimes related to levels of double cropping
agriculture systems in MatoGrosso (Brazil)‖.
Int J Climatol 34(8):2622–2633. 2014
Audu, E.B., Audu H.O., Binbol N.L., Gana
J.N. ―Climate Change and its Implication
on Agriculture in Nigeria‖. The Abuja
Journal of Geography and
development 3(2): (8-19).
Audu, E.B. ―A Descriptive Analysis of Rainfall for
Agricultural Planning in Lokoja Local
Government Area of Kogi State, Nigeria‖.
International Journal of Science and
Technology ISSN 2224-3577 Volume
2 No.12, December 2012
Ayanlade, A.T.O. and Odekunle, E.I,
Orimogunje, O.P and Adeoye, N.O.
―Inter-Annual Climate variability and Crop
yield anomalies in Middle Belt of Nigeria‖.
Advances in Natural and Applied
Sciences. 3(3). 453 – 465. [6] 2009.
Ayoade, J.O. ―Introduction to Climatology for the
Tropics‖.Spectrum, Ibadan, Nigeria
2003.
Obot N.I., Onyeukwu N.O. ―Trend of rainfall in
Abeokuta, Ogun State, Nigeria: A 2-year
experience (2006-2007)‖. J. Env. Iss.
Agric.Dev. Count., 2(1): 70-81 2010.
Copyright © 2020 Nigerian Meteorological Society Page 69
Layi-Adigun, B.O, Ufoegbune G.C, Makinde A.A, Ahmad S.M, Oyelakin J.F and Dada V.O.
Obot N.I., Chendo M.A.C.,Udo S.O. and
Ewona I.O. ―Evaluation of Rainfall
Trends in Nigeria for 30years (1978-2007).
International Journal of the Physical
Sciences Vol.5 (14), pp.2217-2222
2010.
Sawa, B.A. ―Climate Change and Spatio-Temporal
Variability in Occurrence of Dry Spells in
Nothern Nigeria (1976-2005)‖. Zaria
Geographer. Published by Geography
Department, Faculty of Science,
Ahmadu Bello University, Zaria
Nigeria. Vol 18, No. 1, 2011. Pg. 24-25
Southern Sudan Agrometeorology Update.
Produced by Food Security and
Technical Secretariat (FSTS), Southern
Sudan Center for Census, Statistics
and Evaluation (SSCCSE) in
collaboration with Government of
Southern Sudan Institutions. Month:
July, 2010 Release date: 15th August,
2010 Volume: 0010