j , _ , N95- 14594 Landsat Pathfinder Tropical Forest Information Management System W. Salas t, W. Chomentowski t, J. Harville +, D. Skole _, K. Vellekamp * J t / , , _'Complex Systems Research Center, University of New Hampshire, Durham, NH 03824 +Reseach Computing Center, University of New Hampshire, Durham, NH 03824 BACKGROUND Tropical Deforestation is a real world problem that is scientifically significant and policy- relevant. In the last twenty years, the systematic destruction of tropical forests has become a global scale problem warranting attention from both scientists and policymakers. In terms of science it has been consistently singled out as a key element of many areas of global change research, including: global carbon cycle and climate change, biomass burning and atmospheric chemistry, and land surface water and energy balance. In terms of policy it is a central component of such high level initiatives as the Framework Convention on Climate Change, the Intergovernmental Panel on Climate Change, international tropical timber trade negotiations, and the General Agreement on Tariffs and Trade (the so-called GATT agreements). The concern over tropical deforestation arises because of its potential influence on climate change and its general impact on the global environment. If deforestation continues at the current rate as much carbon dioxide and other greenhouse gases will be put into the atmosphere in the next 75 years as has been put into the atmosphere in the last 300 years and the potential for climate change will increase. Recent scientific findings suggest that deforestation can also influence climate change by altering sensible and latent heat flux, planetary albedo, and surface roughness at the planetary boundary layer. More local effects include increases in the fi'action of precipitation as surface run-off, soil erosion, and an eventual local decline in precipitation. Perhaps the greatest irreversible change associated with deforestation is the loss of biodiversity from habitat destruction and fragmentation. Some estimates suggest that the current rates of deforestation could result in the loss of up to one half of the world stock of genes, which would dramatically reduce the biological diversity of the plant and animal species and would severely limit the future of genetic stocks for biotechnology development. Existing programs are obtaining the necessary earth science datasets. The Humid Tropical Forest Inventory Project (HTFIP) is the main component of NASA's Landsat Pathfinder Program. For two years it has been acquiring large amounts of high resolution Landsat data and has been mapping deforestation. When complete the project archive may be as much as 1,000 Gigabytes. This archive provides complete Landsat coverage with less than 20% cloud cover for tropics in South America, Central Africa, and Southeast Asia for three points in time: late 1970s, 83 https://ntrs.nasa.gov/search.jsp?R=19950008180 2018-08-25T04:43:48+00:00Z
Transcript
j , _ ,
N95- 14594
Landsat Pathfinder Tropical Forest Information Management System
W. Salas t, W. Chomentowski t, J. Harville +, D. Skole _, K. Vellekamp *
J
t / , ,
_'Complex Systems Research Center, University of New Hampshire, Durham, NH 03824
+Reseach Computing Center, University of New Hampshire, Durham, NH 03824
BACKGROUND
Tropical Deforestation is a real world problem that is scientifically significant and policy-
relevant. In the last twenty years, the systematic destruction of tropical forests has become a
global scale problem warranting attention from both scientists and policymakers. In terms of
science it has been consistently singled out as a key element of many areas of global change
research, including: global carbon cycle and climate change, biomass burning and atmospheric
chemistry, and land surface water and energy balance. In terms of policy it is a central component
of such high level initiatives as the Framework Convention on Climate Change, the
Intergovernmental Panel on Climate Change, international tropical timber trade negotiations, and
the General Agreement on Tariffs and Trade (the so-called GATT agreements).
The concern over tropical deforestation arises because of its potential influence on climate change
and its general impact on the global environment. If deforestation continues at the current rate as
much carbon dioxide and other greenhouse gases will be put into the atmosphere in the next 75
years as has been put into the atmosphere in the last 300 years and the potential for climate
change will increase. Recent scientific findings suggest that deforestation can also influence
climate change by altering sensible and latent heat flux, planetary albedo, and surface roughness at
the planetary boundary layer. More local effects include increases in the fi'action of precipitation
as surface run-off, soil erosion, and an eventual local decline in precipitation.
Perhaps the greatest irreversible change associated with deforestation is the loss of biodiversity
from habitat destruction and fragmentation. Some estimates suggest that the current rates of
deforestation could result in the loss of up to one half of the world stock of genes, which would
dramatically reduce the biological diversity of the plant and animal species and would severely
limit the future of genetic stocks for biotechnology development.
Existing programs are obtaining the necessary earth science datasets. The Humid Tropical
Forest Inventory Project (HTFIP) is the main component of NASA's Landsat Pathfinder
Program. For two years it has been acquiring large amounts of high resolution Landsat data and
has been mapping deforestation. When complete the project archive may be as much as 1,000
Gigabytes. This archive provides complete Landsat coverage with less than 20% cloud cover for
tropics in South America, Central Africa, and Southeast Asia for three points in time: late 1970s,
mid 1980s, and early 1990s. The project has been acquiring data from the US national archives,
foreign ground stations, and programmed acquisitions. Already the information produced by theproject has made policy and scientific impacts.
However, to increase its usefulness, this information must be readily accessible. The raw
data and derived products from HTFIP are important for scientists, policy makers, and educators.
Because the HTFIP image library is large and stored at a single location, it is essential to provide
tools that make browsing the library possible and make the library available over a high speed
network. An Information Management System which incorporates digital library technology could
make the information available on the Internet. Such development would ideally be targeted to
three primary user communities: (a) earth scientists who need access to low and high level
primary data usually in the form of satellite imagery, (b) policy makers who need access to the
derived products and distilled information and relevant ancillary information usually in the form of
digital maps, summary statistics, and published papers (and occasional sample images), and (c)
educators and students (K-12) who need highly distilled or synthesized information more in the
form of an on-line multi-media encyclopedia.
These themes echo those inherent in the National Information Infrastructure (NII) concept. We
emphasized in our development approach that the Tropical Forest Information Management
System (TFIMS) would make earth science data simultaneously relevant and accessible by a wide
range of users, from young students to active scientists. We have had first hand experience in this
regard through our involvement in developing the first test of the NII. Under the umbrella of the
National Information Infrastructure Testbed the University of New Hampshire and Sprint
collaboratively developed a prototype of the Landsat Pathfinder TFIMS last year.
_TRODUCTION
A Tropical Forest Information Management System has been designed to fulfill the needs of
HTFIP in such a way that it tracks all aspects of the generation and analysis of the raw satellite
data and the derived deforestation dataset. The system is broken down into four components:
satellite image selection, processing, data management and archive management. However, as we
began to think of how the TFIMS could also be used to make the data readily accessible to all
user communities we realized that the initial system was too project oriented and could only be
accessed locally. The new system needed development in the areas of data ingest and storage,while at the same time being implemented on a server environment with a network interface
accessible via Internet. This paper summarizes the overall design of the existing prototype
(version 0) information management system and then presents the design of the new system
(version 1). The development of version 1 of the TFIMS is ongoing. There are no current plans
for a gradual transition from version 0 to version 1 because the significant changes are in how the
data within the HTFIP will be made accessible to the extended community of scientists, policy
makers, educators, and students and not in the functionality of the basic system.
84
VERSION 0: EXISTING PROTOTYPE TFIMS
Version 0 has three distinct modules: query and browse, data management, and archive
management. The query and browse section enables a user to locally search both US and foreign
archive image metadata. The data management module is the project accounting system used to
track imagery through the processing stream until it is archived. The archive management module
picks up where the data manager leaves off by providing an interface to the data archive and a
vehicle by which a user can explore the data.
Quew and Browse: The query and browse module is a tool to graphically search TFIMS online
metadata libraries. Two libraries are available for exploration, a large library containing global
coverage from Landsat, SPOT, and the India Remote Sensing (IRS) satellite, or the smaller
HTFIP library. The global library contains the metadata for all US Landsat holdings
(approximately 790,000 MSS and 200,000 TM scenes), as well as holdings from all foreign
Landsat ground stations that report to the Landsat Ground Station Operators Working Group
(approximately an additional 700,000 MSS and 500,000 TM scenes). In addition, the library
contains metadata for three Landsat receiving stations that have not reported to LGSOWG:
Thailand, Ecuador and India. The global library also contains metadata for all IRS-1A and IRS-1B
data and all the metadata for SPOT XS data acquired over the tropics. To our knowledge this is
the most comprehensive metadata library for this type of imagery and is a valuable and important
part of the TFIMS.
A single metadata entry contains 55 seperate items describing the image. The items provide
information about the sensor, satellite, date of acquisition, identification, satellite reference
system, geographical position of its center point, percent cloud cover, overall quality of the image,
how the scene was recorded, etc. Some scenes will not have entries for all of its items due to
differences in the sensors and ground station standards. A "no data" value is assigned to those
items to insure that the user understands that information for that entry is not available. While
these 55 items provide detailed information, there is no substitute for being able to visually inspect
the image. Hence, availability of digital browse products would greatly enhance the usefulness ofthe metadata. There is a concerted effort in the Landsat community to create browse products for
the historical archive and for all new acquisitions. Therefore, the HTFIP libraary will contain a
browse product for each of its approximately 2700 Landsat images.
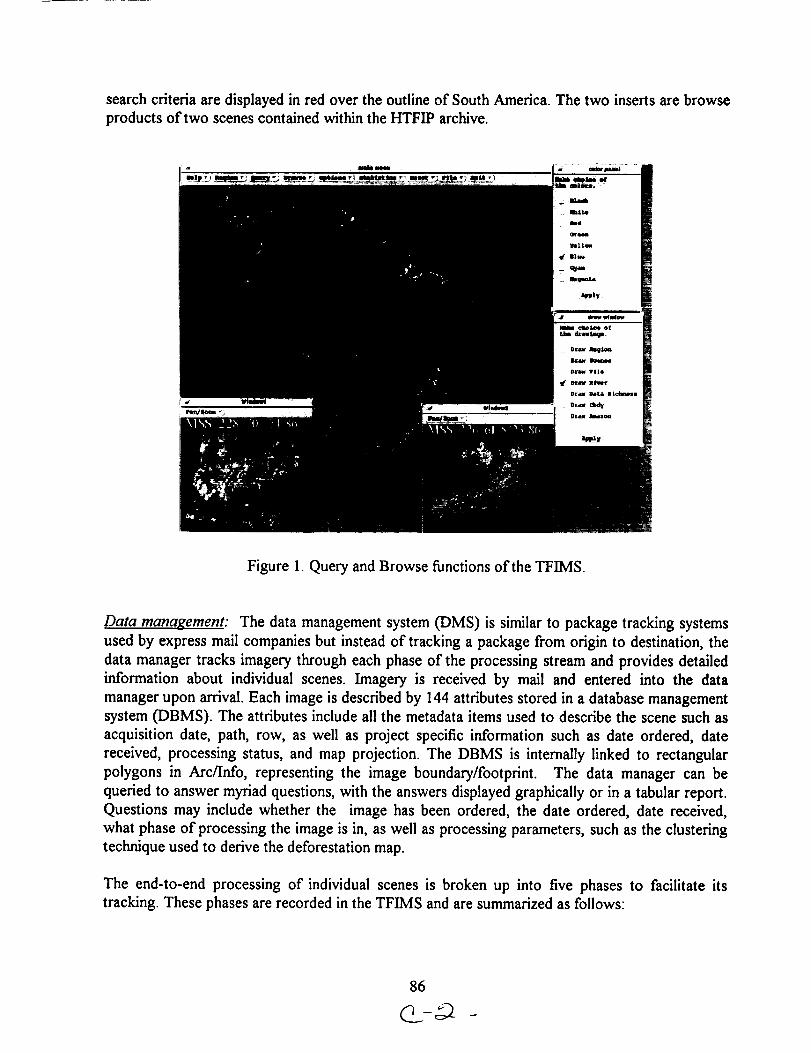
To search the metadata library with the query and browse tool, pull-down menus are used to
define a query with constraints on geographic region, date, cloud cover and/or a number of other
image descriptors. The query result is displayed as one or many rectangular polygons outlining
the image footprint. Other data layers can be displayed simultaneously such as a regional
coastline, vegetation, and towns. If a more detailed view of a selected scene is desired, a
compressed picture, called a browse product, can be displayed by clicking on a footprint of
interest. Figure 1. highlights both functions of this module by showing the result of a query for
data availability from the archive at the EROS Data Center that are within Brazil for a specific
date, image quality, and cloud cover. The geographic extent of all scenes that met the user defined
85
searchcriteriaare displayed in red over the outline of South America. The two inserts are browse
products of two scenes contained within the HTFIP archive.
Figure 1. Query and Browse functions of the TFIMS.
Data management: The data management system (DMS) is similar to package tracking systems
used by express mail companies but instead of tracking a package from origin to destination, the
data manager tracks imagery through each phase of the processing stream and provides detailed
information about individual scenes. Imagery is received by mail and entered into the data
manager upon arrival. Each image is described by 144 attributes stored in a database management
system (DBMS). The attributes include all the metadata items used to describe the scene such as
acquisition date, path, row, as well as project specific information such as date ordered, date
received, processing status, and map projection. The DBMS is internally linked to rectangular
polygons in Arc/Info, representing the image boundary/footprint. The data manager can be
queried to answer myriad questions, with the answers displayed graphically or in a tabular report.
Questions may include whether the image has been ordered, the date ordered, date received,
what phase of processing the image is in, as well as processing parameters, such as the clustering
technique used to derive the deforestation map.
The end-to-end processing of individual scenes is broken up into five phases to facilitate its
tracking. These phases are recorded in the TFIMS and are summarized as follows:
phase O:
phase I:
phase 2:
phase 3:
phase 4:
scene has been ordered for HTFIP.
scene has been received and passed quality control.
scene has been digitally classified and converted from raster to vector.
scene has been manually edited based on visual interpretation at 1:250,000 scale.
scene has been georegistered and edgematched with its neighbors.
When an image has been ordered it is added to the database via the graphical user interface and
considered to be in phase 0. Pertinent information is recorded which includes the aforementioned
fields path, row, year, month, day, and sensor as well as other information such as region and data
source. When an image arrives the inventory control specialist (ICS) updates the DBMS with
quality control data and verifies that the image was ordered. Each image product arrives in a
package which includes an 8mm tape containing the data descriptor record (DDR) and the digital
data. The DDR is read directly from the tape to the DBMS and includes information such as the
unique scene identification code, corner point coordinates in Universal Transverse Mercator
(UTM) projection, and UTM zone. This information is initially used to match the new scene with
the order request. Once the image passes this quality control step it is in phase 1 of the
processing stream.
Upon completion of a phase, information necessary to reach that phase is entered by the ICS. For
example, entering phase 2 information involves updating image processing parameters such as
threshold values or clustering reclassification values as well as output histogram values and
analyst name and date. In the future this information will be entered into a batch file which will be
accessed weekly to update the DBMS automatically. Currently for phase 3 and phase 4 the date
of completion is recorded. Further revisions will include information on initial and final numbers
of polygons for each output class for phase 3 and move parameters for edge-matching for phase4.
The user may query the DBMS for information regarding a particular image or for more
information regarding the project inventory as a whole. The DMS is equipped to produce lists of
scenes received, scenes sent to other processing centers, the processing phase of an image and
scenes canceled due to inaccuracies in the metadata. Alternately, the user may enter the graphics
mode to display this same information graphically utilizing the link to the scenes geographic
information. The displayed image footprints may be overlaid on other geographically referenced
information such as country boundaries, other satellite data, or vegetation maps. These displays
can then be saved as postscript files for hardcopy outputs.
Archive Management: Managing the project archive effectively is an integral part of the data
base. The archive will consist of almost 2700 Landsat MSS and TM scenes spanning a wide
geographic area and a twenty year time period. In addition to imagery the archive will contain
ancillary information such as ground truth data, scientific papers and allow access to wide area
networks (WAN). The system to manage this archive consists of a hardware component to store
the data and a software component to browse the archive. The storage system hardware
combines three media types, magnetic disk, 8 mm tape and magneto optical. The system is able
to store 500 Gb and provide near real time access. The storage system is linked to the network via
87
a data server. The soRware component is built around a commercial off the shelf (COTS)
geographic information system. It provides an easy to use, graphical interface to the archive.
Before entering the archive management module it is assumed that the user has browsed the
metadata library with the query and browse section and has chosen an image to examine closely.
The archive manager does not have the capability to browse the whole library, it is used to
explore one or more images in detail. Access to multi-media ground truth data or wide area
networks is available through objects on the screen or pull down menus. Multi-media ground
truth data which include photographs taken with a 35mm camera at the site, an audio description,
and a written description are visualized by the archive manager.
Data recorded on site is linked to the georeferenced imagery by locations recorded in the fieldwith a global positioning system (GPS). Upon invoking the archive manager the previously
chosen satellite scene appears on the screen with data collection sites. The user can focus on an
area of interest by zooming and panning around the image. To visualize data collected on the
ground a point of interest is chosen with the mouse. Each location is internally linked to digitized
photos, audio, and text. After clicking on the location all available ground data from the site of
choice is displayed or in the case of audio transmitted through a built in speaker. Currently
photographs are digitized with a scanner however photo cd technology is being implemented for
use by the archive manager. Currently, the archive manager contains data collected by scientists
at UNH. Links to detailed data bases outside of UNH at organizations such as The NatureConservancy and The Missouri Botanical Gardens are being developed.
Within the archive manager a user can access WAN tools such as Mosaic and Gopher. Such acapability enables access to national library card catalogs and on line data from most scientific
research centers. Mosaic and Gopher are started with a pull down menu. The archive managerhas a small internal library containing scientific journal articles on subjects pertinent to research at
UNH. We are developing a collaborative browse capability using a high speed WAN so thatscientists at remote sites can analyze a data set simultaneously. With a collaborative browse tool
two or more scientists view the same data set simultaneously discuss it, overlay other data sets,and communicate over an audio and video link.
The archive manager is used to store multi media data, to access the HTF'IP data library, and to
visualize satellite and ground data. It is being used operationally in the Landsat Pathfinder project
to assist in photo interpretation. It can also be used by scientists working on global change or
students interested in the tropical forests. It is a more effective way to store and visualize multi-
media data than slides in a three ring binder with written notes and locations. It can also be a
useful scientific tool because two scientists, thousands of miles apart will be able to visualize thesame data simultaneously.
Figure 2. is an example of how the GPS locations are displayed on the imagery with the
corresponding photographs, field notes, and link to the WAN. This figure depicts several of the
key functions of the archive management system. On the lef_ side are several GPS points depicted
as green boxes with cross hairs and overlayed on Landsat MSS imagery. One of the points has
been selected (shown in white) and the field notes are displayed in the text window with two
88
slides taken at the point displayed below the text window. On the right side of the figure are the
links to the WAN via Gopher and Mosaic.
Figure 2. Archive Management functions of the TFIMS
LANDSAT PATHFINDER TFIMS: VERSION 1
Why redesign the existing prototype information management system? While the prototype
described above met the initial needs of our tropical deforestation mapping project, a more
elegant and efficient system is being designed to enable the system to be accessed and used by a
diverse group of users. To facilitate this we plan to make the new system faster and accessible
over the Internet. The redesign of the prototype focuses on two broad areas: implementation of
more sophisticated data ingest and storage techniques and development of the system
environment. This section of the paper describes the planned development for the new system.
Data Ingest and Storage: To efficiently utilize large databases of satellite imagery and associated
derived products, sophisticated data ingestion and compression techniques are required. In
addition, to make the data truly accessible and usable for the many various users the data must be
89
made available in a variety of formats. While development of compression techniques is
developing rapidly, sufficient capabilities exist now to handle these databases in an elegant andtimely manner.
We plan that version 1 will utilize both lossy and lossless compression techniques. The need for
both types of compression can be seen in the following two examples. For browse products
generation, the benefit from higher compression ratios associated with loss), techniques will more
than offset the degraded image quality of the reconstructed browse images. However, some
visualization capabilities will require reconstruction of full resolution lossless images. For
example, the images from the digital library for depicting location of in situ ground data need to
be accurately reconstructed at full resolution to enhance integration of the different data layers.
Lossy compression techniques include JPEG and Sarnoff methods. JPEG uses a predictive
modeling technique based on differential pulse code modulation with varying, user defined,
compression quality settings. Higher compression ratios can be achieved using lower quality
settings.. Success of predictive modeling techniques is dependent on the degree of correlation
within the dataset, therefore, the high spectral and spatial correlation within satellite datasets bids
well for these techniques. We plan to test all eight predictors available within JPEG to assess
which predictor(s) tend to work well with Landsat imagery from the tropics.
Lossless compression techniques will be required to display, at user defined resolutions, m situ
ground data and other spatial datasets simultaneously with satellite data. The basic theory behind
lossless compression is to remove all redundancy (or correlation) within the dataset and is
accomplished in two phases: decorrelation and coding. Several decorrelation techniques will be
evaluated with each type of dataset in this system to design the most efficient models. These
techniques include dictionary based modeling (like the Lempel-Ziv algorithm used by the UNIX
compress command) and predictive modeling (differential pulse code modulation with various
predictors). We plan to evaluate Huffman and Arithmetic coding based on their speed inreconstructing the imagery.
Another important capability of the lossless compression techniques to be examined is the
efficiency (speed) at which compressed full resolution images can be reconstructed at various user
defined resolutions. This need for multiresolution display capabilities arises from the wide
variation in the spatial scale of analyses and datasets. We plan to explore how efficiently various
decorrelation and coding methods work within the context of multiresolution display.
We expect the success of the decorrelation and coding techniques to vary significantly due to
distinct approaches among the algorithms and the inherent differences in the datasets. However,
the format of the datasets and the data ingest and retrieval techniques will also influence the speed
of the compression, decompression, and the compression ratios. Since Hierarchical Data Format,
or HDF, is the current choice for the storage format for EOS-DIS, it is imperative that these
techniques are evaluated on HDF data sets. For example, images are stored Science Data Sets
within HDF, and, therefore, are stored as band sequential (BSQ) files. The compression ratios for
images stored as BSQ will be different than if the same image were stored as a band interleaved
file due to differences in correlation between pixels adjacent in spectral or spatial space. Our
90
evaluationof the various existing compression techniques will drive what format the datasets will
be stored in. In an effort to provide the datasets in a suite of output formats we are developing a
series of translators to provide the user with some flexibility in formats.
Version 1 System Environment: The Pathfinder TFIMS Version 1 will be accessible over the
Internet and an Asynchronous Transfer Mode (ATM) wide area network (WAN). The system
environment is composed of four main parts: data server; compute server; application server and
network environment with connections to the Internet or an ATM WAN (Figure 3). System
development will emphasize four components: data server, compute server, application server,
and the network environment.
Data Server: The data server environment provides the device management and data storage
functions of the system. This subsystem controls the file server and physical device access to the
data archive. The data server environment includes: a UNIX server, magnetic disks, an optical
disk storage device, an 8mm tape storage device and the compression algorithms involved in
archiving data. The data server provides archive storage and access to the following categories
of data and information: metadata, Landsat digital imagery, imagery analyses and synthesis data,
field data, publications, supporting documents and a variety of multimedia information; and
ancillary data and maps.
The magnetic disks provide a front end to nearly one terabyte of archived data/information on
magneto optical disks and 8mm tapes. Users request archived data/information from specially
configured file systems on the magnetic disks. Requests for archived data/information that are not
currently present on the magnetic disks are delivered automatically, using robotic technology, to
the magnetic disks from either the magneto optical disks or 8mm tapes. This is referred to as
"near line" data. At this point the data/information remains directly accessible on the magnetic
disks until a configuration parameter has been reached causing the data/information to be
removed from the magnetic disks. Typically, this happens when the data/information has not been
used for a defined period of time. When required, the data/information may be delivered directly
to a locally attached disk on the compute server, application server or users workstation.
The actual requests for archived data and information are embedded in the TFIMS and are thus
transparent to the user. The TFIMS presents a menu driven point and click graphical user
interface (GUI) for users to select areas and types of data/information. The TFIMS converts
these menu selections into requests for specific data/information and then sends requests to the
data server. This approach lends itself well to a distributed computing environment (DCE) as
there can be multiple data servers in different locations providing data and information seamlessly
to the user. These details are hidden from the user and thus, provide a simple integrated access tothe data and information for all users.
Compute Server: The compute server consists of four CPUs providing required data processing
and I/O services. This server is used to manipulate and process metadata, raw image data,
derived products, conduct analyses of collected data and for the development of multimedia data.
91
RData oU
Server ter
-
I, l t e erf
Optical Disks 8mm Tapes
...........Arc!3iwd Dat._!lf0@a!!0n .............
Landsat Digital Imagery Publications J
Metadata Field Data
Imagery Analyses Synthesis Data
Ancillary Data
i C°mpute [_
Server 1
i
lEthemet
ATM
Internet
or
WAN
I End User
Figure 3. System Environment for the TFIMS
Application Server: The application server provides users with a GUI to the TFIMS, interfaces
with the data server and compute server and handles user requests for ordering products. Version
0 relies on a licensed software product, Arclnfo. As the prototype develops into IMS Version 1,
a Mosaic interface will be introduced to allow offsite user access via the Internet. Additionally,
the reliance on Arclnfo will be minimized with the Mosaic version. Graphic images produced by
Arclnfo will be saved in a format (e.g. GIF, TIFF, JPEG, HDF) compatible with common or
publicly available graphics tools (e.g. xv). This will allow all image display data to be accessible
to Mosaic users without the use of Arclnfo. The Mosaic interface will provide Internet users the
ability to conduct query and browse operations of both metadata and imagery, order imagery and
derived products and obtain ancillary multimedia information. IMS Version 1 (non Mosaic
version) supported by Arclnfo will still be used internally to develop and track new products.
92
Network Environment: The network environment consists of local networks and network
protocols interconnected via the Internet or an ATM WAN. Locally the network protocols and
environment consist of an FDDI ring connecting all local servers, developer stations and on site
end user stations. Additionally, the FDDI ring will be connected to a router which will provide
remote users network access to the local network. The use of an FDDI ring locally provides
transport of data at rates up to 100 MBs a second. This is ten times the transfer rate of ethernet
thus, allowing for rapid timely transfer of large amounts of image data. For external connections
to the local network, both an Internet and ATM connection will be available. The ATM
connection will provide remote users with data transfer rates ranging from 45 MBs to 155 MBs
per second.
The network interface module will be provided by using the Mosaic interface. Mosaic will allow
applications and data to be distributed over the network on different servers at different locations
all transparent to the user. As a model for a Science Computing Facility IMS, the TFIMS Mosaic
version will allow the seamless integration of new functions and data from different
sources/locations without burdening the user with knowing where the data and applications areand how to access them.