Consultant : FLOOD DAMAGE ASSESSMENT OF 26 APRIL 2001 FLOODING AFFECTING THE KLANG VALLEY AND THE GENERALISED PROCEDURES AND GUIDE LINES FOR ASSESSMENT OF FLOOD DAMAGES KTA Tenaga sdn bhd CONSULTING ENGINEERS * JURUTERA PERUNDING FINAL REPORT Volume 2 - Guidelines and Procedures for the Assessment of Flood Damages in Malaysia October 2003 JABATAN PENGAIRAN DAN SALIRAN WILAYAH PERSEKUTUAN / RTB LEMBAH SG. KLANG
Transcript
Consultant :
FLOOD DAMAGE ASSESSMENTOF 26 APRIL 2001 FLOODING
AFFECTING THE KLANG VALLEYAND
THE GENERALISED PROCEDURES ANDGUIDE LINES FOR ASSESSMENT OF
FLOOD DAMAGES
KTA Tenaga sdn bhdCONSULTING ENGINEERS * JURUTERA PERUNDING
FINAL REPORT Volume 2 - Guidelines and Procedures for the
Assessment of Flood Damages in Malaysia
October 2003
JABATAN PENGAIRAN DAN SALIRANWILAYAH PERSEKUTUAN / RTB LEMBAH SG. KLANG
‘FLOOD DAMAGE ASSESSMENT OF 26 APRIL 2001 FLOODING AFFECTING THE KLANG VALLEY AND THE PREPARATION OF GENERALISED PROCEDURES AND GUIDELINES FOR ASSESSMENT OF FLOOD DAMAGES’
FINAL REPORT
Volume 1 : Flood Damage Assessment of 26 April 2001 Flooding Affecting the Klang Valley
TABLE OF CONTENTS
Page No. 1. INTRODUCTION 1 1.1 Study Background 1 1.2 Study Objectives 2 1.3 Scope Of Works 3 1.4 Study Team 5 2. FLOOD DAMAGES 7 2.1 Tangible and Intangible Damages 7 2.2 Direct and Indirect Damages 8 2.3 Actual and Potential Damages 10 2.3.1 Actual Damages 10 2.3.2 Potential Damages 11 2.3.3 Damages Reduction Factors 12 2.3.4 Accuracy and Reliability 12 2.4 Average Annual Damage 13
3. PROCEDURES, APPROACH AND METHODS OF ASSESSMENT 15 3.1 International Procedures 15 3.1.1 Actual Damages 15 3.1.2 Potential Damages 16 3.1.3 Flood Damage Surveys 17 3.2 Malaysian Approach 17 4. DATA COLLECTION AND FLOOD MAPPING 19 4.1 Data Collection 19 4.2 Flood Mapping 21
(i)
Page No. 5. ASSESSMENT OF TANGIBLE FLOOD DAMAGES 23 5.1 Property Survey 23 5.1.1 Approach and Methodology 23 5.1.2 Results of Survey 28 5.2 Flood Damage Estimation 31 5.2.1 Approach and Methodology 31 5.2.2 Computation of Damages 34 6. ASSESSMENT OF INTANGIBLE FLOOD DAMAGES 45 6.1 Household Survey 45 6.1.1 Approach and Methodology 45 6.1.2 Results of Survey 49 6.2 Worker Survey 52 6.2.1 Approach and Methodology 52 6.2.2 Results of Survey 55 6.3 Flood Damage Estimation 60 6.3.1 Approach and Methodology 60 6.3.2 Computation of Damages 63 7. CONCLUSION AND RECOMMENDATION 67 APPENDICES:- APPENDIX 1 : Study Terms Of Reference APPENDIX 2 : Flood Locations and Photographs APPENDIX 3 : Flood Damages Survey Questionnaire Forms APPENDIX 4 : Completed Listing Forms APPENDIX 5 : Household Survey Findings APPENDIX 6 : Worker Survey Findings APPENDIX 7 : References APPENDIX 8 : Flood Maps
(ii)
‘FLOOD DAMAGE ASSESSMENT OF 26 APRIL 2001 FLOODING AFFECTING THE KLANG VALLEY AND THE PREPARATION OF GENERALISED PROCEDURES AND GUIDELINES FOR ASSESSMENT OF FLOOD DAMAGES’
FINAL REPORT
Volume 2 : Guidelines and Procedures for the Assessment of Flood Damages in Malaysia
TABLE OF CONTENTS
Page No. 1. INTRODUCTION 1 1.1 Background 1 1.2 Guideline Objectives 1 1.3 Current Practices World-Wide 1 1.4 Review of Past Flood Assessment Studies in Malaysia 4 2. DEFINITION 7 2.1 Flooding 7 2.2 Flood Damages 13 2.2.1 Tangible and Intangible Damages 13 2.2.2 Actual and Potential Damages 16 2.2.3 Damage Reduction Factors 16 2.2.4 Average Annual Damage 16 3. GUIDELINES AND PROCEDURES 19 3.1 Data and Information Needs 19 3.2 Determination of Actual Damages 21 3.3 Determination of Potential Damages 22 3.4 Choice of Method – The Two-Tier Approach 23 3.5 Rapid Assessment Method 27 3.5.1 Methodology 27 3.5.2 Summary 29 3.6 Detailed Assessment Method 31 3.6.1 Data Requirements 31 3.6.2 Data Presentation 32 3.6.3 Methodology 32
(iii)
Page No. 4. WORKED EXAMPLES 35 4.1 Rapid Assessment – Urban Area 35 4.2 Rapid Assessment – Rural Area & Crops 39 4.3 Detailed Assessment – Urban Area 43 5. REFERENCES 49 APPENDICES:- APPENDIX 1 : Tables for Flood Damage Factors for Crops and Crop Production Unit Values APPENDIX 2 : Potential Damages Survey Forms APPENDIX 3 : Potential Damages Survey Questionnaire APPENDIX 4 : Actual Damages Survey Questionnaire
(iv)
VOLUME 2:
GUIDELINES AND PROCEDURES FOR
THE ASSESSMENT OF FLOOD DAMAGES IN
MALAYSIA
1. INTRODUCTION
1.1 Background
This guidelines and procedures for the assessment of flood damages is being
developed as part of the deliverable for the study titled ‘Flood Damage Assessment of
26 April 2001 Flooding Affecting the Klang Valley and The Generalized Procedures
and Guidelines for Assessment of Flood Damages’ commissioned by JPS Wilayah
Persekutuan/RTB Lembah Sg. Klang.
In formulating this set of guidelines for use in Malaysia, a review of procedures and
guidelines on flood damage assessment adopted in other countries was conducted.
Previous flood damage assessment studies carried out in Malaysia were also
reviewed and the relevant flood damage data were adopted for this guideline.
1.2 Guideline Objectives
The main objective of this guideline is to enable the relevant user in the country such
as JPS and local authorities to conduct flood damage assessment according to the
methods recommended. This guideline will also assist the relevant user in choosing
the method of assessment which is most suitable for a particular situation and needs.
During all phases of damages studies, that there are two principles that it is important
to remember:
♦ The collection of flood damage data must be an on-going activity, not restricted to
one flood or a flood of a particular recurrence interval; and
♦ Damages estimations are required across the whole range of floods, from the
common to the most extreme (PMF).
Unless these principles are borne in mind, then whatever value may be drawn from
the initial study, the value will be lost over time.
1.3 Current Practices World-Wide
The majority of published information on damages collection and analysis comes from
the United States, the United Kingdom, Japan, New Zealand and Australia. All
literature examined indicates that most countries have adopted a unit loss approach,
based on a property by property assessment of damages, be it actual or potential.
KTA Tenaga Sdn Bhd Page 1 T0223 - Final Report - Volume 2
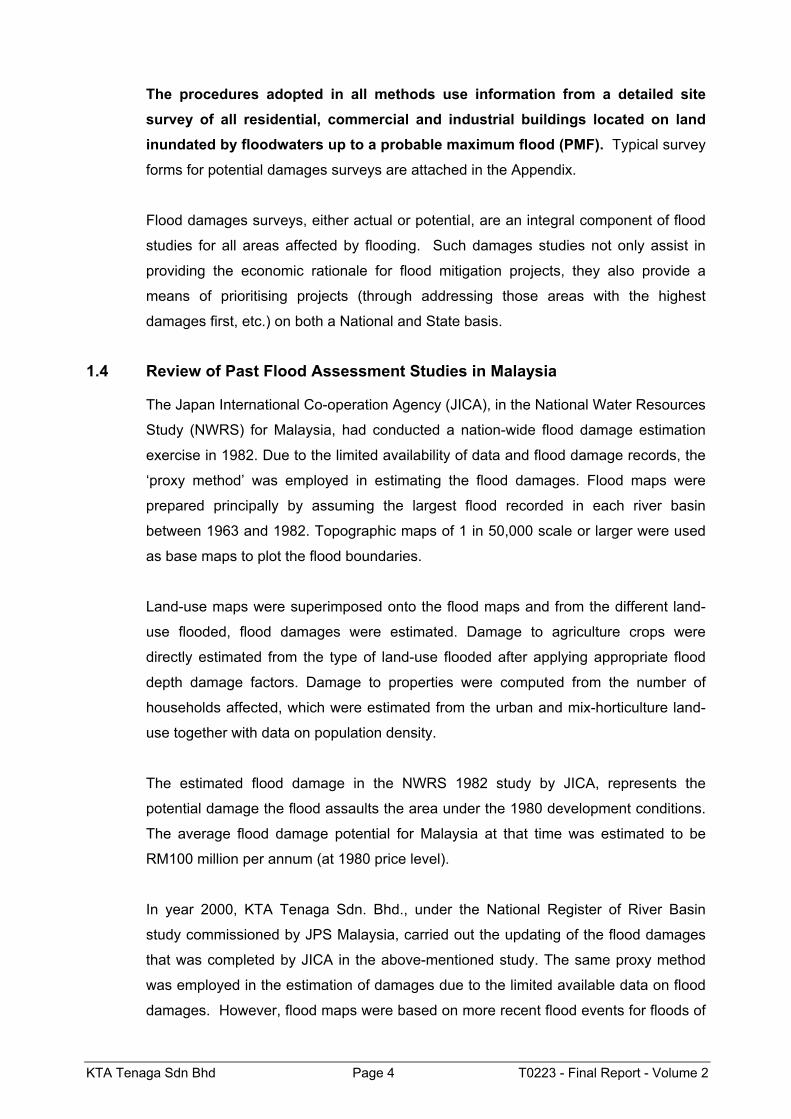
However, there appears to be some wide variance in the application of the data
collected to the estimation process. For example, the UK approach is very structured
and detailed for all classes of damage whereas the other countries such detail is only
applied to urban situations.
This situation is best summarised in a Table taken from Direct Flood Damage
Modelling Towards Urban Flood Risk Management by Dutta et al, as below:
Table 1.1 - Summary of existing flood loss estimation methodology Damage Categories Japan Australia UK USA
System damage Rough Rough Detail None Infra-structure Service loss Rough Rough Detail None Business loss Rough Detail Detail Detail Environmental damage None None Detail None
The collection of actual damages is approached consistently across nations and is as
follows:
♦ Identify areas affected by flooding during the event (or events) being assessed;
♦ Record the depth of inundation or the level to which floodwaters rose; and
♦ Record, in detail, the extent of damage for all of the buildings and properties
involved, accounting for all items damaged.
♦ The total damages recorded are the actual damages for that particular flood only.
These damages cannot be applied to any other flood as actual damages but they
can be used as an indicative value for future floods of a similar nature.
Five common activities have been identified that will establish and maintain a “best practice” approach. These activities are: ♦ Flood damage assessment teams enter the affected area very shortly after a
flood has occurred. While there must be some sensitivity to those affected by the flood, the data to be
collected is best collected while flood marks are fresh, damaged possessions and
property are clearly visible and there is no “loss of memory” amongst those
affected.
KTA Tenaga Sdn Bhd Page 2 T0223 - Final Report - Volume 2
♦ Flood damage assessment teams should consist of professionals with broad knowledge of flood behavior and able to value the damaged possessions.
♦ The flood damage assessment must cover all possible sources of damage. Direct damages will include residential, commercial, industrial properties together
with infrastructure and motor vehicles. Indirect damages especially clean-up
costs, travel disruptions and loss of income/wages must also be included in the
data collection.
• The assessment teams must be able to access information regarding any insurance information, “community service” or charitable payments.
♦ All data collected must be documented in a consistent form to a National Standard. This standardisation is essential to the development of “Stage-Damage Curves”,
essential in the Potential Damages assessment process described below. It
should be noted that this standardisation is not always complied with, leading to
some disparity in the quality of flood damages estimation. Once the data is
collected, a total actual damage for the particular flood can be calculated. The
data should then be analysed to provide a stage/damage relationship - flood depth
above floor or above ground equating to a specific damage value. This
stage/damage relationship is very site specific and can only be applied to the
location where the flood occurred. If the relationship is applied to another location
or stage/damage relationships are imported from another country, the resulting
damages estimates will be of limited value without additional work adjusting the
valuations used in the initial damages calculations.
Internationally, the practice for determining “Potential” damages is very consistent,
and is based on the collection of property data, the estimation or survey of ground and
floor levels and the estimation of damages through the application of Stage/Damage
curves to each property in the affected area.
The methodologies either have been computerised into specific Programs, such as
ANUFLOOD or FLDAMAGE (Australian) and into FloodEcon (US Corps of Engineers)
or are analysed using spreadsheet (Microsoft Access or Excel) methodologies. While
these methodologies provide a guide to an approach to Potential Damages, they cannot be directly applied as their built-in Stage/Damage relationships reflect their
country of origin, thereby placing a significant bias in damage values.
KTA Tenaga Sdn Bhd Page 3 T0223 - Final Report - Volume 2
The procedures adopted in all methods use information from a detailed site survey of all residential, commercial and industrial buildings located on land inundated by floodwaters up to a probable maximum flood (PMF). Typical survey
forms for potential damages surveys are attached in the Appendix.
Flood damages surveys, either actual or potential, are an integral component of flood
studies for all areas affected by flooding. Such damages studies not only assist in
providing the economic rationale for flood mitigation projects, they also provide a
means of prioritising projects (through addressing those areas with the highest
damages first, etc.) on both a National and State basis.
1.4 Review of Past Flood Assessment Studies in Malaysia
The Japan International Co-operation Agency (JICA), in the National Water Resources
Study (NWRS) for Malaysia, had conducted a nation-wide flood damage estimation
exercise in 1982. Due to the limited availability of data and flood damage records, the
‘proxy method’ was employed in estimating the flood damages. Flood maps were
prepared principally by assuming the largest flood recorded in each river basin
between 1963 and 1982. Topographic maps of 1 in 50,000 scale or larger were used
as base maps to plot the flood boundaries.
Land-use maps were superimposed onto the flood maps and from the different land-
use flooded, flood damages were estimated. Damage to agriculture crops were
directly estimated from the type of land-use flooded after applying appropriate flood
depth damage factors. Damage to properties were computed from the number of
households affected, which were estimated from the urban and mix-horticulture land-
use together with data on population density.
The estimated flood damage in the NWRS 1982 study by JICA, represents the
potential damage the flood assaults the area under the 1980 development conditions.
The average flood damage potential for Malaysia at that time was estimated to be
RM100 million per annum (at 1980 price level).
In year 2000, KTA Tenaga Sdn. Bhd., under the National Register of River Basin
study commissioned by JPS Malaysia, carried out the updating of the flood damages
that was completed by JICA in the above-mentioned study. The same proxy method
was employed in the estimation of damages due to the limited available data on flood
damages. However, flood maps were based on more recent flood events for floods of
KTA Tenaga Sdn Bhd Page 4 T0223 - Final Report - Volume 2
larger magnitude. The latest available land-use maps were used to determine the type
of land-use inundated. In this study, which is now under Final Report stage, the annual
average flood damage for the whole country was estimated to be RM 915 million (at
2000 price level).
The proxy method employed in the two studies above is a conservative approach in
flood damage assessment suitable for a large scale type of assessment. The standard
potential damages for properties, agriculture and infrastructure were assumed to be
uniform throughout the country.
The damage values and damage factors for agriculture crops in the study were
adopted for this guideline as they are the most recent updated values.
KTA Tenaga Sdn Bhd Page 5 T0223 - Final Report - Volume 2
KTA Tenaga Sdn Bhd Page 6 T0223 - Final Report - Volume 2
2. DEFINITIONS
2.1 Flooding
Given the concepts of flooding and flood damages that are being addressed in these
Guidelines, it is essential that the terminology used is consistent and understood. The
following definitions of flood characteristics and flood damages are referred to
throughout the guidelines:
Average Annual Damage (AAD) depending on its size (or severity), each
flood will cause a different amount of
flood damage to a flood prone area.
AAD is the average damage per year that would occur in a nominated development situation from flooding over a very long period of time. In
many years there may be no flood
damage, in some years there will be
minor damage (caused by small,
relatively frequent flood events) and, in
a few years, there will be major flood
damage (caused by large, rare flood
events). Average annual damage
provides a basis for comparing the
economic effectiveness of different
management measures against floods
of all sizes, i.e. their ability to reduce the
AAD.
Average Recurrence Interval (ARI) the long-term average number of
years between the occurrence of a flood
as big as or larger than the selected
event, e.g. floods with a discharge as
great as or greater than the 20 year ARI
flood event will occur on average once
every 20 years. ARI is another way of
expressing the likelihood of occurrence
KTA Tenaga Sdn Bhd Page 7 T0223 - Final Report - Volume 2
of a flood event. Another term that may
be used for flood frequency is Annual Exceedance Probability (AEP). AEP the chance of a flood of a given or
larger size occurring in any one year,
usually expressed as a percentage. For
example if a peak flood discharge of
500 m3/s has an AEP of 5%, it means
that there is a 5% chance (i.e. a chance
of one-in-20) of a peak flood discharge
of 500 m3/s or larger occurring in any
one year (see Average Recurrence
Interval).
Effective Warning Time the time available after receiving advice
of an impending flood and before the
floodwaters overwhelm damage
reduction activities. The effective
warning time is typically used to move
farm equipment, raise furniture and
evacuate people.
Flash Flooding flooding which is sudden and
unexpected. It is often caused by
sudden local heavy rainfall or rainfall in
another area.
Flood relatively high stream flow which
overtops the natural or artificial banks in
any part of a stream, river, estuary, lake
or dam, and/or overland runoff before
entering a watercourse and/or coastal
inundation resulting from super elevated
sea levels and/or waves overtopping
coastline defences.
KTA Tenaga Sdn Bhd Page 8 T0223 - Final Report - Volume 2
Flood Awareness an appreciation of the likely effects of
flooding and a knowledge of the
relevant flood warning, response and
evacuation procedures. In communities
with a high degree of flood awareness,
the response to flood warnings is
prompt and efficient. In communities
with a low degree of flood awareness,
flood warnings are liable to be ignored
or misunderstood, and residents are
often confused about what they should
do, when to evacuate, what to take and
where it should be taken.
Flood Damage the tangible and intangible costs of
flooding. Tangible costs can be
quantified in monetary terms, e.g.
damage to goods and possessions, loss
of income or services during the flood
aftermath, etc. Intangible damages
represent the increased levels of
physical, emotional and psychological
illness in flood affected people
attributed to a flooding episode and are
less easy to quantify in monetary terms.
(These terms are defined in Section
2.3)
Flood Hazard potential risk to life and limb and
potential damage to property resulting
from flooding. The degree of hazard
varies with circumstances across the
full range of floods. Existing Flood Hazard is the hazard a community is
exposed to as a result of its location on
the floodplain. Future Flood Hazard is the hazard a community may be
exposed to as a result of its placement
KTA Tenaga Sdn Bhd Page 9 T0223 - Final Report - Volume 2
on the floodplain. Continuing Flood Hazard the hazard a community is
exposed to after floodplain
management measures have been put
in place.
Floodplain area of land which is subject to
inundation by floods up to the probable
maximum flood event, i.e. flood prone
land. Flood Prone Land is land
susceptible to inundation by the
probable maximum flood (PMF) event.
Floodplain Management Measures the full range of techniques available to
reduce flood damage and disruption, as
canvassed in floodplain management
studies.
Local Overland Flooding inundation by local runoff rather than
overbank discharge from a stream,
river, estuary, lake or dam.
Mainstream Flooding inundation of normally dry land
occurring when water overflows the
natural or artificial banks of a stream,
river, estuary, lake or dam.
Minor, Moderate And Major Flooding minor flooding: causes inconvenience
such as closing of minor roads and the
submergence of low level bridges. The
lower limit of this class of flooding on
the reference gauge is the initial flood
level at which landholders and
townspeople begin to be flooded.
KTA Tenaga Sdn Bhd Page 10 T0223 - Final Report - Volume 2
Moderate flooding: low-lying areas
are inundated requiring removal of
stock and/or evacuation of some
houses. Main traffic bridges may be
covered.
Major flooding: appreciable urban
areas are flooded and/or extensive rural
areas are flooded. Properties, villages
and towns can be isolated.
Probable Maximum Flood (PMF) the largest flood that could conceivably
occur at a particular location.
Generally, it is not physically or
economically possible to provide
general protection against this event.
The PMF defines the extent of flood prone land, i.e. the floodplain. The
extent, nature and potential
consequences of flooding associated
with the PMF event should be
addressed in a floodplain management
study.
Probable Maximum Precipitation (PMP) the greatest depth of precipitation for a
given duration meteorologically possible
over a given size storm area at a
particular location at a particular time of
the year, with no allowance made for
long-term climatic trends (World
Meteorological Organisation, 1986). It
is the primary input to the estimation of
the probable maximum flood.
KTA Tenaga Sdn Bhd Page 11 T0223 - Final Report - Volume 2
2.2 Flood Damages
2.2.1 Tangible and Intangible Damages
The most basic division of flood damages is into tangible and intangible damage
categories. Figure 2.1 illustrates the various damage types commonly estimated/
assessed in flood studies and their inter-relationships.
Tangible damages are readily measured in monetary terms. Tangible damages
include, among others, the damage or costs caused by floodwaters wetting goods and
possessions and damage to roads and other infrastructure, the loss of commercial
income, the loss of production in industrial concerns (direct tangible damages) and the
loss of wages and extra outlays incurred during clean-up operations and in the post-
flood recovery period (indirect tangible damages).
Intangible damages include damage to the environment and the increased levels of
emotional stress and mental and physical illness caused by a flood, such as large
financial outlays to replace flood damaged possessions or possibly having to find new
means of earning a living. It is difficult to quantify intangible damages in financial
terms, however intangible damages are real and represent a significant cost to flood
affected persons and the community. It is possible to dimension the problem,
approximately, by estimating how many flood-affected people may require additional
medical treatment for depression or the ecological cost of the loss of a local
environmental feature.
The emotional costs on flood victims can be quite severe and the strain may linger for
several years after the event. Flood-aware communities can be expected to suffer
less social and financial disruption than communities with a low level of flood
awareness. This is, however, not always the case – an extreme or sudden flood event
can have deleterious effects on the most aware of communities.
KTA Tenaga Sdn Bhd Page 12 T0223 - Final Report - Volume 2
Annual Average Damage (AAD) = Area under Curve = RM50,000 per annum
Figure 2.2 - Calculation of Average Annual Damage
In Figure 2.2 above, flood damage only commences at the 10 year ARI flood event
and the more extreme the flood, i.e. the higher the ARI, the greater the damage. The
AAD for the situation depicted in Figure 2.2 is equal to the area under the
damage/probability of occurrence curve. The area under the 20 year ARI flood is
RM5,000 (½ x RM200,000 x 0.05), i.e. floods up to the 20 year ARI event contribute
RM5,000 to the AAD, which in Figure 2.2 is RM50,000 per year.
KTA Tenaga Sdn Bhd Page 17 T0223 - Final Report - Volume 2
KTA Tenaga Sdn Bhd Page 18 T0223 - Final Report - Volume 2
3. GUIDELINES AND PROCEDURES
3.1 Data and Information Needs
The data and information needs for the range of flood damage estimations, as well as
the basic differences between the methods, are described in Table 3.1 below.
The main data and information needs are:
• Property data, including type of property and number of properties;
• Flood maps for either the particular event or for floods of various return periods;
• Flood data, including depth, velocity and times of inundation.
This data is essential for all damages studies and must be collected as soon as
physically possible after a flood. Experience across many nations has shown that
quick data collection is essential as:
• Data may be lost if people move away from affected areas;
• Flood marks may be lost with time so accurate estimates of depth are lost;
• Residents may be confused regarding which particular flood is being investigated,
particularly if there have been a number of recent events; and
• There can be variations from flood to flood that must be identified and recorded
for future, more detailed investigations.
It is not viable to wait for a long period after a flood to try to collect the essential data and there should be protocols in place, either within the relevant Agency or with the local authority, that will ensure the requisite data is collected immediately after the flood has occurred.
KTA Tenaga Sdn Bhd Page 19 T0223 - Final Report - Volume 2
Table 3.1- Flood Damage Assessment Methods - Basic Differences and Data Requirements
ACTUAL DAMAGE ASSESSMENT
POTENTIAL DAMAGE ASSESSMENT
RAPID ASSESSMENT METHOD
DETAILED ASSESSMENT METHOD
1. To determine damages caused by an actual flood event 2. Requirements: - Flood Maps of the particular event. - Identify every property inundated. - Depth of inundation. - Conduct survey and record, in detail, the extent of damages for all damage categories (direct and indirect) 3. Total actual damages calculated from the data collected. 4. Stage/damage relationships can be developed for the types of development in the specific flood location.
1. To determine maximum damages that could eventuate should a flood occur. 2. Requirements: - Collection of property data. - Flood maps for floods of various return periods - Estimation/survey of ground and floor levels. - Identify a sample of representative properties from survey. - Estimate damages for 3 or 4 possible flood depths. - Stage/Damage curves for each type of property developed from previous studies 3. Assume no actions taken before or during floods to reduce damage. 4. Indirect damages are approximated as a percentage of total direct damages.
1. Quick, easy, desk-based method to provide a first level approximation of flood damages. 2. Requirements: - Flood Maps for a range of floods i.e defines the Study Area. - Potential damages for a range of properties in the Study Area. - Broad valuation of any major properties. - Standard rates for agriculture and infrastructure 3. Indirect damages are approximated as a percentage of total direct damages. 4. A preliminary estimate of AAD can be derived from a 4 point loss vs. probability curve.
1. Follows same procedure as an actual damages survey without having actual flood levels and actual flood damages. 2. Requirements: - Flood Maps for a range of floods from ‘no damage flood’ to PMF. - Detailed potential damages for properties. - Detailed valuation of major properties. - Stage/Damage curves for each type of property developed from previous studies - Detailed damages for agriculture and infrastructure. 3. Damages to include additional cost allowance for repairs and clean-up. 4. Total damages are plotted to produce damage/frequency curve, AAD can then be derived.
KTA Tenaga Sdn Bhd Page 20 T0223 - Final Report - Volume 2
3.2 Determination of Actual Damages
There are two basic steps associated with an actual flood damage survey. The first
step involves identifying every property that was inundated by floodwaters and
recording the depth of inundation or the level to which floodwaters rose. The second
step involves recording in detail, the extent of damage, to buildings and properties.
In the second step, the more detailed data collection is conducted a few weeks after
the first data collection. Preliminary analysis of the initial data may be useful before
the second survey, allowing the targeting of particular data in the second step.
Actual damage surveys are made difficult by the fact that, at the time of the survey,
many flood-affected occupants are still dazed by the flood episode and confused as to
the contents of dwellings and work areas. Further, many items may have already
been discarded during the clean-up process. These items have to be identified and
their value established, sight-unseen. In these circumstances, the survey form needs
to contain a detailed list of items likely to occur in each area. The person conducting
the survey then leads the occupant through this list to ascertain the pre-flood contents
of the area and an indication of their value.
Basic flood damage data to be collected from urban areas relates to the number and
type of flooded properties and depths of flooding within buildings and across grounds.
Each property that is covered, either fully or partially, by floodwaters needs to be
included in the survey, irrespective of whether or not buildings are flooded above floor
level.
Some data needs to be assessed subjectively, such as building size, which can be
determined on a comparative basis. For example, an inspection of house sizes will
provide broad guidelines for “small”, “medium” and “large” dwellings. Similarly, house
style will provide a reasonable guide to building age and economic range (the
wealthier the property, the greater the damages, assuming similar levels of flooding for
all buildings).
Commercial properties may also be assessed by size and type, once a valuation has
been made of likely contents and size of operations. However, the initial assessment
needs to be as detailed as possible so that there is confidence in the applicability of
the size/type and value relationship. Industrial properties must, however, be assessed
individually as the variations in value are not dependent on size.
KTA Tenaga Sdn Bhd Page 21 T0223 - Final Report - Volume 2
3.3 Determination of Potential Damages
Studies to determine potential flood damage are necessary for areas that have no
recent records of damage in an actual flood or where major flooding has not occurred
for a significant period. These estimates also cover floods greater than may have
previously occurred. In a potential damage survey, a sample of representative
properties is first identified and then damages to these properties are determined,
either by questionnaire or through personal inspection.
In a potential damage survey, the valuer estimates damage on an item-by-item basis
for each room of selected types of buildings. This is typically done for three or four
possible flood depths (typically about 5cm, 0.5m, 1.0m and 2.0m above floor level).
The damage estimates are made on the basis that no furniture and/or fittings are
shifted should a flood occur. Detailed survey forms are required to record this data.
Actual and potential flood damage data can be presented as stage-damage curves for
different property types. Such curves relate contents damage to depth of flooding
above floor level. These curves are generally derived from numerous damage studies
on similar areas throughout the region or nation. Stage-damage curves can be
derived for residential, commercial, rural and public properties, however industrial
properties have many inherent differences that may make stage-damage curves non-
viable.
To determine the flood damage over a specific area, it is necessary to know the
number of flooded properties, the type of flooded properties and the depth of flooding
above floor level. The number of flooded properties can be determined from flood
studies, flood maps, aerial photographs or from a street-by-street inspection. It is
generally very difficult to discriminate property types or floor levels from aerial
photographs. Knowledge of flood levels and floor levels throughout the flooded area
will enable flood depths over the floor to be calculated for each building.
Floor level data may be estimated from building plans (if available), by measuring floor
height above ground level or by estimation based on contour maps. The appropriate
stage-damage curve allows the damage to be estimated for each property. A
computer model or a spreadsheet is typically used to combine all these data and
estimate the flood damage for different flood levels up to and including the PMF.
KTA Tenaga Sdn Bhd Page 22 T0223 - Final Report - Volume 2
3.4 Choice of Method - The Two-Tier Approach
Malaysia presents a broad range of situations for flood damage assessment. The
major cities - Kuala Lumpur, Johor Bahru and Pulau Pinang - present the closest
parallel to those areas where flood damage assessment methodology for urban areas
was developed, whereas many other areas have very different flood regimes, flood
reactions and types of property affected. The level of flood damages will vary across
each State and Territory, and the need for detailed assessment, rather than a more
general approach, must be established.
With such a wide range of possible applications, the issue to be addressed is “Will one
method suit all applications?” Essentially, the wide range of flood circumstances and
conditions in Malaysia may make a detailed flood damages assessment approach for
each location time consuming and economically unviable.
Accordingly, a Two-tier National Approach is recommended. These two tiers can be
described as:
• Rapid Assessment Method; and
• Detailed Assessment Method.
A discussion on when to adopt which method follows the discussion on the methods
(below). Unless examination of the situation reveals a need for the Detailed
Assessment Method, it is recommended that every flood affected urbanised area in
Malaysia, (both Peninsular and East) should be subject to the Rapid Assessment
Method, described below. When a quantitative assessment of the damages is
available, the Detailed Assessment Method should be applied to those areas where
the flood damages appear greatest or where there is the greatest need for mitigation
works. In this way, the broad flood damages scenario can be established without the
lengthy and expensive requirements of the Detailed Assessment Method.
With two methods (Rapid or Detailed Assessment Methods), or a combination of these
methods available, how is the choice between methods made by practitioners. There
is no simple “yes” or “no” scenario that can be set up to “automate” the response to
this question; the answer is in the response to a series of questions.
The questions can be grouped into five broad but not mutually exclusive categories:
• Why is the damages study needed?
• What is the impact of flooding?
KTA Tenaga Sdn Bhd Page 23 T0223 - Final Report - Volume 2
• Has a study been done before?
• How many properties are affected?
• What level of Flood Hazard do these properties face?
Why is the Damages Study Needed? A damages study can have a number of reasons behind it:
• Political - there may be a need to advise a politician (e.g., State/Federal Minister
or Local Mayor or Departmental Head) regarding the size of the flood problem
and/or what cost may have been incurred;
• Priority Determination - the budget for flood studies and/or mitigation works may
be limited and priorities need to be established between competing locations;
• Obtaining funding - funding may be sought to implement a study or work from
either local sources or regional/world banking sources. These institutions will
have certain requirements regarding cost/benefit or financial return and a
justification will be needed for the lending authority; and
• The Need to Know - this may simply be the DID, State or Federal, wanting flood
information on a town or groups of towns.
For all except the third point, application of the Rapid Assessment will usually suffice;
funding authorities, and particularly regional or international funding authorities, will
require a detailed assessment before any works are funded. A study to determine the
data in more precise terms may only require a rapid assessment.
What is the impact of flooding? Again, this question generates even more questions before a decision can be
reached:
• Is flooding accepted as a part of normal life, as an occurrence that is simply part
of the seasonal climate?
• Is flooding a rare occurrence (Kuala Lumpur) or is it becoming more common?
• Does it flood for a short or lengthy period with varying degrees of impact;
• Does flooding cause little disruption to life or does it cause major disruption to the
study area?
Determining the response under this category requires some iteration with the
previous category (Why is the damages study needed?) and the coming to a
pragmatic decision. If flooding is a part of normal life, causes little disruption and the
damages are required for information, then a Rapid Assessment Method is more than
KTA Tenaga Sdn Bhd Page 24 T0223 - Final Report - Volume 2
adequate. However, if the flooding is not part of normal life, occurs frequently and
there is considerable disruption, there is probably a demand for mitigation works and
the Detailed Assessment Method will be essential for funding purposes.
How many properties are affected? This is a simpler question to resolve, but does need knowledge of the flood extent. If
only a small number of properties are affected by flooding, then the Rapid Assessment
Method will provide the damages in a short time. If, however, there are a large
number of properties involved, and the properties include industrial, commercial and
residential properties, then it would be more appropriate to undertake an immediate
Rapid Assessment to be followed by a Detailed Assessment when more data is
gathered.
What level of Flood Hazard do these properties face? This category is linked to nearly all others in the consideration of Methods. A quick
assessment of risk requires knowledge of:
• The frequency (or probability) of occurrence;
• The number of properties at risk (as per above);
• The depth of water in various areas;
• The velocity of flows, particularly the identification of floodway areas;
• Warning time, both actual and effective; and
• The community’s flood awareness.
Much of the requisite knowledge for resolving this category would come from a range
of flood studies and management studies in accordance with the recommended
approach published in the “Klang River Basin Environmental Improvement & Flood
Mitigation Project”.
Has a study been done before? If a study has been done, then the Rapid Assessment Method can be quickly applied
or, if required, a Detailed Assessment can be carried out with limited additional work.
If a study has not been done, then provided there can be some reasonable estimate of
the flood extents, the Rapid assessment can be done but not a Detailed Assessment.
3.4.1.1 Illustrative Examples of Choice
To illustrate the approach to be adopted, two scenarios are discussed, a town in non-
urbanised East Coast Peninsula Malaysia and the Klang Basin, the area being
addressed in this study.
KTA Tenaga Sdn Bhd Page 25 T0223 - Final Report - Volume 2
Example 1 - a town in non-urbanised East Coast Peninsula Malaysia. This
hypothetical town has 500 residences of various types and is subject to regular
monsoons flooding. The community is aware of this flooding and welcome it for the
agricultural benefits it brings. There is unlikely to be any demand for flood mitigation
works, or those that are required are generally limited in scope and cost. As such,
there is little demand for detailed flood damage assessment and the Rapid
Assessment Method would provide an estimate that is viable for the great majority of
situations.
Example 2 - the Klang Basin. This is Malaysia’s principle conurbation, with the cities
of Kuala Lumpur, Shah Alam and others on the floodplain of the Klang River and its
tributaries. There are thousands of potentially affected properties - agricultural,
industrial, commercial and residential, let alone the public infrastructure and public
services - on the flood prone areas. The flood hazard varies throughout the Basin,
with community awareness being generally low. Flooding causes considerable
disruption to community activities, resulting in high levels of political interest and
involvement. Any flooding incident gives rise to political pressure to “do something” to
stop the flooding however all mitigation works in such a built up area will be very costly
and difficult to implement. In this case, a Rapid Assessment Method will only provide
an approximation of the damages and benefits; the Detailed Assessment Method must
be adopted for a case such as this.
KTA Tenaga Sdn Bhd Page 26 T0223 - Final Report - Volume 2
3.5 Rapid Assessment Method
The “Rapid Assessment Method” (RAM) involves a limited amount of work to provide
a first level approximation of the flood damages in a particular study area. RAM can
be:
• Quick, once the practitioner has experience with the process;
• Easy, provided there is sufficient information to work through (see below for RAM
requirements);
• Desk based, with only one inspection of the study area usually required; and
• A preliminary step in determining the need for the application of the Detailed
Assessment.
It should be noted that RAM is not a suitable basis for any Benefit/Cost Analysis that may be required for External Funding of major projects. This will require
application of the Detailed Assessment Method.
The Key Concepts of RAM can be described as:
• Optimal ignorance - knowing what facts are not worth knowing; and
• Appropriate imprecision - knowing that precise data are often unnecessary or
impossible to obtain.
With these concepts in mind, RAM needs the following data to be successfully
applied:
• Flood Maps (for a range of floods) – defines the “Study Area”;
• Potential Damages for range of properties in Study Area;
• Broad valuation of any major properties; and
• Standard rates for agriculture and infrastructure.
3.5.1 Methodology
The application of RAM requires the following steps:
Define The Study Area The region to be assessed can be large and complex (the Klang Basin) or a single
town with small numbers of residential and commercial properties. As a broad criteria,
areas where the effects from a given cause are felt should be combined to establish
the study area. Once determined, existing topographical mapping or air photography
can be used to determine the number of similar properties within the study area.
KTA Tenaga Sdn Bhd Page 27 T0223 - Final Report - Volume 2
These maps/photos can also be used to determine number of large properties for
individual assessment;
Estimate Damages for Each Flood Event The main data required to use RAM are:
• Flood extent map;
• Simple count of the total number of each type of building; and
• A rapid survey of large non-residential buildings.
The potential damages can then be calculated by applying a standard potential
damage to each property (see below for example) except for the large properties,
which must be treated separately. These potential damages are then converted to an
“actual” damage value through the application of a “damage reduction ratio” that
reflects, among others, the experience of the community with flooding (experienced,
ratio may be 0.5, inexperienced, ratio may be 0.9) and the effective flood warning time
- the longer the warning period, the greater the time available for evacuating goods
and possessions; the more flood aware the population, the more effective these
measures will be.
Agricultural enterprises and all infrastructure, including roads, require special
treatment. For example, damages to agricultural enterprises can vary according to:
• Type of enterprise;
• Time of year;
• Depth of flooding;
• Duration of flooding; and
• Velocity of flooding.
There is a need for significantly more investigation into agricultural damages, in all
parts of the world. Some guidance may be gained from published sources, but it will
be essential for Malaysian authorities to develop local valuations.
Infrastructure, which includes roads, railways, water treatment and sewerage
infrastructure, must also be assessed. For roads, damages per kilometre of road
inundated may be:
• RM 240,000 for primary sealed roads;
• RM 110,000 for secondary sealed roads;
• RM 85,000 for minor sealed roads; and
• RM 30,000 unsealed roads.
KTA Tenaga Sdn Bhd Page 28 T0223 - Final Report - Volume 2
The above damage values are based on cost of road re-pavement of RM190,500 per
ha as given in ‘The Study on Integrated Urban Drainage Improvement for Melaka and
Sungai Petani’ by JICA (2000).
For railways, damages per kilometre of track may be RM2,000,000 however this value
is very site specific and must be assessed more accurately in future studies.
Indirect damages are best approximated as a percentage of total direct damages. In
the majority of cases, adopting 30% as the indirect damage will be adequate however
this number may be varied when the characteristics of the study area are more closely
examined. For example, where populations are low, 20% may be appropriate
whereas a major city centre may require 45% as indirect damages.
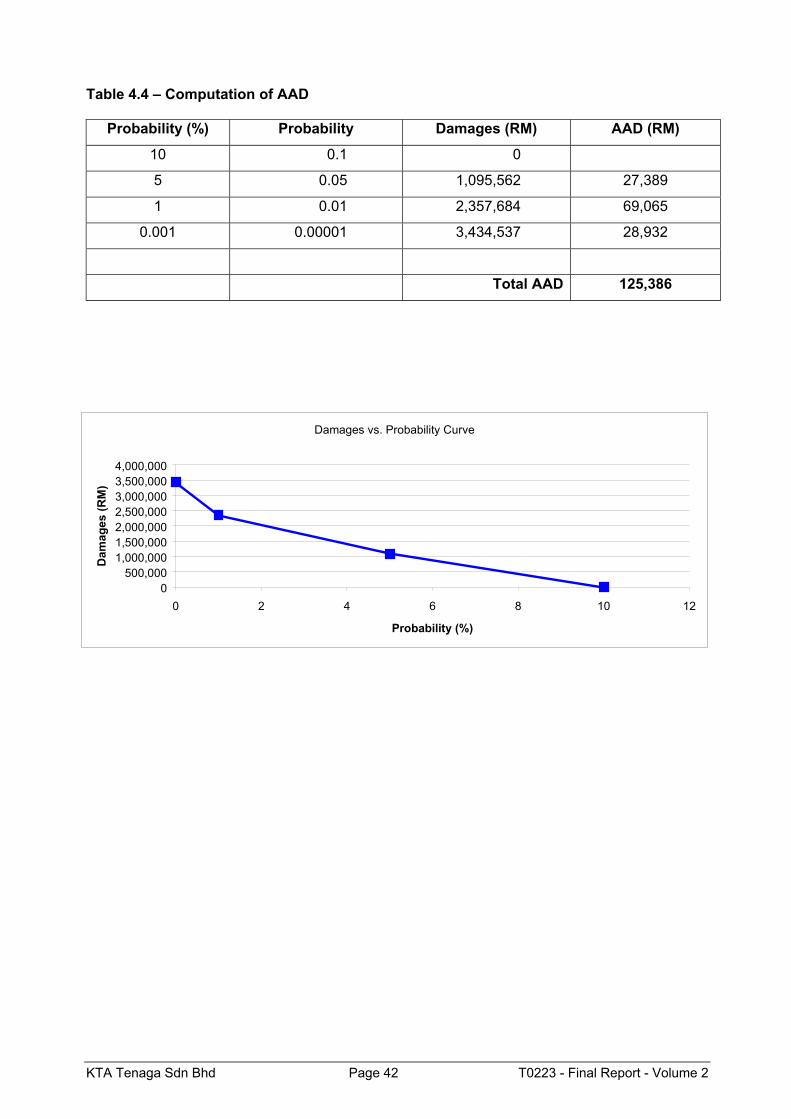
Calculate AAD The AAD for each Study Area is the single most important piece of data for determining relative problems and priorities between Study Areas. Using RAM, a simple four-point loss-probability curve is sufficient to obtain a
preliminary estimate of AAD. The points necessary are:
• The highest probability of the flood where damages are nil;
• Damages based on a mid range flood of known probability;
• Damages based on a high range flood of known probability (say 1% AEP, or 100
year ARI); and
• Damages based on an extreme flood of assumed probability (say 0.0001% AEP,
or 10,000 year ARI).
• Using these points, a “curve” similar to that shown in Figure 2.2 can be developed
and the AAD calculated as previously described.
3.5.2 Summary
A simple checklist of requirements to carry out RAM can be described as follows:
• Flood extent maps for a range of floods. Minimum of 3 ARIs e.g. 10 yrs, 100 yrs
and PMF.
• The potential damages for a range of properties to be obtained from similar
studies or survey
• Broad valuation of any major properties e.g. large commercial or industrial
complexes.
• Standard rates for agriculture and infrastructure (given in this guideline)
KTA Tenaga Sdn Bhd Page 29 T0223 - Final Report - Volume 2
• Determine the number of each type of properties inundated for the each range of
flood from topographical maps or town maps
• Determine the same for roads and railway lines
• Determine the area of each type of crop land flooded from landuse maps or
topographical maps, for the various range of floods.
• Calculate the AAD using the RAM spreadsheets.
KTA Tenaga Sdn Bhd Page 30 T0223 - Final Report - Volume 2
3.6 Detailed Assessment Method
3.6.1 Data Requirements
A detailed flood damage assessment generally follows the same procedures as an
actual damages study, without having the actual flood levels and actual flood
damages. The following data is usually obtained:
• Addresses of buildings comprising street number and street name as per site
visits and local authority records;
• Provision of a building description, i.e. flat, house, unit, shop, factory;
• Designation of building types between:
- Residential
- Commercial
- Industrial
- Public institution
- Public utility
• A determination of the damage category within which each building falls as per
site visits, i.e. low, medium or high;
• An estimate of building size;
• Identification of the type of material used in the construction of external walls and
floors;
• Floor levels;
• Estimation of ground level at each building location, from topographic information;
• Identification of the possible cause of flood damage; and
• An identification chainage to locate the building at a point along the designated
water course,
The value of damages to all property occupied by buildings can be computed for the
following categories for particular flood events:
• Existing conditions; and
• Proposed design conditions with different flood mitigation options.
An additional cost allowance for repairs and clean-up of the local infrastructure is also
included. Vacant land is considered to contribute negligible damages overall and is
normally excluded from the study. For each category above, total damages resulting
from all floods are plotted to produce a damage/frequency curve from which the
Average Annual Potential Damage (AAD) is derived.
KTA Tenaga Sdn Bhd Page 31 T0223 - Final Report - Volume 2
3.6.2 Data Presentation
A building database is established using a suitable computer-based data management
program such as Excel or Access. The information held within the database is tied to
individual blocks by street addresses enabling retrieval of specific data. Information in
the Building database usually comprises the following:
• Floor level;
• Building type (residential, commercial, industrial, public institution, public utility);
• Building description or Business type (house, unit, etc or industrial, retail, etc);
• Material type (commercial and residential);
• Number of stories;
• Footprint of Building;
• Condition of Building and Garden (residential only);
• Value Code (residential only); and
• Estimates of building, contents and turnover (commercial only, not
comprehensive).
The value of damages to buildings is evaluated by incorporating suitable relationships
into the database. Commercial and industrial properties are assessed using actual
damage data collected through surveys of commercial property owners. Damage
curves are developed for low, medium and high levels of flooding.
Value Codes are used to indicate the estimated value of goods and material that may
be damaged by a flood and are categorised based on the type of residence, its
potential sale price and the likely level of fittings and furnishings therein.
3.6.3 Methodology
The procedure using a computer-based package to estimate direct flood damages has
three major steps undertaken for each dwelling:
• Assign location, floor level, property type and value;
• Interpolate flood levels throughout the affected area for actual or design floods;
and
• Estimate the potential flood damages.
The procedure is outlined in Figure 3.1 below.
KTA Tenaga Sdn Bhd Page 32 T0223 - Final Report - Volume 2
Property type and value information can be assessed as described above. Potential
flood damage assessment requires flood level estimates at individual dwellings. An
automated procedure of assigning design flood levels to dwellings can then be
established for the data available. The procedure of assigning design flood levels to
dwellings is based on interpolation of flood levels from the flood level data.
Individual property damage estimates are based on depth of flooding above floor level
and generalised stage-damage estimates derived from previous damage studies.
Potential damage estimates include damage to residential dwellings, commercial and
industrial properties. Estimates of flood damage can be computed for a range of
return periods, and AAD estimates prepared.
A detailed assessment needs
• Flood Maps for a range of floods from “no damage flood” to PMF;
• Detailed Potential Damages for properties in Study Area, based on inspection and
valuation;
• Detailed valuation of any major properties; and
• Detailed damages for agriculture and infrastructure.
KTA Tenaga Sdn Bhd Page 33 T0223 - Final Report - Volume 2
Figure 3.1 - Schematic of detailed Flood Damage Assessment Process
STUDY SITE
Property/Building
Data Ground / Floor
Height Data Hypothetical Flood
Event
Flood Depth
Flood Probability Data
Potential
Damages
Actual to Potential
Damages
TOTAL EVENT
DAMAGES AVERAGE ANNUAL
DAMAGES
KTA Tenaga Sdn Bhd Page 34 T0223 - Final Report - Volume 2
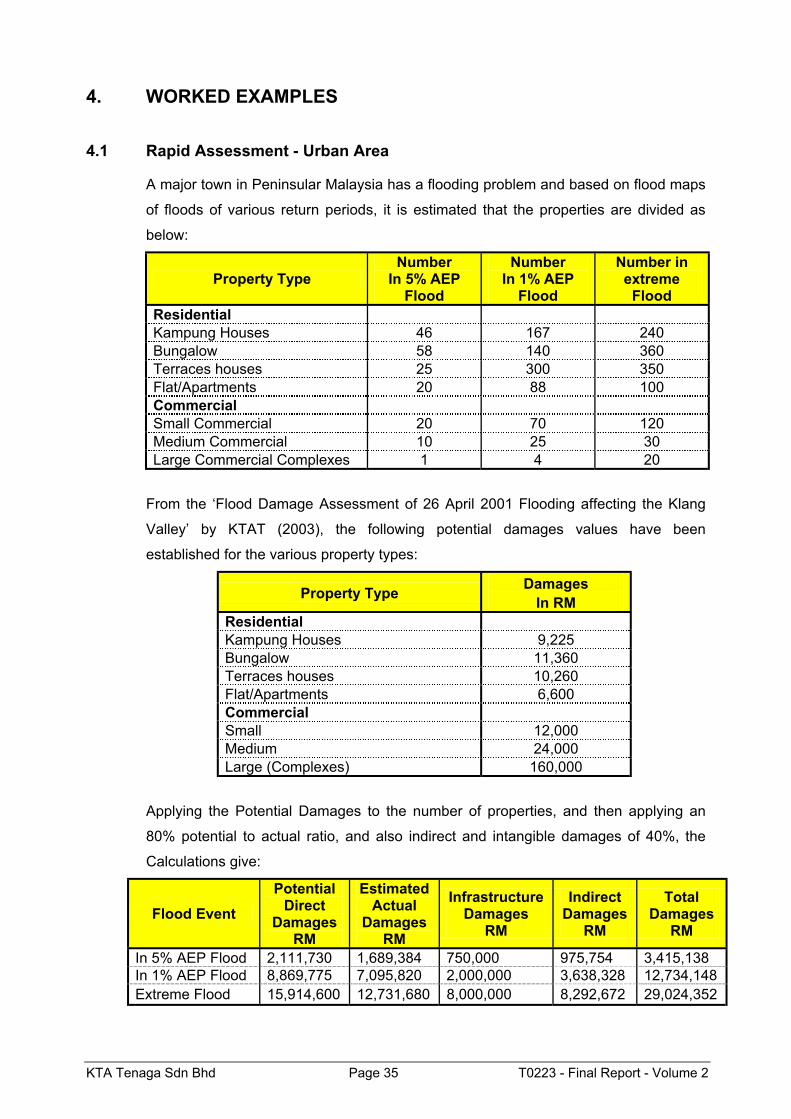
4. WORKED EXAMPLES
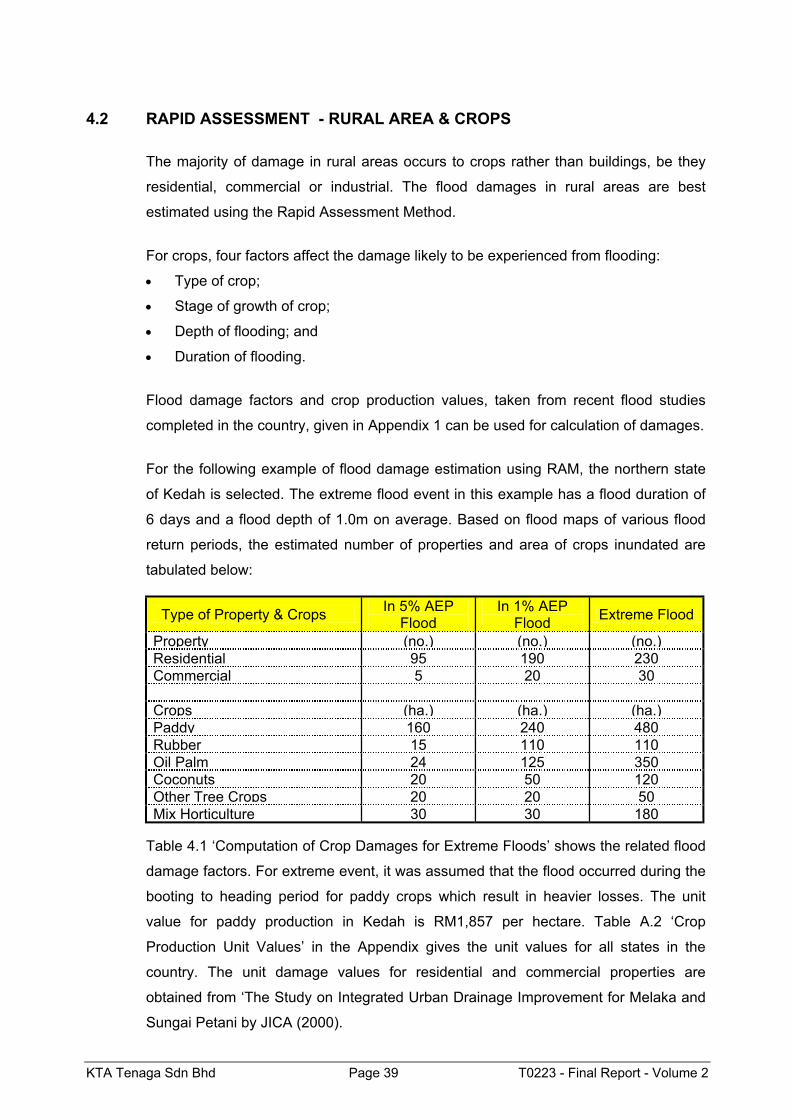
4.1 Rapid Assessment - Urban Area
A major town in Peninsular Malaysia has a flooding problem and based on flood maps
of floods of various return periods, it is estimated that the properties are divided as
below:
Property Type Number
In 5% AEP Flood
Number In 1% AEP
Flood
Number in extreme
Flood Residential Kampung Houses 46 167 240 Bungalow 58 140 360 Terraces houses 25 300 350 Flat/Apartments 20 88 100 Commercial Small Commercial 20 70 120 Medium Commercial 10 25 30 Large Commercial Complexes 1 4 20
From the ‘Flood Damage Assessment of 26 April 2001 Flooding affecting the Klang
Valley’ by KTAT (2003), the following potential damages values have been
established for the various property types:
Property Type Damages In RM
Residential Kampung Houses 9,225 Bungalow 11,360 Terraces houses 10,260 Flat/Apartments 6,600 Commercial Small 12,000 Medium 24,000 Large (Complexes) 160,000
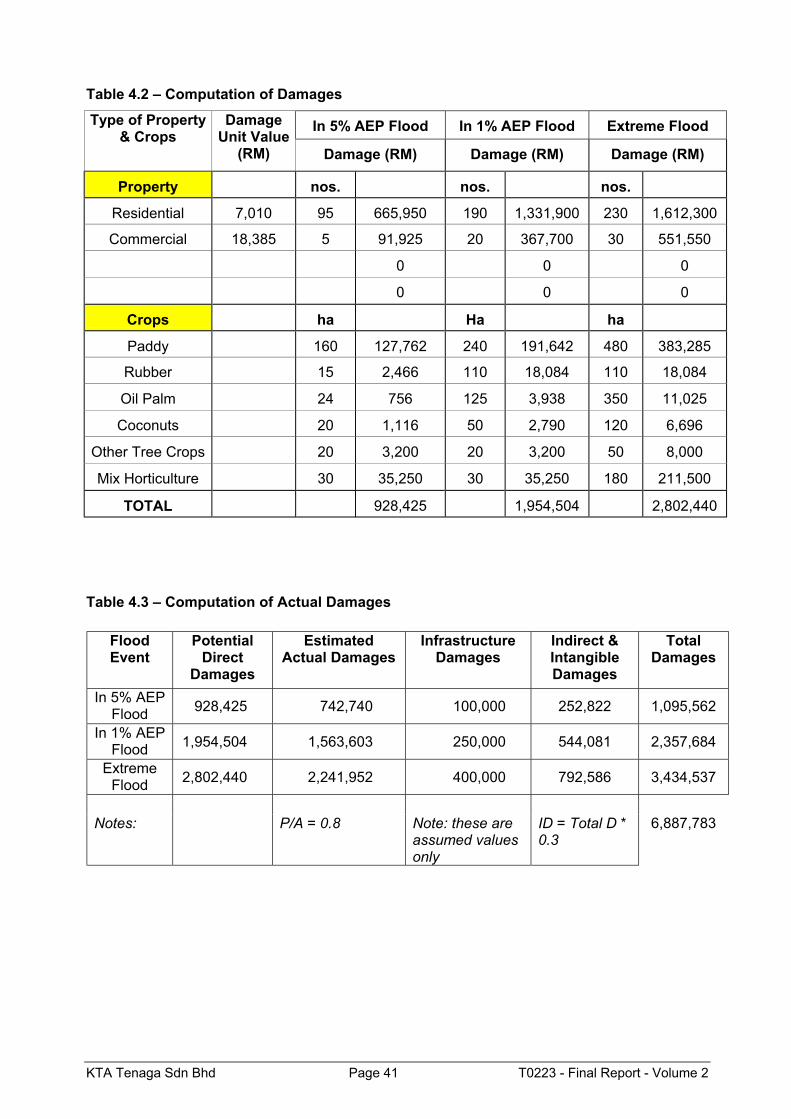
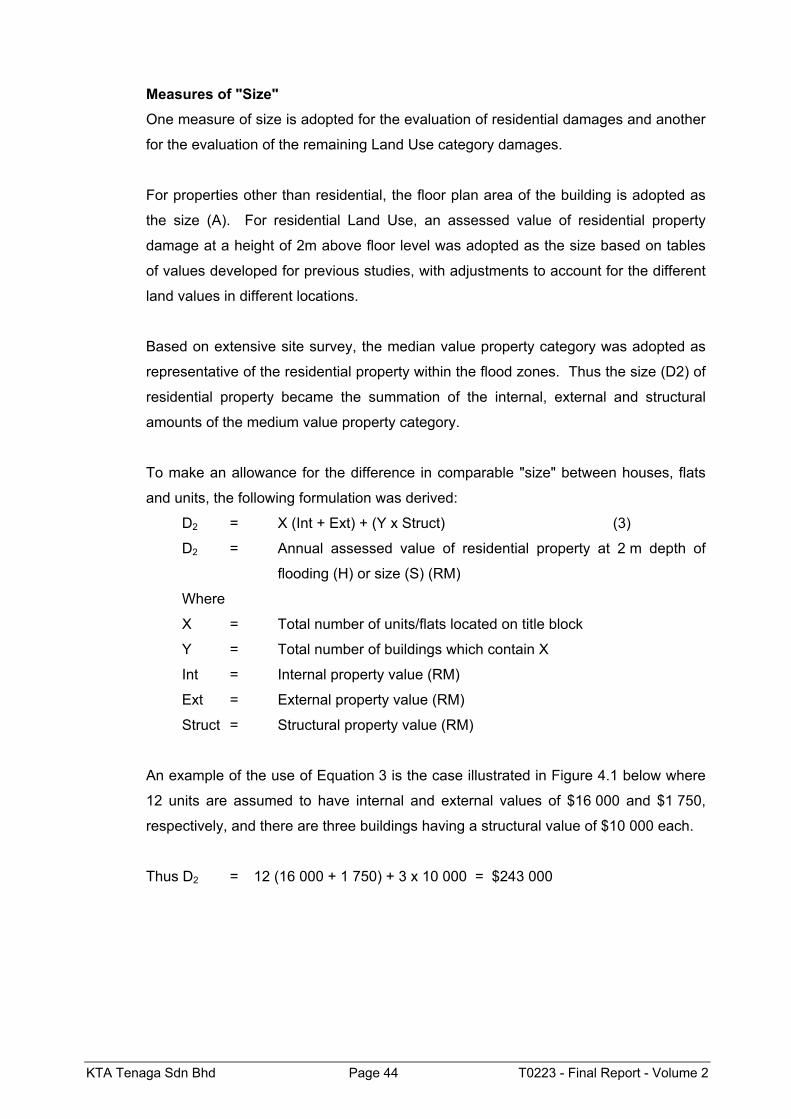
Applying the Potential Damages to the number of properties, and then applying an
80% potential to actual ratio, and also indirect and intangible damages of 40%, the
KTA Tenaga Sdn Bhd Page 44 T0223 - Final Report - Volume 2
FIGURE 4.1 - Illustration of Building Count
Flood Level Interpolation A hydraulic model of a floodplain only provides estimates of flood levels at specific
cross sections along the river being modelled. Intermediate flood levels are therefore
computed by interpolation, based on chainage.
Reduction Factor due to Flood Warning The reduction factors or actual damage factors were determined from a review of
previous studies. This factor is, as discussed above, the result of consideration of a
number of factors, principally flood warning and the awareness of the community to
measures to reduce flood damages. In some cases, where warning is very short, it is
conservative to adopt a very low reduction factor to reflect the time it takes to mobilise
the community to take suitable measures. In other cases, where there is a long
warning time, the reduction factor could be as high as 90%.
Indirect Potential Damages The indirect potential damages are usually expressed as a percentage of direct
damages, again based on previous studies and accounting for conditions in the area
in question. For residential properties, where clean-up costs were calculated as a
KTA Tenaga Sdn Bhd Page 45 T0223 - Final Report - Volume 2
separate item, a factor of 20% may be allowed for the indirect potential costs. For
commercial properties a factor of 25% or more is usually adopted. This factor
includes the clean-up costs.
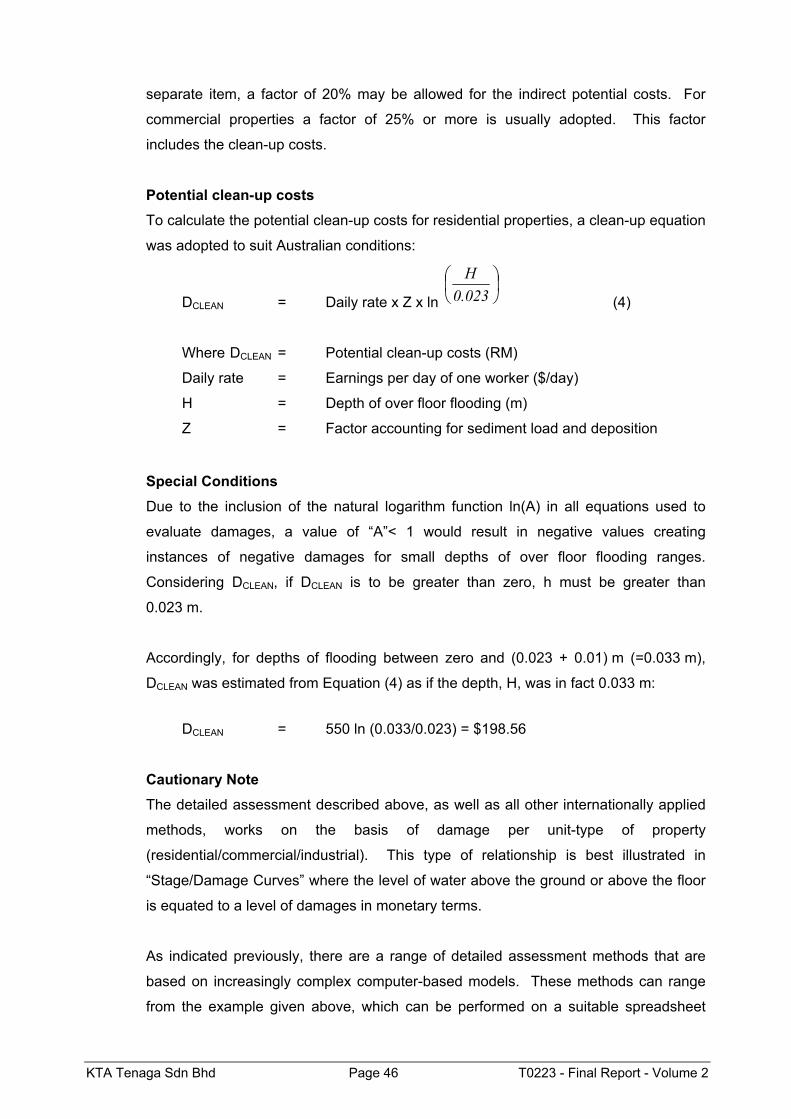
Potential clean-up costs To calculate the potential clean-up costs for residential properties, a clean-up equation
was adopted to suit Australian conditions:
DCLEAN = Daily rate x Z x ln
0.023H
(4)
Where DCLEAN = Potential clean-up costs (RM)
Daily rate = Earnings per day of one worker ($/day)
H = Depth of over floor flooding (m)
Z = Factor accounting for sediment load and deposition
Special Conditions Due to the inclusion of the natural logarithm function ln(A) in all equations used to
evaluate damages, a value of “A”< 1 would result in negative values creating
instances of negative damages for small depths of over floor flooding ranges.
Considering DCLEAN, if DCLEAN is to be greater than zero, h must be greater than
0.023 m.
Accordingly, for depths of flooding between zero and (0.023 + 0.01) m (=0.033 m),
DCLEAN was estimated from Equation (4) as if the depth, H, was in fact 0.033 m:
DCLEAN = 550 ln (0.033/0.023) = $198.56
Cautionary Note The detailed assessment described above, as well as all other internationally applied
methods, works on the basis of damage per unit-type of property
(residential/commercial/industrial). This type of relationship is best illustrated in
“Stage/Damage Curves” where the level of water above the ground or above the floor
is equated to a level of damages in monetary terms.
As indicated previously, there are a range of detailed assessment methods that are
based on increasingly complex computer-based models. These methods can range
from the example given above, which can be performed on a suitable spreadsheet
KTA Tenaga Sdn Bhd Page 46 T0223 - Final Report - Volume 2
(Microsoft Excel or Access) to GIS supported models such as ANUFLOOD or
FloodEcon. While these methodologies can be applied to Malaysian situations, they cannot be directly applied as their built-in Stage/Damage relationships reflect their country of origin, thereby placing a significant bias in damage values.
As more detailed damages studies are undertaken, it is essential that the resulting
data is centrally pooled, co-ordinated and collated so that an overall picture of
damages and stage/damage relationships can be developed for Malaysia, or even
within States in Malaysia.
KTA Tenaga Sdn Bhd Page 47 T0223 - Final Report - Volume 2
KTA Tenaga Sdn Bhd Page 48 T0223 - Final Report - Volume 2
5. REFERENCES
Abrahams, M.J., Price J., Whitlock, F.A. & Williams, G., 1976 “The Brisbane Floods, January 1974: Their Impact on Health”. Medical Journal of
Australia 2: 936-39.
American Red Cross and the Federal Emergency Management Agency, 1992 Helping Children Cope with Disaster
AWRC, 1992 “Floodplain Management in Australia”, (2 Volumes), Australia Water Resources
Council, Water Management Services, Report No. 21, 1992.
Bennett, G., 1970 “Bristol Floods 1968, Controlled Survey of Effects on Health of Local Community
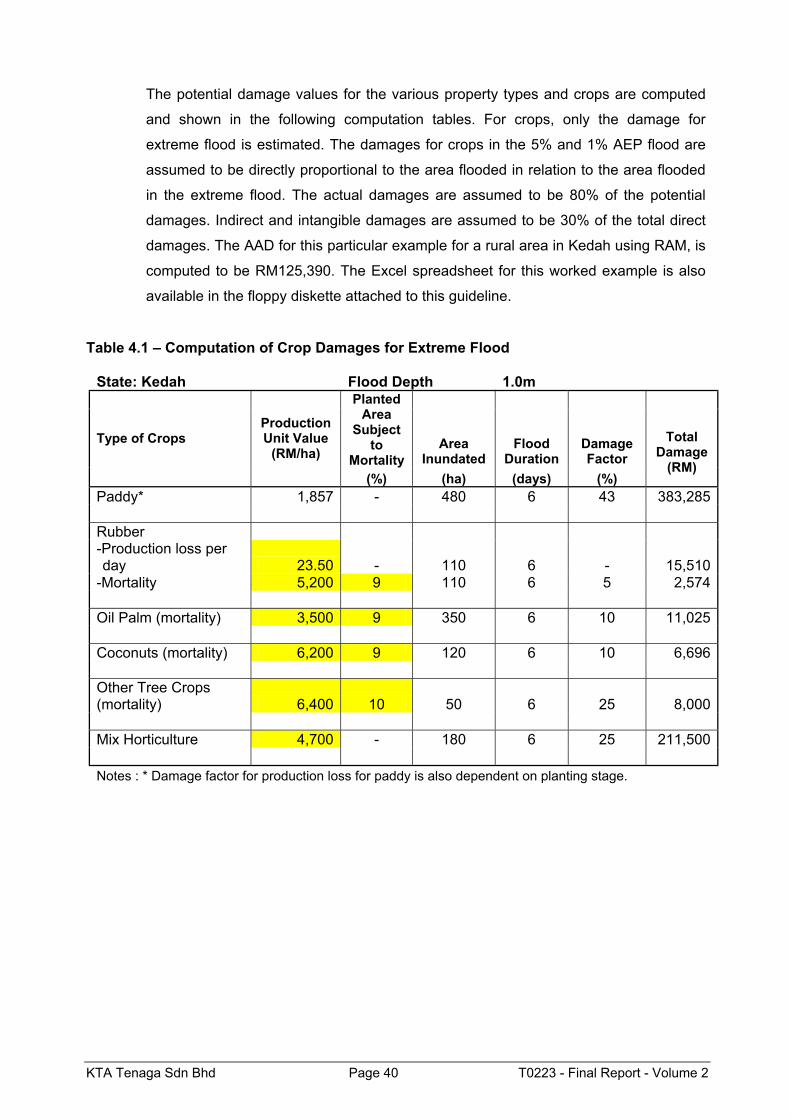
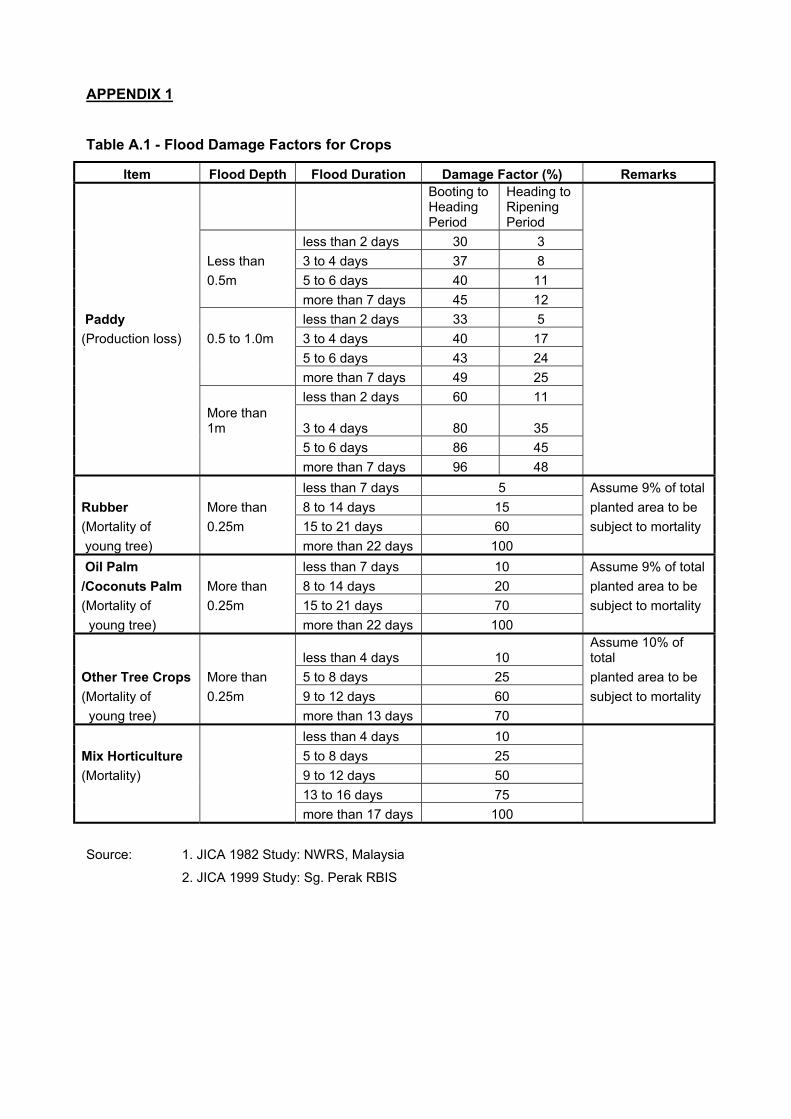
less than 2 days 30 3 Less than 3 to 4 days 37 8 0.5m 5 to 6 days 40 11 more than 7 days 45 12 Paddy less than 2 days 33 5 (Production loss) 0.5 to 1.0m 3 to 4 days 40 17 5 to 6 days 43 24 more than 7 days 49 25 less than 2 days 60 11
More than 1m 3 to 4 days 80 35
5 to 6 days 86 45 more than 7 days 96 48 less than 7 days 5 Assume 9% of total Rubber More than 8 to 14 days 15 planted area to be (Mortality of 0.25m 15 to 21 days 60 subject to mortality young tree) more than 22 days 100 Oil Palm less than 7 days 10 Assume 9% of total /Coconuts Palm More than 8 to 14 days 20 planted area to be (Mortality of 0.25m 15 to 21 days 70 subject to mortality young tree) more than 22 days 100
less than 4 days 10 Assume 10% of total
Other Tree Crops More than 5 to 8 days 25 planted area to be (Mortality of 0.25m 9 to 12 days 60 subject to mortality young tree) more than 13 days 70 less than 4 days 10 Mix Horticulture 5 to 8 days 25 (Mortality) 9 to 12 days 50 13 to 16 days 75 more than 17 days 100
Source: 1. JICA 1982 Study: NWRS, Malaysia
2. JICA 1999 Study: Sg. Perak RBIS
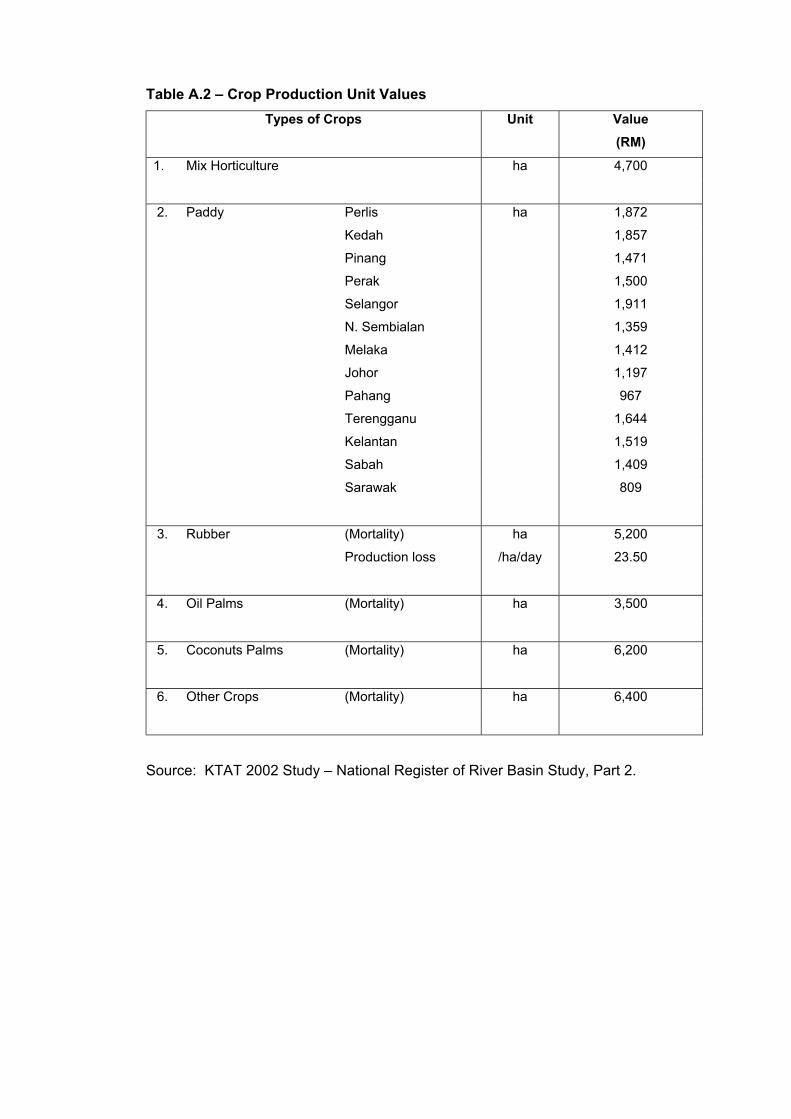
Table A.2 – Crop Production Unit Values Types of Crops Unit Value
(RM) 1. Mix Horticulture ha 4,700
2. Paddy Perlis ha 1,872
Kedah 1,857
Pinang 1,471
Perak 1,500
Selangor 1,911
N. Sembialan 1,359
Melaka 1,412
Johor 1,197
Pahang 967
Terengganu 1,644
Kelantan 1,519
Sabah 1,409
Sarawak 809
3. Rubber (Mortality) ha 5,200
Production loss /ha/day 23.50
4. Oil Palms (Mortality) ha 3,500
5. Coconuts Palms (Mortality) ha 6,200
6. Other Crops (Mortality) ha 6,400
Source: KTAT 2002 Study – National Register of River Basin Study, Part 2.
APPENDIX 1
• Table A.1 : Flood Damage Factors for Crops
• Table A.2 : Crop Production Unit Values
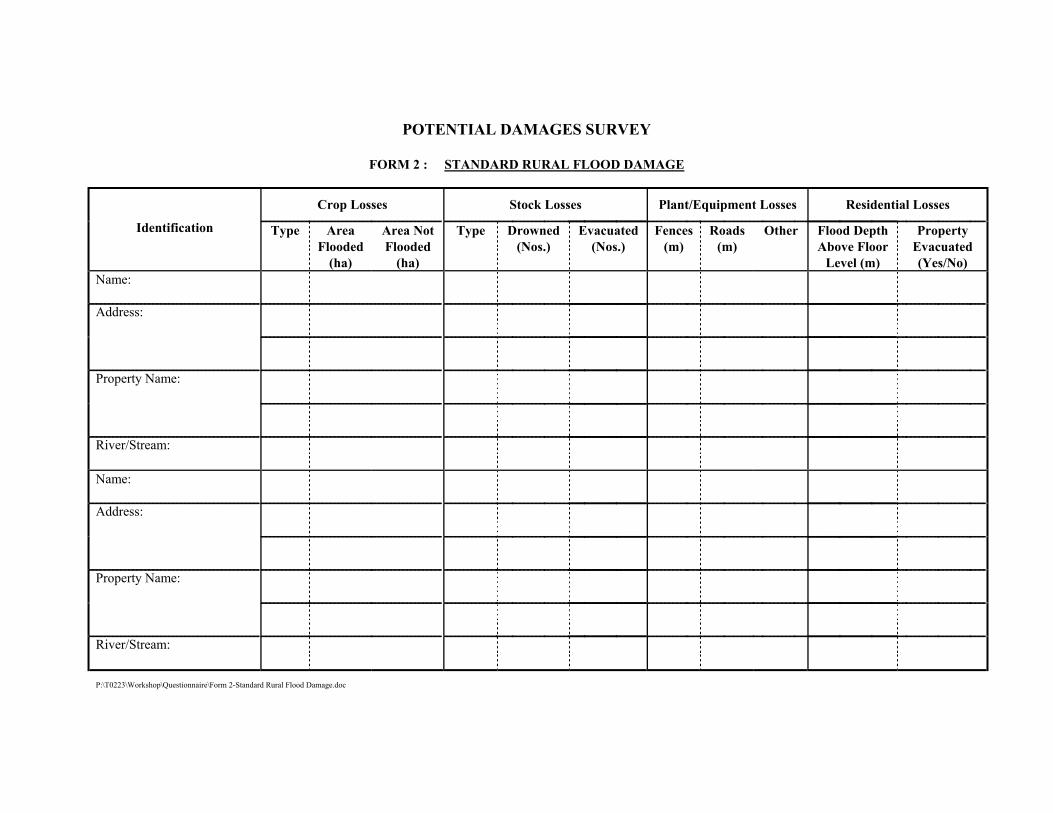
APPENDIX 2
POTENTIAL DAMAGES SURVEY FORMS
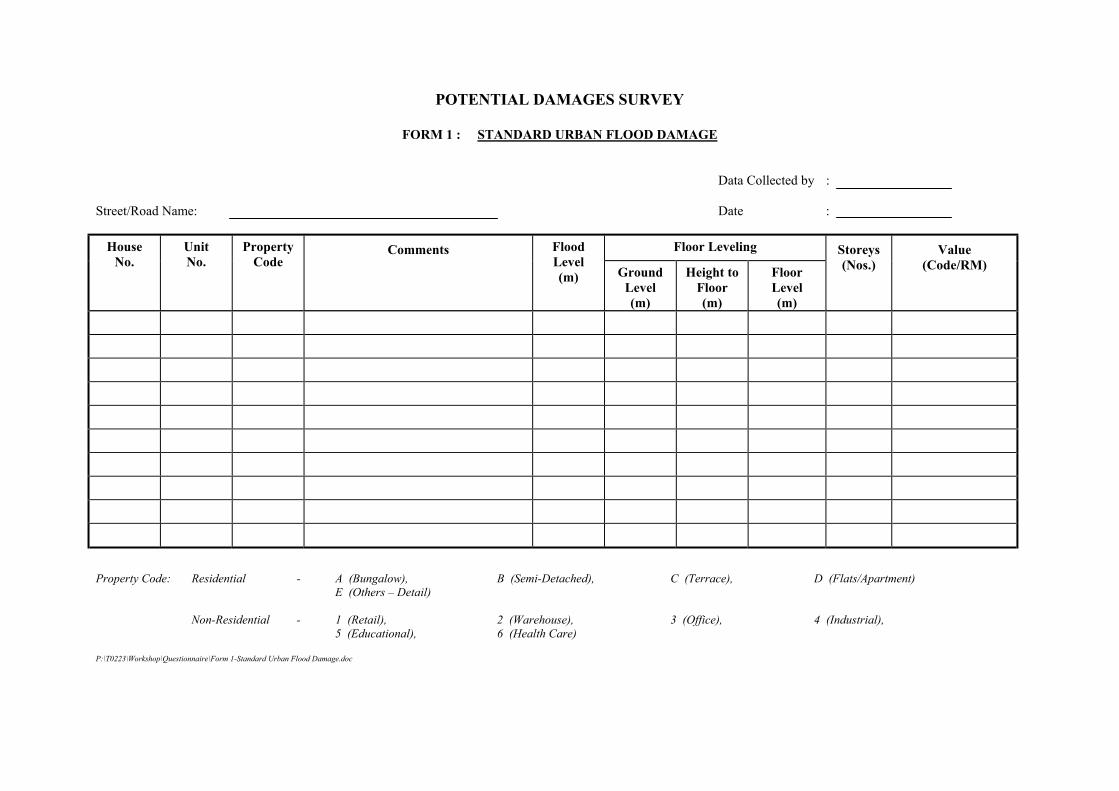
• Form 1 : Standard Urban Flood Damage
• Form 2 : Standard Rural Flood Damage
POTENTIAL DAMAGES SURVEY
FORM 1 : STANDARD URBAN FLOOD DAMAGE Data Collected by : Street/Road Name: Date :
Floor Leveling
House No.
Unit No.
Property Code
Comments
Flood Level (m)
Ground Level (m)
Height to Floor (m)
Floor Level (m)
Storeys (Nos.)
Value (Code/RM)
Property Code: Residential - A (Bungalow), B (Semi-Detached), C (Terrace), D (Flats/Apartment) E (Others – Detail) Non-Residential - 1 (Retail), 2 (Warehouse), 3 (Office), 4 (Industrial), 5 (Educational), 6 (Health Care) P:\T0223\Workshop\Questionnaire\Form 1-Standard Urban Flood Damage.doc
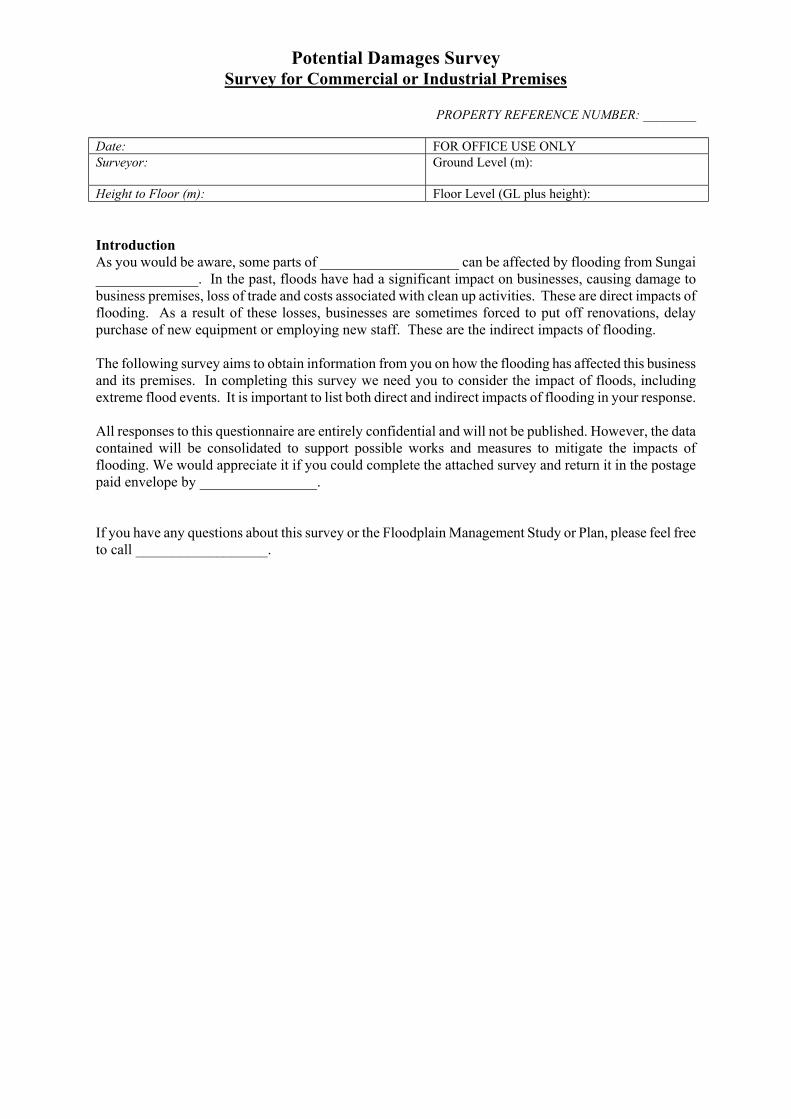
Potential Damages Survey Survey for Commercial or Industrial Premises
PROPERTY REFERENCE NUMBER: ________
Date: FOR OFFICE USE ONLY Surveyor:
Ground Level (m):
Height to Floor (m): Floor Level (GL plus height): Introduction As you would be aware, some parts of ___________________ can be affected by flooding from Sungai ______________. In the past, floods have had a significant impact on businesses, causing damage to business premises, loss of trade and costs associated with clean up activities. These are direct impacts of flooding. As a result of these losses, businesses are sometimes forced to put off renovations, delay purchase of new equipment or employing new staff. These are the indirect impacts of flooding. The following survey aims to obtain information from you on how the flooding has affected this business and its premises. In completing this survey we need you to consider the impact of floods, including extreme flood events. It is important to list both direct and indirect impacts of flooding in your response. All responses to this questionnaire are entirely confidential and will not be published. However, the data contained will be consolidated to support possible works and measures to mitigate the impacts of flooding. We would appreciate it if you could complete the attached survey and return it in the postage paid envelope by ________________. If you have any questions about this survey or the Floodplain Management Study or Plan, please feel free to call __________________.
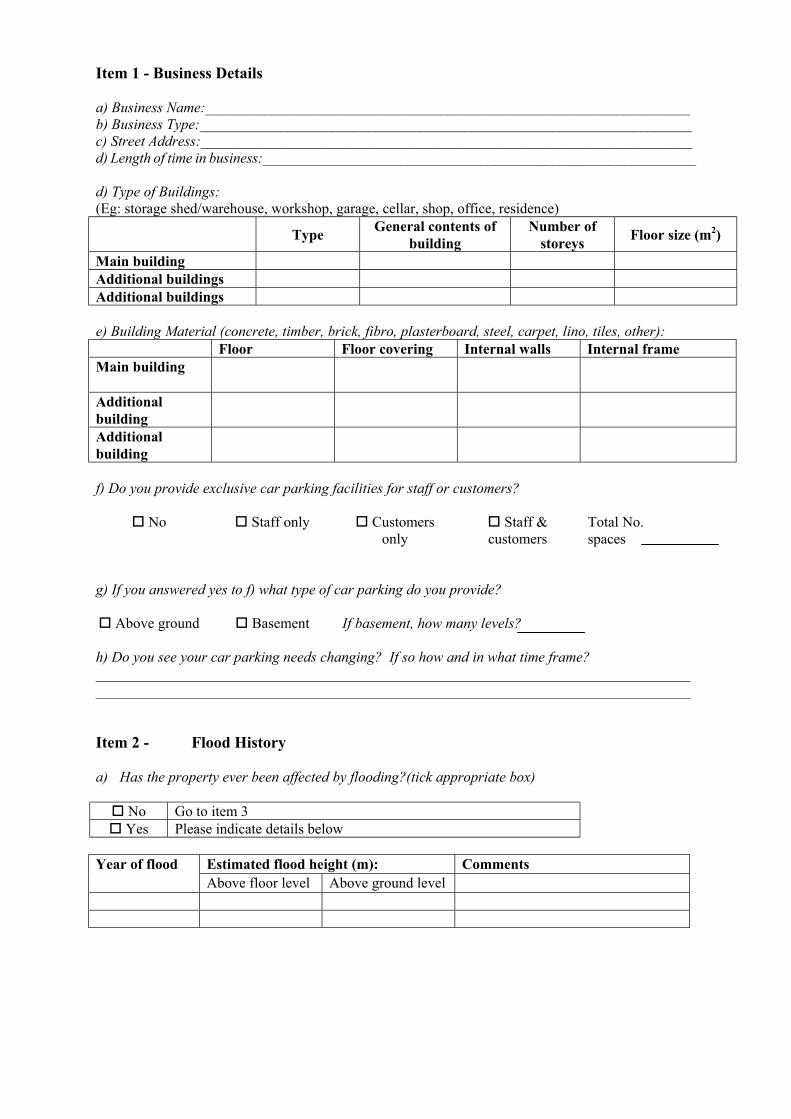
Item 1 - Business Details a) Business Name:__________________________________________________________________ b) Business Type:___________________________________________________________________ c) Street Address:___________________________________________________________________ d) Length of time in business:____________________________________________________________ d) Type of Buildings: (Eg: storage shed/warehouse, workshop, garage, cellar, shop, office, residence) Type General contents of
building Number of
storeys Floor size (m2)
Main building Additional buildings Additional buildings e) Building Material (concrete, timber, brick, fibro, plasterboard, steel, carpet, lino, tiles, other): Floor Floor covering Internal walls Internal frame Main building
Additional building
Additional building
f) Do you provide exclusive car parking facilities for staff or customers?
No Staff only Customers only
Staff & customers
Total No. spaces
g) If you answered yes to f) what type of car parking do you provide?
Above ground Basement If basement, how many levels? h) Do you see your car parking needs changing? If so how and in what time frame? __________________________________________________________________________________________________________________________________________________________________ Item 2 - Flood History a) Has the property ever been affected by flooding?(tick appropriate box)
No Go to item 3 Yes Please indicate details below
Estimated flood height (m): Comments Year of flood Above floor level Above ground level
b) Please indicate the damage that was caused to merchandise or stock; fittings, fixtures or equipment; foundations or walls.
Damaged Items Description of item Was the
item raised? How high
(m)?
Was the item damaged and
repairable (R) or destroyed (D)?
Repair or replacement
cost
Stock
Fittings (eg doors,
shelves, cupboards) Fixtures (eg floor
coverings, painting) Wiring and cabling
(eg telecom) Equipment (eg
machinery,furniture)
Electrical Equipment (eg photocopiers, computers)
Foundations (eg settlement or slabs lifting)
Internal walls (eg collapse or warping of walls) Other Comments or additional information _____________________________________________ ______________________________________________________________________________________________________________________________________________________ c) Have you ever received customer complaints about flood related incidents?
No Yes If yes, please comment:_________________________________________________________________ __________________________________________________________________________________ __________________________________________________________________________________ d) How much business was lost as a result of past flood events? (Including the actual flood and time cleaning up) Year of flood: ___________
During the flood Business closure time (days): Estimated turnover loss per day ($): If business remained open, did you suffer reduced turnover? If yes, what was the estimated percentage reduction in daily turnover? For how long was turnover reduced (days)? After the flood Clean-up time (days): Was the business closed during clean up? If business remained open, did you suffer reduced turnover? If yes, what was the estimated percentage reduction in daily turnover? For how long was turnover reduced (days)? Comments or additional information:___________________________________________________ ________________________________________________________________________________ ________________________________________________________________________________ Item 3 - Potential loss of goods
a) In the event of a flood (if never experienced flooding) or in a larger flood than previously experienced, please identify your potential loss in each of the following categories (ie. Total amount of goods, fixtures and equipment subject to inundation)- consider 0.01m, 0.5m and 1m depths:
Item that could be damaged by
flooding
Description of item
Height of item above floor level
(m)
Is the item raiseable?
Y/N
Would the item be damaged and repairable (R)
or need replacing (D)?
Repair or replacement
cost
Stock
Fittings (eg doors,
shelves, cupboards) Fixtures (eg floor
coverings, painting)
Wiring and cabling Equipment (eg
machinery, motors, furniture)
Electrical Equipment (eg: computers)
Note: Previous available information will be used to estimate damages for structures, internal walls and clean up. b) Could all raiseable items be moved out of rising floodwaters if you had prior notification? (approximately 30mins maximum)
Yes No Comments or additional information: _________________________________________________________________________________ _________________________________________________________________________________
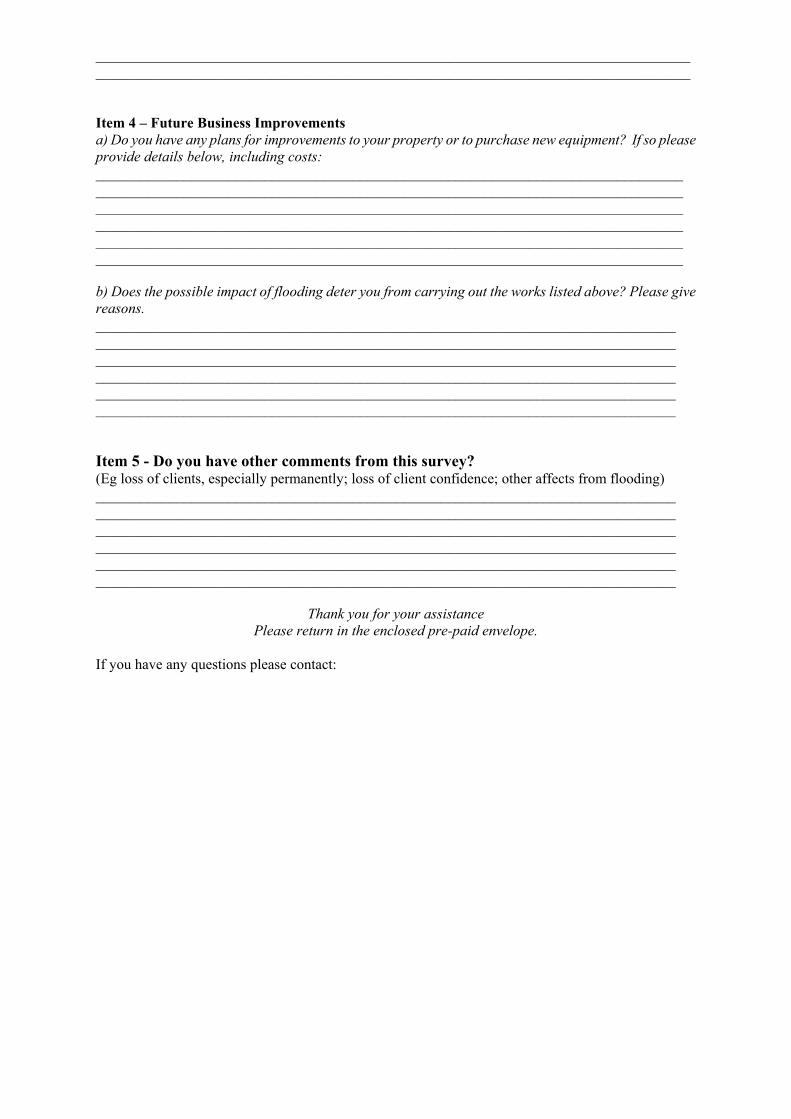
_________________________________________________________________________________ _________________________________________________________________________________ Item 4 – Future Business Improvements a) Do you have any plans for improvements to your property or to purchase new equipment? If so please provide details below, including costs: ________________________________________________________________________________ ________________________________________________________________________________ ________________________________________________________________________________ ________________________________________________________________________________ ________________________________________________________________________________ ________________________________________________________________________________ b) Does the possible impact of flooding deter you from carrying out the works listed above? Please give reasons. _______________________________________________________________________________ _______________________________________________________________________________ _______________________________________________________________________________ _______________________________________________________________________________ _______________________________________________________________________________ _______________________________________________________________________________ Item 5 - Do you have other comments from this survey? (Eg loss of clients, especially permanently; loss of client confidence; other affects from flooding) _______________________________________________________________________________ _______________________________________________________________________________ _______________________________________________________________________________ _______________________________________________________________________________ _______________________________________________________________________________ _______________________________________________________________________________
Thank you for your assistance Please return in the enclosed pre-paid envelope.
If you have any questions please contact:
APPENDIX 4
ACTUAL DAMAGES SURVEY QUESTIONNAIRE
ACTUAL DAMAGES SURVEY
Flood Damage Questionnaire Introduction The recent storm event and associated flooding created significant and widespread damage and disruption. It is essential to collect as much data as possible on the storm event and associated flooding. Your assistance is sought and will be appreciated. Three (3) questionnaires are attached. The first questionnaire covers Flood Data while the second and third cover Residential Flood Damage and Commercial/Industrial Flood Damage. We are asking your help by: 1) Completing Questionnaire 1 on Flood Data. 2) Completing and attaching Questionnaire 2 if your property is a Residence or Completing
and attaching Questionnaire 3 if your property is Commercial or Industrial. 3) Posting the completed questionnaires in the postage paid envelope. The data collected from the Flood Data Questionnaire will be used to complete our understanding of the recent flood. Information on damage and other data provided by the Residential Damage and Commercial Damage questionnaires will be collated and combined into group information such as flood depth compared to flood damage. The data provided on your questionnaires is Confidential and will only be used by the authorities and their consultants in assessment of the flood and its consequences. The data will not be released to any other parties or bodies without your permission. We are very aware of the significant damage, disruption and personal hardship that the recent storm event and associated flooding has caused. Your assistance in provision of the completed questionnaires will greatly help in developing ways to deal with similar events in the future.
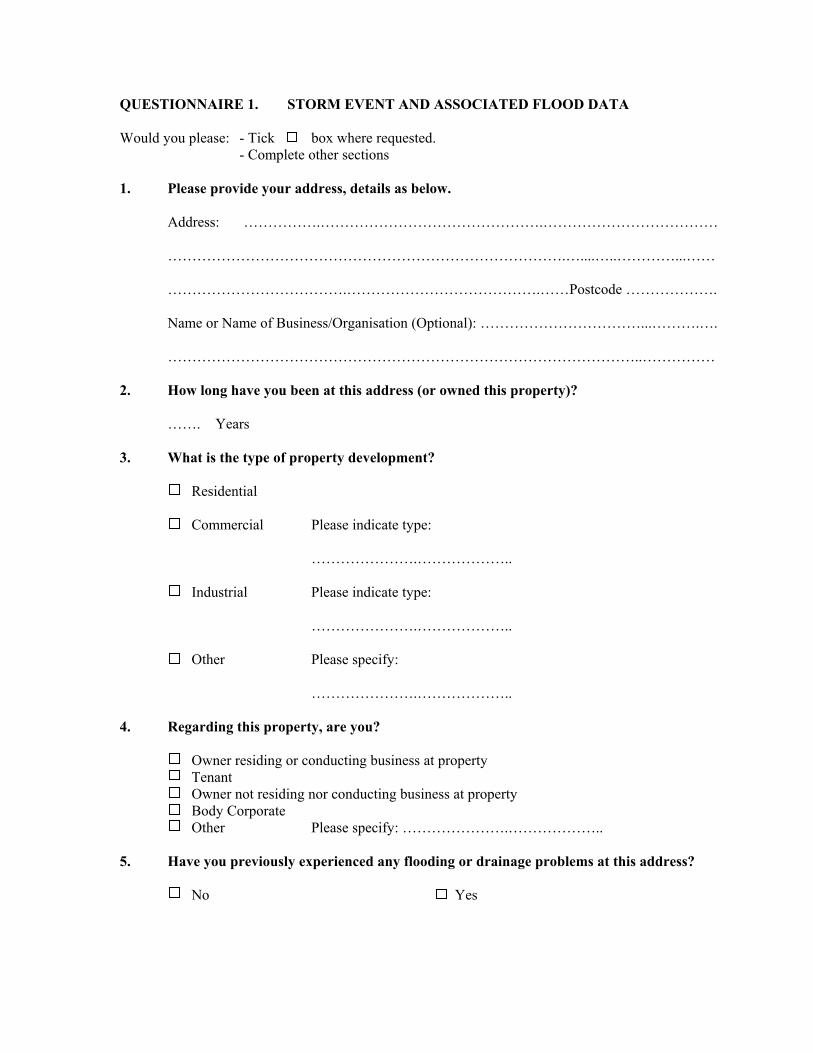
QUESTIONNAIRE 1. STORM EVENT AND ASSOCIATED FLOOD DATA Would you please: - Tick box where requested. - Complete other sections
1. Please provide your address, details as below.
Address: …………….……………………………………….………………………………
……………………………………………………………………….…....…..…………...……
……………………………….………………………………….……Postcode ……………….
Name or Name of Business/Organisation (Optional): ……………………………...……….….
……………………………………………………………………………………..……………
2. How long have you been at this address (or owned this property)?
……. Years
3. What is the type of property development?
Residential
Commercial Please indicate type:
………………….………………..
Industrial Please indicate type:
………………….………………..
Other Please specify:
………………….………………..
4. Regarding this property, are you?
Owner residing or conducting business at property Tenant Owner not residing nor conducting business at property Body Corporate Other Please specify: ………………….………………..
5. Have you previously experienced any flooding or drainage problems at this address? No Yes
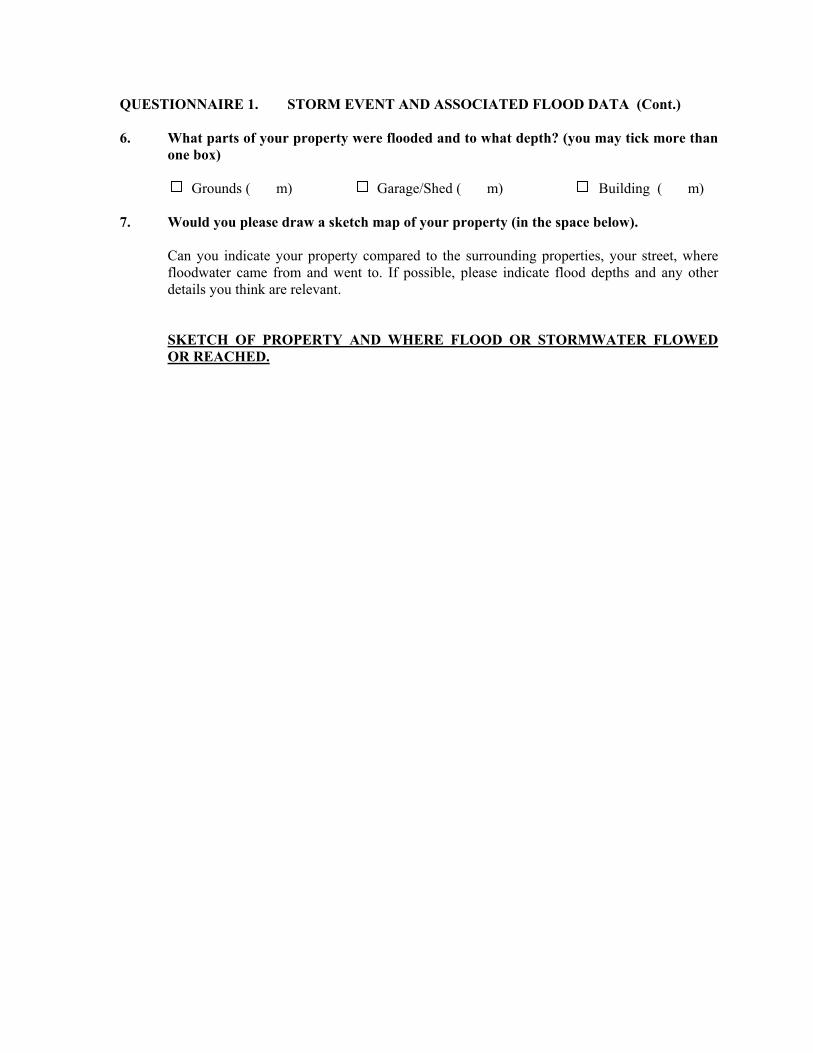
QUESTIONNAIRE 1. STORM EVENT AND ASSOCIATED FLOOD DATA (Cont.) 6. What parts of your property were flooded and to what depth? (you may tick more than
one box)
Grounds ( m) Garage/Shed ( m) Building ( m) 7. Would you please draw a sketch map of your property (in the space below). Can you indicate your property compared to the surrounding properties, your street, where
floodwater came from and went to. If possible, please indicate flood depths and any other details you think are relevant.
SKETCH OF PROPERTY AND WHERE FLOOD OR STORMWATER FLOWED OR REACHED.
QUESTIONNAIRE 1. STORM EVENT AND ASSOCIATED FLOOD DATA (Cont.) 8. Do you have any suggestions for resolving the flooding or drainage problems in your
area? ……………...…………………………………………………………...………………………
………………...…...……………………………………………………………………………
9. Do you have any photographs, video or other information about flooding in your area
which you would be prepared to make available?
No Yes 10. Do you have any information which would help us identify water levels at particular
times through the recent flood?
No Yes 11. If you have relevant information (you have answered yes in Question 9 and 10) or if you
have other information which you think would be relevant, please provide your telephone number below so that we may contact you.
Phone: ………………………………… (Ask for )
Best time to call is: ……………………………………………… 12. Please post this questionnaire with your Damage Questionnaire. (Note: no stamp required for the attached reply paid envelope) If you would like this questionnaire to be collected, please contact: Telephone: Fax: E-mail:
Thank you for your assistance.
QUESTIONNAIRE 2. HOUSE DAMAGE SURVEY 1. Age of Building …….. (Years) 2. Building Materials External Walls Brick Cladding Timber Other (Please specify) …………………….. Internal Walls Brick Gypsum Timber Other (Please specify) …………………….. 3. Building Form Storeys One Two Three or More Bedrooms One Two Three More 4. Damages Damage to the building
Area Description of Damage Estimated cost
Foundations
External Walls
Internal Walls
Floors
Doors/Windows
Built-Ins
Other Damage outside the building
Damaged items Estimated cost Garage/workshop, including equipment stored inside
Motor Vehicle Storage, including equipment stored inside
Gardens
Other
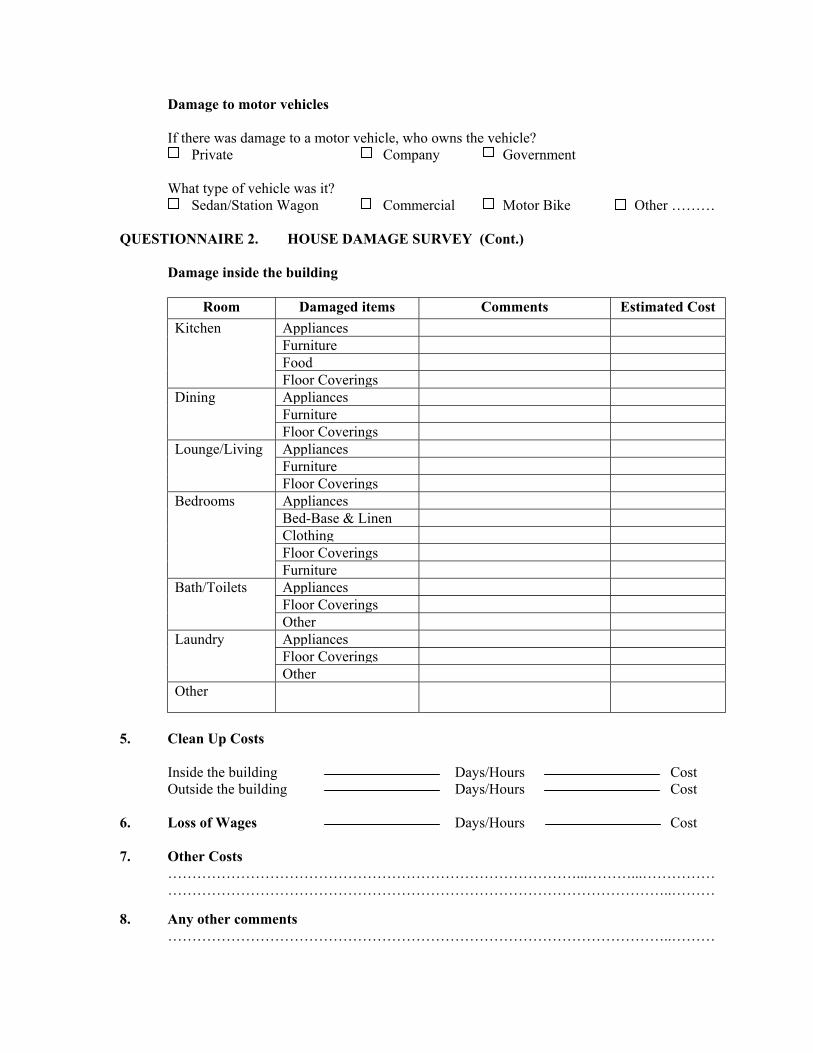
Fences
Damage to motor vehicles If there was damage to a motor vehicle, who owns the vehicle? Private Company Government What type of vehicle was it? Sedan/Station Wagon Commercial Motor Bike Other ……… QUESTIONNAIRE 2. HOUSE DAMAGE SURVEY (Cont.) Damage inside the building
5. Clean Up Costs Inside the building Days/Hours Cost Outside the building Days/Hours Cost 6. Loss of Wages Days/Hours Cost 7. Other Costs …………………………………………………………………………...………...……………
…………………………………………………………………………………………..……… 8. Any other comments …………………………………………………………………………………………..………
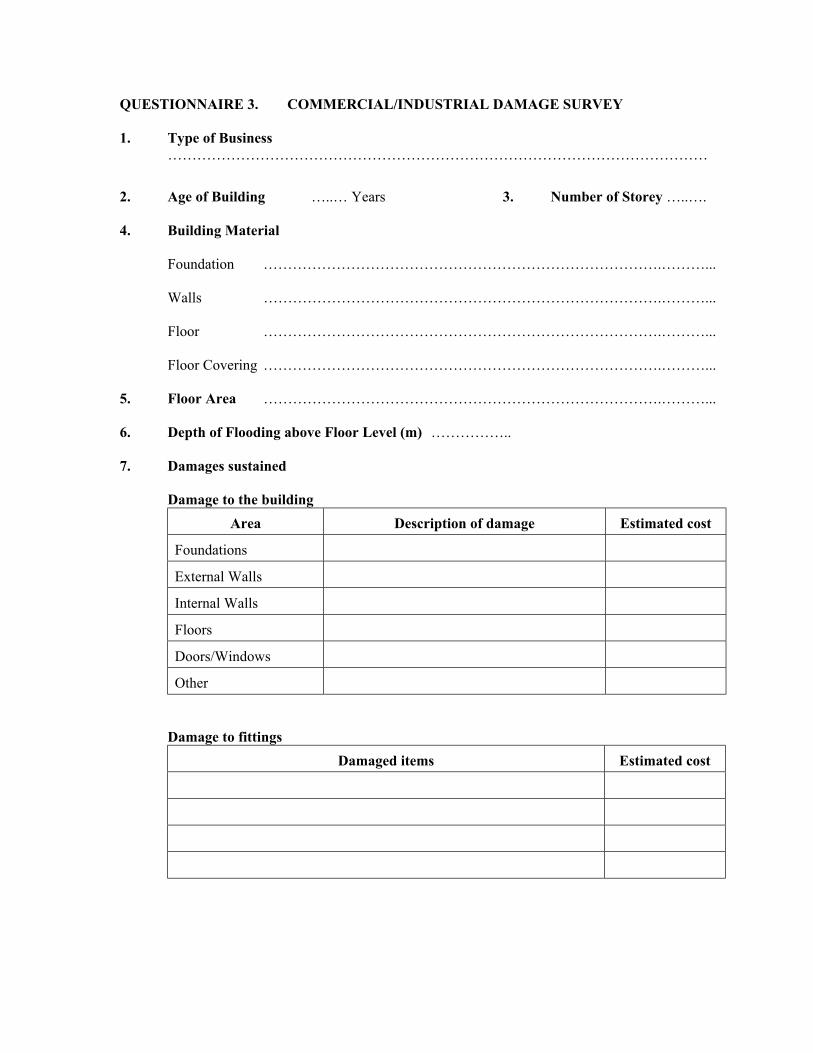
QUESTIONNAIRE 3. COMMERCIAL/INDUSTRIAL DAMAGE SURVEY 1. Type of Business
…………………………………………………………………………………………………
2. Age of Building …..… Years 3. Number of Storey …..…. 4. Building Material Foundation ……………………………………………………………………….………... Walls ……………………………………………………………………….………... Floor ……………………………………………………………………….………... Floor Covering ……………………………………………………………………….………... 5. Floor Area ……………………………………………………………………….………... 6. Depth of Flooding above Floor Level (m) …………….. 7. Damages sustained Damage to the building
Area Description of damage Estimated cost
Foundations
External Walls
Internal Walls
Floors
Doors/Windows
Other Damage to fittings
Damaged items Estimated cost
QUESTIONNAIRE 3. COMMERCIAL/INDUSTRIAL DAMAGE SURVEY (Cont.) Damage to stock
Damaged items Estimated cost
Damage outside the building
Damaged items Estimated cost
Stores
Vehicles
Other 8. Clean Up Costs
Time (man hours) : ………………………………………………………………………...
Salaries and Wages : ………………………………………………………………………...
Materials : ………………………………………………………………………...
9. Lost Trading
Disruption Time : ……………………….…… days …………………………... hours